Article

A Unified User-Friendly Instrument Control and Data Acquisition System for the ORNL SANS Instrument Suite

by
Xingxing Yao
,
Blake Avery
,
Miljko Bobrek
,
Lisa Debeer-Schmitt
,
Xiaosong Geng
,
Ray Gregory
,
Greg Guyotte
,
Mike Harrington
,
Steven Hartman
,
Lilin He
,
Luke Heroux
,
Kay Kasemir
,
Rob Knudson
,
James Kohl
,
Carl Lionberger
,
Kenneth Littrell
,
Matthew Pearson
,
Sai Venkatesh Pingali
,
Cody Pratt
,
Shuo Qian
*,
Mariano Ruiz-Rodriguez
,
Vladislav Sedov
,
Gary Taufer
,
Volker Urban
and
Klemen Vodopivec
add Show full author list remove Hide full author list
Oak Ridge National Laboratory, Oak Ridge, TN 37830, USA
*
Author to whom correspondence should be addressed.
Appl. Sci. 2021, 11(3), 1216; https://doi.org/10.3390/app11031216
Submission received: 4 January 2021 / Revised: 22 January 2021 / Accepted: 25 January 2021 / Published: 28 January 2021
(This article belongs to the Special Issue Recent Advances in Small-Angle Neutron Scattering)

Abstract

:
In an effort to upgrade and provide a unified and improved instrument control and data acquisition system for the Oak Ridge National Laboratory (ORNL) small-angle neutron scattering (SANS) instrument suite—biological small-angle neutron scattering instrument (Bio-SANS), the extended q-range small-angle neutron scattering diffractometer (EQ-SANS), the general-purpose small-angle neutron scattering diffractometer (GP-SANS)—beamline scientists and developers teamed up and worked closely together to design and develop a new system. We began with an in-depth analysis of user needs and requirements, covering all perspectives of control and data acquisition based on previous usage data and user feedback. Our design and implementation were guided by the principles from the latest user experience and design research and based on effective practices from our previous projects. In this article, we share details of our design process as well as prominent features of the new instrument control and data acquisition system. The new system provides a sophisticated Q-Range Planner to help scientists and users plan and execute instrument configurations easily and efficiently. The system also provides different user operation interfaces, such as wizard-type tool Panel Scan, a Scripting Tool based on Python Language, and Table Scan, all of which are tailored to different user needs. The new system further captures all the metadata to enable post-experiment data reduction and possibly automatic reduction and provides users with enhanced live displays and additional feedback at the run time. We hope our results will serve as a good example for developing a user-friendly instrument control and data acquisition system at large user facilities.

1. Introduction

Small-angle neutron scattering (SANS) is a powerful technique to resolve structures from a few to hundreds of nanometers in a wide range of materials. The SANS instrument suite at the Oak Ridge National Laboratory (ORNL) neutron scattering facilities—including the biological small-angle neutron scattering instrument (Bio-SANS), the general-purpose small-angle neutron scattering diffractometer (GP-SANS), and the extended q-range small-angle neutron scattering diffractometer (EQ-SANS)—serve many different research communities, including biology, soft matter, quantum materials, and metallurgy [1].
The three instruments are custom-developed and built with similar yet different components at two different neutron sources, the spallation neutron source (SNS) and the high flux isotope rector (HFIR) at ORNL. While there is much overlap among the instrument specifications, each of these instruments has unique advantages for different types of experiments. Thus, there is considerable overlap in their user bases, who use multiple instruments for different experimental needs, such as specific performance or sample environment equipment needs. The SANS instrument suite has had very different instrument control and data acquisition systems (IC-DASs) over the past decade for historical reasons. EQ-SANS, located at the SNS, relied on PyDAS, a Python extension of the original home-developed SNS DAS [2]. Bio-SANS and GP-SANS, both located at HFIR, were served by a customized graphic user interface (GUI) extension based on the Spectrometer Instrument Control Environment (SPICE) software built on LabView [3].
At the SNS, the original SNS DAS played a critical role in the commissioning and operation of early instruments. It also laid the foundation of the data format for timestamped event mode data coming from the pulsed neutron source, which is required to record the time-of-flight of each neutron for further data process and reduction [4,5]. Later instruments with higher data throughput were commissioned at the SNS and exposed the data acquisition bandwidth limitations of the original SNS DAS. Years of operational experience also highlighted the need to improve the reliability and usability of the original SNS DAS. As a result, a series of significant software and hardware upgrade projects have taken place at the SNS [6,7,8,9], using the Experimental Physics and Industrial Control System (EPICS) toolkit and Control System Studio (CS-Studio) [10,11,12] that are used by the SNS accelerator control system. EQ-SANS at the SNS was the first among the SANS suite to be upgraded to the EPICS-based IC-DAS.
Over time, significant upgrades at Bio-SANS and GP-SANS, including upgrades allowing them to use the same type of 3He linear position-sensitive detectors used at EQ-SANS [13], neutron collimation systems, and additional sample environment equipment [1], have challenged the existing capabilities of SPICE and DAS. For example, the timestamped event mode data from the detector system have been converted to histograms to be handled by SPICE, losing valuable temporal information for neutron detection at Bio-SANS and GP-SANS. Moreover, given the growing suite of sample environment equipment shared among the SANS instruments and the need for a unified user experience, it is imperative that Bio-SANS and GP-SANS follow suit to upgrade to the EPICS-based system. This unification of the IC-DAS also will make system management and operation easier without splitting resources on what otherwise might be two separate development efforts.
This article shares our user needs and requirements analysis results, key methods we relied on, and new features of the EPICS-based SANS IC-DAS. Besides basic instrument control and data acquisition features, our new system is ready to be deployed for other similar SANS instruments, offering accurate and intuitive metadata handling, sophisticated experiment planning tools, and different user operation interfaces catering to different user communities.

2. User Needs and Requirements Analysis

2.1. Diverse User Needs

The users of the SANS IC-DAS are quite diverse. Categorized by different roles, they can be external facility users, instrument scientists, and supporting teams including sample environment teams, detector teams, and so forth. In addition to the rudimentary instrument control functionality, each role has more specific requirements of the system. For example, supporting teams require in-depth control of instrument components, clear status indication, and sufficient logs for monitoring and diagnostic troubleshooting. Instrument scientists have a good overall knowledge of the whole instrument system and are highly experienced in configuring an instrument for specific scientific requirements. However, they need to be freed from tedious hands-on operations to focus on scientific aspects of user experiments. The largest and most important group are external neutron scattering facility users. We want to empower them to successfully conduct experiments and collect useful measurement data with minimum effort expended on instrument operation. As the SANS instrument suite covers a large span of scientific communities with different skill sets; different experience levels with neutron scattering instruments; and, most crucially, different ways of conducting experiments suited for their sciences, our IC-DAS must make it easy for all of those communities to be productive during the short period of time they spend at an instrument. For example, users from the experimental condensed matter physics community usually have a single sample, but require various sample environment conditions in a particular experiment. They need to be able to easily visualize and interpret the reduced data to decide on the next condition to explore. They usually spend more time on a sample and require quick, flexible manipulation of many instrument and sample environment parameters. On the other hand, biochemists or biologists conducting solution SANS experiments usually use highly standardized instrument configurations for a series of samples with small variants. They need an effortless way of setting up their experiments, while they focus primarily on preparing fresh samples on-site. For these two extreme cases and others between them, a variety of user interfaces reflecting different workflows need to be designed and developed.
Our analysis of previous usage data further supports the above requirements. For example, the wizard-like GUI extension (Figure 1) previously developed within SPICE served 99.4% of Bio-SANS experiments and 7.8% of GP-SANS experiments over the 2 years since its deployment in 2016 (HFIR was in a long outage from late 2018 to late 2019). The rest of the experiments during that period were served by SPICE macros similar to scripting interfaces. Based on these findings, the new system implements and improves on both of these tools, offering wizard-like Panel Scans and Scripting Tool based on Python, in addition to the simple start/stop button-click GUI and Table Scan feature that were part of the previous EPICS/CS-Studio system.

2.2. Complex Data and Metadata

During a neutron scattering experiment, an extensive amount of data and metadata are collected. The data are mainly events detected by the large two-dimensional (2D) position-sensitive neutron detectors with timestamps of each neutron event referring to a reference time. Such event mode data provide convenience for post-collection time-slicing or synchronizing with sample environment parameters for time-resolved studies or a stroboscopic method. The metadata, also recorded with timestamps, include inherent instrument parameters such as hardware component positions, health conditions, and sample environment equipment readouts, and user-input supplementary information such as sample and background details. All of those parameters are critical for setting up the correct instrument measurement configuration, and many of them are required for correct data reduction and interpretation.
Most inherent parameters are motor positions and other equipment readouts (Figure 2). They can be grouped in relation to (1) beam characteristics (e.g., status of neutron guides, source aperture, attenuator, beam trap); (2) the Q-range (the momentum transfer, Q, is the most important factor in a small-angle scattering experiment, representing the size range to be probed in the reciprocal space within which SANS measures; e.g., velocity selector rotation speed and tilt angle, sample aperture size, detector motor positions); (3) sample environment devices and conditions (e.g., temperature, magnetic field, pressure, rotating cell speed); and (4) sample changer and slot number. Individual motor position and other readings are difficult for both expert and non-expert users to comprehend; therefore, it is necessary to associate and display them with more meaningful configuration descriptions. In addition, a higher-level collective setup can be used to configure an instrument without setting those parameters individually.
User-input supplementary information is needed for users to keep track of different parameters such as slight variations in composition, concentration, matching background, and so on. Some of this information can be pulled from the centralized sample management database, inventory tracking of equipment, material and sample (ITEMS), whereas some can be provided only by users manually during an experiment. Moreover, the system needs to provide an expandable pathway for adopting emerging standards for metadata, such as Information System for Protein crystallography Beamlines (ISPyB) used by the biological small-angle scattering community [14] and the collective action for nomadic small-angle scatterers (canSAS, www.cansas.org) community.

2.3. Integrated Experiment Planning Tool

Our instrument scientists and users have been using simple calculating tools such as Excel spreadsheets to plan experiments, including Q-range and measurement time, and manually convert that information into actual instrument parameters to use. Given the increasing complexity of instruments—e.g., multiple detectors, different sample changers, multiple beam stops, sample environment devices—an integrated experiment planning tool that can take advantage of the known constraints of the parameters, and then easily save the planned configuration for use and reuse, is valuable. Clearly defined instrument configurations will also enable the implementation of automatic data reduction and provide coarse real-time data reduction, which is very helpful to guide users during measurements.

3. Methods

3.1. Needs-Driven and User-Centered Design

The developers initialized a thorough user experience–focused study on the existing SPICE and other relevant software environments. The study was guided by the principles from the latest user experience and design thinking research (e.g., references [15,16,17]), and based on effective practices from previous EPICS upgrade projects, such as using a beginner mindset, maintaining operational flexibility, and balancing between overall performance and individual process optimization. With help from database administrators, the previous metadata from SPICE (already ingested into the catalog database) were used to mine useful usage data to quantify the findings of our study. This effort not only helped clarify the required functionality but also helped prioritize the requirements based on evidence rather than impressions. The study further helped frame a shared vision of delivering an IC-DAS that is both functional and easy-to-use and helped build a relationship of trust between instrument scientists and control system developers.
Based on a goal of minimizing the physical, mental, and emotional efforts required of users in carrying out their tasks, the study identified four focus areas that could potentially be improved for a better user experience. These four focus areas are (1) the Q-range configuration representing the instrument configuration, including many component settings; (2) a user interface including both wizard-like Panel Scans and a Python-based Scripting Tool; (3) customizable detailed sample and buffer information tracking; and (4) detector geometry handling with various viable offsets and motor positions. With these in focus, we co-designed all main components of our high-level user-oriented tools; the details are provided in the results section.

3.2. Automation Based on Process Knowledge

Following the principle of “first make it work, then make it better,” we built on the team’s expertise and experience to create shared process knowledge regarding how the different parts of the SANS instruments are interwoven with one another. For example, as mentioned earlier, setting an instrument to a specific Q-range configuration requires coordinating the establishment of the beam characteristics with the settings for other hardware motors. For instance, the collimator guides and apertures used to define the incident beam are coupled with several pieces of distance metadata for Q-range calculation and other settings. This interwoven nature of the instrument parameters should be considered in aspects including instrument control, experiment planning, and metadata handling.
Another challenge is effectively managing instrument Q-range configurations with small variations that are sample- and proposal-specific. Improved understanding of the process knowledge in actual operation enabled us to differentiate between configurations that are standard or are changed infrequently, and those that are changed often. We did so by creating a sample- and proposal-dependent layer that allows a user to save Q-range configurations with only minor modifications, while still sharing the parameter files (e.g., flood, beam center, and dark current files) associated with the standard configurations. We designed our tools with as much automation as possible and set the order of development based on shared process knowledge.

4. Results

Within the user needs and requirements scope identified earlier, built on the EPICS system architecture (Figure 3), we developed and delivered a distributed IC-DAS customized for the SNS and HFIR SANS instruments. We added customizations and improvements to already developed features and building blocks, significantly reducing the user experience gaps encountered among the three SANS instruments at ORNL. This system is built on the abundant base of EPICS drivers that interface with different items of physical hardware, such as motors, temperature controllers, and magnets. Among modular applications (also referred to as input–output controllers) and different user interfaces, a scan server application serves as the “brain” and controls the overall instrument state while maintaining a “command queue” for future measurements. Various user interfaces (including Panel Scans and Scripting Tool) cater to different needs and preferences and enable users to plan and conduct their experiments efficiently. This architecture ensures a sound and flexible system that can meet the requirements of complex instruments such as the SANS instrument suite.
In this section, we detail a few novel aspects of our system and discuss how they provide users with an improved instrument control and data handling experience. Additional screenshots of the new system are exhibited in the Supplementary Materials.

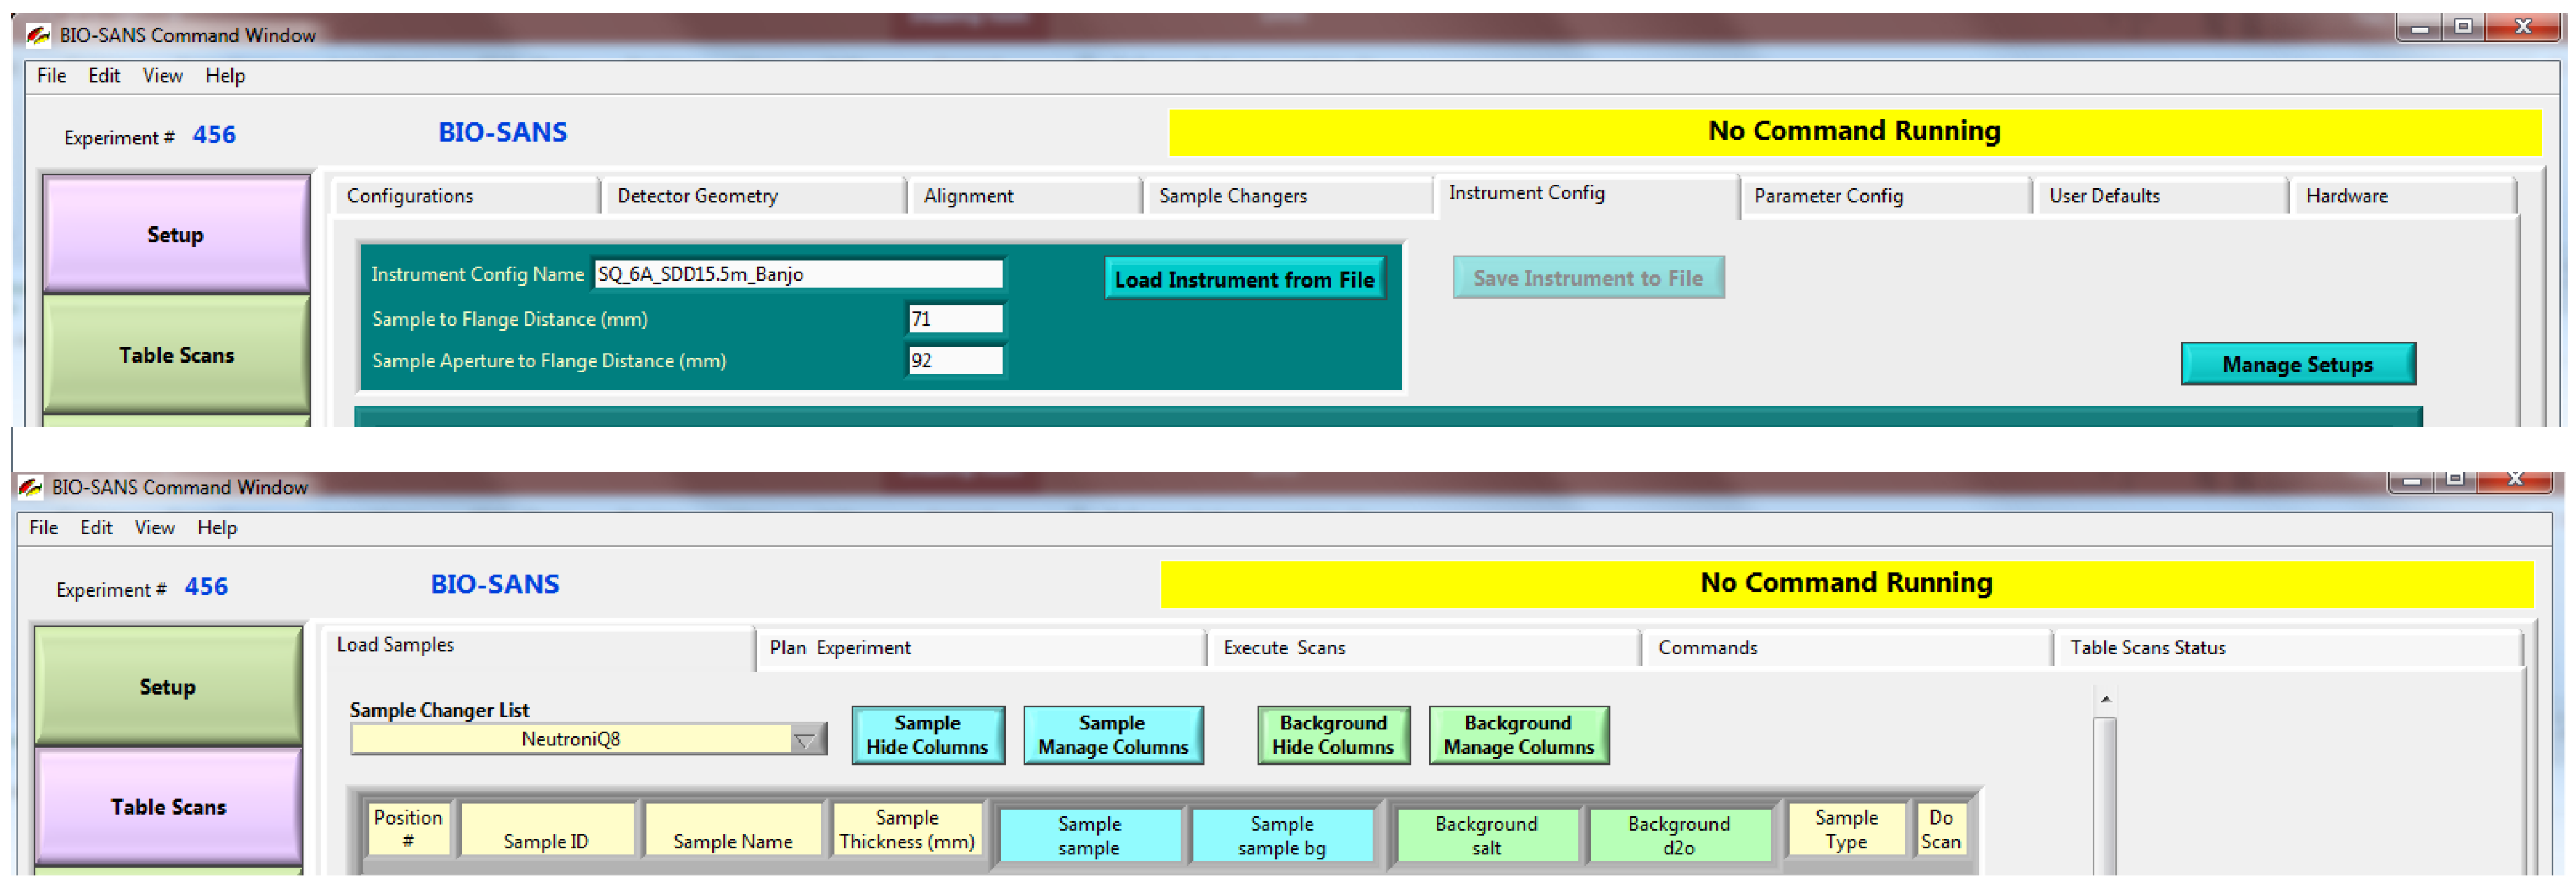
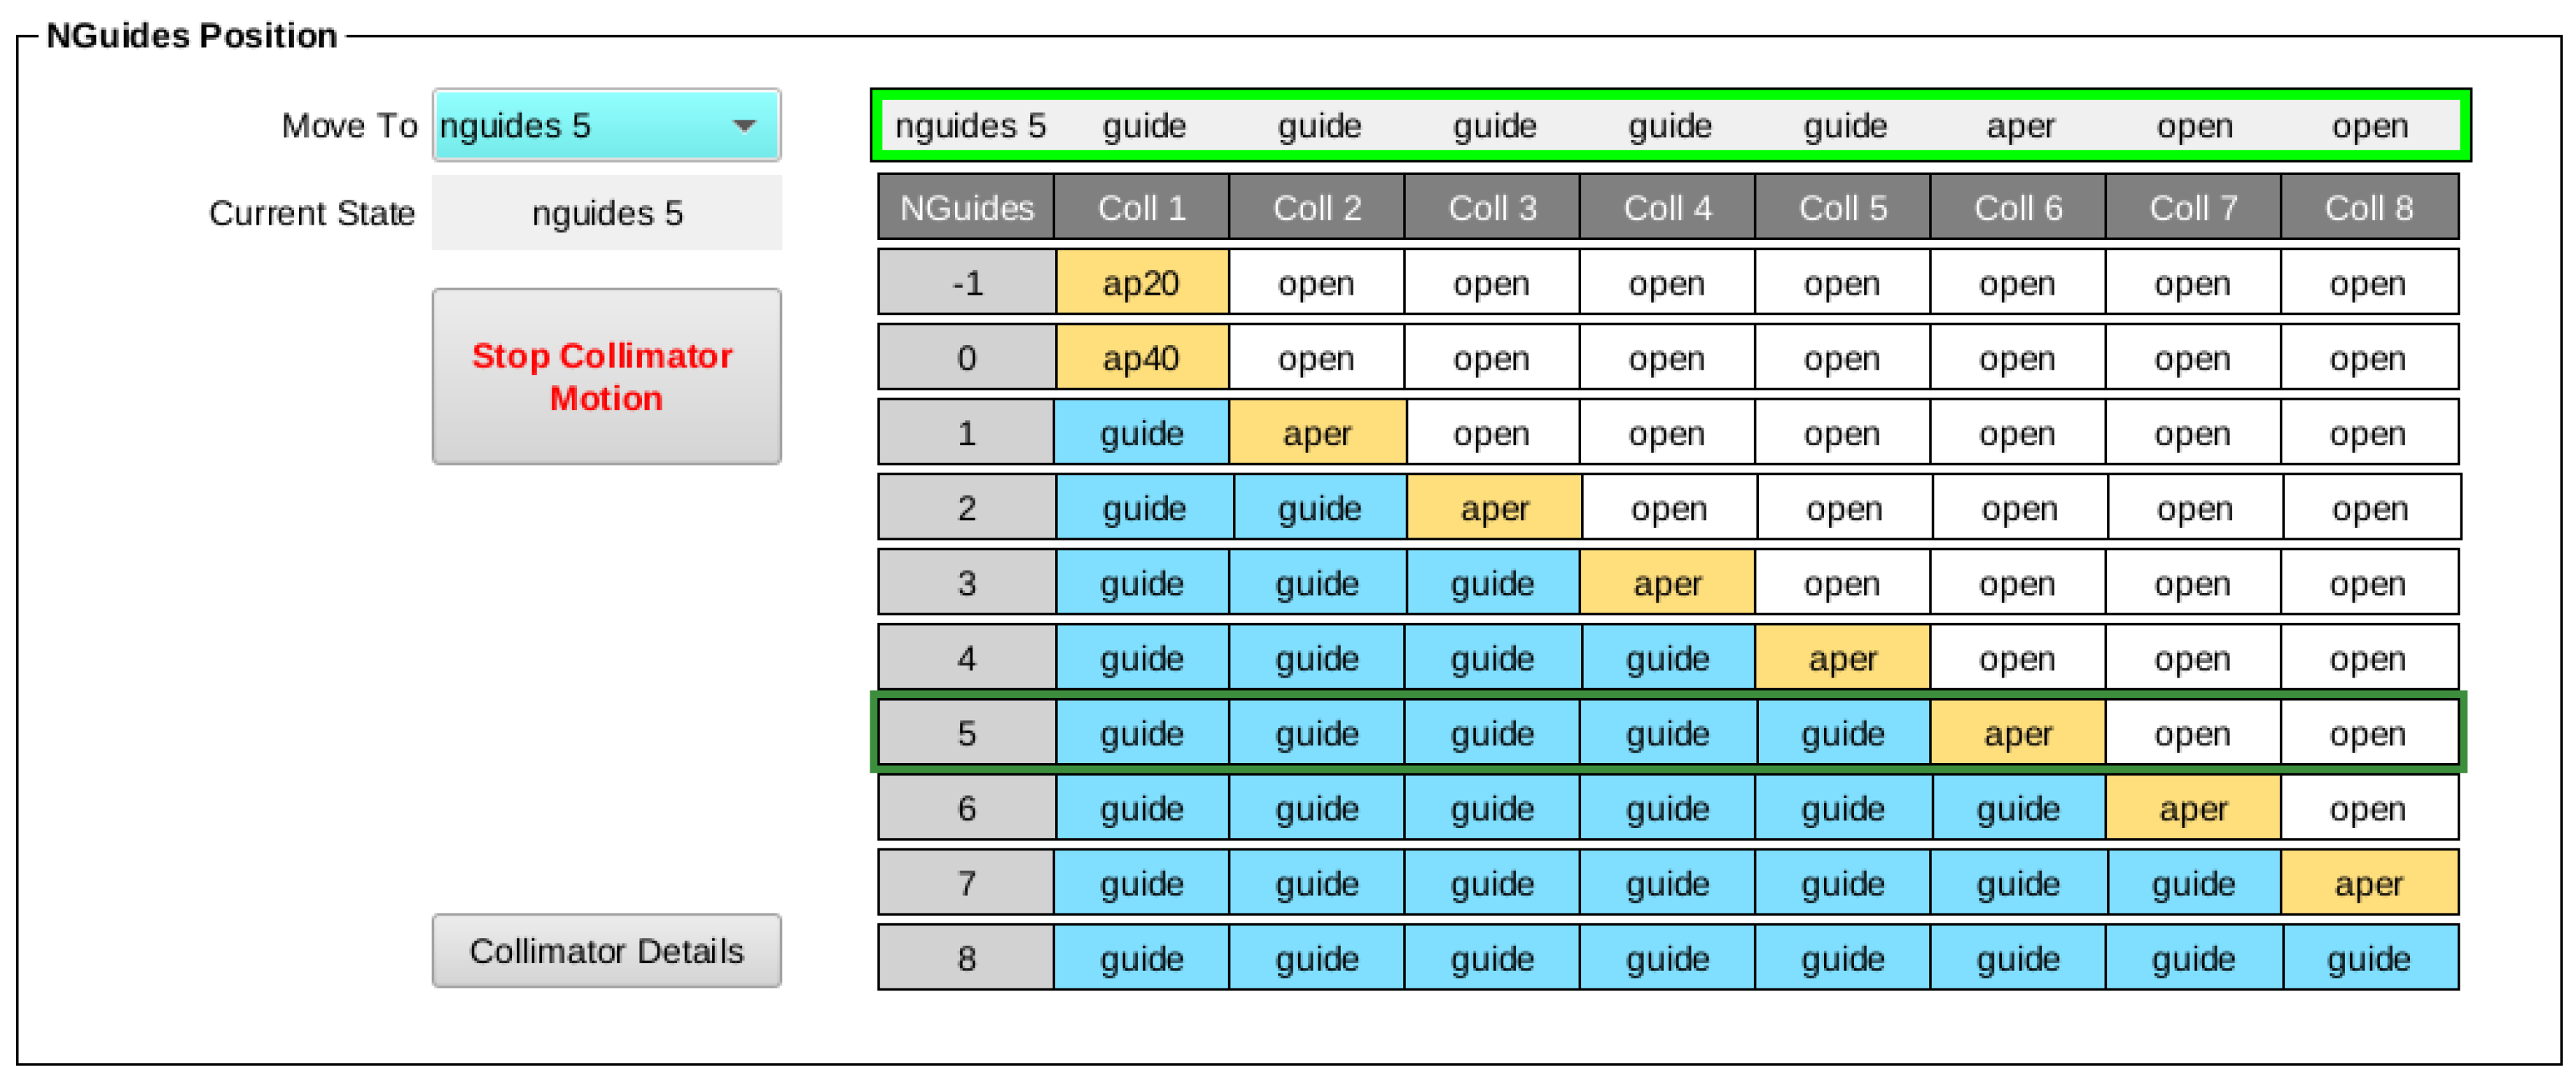
4.1. Intuitive Motion Control with Reliable Metadata

Following a good practice implemented in the previous SPICE software, we grouped the control of multiple devices into pseudo-motors. For example, for collimator motion control with eight different sections of guide motion control, a single “nguides (NGuides)” (number of guides) command can coordinate the control of guide motions in and out to keep a specific number of guides in the beam, along with apertures in the beam configuration. Note that the number of guides usually define the apparent source-to-sample distance (the flight path from the end of last guide to sample position). The distance needs to be coordinated with the sample-to-detector distance, various aperture sizes, and detector pixel resolution to provide optimal scattering geometry in SANS [18]. We included additional enhancements such as the newly defined 20 mm aperture in the beam configuration (aka, NGuides = “−1” in Figure 4); automated motor homing procedures; and logic embedded within the collimator motion control software to consistently compute and update the source aperture diameter and the metadata for the source-to-sample distance, based on motor positions. Similarly, detailed detector distance calculation logic is also integrated within the motion control to simplify or automate various offsets (e.g., sample-to–silicon window offset and detector motor position, see Figure 5) with a combined pseudo-motor total sample-to-detector distance. The latter matches the typical convention employed by SANS users in detector geometry and is critical in experiment planning and data reduction. The pseudo-motor is controllable like any physical motor, and the corresponding actual motor position is calculated based on offset values that can be changed according to different experiment setups. Note that all individual values and combined pseudo-motor values are captured in metadata redundantly in case they need to be cross-checked. The development and testing effort in motion control has been rewarded by a clean, simplified interface with enhanced functionalities, tighter integration with high-level tools, and more reliable metadata.

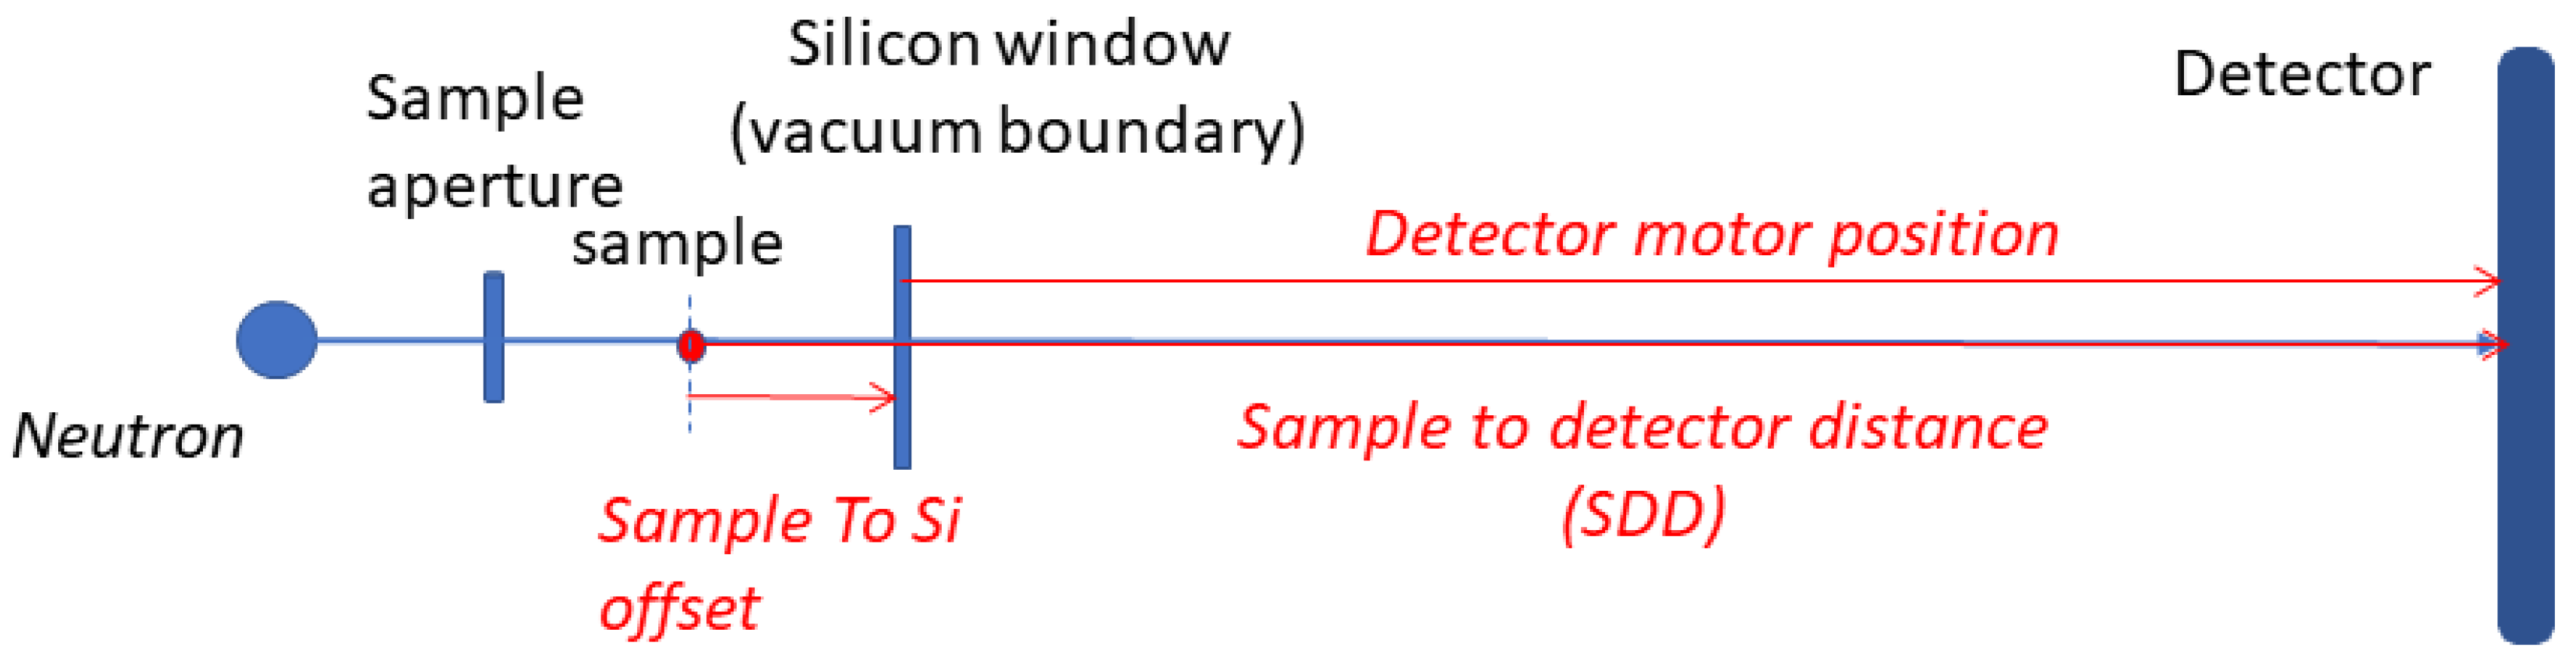
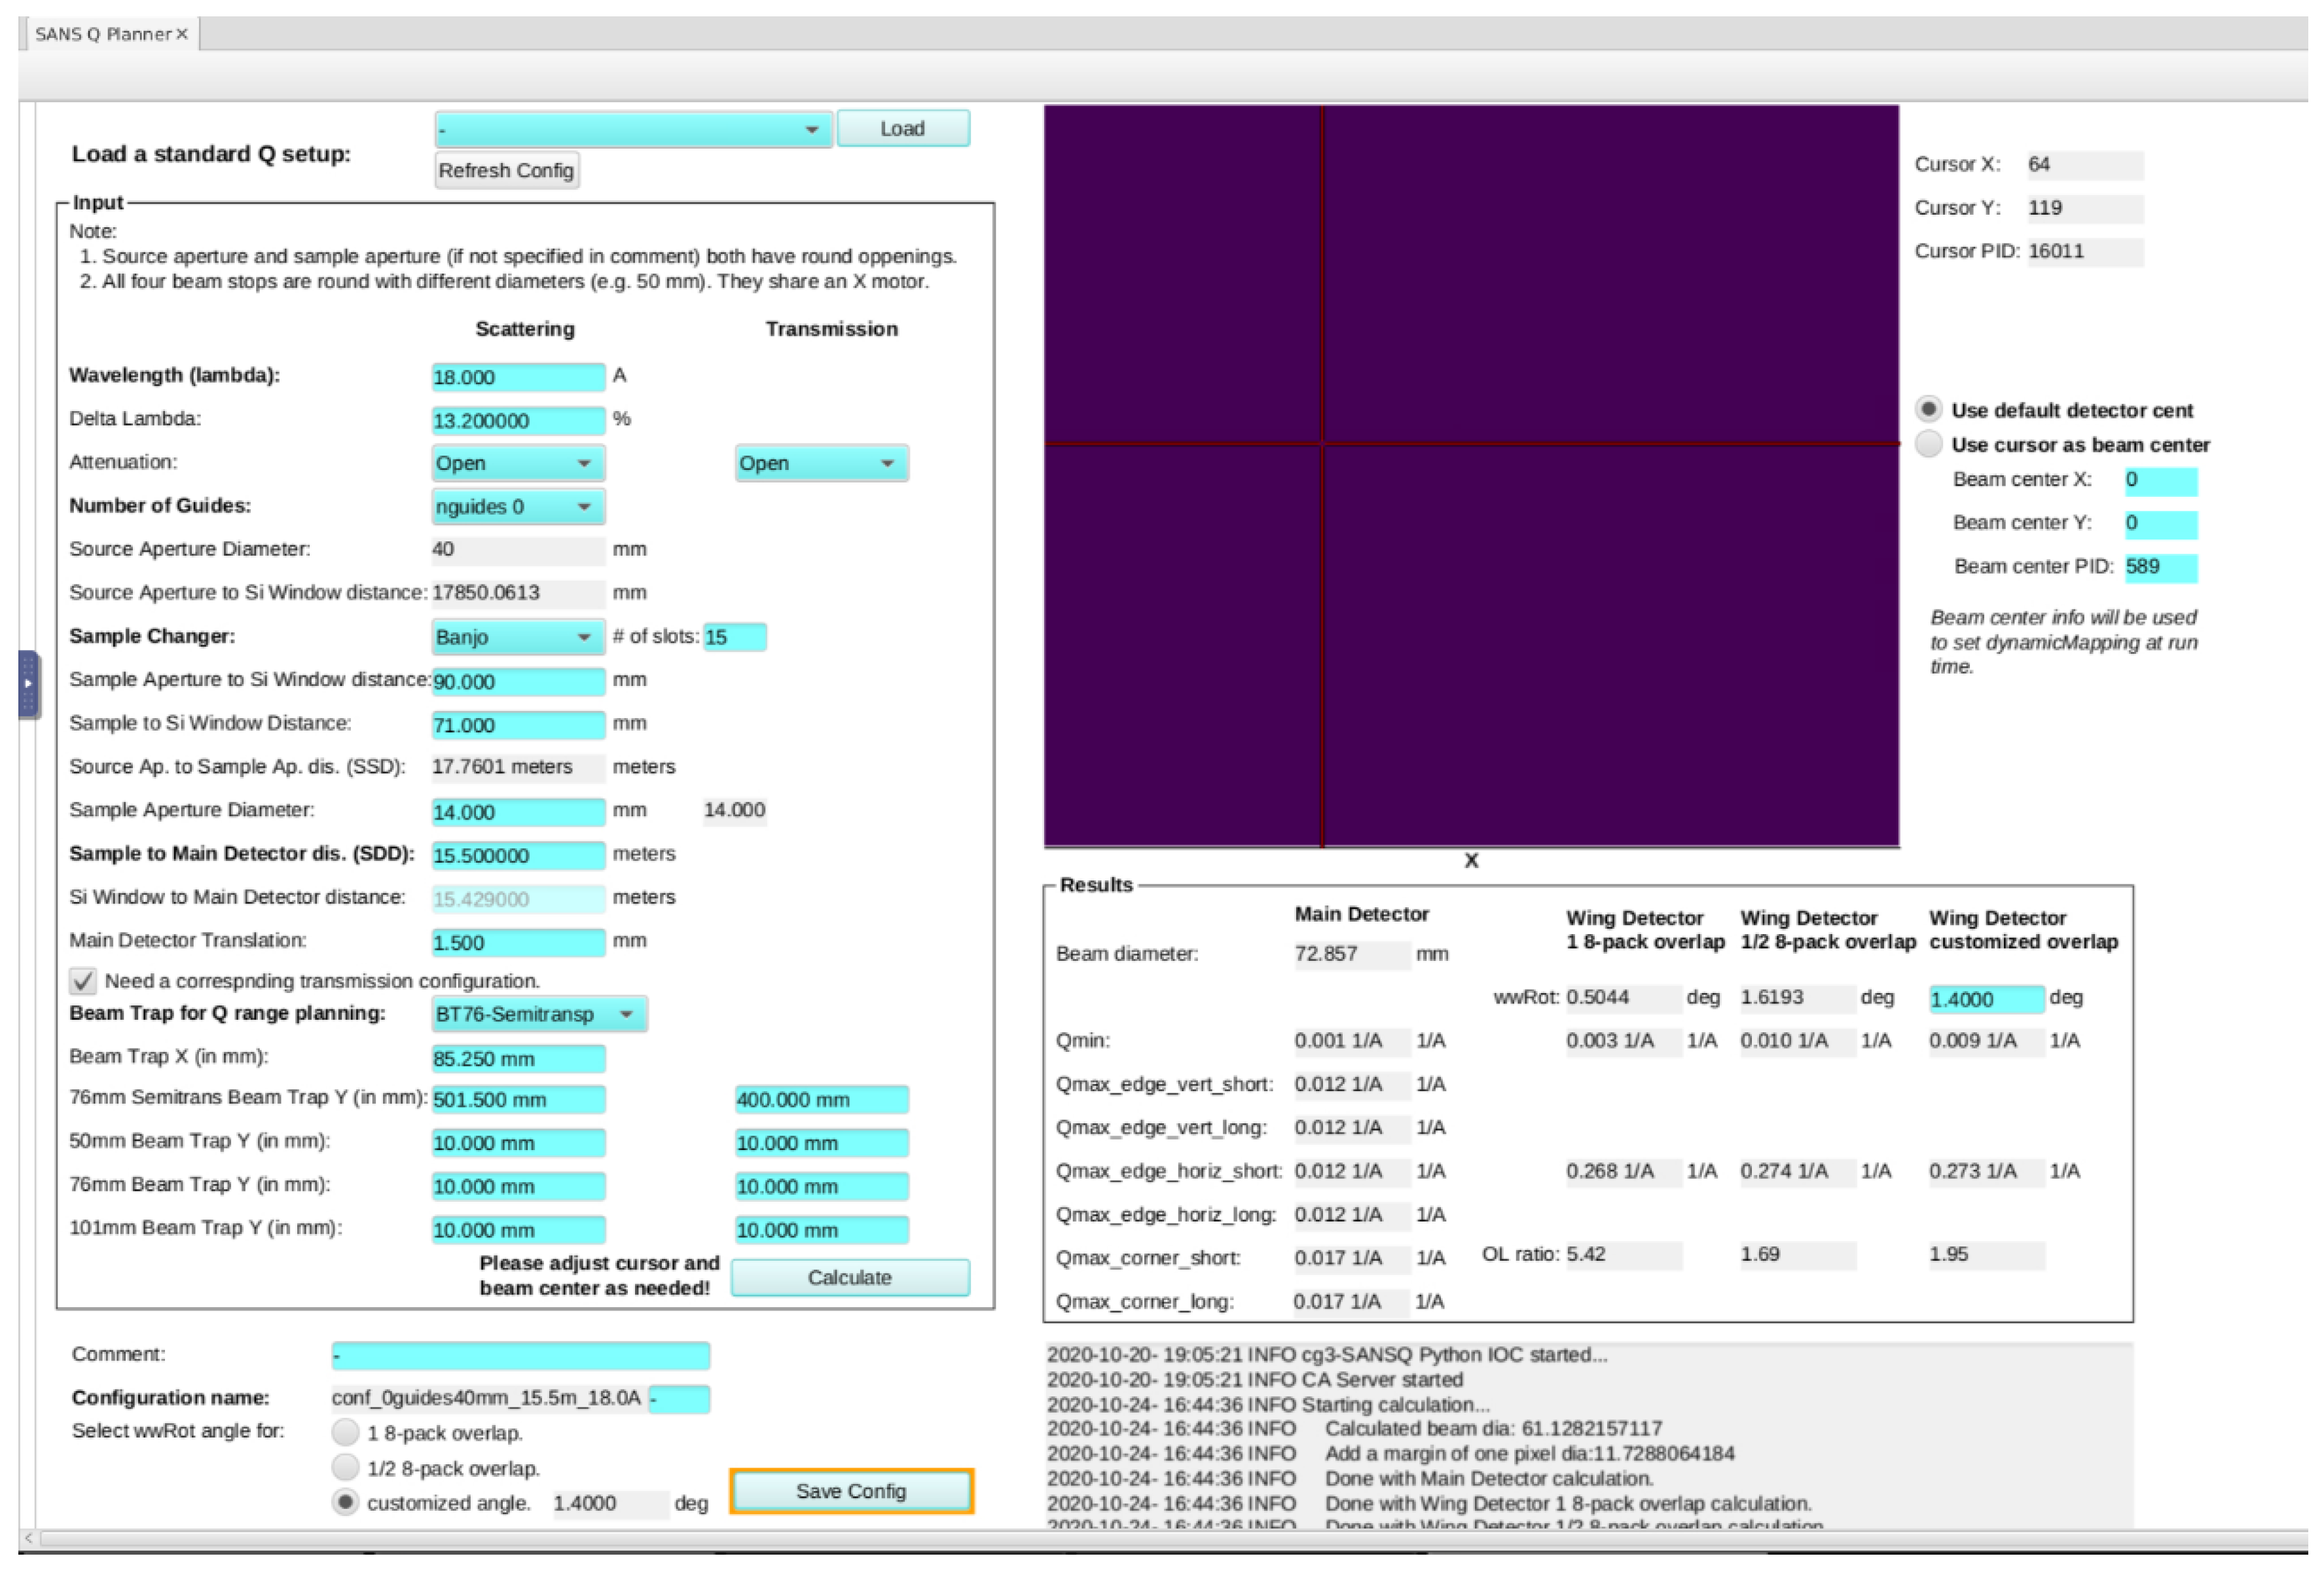
4.2. A Customized and Fully Integrated Q-Range Planner

Instrument-specific experiment planning is important for the success of an experiment. For SANS experiments, Q-range is one of the most critical factors, as it determines the size range of a measurement. Previously, instrument scientists developed spreadsheets or other calculation tools independently to do their planning without much instrument-specific information or constraints. The integration of the Q-Range Planning tool within the IC-DAS enables the direct transfer of the Q-range configuration from the planning stage to the measurement stage. In addition to the benefit of imposing the physical constraints (e.g., motor limits) of a specific instrument, this implementation reduces the number of Q-range configurations that are due to small, unnecessary inconsistencies.
Once we understood these requirements, a customized Q-Range Planner was developed based on instrument scientists’ spreadsheet calculators, as well as previous work on other instruments. The SANS Q-Range Planner helps users specify/update factors such as wavelength, attenuation factor, number of guides, aperture sizes, detector distance/rotation, distance offsets, and beam trap configuration for both scattering and transmission measurements. The factors then are converted into actual hardware settings such as motor positions. The planner then calculates the minimum Q at the beam stop rim, depending on the beam stop chosen, maximum Q values at corners and edges on each detector, and direct beam size on the detector; and, when applicable, it calculates the overlapping ratios between different detectors. Users can easily save a Q-range configuration to use and reuse in actual measurements. The saved Q configuration is in a human-readable text file format.
The SANS Q-Range Planner is deployed among the instrument suite. At different instruments, the calculation incorporates different instrument component details (e.g., detector, collimator, and beam trap details) but with an almost identical high-level interface for users (Figure 6). We also added beam center enhancement so users could more accurately calculate Q-ranges based on the specified beam center on the 2D display, instead of always pretending the beam center is at the previous physical detector center. The beam center coordination and calculated Q-range details are captured in each Q configuration file, reused at the run time for live displays (see Section 4.4), and saved in each data file to be used by the data reduction software. To meet the different needs and access privileges of external users and instrument scientists, two instances of the Q-Range Planner are running on each instrument. One is dedicated to use by instrument scientists to establish new standard configurations. The other is embedded within Panel Scans (see Section 4.3) to flexibly deal with sample- or experiment-dependent minor modifications, as well as to collect data with more than one Q-range configuration. Q-range configurations can also be easily set like a simple variable by using other user operation interfaces such as Scripting Tool and the generic Table Scan. With Q-Range configurations generated by the planner, a soft matter simulator (Figure S7) has been developed for generating typical model scattering curves with realistic instrument factors such as flux at different neutron guide numbers, Q resolutions, etc., to further aid users to plan an experiment.

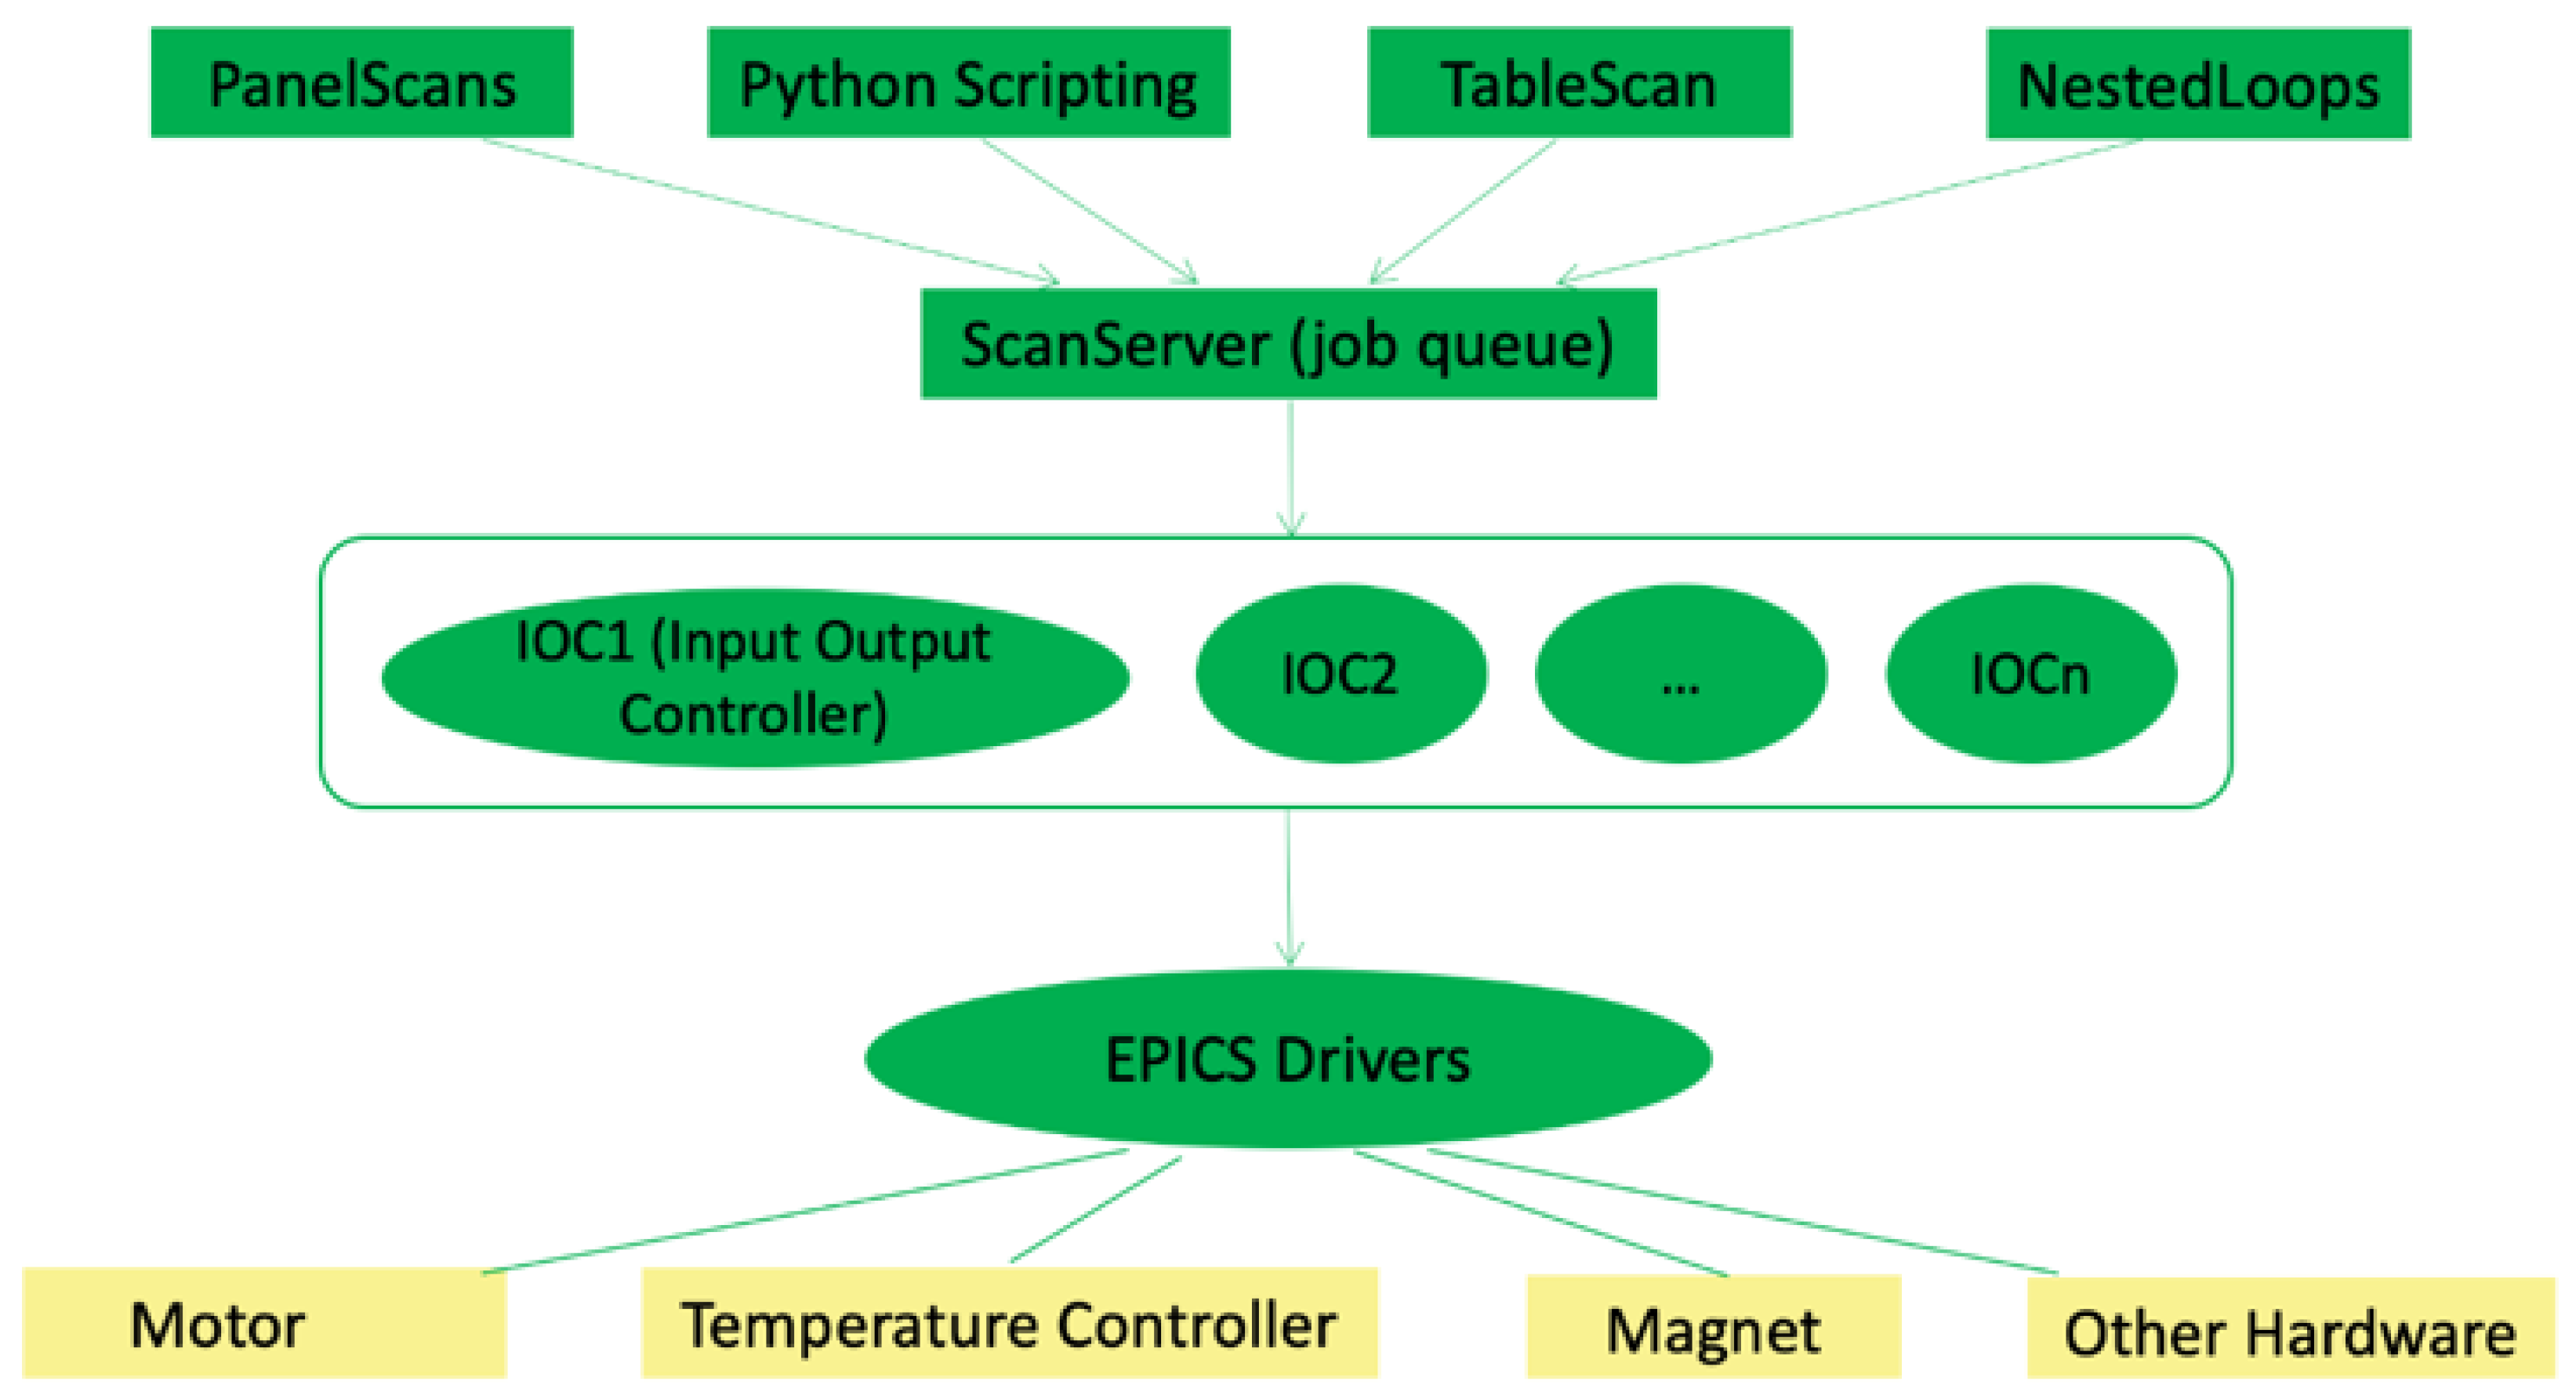
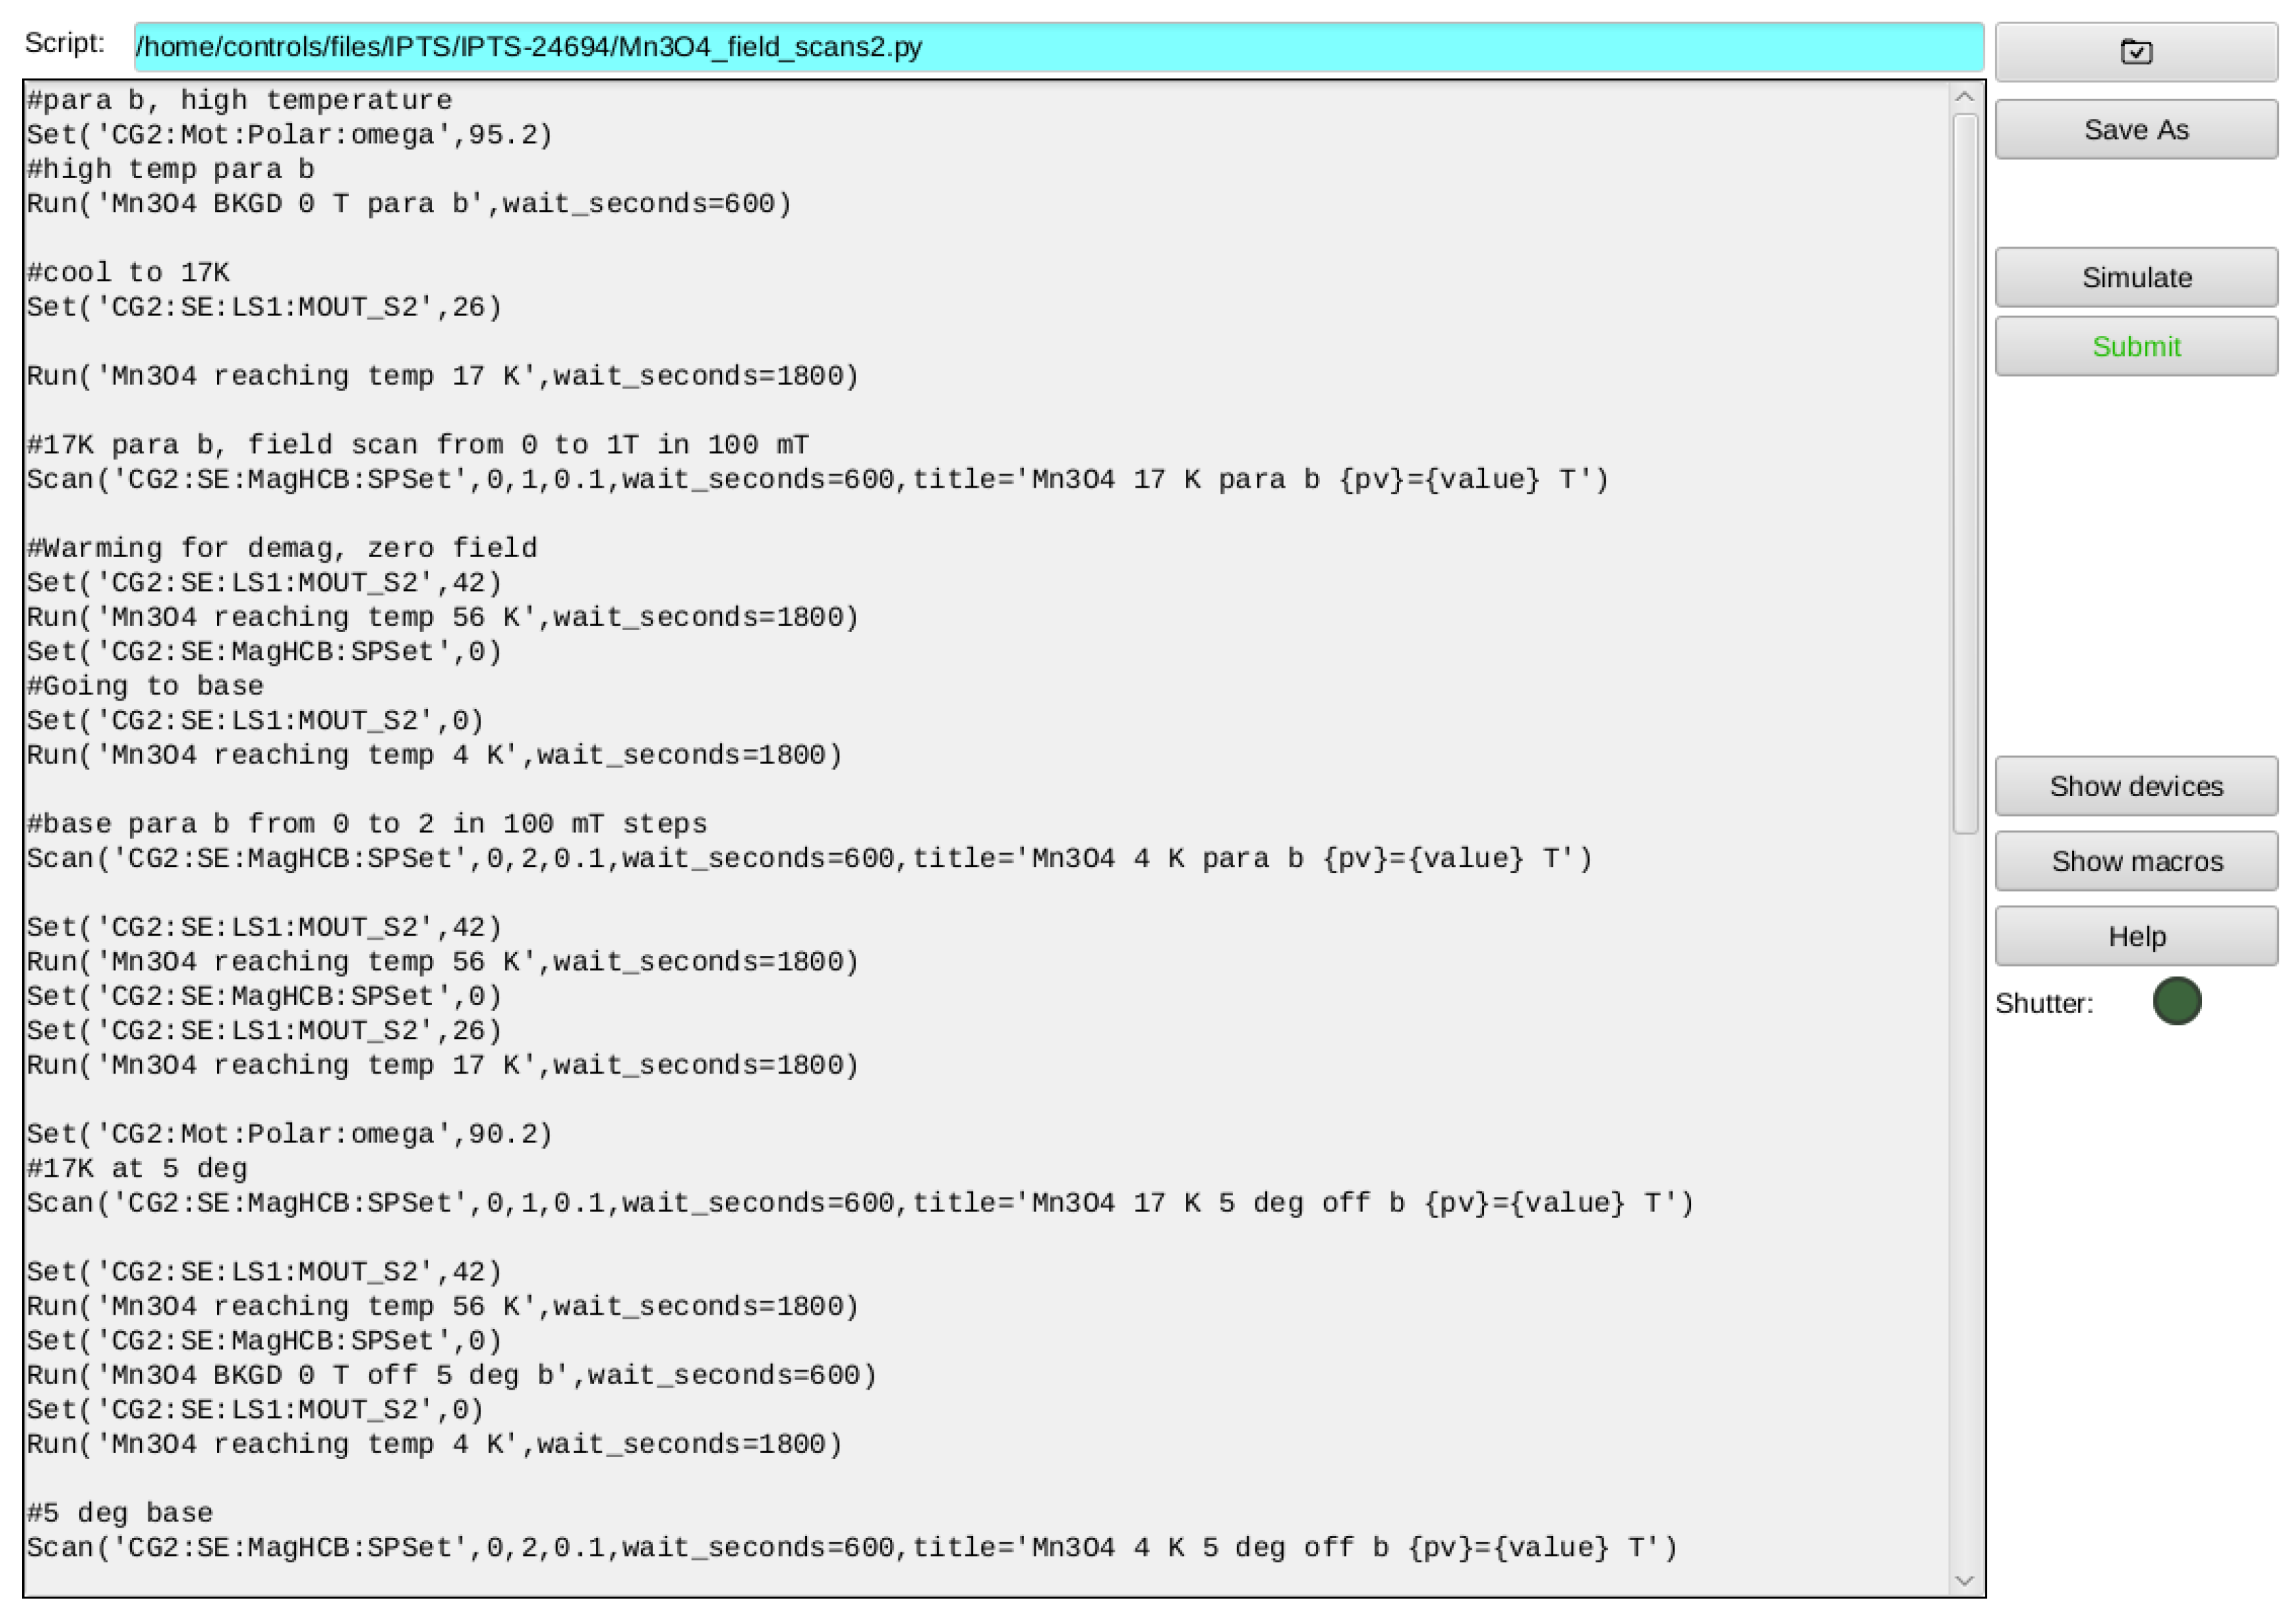
4.3. User Operation Interfaces: Panel Scans and Scripting Tool

The previous EPICS/CS-Studio system included a generic Table Scan feature that used a spreadsheet to set up a list of scans for batching measurement. However, the intuitiveness and ease of use of the generic Table Scan was limited. To provide more functional and straightforward interfaces to different users, we implemented a wizard-like GUI-based tool, Panel Scans, and a Scripting Tool with an improved scripting middle-layer library. Both can use the Q-range configurations generated from the Q-Range Planner introduced in the previous section.
The SANS Panel Scans tool was designed based on earlier development of the SPICE GUI extension and other EPICS high-level scanning tools. It uses one instance of the Q-Range Planner and a six-step workflow (Figure 7) to guide users through the complex measurement planning process. This includes (1) checking or modifying individual Q-range configurations; (2) selecting up to four Q configurations in any order; (3) configuring sample environment variables; (4) keeping track of sample- and buffer-related variables for each sample changer slot; (5) specifying the exposure time for each combination of sample changer slot/Q configuration/sample environment variables; and (6) expanding the entire batch with all the details into a tabulated scan list. The scan list can then be simulated and tested before execution, submitted to the scan server to execute, and saved as a file for future reference.
The guided workflow and clear steps of Panel Scans not only make the complex process more manageable and less overwhelming for even new users, but also encapsulate many thoughtful features and improvements within an appropriate sub-task context. These features include a user-friendly table view and visualization of Q-ranges (see Figure 8), generation of scripting snippets with Q-range configurations selected (Figure 8), support for both pre-configured and ad-hoc sample environment variables for routine and innovative experiments, standardized sample- and buffer-related metadata variables (still with customizable tags for automatic background association), and accommodation of flexible expanding orders. The system also provides a high degree of freedom for users to set up and change their measurements. For example, if users choose to submit each table row as a separate scan job, they can use the upgraded scan monitor to reorder or delete and resubmit queued scan jobs. In addition, the “load sample” step provides customizable sample information to obligate users to keep track of variants among different samples, which encourages good practices for accurate supplementary information and enables future automatic background matching in data reduction.
Similarly, in Scripting Tool, the Scan Tools helper library also incorporates lessons learned from the legacy PyDAS, SPICE macros, and several early generations of home-developed EPICS Python middle layer libraries. It supports all Python features and additional scan-specific commands to be executed by scan server. The scientists worked together with the developers to ensure that the scripting library is easy to use for users with different levels of programming experience (see Figure 9). Other improvements that come with this implementation include converting other existing high-level scanning tools to use the same helper library, simplified and enhanced device configuration (including limits checking), and a simple screen for submitting scripts.

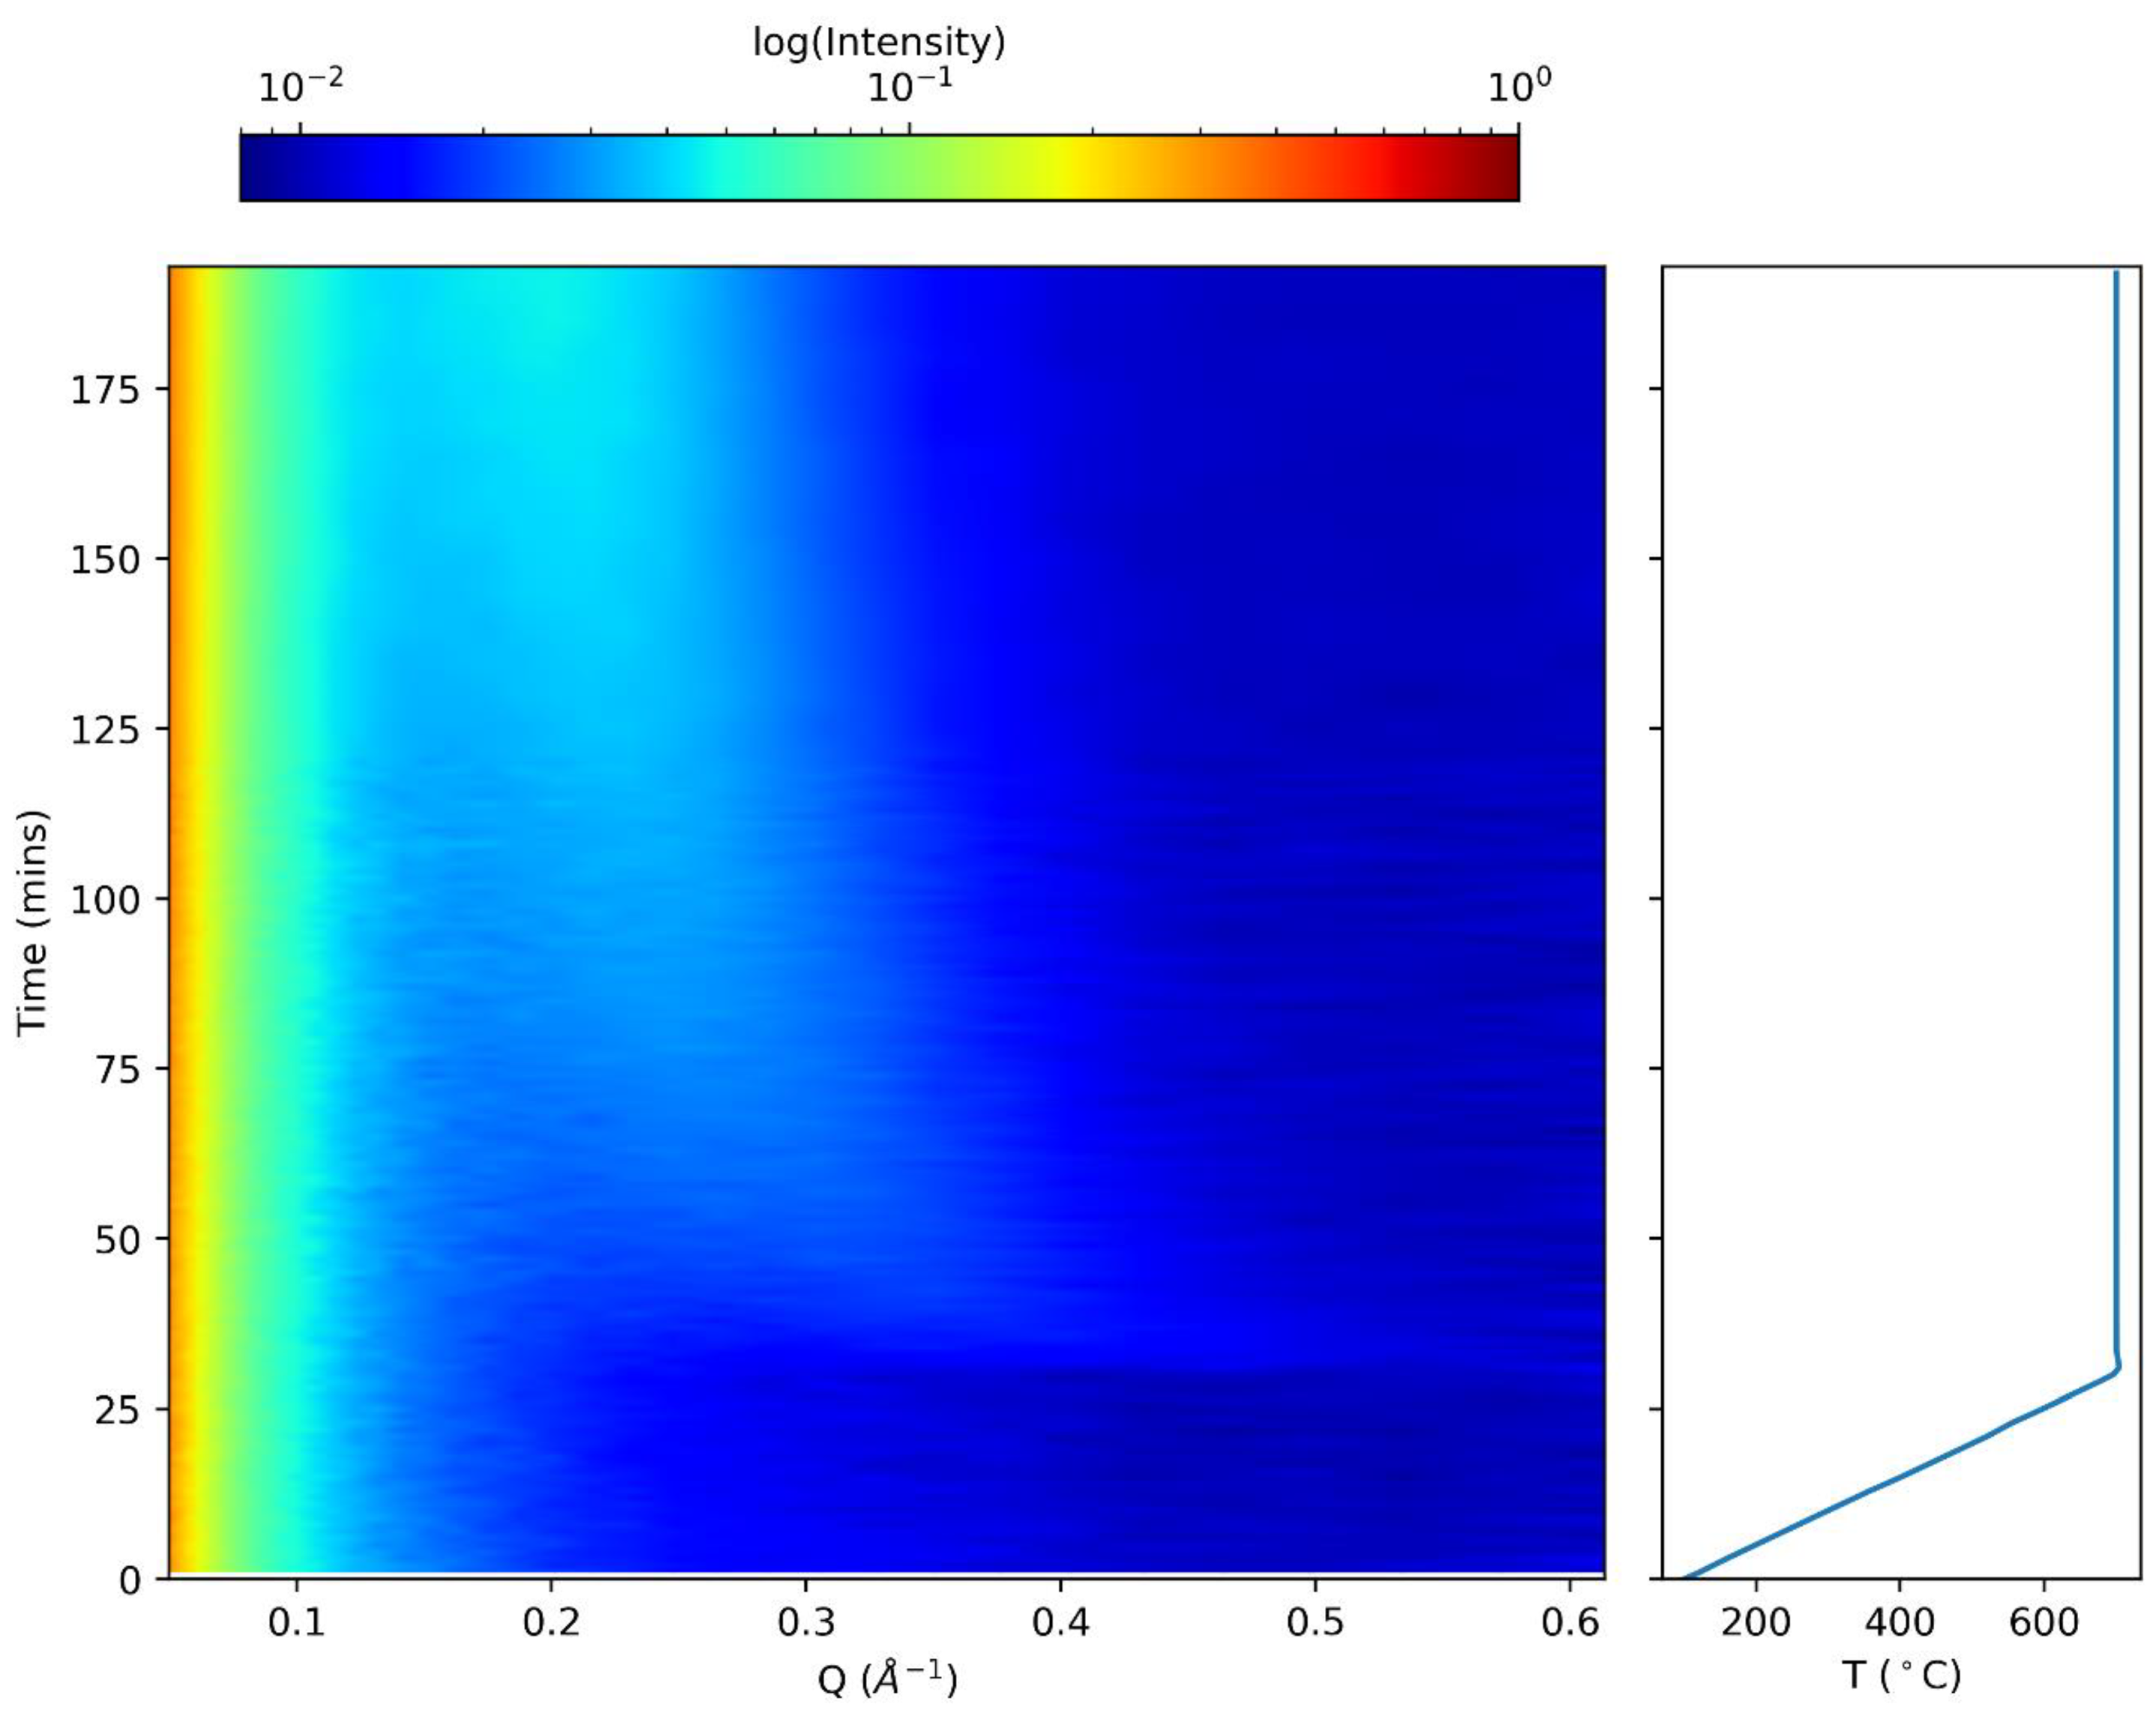
4.4. Event Data Mode and New Features Related to Live Displays

One of the results of this upgrade is that it enables the production of event mode data for the whole DAS, especially the detectors at HFIR. Event mode imposes timestamps on neutron events detected and on other instrument systems, such as fast sample environment devices, enabling convenient post-data collection filtering. This is very useful in experiments that involve time-resolved kinetic studies, stroboscopic methods, setting up a time-of-flight source at HFIR with choppers, or simply detecting sample deterioration over time. At SNS, “event mode” refers to the pulsed accelerator timing signal; however, as a continuous neutron source, HFIR did not have an inherent timing signal as a reference. Therefore, a time server was set up for HFIR instruments; and Network Time Protocol [19] is used to synchronously timestamp events at an instrument, including neutron events and fast sample environment data, at a precision of within 1 ms. The system was made compatible with SNS event-based acquisition, which uses a timestamping rollover of 16.6667 ms, corresponding to the 60 Hz pulse rate. In other words, the events are grouped by their occurrence in the 16.6667 ms windows, and as such are saved in data files in Nexus format. For reactor-based instruments such as Bio-SANS and GP-SANS, the event timestamps are merely additional information about the neutron events and can be ignored if only the histogram of the data is used. No other changes or additions at HFIR SANS instruments are needed for event-based acquisition, as the relevant features had already been developed and tested on the SNS instruments. In Figure 10, an example of event mode data shows the rapid precipitation that occurs in a novel high strength, high ductility alloy that occurs as the sample was heated from room temperature to 700 °C from an experiment on GP-SANS [20]. The size and number density of the precipitates mediates the balance between strength and ductility in this family of alloys. The SANS data can detect such precipitates in-situ. This data was collected in the event mode in a single data set and was processed post-experimentally to split it up by 60-s interval during the temperature ramp and ten 300-s intervals for the annealing temperature. Moreover, the post-experiment process can be flexible depending on samples and sample conditions. The new capability also allows the visualization of sequential defined-time snapshots of the event mode data to aid real-time experimental evaluation and planning.
We have been using EPICS area detector driver for neutron event data (ADnED) and dynamicMapping (a Python tool for live data conversions) [9] to provide meaningful 2D and 1D live displays on other instruments. There are three related new features on SANS that may be worth mentioning. First, an ImageSnapshot Python tool has been deployed on the SANS instruments (and a few other instruments), which saves snapshots of histogrammed 2D detector images at the end of a run. These images are further parsed and ingested in the data catalog database for a quick view of measurement data. They can also be used for quick data reduction without reading the large HDF5 files if event mode data is not needed. Second, by updating dynamicMapping and saving and reusing beam center information in Q-range configurations, we were able to fully automate dynamicMapping to update mapping files for live d-spacing and Q conversions and for cursor display on the histogrammed 2D detector images. Third, a prototype Python tool, SANS-AutoRebin, has been developed to bin the data integrated by ADnED into log bins using default Q-range configurations, normalize log-binned data according to the number of pixels contributing to each log bin, and then scale the normalized data to beam monitor counts or run time. This prototype tool is part of our effort to provide users with live, coarsely reduced data for better steering of their experiments during the run time.

5. Conclusions

Our new IC-DAS is based on EPICS, an open source distributed control system environment that has been widely adopted by other large scientific facilities. The systems completed commissioning at all SANS instruments by early 2020; an example data using the event mode is shown in Figure 10. With carefully designed and developed features to meet the needs of the SANS user communities, our new system provides a uniform user experience across the ORNL SANS neutron scattering instrument suite. Collaboratively, we designed and delivered a system that reflects a deeper understanding of our diverse user needs, instrument configurations, and complex experiment processes. Easy-to-use tools and more automation result in less cognitive load, confusion, stress, and human error for novice users, and more efficient use of beam time with higher-quality measurement data. The flexible architecture of the new system can handle the ever-increasing complexity of modern instruments. It also provides a manageable solution for integrating existing and new sample environment equipment across all SANS instruments. We hope the enhanced capabilities of our new system and the improved user experience it enables can also benefit other, similar instruments by improving operation for more productive scientific discovery.

Supplementary Materials

The following are available online at https://www.mdpi.com/2076-3417/11/3/1216/s1, Figure S1: Check Q Setups tab in the Panel Scans interface. The yellow outline highlights buttons are required to be clicked to ensure the output parameters to be calculated. Figure S2: Select Q Setups tab in the Panel Scans interface. Figure S3: Sample Environment Devices tab in the Panel Scans interface, for selecting specific sample environment for the current experiment. “Use other device combination:” will reveal the text input box to type a comma separated parameter names or aliases. Figure S4: Load Samples tab in the Panel Scans interface, for more specific sample information. Figure S5: Specify Exposure Time tab in the Panel Scans interface to setup measurement time or detector count at different configurations and samples. Figure S6: Expand and Submit tab in the Panel Scans interface. It expands the scans in different ways with all conditions from previous setups (such as samples, sample environment, configurations, measurement type (transmission, scattering or both)), only part of the columns are shown in the screenshot. Figure S7: The soft matter simulator with instrument specific parameters

Author Contributions

Conceptualization, X.Y., L.D.-S., R.G., G.G., S.H., L.H. (Lilin He), R.K., K.L., S.V.P., S.Q., and V.U.; funding acquisition, G.T.; investigation, M.B., L.D.-S., X.G., R.G., G.G., M.H., S.H., L.H. (Lilin He), L.H. (Luke Heroux), K.K., J.K., C.L., K.L., M.P., S.V.P., C.P., S.Q., M.R.-R., V.S., and K.V.; methodology, B.A., M.H., R.K., J.K., K.L. and, M.R.-R.; project administration, X.Y. and R.K.; resources, L.H. (Luke Heroux) and R.K.; software, X.Y., B.A., M.B., X.G., R.G., G.G., K.K., M.P., M.R.-R., V.S., G.T., and K.V.; supervision, S.H.; writing—original draft, X.Y. and S.Q.; writing—review and editing, X.Y. and S.Q. All authors have read and agreed to the published version of the manuscript.

Funding

This research was funded by US DOE Office of Science.

Institutional Review Board Statement

Not applicable.

Informed Consent Statement

Not applicable.

Data Availability Statement

Not applicable.

Acknowledgments

The authors thank all beamline teams and external users with whom we worked, database administrators Jeff Patton and Peter Parker, beamline scientists Changwoo Do, William T. Heller, Mark Lumsden, and all SPICE developers, all EPICS and CS-Studio developers, and all previous and current developers in the SNS Instrument Data Acquisition and Controls group. This project used resources at HFIR and SNS, DOE Office of Science User Facilities operated by ORNL. The Bio-SANS instrument is supported by the DOE Office of Biological and Environmental Research.

Conflicts of Interest

The authors declare no conflict of interest.

References

  1. Heller, W.T.; Cuneo, M.; Debeer-Schmitt, L.; Do, C.; He, L.; Heroux, L.; Littrell, K.; Pingali, S.V.; Qian, S.; Stanley, C.; et al. The suite of small-angle neutron scattering instruments at oak ridge national laboratory. J. Appl. Crystallogr. 2018, 51, 242–248. [Google Scholar] [CrossRef]
  2. Zolnierczuk, P.A.; Riedel, R.A. Neutron scattering experiment automation with python. In Proceedings of the 17th IEEE-NPSS Real Time Conference, Lisbon, Portugal, 24–28 May 2010; pp. 1–3. [Google Scholar] [CrossRef]
  3. Lumsden, M.D.; Robertson, J.L.; Yethiraj, M. SPICE—Spectrometer and instrument control environment. Phys. B Condens. Matter. 2006, 385, 1336–1339. [Google Scholar] [CrossRef]
  4. Peterson, P.F.; Campbell, S.I.; Reuter, M.A.; Taylor, R.J.; Zikovsky, J. Event-based processing of neutron scattering data. Nucl. Instrum. Methods Phys. Res. Sect. Accel. Spectrometers Detect. Assoc. Equip. 2015, 803, 24–28. [Google Scholar] [CrossRef] [Green Version]
  5. Granroth, G.E.; An, K.; Smith, H.L.; Whitfield, P.; Neuefeind, J.C.; Lee, J.; Zhou, W.; Sedov, V.N.; Peterson, P.F.; Parizzi, A.; et al. Event-based processing of neutron scattering data at the spallation neutron source. J. Appl. Crystallogr. 2018, 51, 616–629. [Google Scholar] [CrossRef]
  6. Hartman, S.M. System design towards higher availability for large distributed control systems. In Proceedings of the ICALEPCS, Grenoble, France, 10–14 October 2011; pp. 1209–1211. [Google Scholar]
  7. Hartman, S.M. SNS instrument data acquisition and controls. In Proceedings of the ICALEPCS, San Francisco, CA, USA, 6–11 October 2013; pp. 755–758. [Google Scholar]
  8. Geng, X.; Chen, X.H.; Kasemir, K.U. First EP- ICS/CSS based instrument control and acquisition system at ORNL. In Proceedings of the ICALEPCS, San Francisco, CA, USA, 6–11 October 2013; pp. 763–765. [Google Scholar]
  9. Yao, X.; Gregory, R.; Guyotte, G.; Hartman, S.; Kasemir, K.-U.; Lionberger, C.; Pearson, M. UX Focused Development Work During Recent ORNL Epics-Based Instrument Control System Upgrade Projects; JACOW Publishing: Geneva, Switzerland, 2020; pp. 818–823. [Google Scholar] [CrossRef]
  10. Clausen, M.R.; Gerke, C.H.; Moeller, M.; Rickens, H.R.; Hatje, J. Control system studio (CSS). In Proceedings of the ICALEPC, Knoxville, TN, USA, 15–19 October 2007; pp. 37–39. [Google Scholar]
  11. Kasemir, K.U.; Pearson, M.R. CS-studio scan system parallelization. In Proceedings of the ICALEPCS, Melbourne, Australia, 17–23 October 2015; pp. 517–520. [Google Scholar] [CrossRef]
  12. Kasemir, K.U.; Grodowitz, M.L. CS-studio display builder. In Proceedings of the ICALEPCS, Barcelona, Spain, 8–13 October 2017; pp. 1978–1981. [Google Scholar] [CrossRef]
  13. Berry, K.D.; Bailey, K.M.; Beal, J.; Diawara, Y.; Funk, L.; Steve Hicks, J.; Jones, A.B.; Littrell, K.C.; Pingali, S.V.; Summers, P.R.; et al. Characterization of the neutron detector upgrade to the GP-SANS and bio-SANS instruments at HFIR. Nucl. Instrum. Methods Phys. Res. Sect. Accel. Spectrometers Detect. Assoc. Equip. 2012, 693, 179–185. [Google Scholar] [CrossRef]
  14. De Maria Antolinos, A.; Pernot, P.; Brennich, M.E.; Kieffer, J.; Bowler, M.W.; Delageniere, S.; Ohlsson, S.; Malbet Monaco, S.; Ashton, A.; Franke, D.; et al. ISPyB for BioSAXS, the gateway to user autonomy in solution scattering experiments. Acta Crystallogr. D Biol. Crystallogr. 2015, 71, 76–85. [Google Scholar] [CrossRef] [PubMed] [Green Version]
  15. Norman, D.; Nielsen, J. The Definition of User Experience (UX). Available online: https://www.nngroup.com/articles/definition-user-experience/ (accessed on 30 November 2020).
  16. Farrell, S. UX Research Cheat Sheet. Available online: https://www.nngroup.com/articles/ux-research-cheat-sheet/ (accessed on 30 November 2020).
  17. Tischler, L. Ideo’s David Kelley on “Design Thinking”. Available online: https://www.fastcompany.com/1139331/ideos-david-kelley-design-thinking (accessed on 30 November 2020).
  18. Mildner, D.F.R.; Carpenter, J.M. Optimization of the experimental resolution for small-angle scattering. J. Appl. Cryst. 1984, 17, 249–256. [Google Scholar] [CrossRef]
  19. Gerstung, H.; Elliott, C.B.; Haberman, E. Definitions of Managed Objects for Network Time Protocol Version 4 (NTPv4). 2010. Available online: https://www.hjp.at/doc/rfc/rfc5907.html (accessed on 30 November 2020).
  20. Yang, Y.; Samolyuk, G.D.; Chen, T.; Poplawsky, J.D.; Lupini, A.R.; Tan, L.; Ken, L. Coupling computational thermodynamics with density-function-theory based calculations to design L12 precipitates in FeNi based alloys. Mater. Des. 2020, 191, 108592. [Google Scholar] [CrossRef]
Figure 1. The Spectrometer Instrument Control Environment (SPICE) graphic user interface (GUI) extension with a wizard-like tool to set up scans for small-angle neutron scattering (SANS); highlighted in purple is the currently selected function group.
Applsci 11 01216 g001
Figure 2. (A) An overview of a SANS instrument system. (B) The collimation system used at the biological small-angle neutron scattering instrument (Bio-SANS) and the general-purpose small-angle neutron scattering diffractometer (GP-SANS) with interchangeable neutron guide and aperture systems. There are eight sections of almost identical units with independent motor control.
Applsci 11 01216 g002
Figure 3. Experimental Physics and Industrial Control System (EPICS) architecture (NestedLoops is a generic graphic user interface tool that was previously developed to build scan jobs with simple nested loops logic. It aims for general use and thus retains a simple design. It can be commissioned if needed.).
Applsci 11 01216 g003
Figure 4. An example of motor grouping, the pseudo-motors for guide operation in the collimation system.
Applsci 11 01216 g004
Figure 5. The diagram shows that the sample-to-detector distance combines the sample-to–silicon window offset and the actual detector motor position to form a controllable pseudo-motor.
Applsci 11 01216 g005
Figure 6. The Q-Range Planner.
Applsci 11 01216 g006
Figure 7. The workflow laid out by different tabs in the Panel Scans interface (details on the workflow tabs are presented in the Supplemental Materials).
Applsci 11 01216 g007
Figure 8. Friendly table view and visualization of Q-ranges (highlighted by the upper red rectangle box), scripting snippets generating with Q-range configurations selected (lower red box). The example shows up to four Q setups at the same time.
Applsci 11 01216 g008
Figure 9. An example of the Python script used in Scripting Tool to control the magnet, cryostat temperature, and polarization for a highly flexible experiment.
Applsci 11 01216 g009
Figure 10. The SANS data processed over the time course of an experiment showing the rapid precipitation in a novel alloy under heating. On the left side, each slice along Q is a traditional Intensity vs. Q curve in SANS (the intensity is in cm−1). On the right side is the temperature of the sample environment over time, also recorded as the event mode data.
Applsci 11 01216 g010
Publisher’s Note: MDPI stays neutral with regard to jurisdictional claims in published maps and institutional affiliations.

