Article

A Systematic Approach for Evaluating the Adoption of Additive Manufacturing in the Product Design Process

by
Roberto Raffaeli
1,*,
Jacopo Lettori
1,
Juliana Schmidt
2,
Margherita Peruzzini
2 and
Marcello Pellicciari
1
1
Department of Sciences and Methods for Engineering, Università degli Studi di Modena e Reggio Emilia, via Amendola 2, 42122 Reggio Emilia, Italy
2
Department of Engineering “Enzo Ferrari”, Università degli Studi di Modena e Reggio Emilia, via Vivarelli 10, 41125 Modena, Italy
*
Author to whom correspondence should be addressed.
Appl. Sci. 2021, 11(3), 1210; https://doi.org/10.3390/app11031210
Submission received: 28 December 2020 / Revised: 20 January 2021 / Accepted: 25 January 2021 / Published: 28 January 2021
(This article belongs to the Special Issue Design for Additive Manufacturing: Methods and Tools)

Abstract

:
Additive Manufacturing (AM) technologies have expanded the possibility of producing unconventional geometries, also increasing the freedom of design. However, in the designer’s everyday work, the decision regarding the adoption of AM for the production of a component is not straightforward. In fact, it is necessary to process much information regarding multiple fields to exploit the maximum potential of additive production. For example, there is a need to evaluate the properties of the printable materials, their compatibility with the specific application, redesign shapes accordingly to AM limits, and conceive unique and complex products. Additionally, procurement and logistics evaluations, as well as overall costs possibly extending to the entire life cycle, are necessary to come to a decision for a new and radical solution. In this context, this paper investigates the complex set of information involved in this process. Indeed, it proposes a framework to support and guide a designer by means of a structured and algorithmic procedure to evaluate the opportunity for the adoption of AM and come to an optimal design. A case study related to an ultralight aircraft part is reported to demonstrate the proposed decision process.

1. Introduction

In the last few years, Additive Manufacturing (AM) has become an actual manufacturing option and many industrial applications clearly show it is able to overcome and substitute traditional processes such as machining or various forms of forming technologies [1]. Even if the AM process is usually more expensive compared to other traditional technologies and suffers from thermal stresses and deformations, it can be advantageous when the design of the components can benefit when highly optimized performances are required, such as light weight, complex shapes, parts number reduction, first-class structural or thermo-fluid dynamic performances [2].
Traditional technologies, i.e., milling, casting and forging, are employed following consolidated and well-known Design for Manufacture and Assemblies (DFMA) principles aimed at guiding engineers and designers to develop product shapes that facilitate the manufacturing and assembly processes, thus reducing production costs and times [3]. Focusing on products’ geometry and characteristics, AM allows a strong customization of shapes at different measurement scales (i.e., lattice structures) and the possibility to obtain custom graded and composite materials by depositing different type of materials in different patterns, thus optimizing the part characteristics. Design objectives stress the minimization of the overall product volume, thus reducing material consumption, production times and costs. Additional issues are related to the part orientation in order to minimize the support volumes. Additional problems that must be faced are the development of optimal designs combining some novel CAD modelling functionalities with process simulation tools [4], the application of proper post treatments, and the estimation of realization times and costs. Therefore, the designer must cope with a wide set of information and knowledge to approach AM in an optimal way, considering that the full leverage of given possibilities is often reached with a complete rethinking of the existing solution, possibly starting from its functional structure [5,6].
The evaluation of the opportunity to design a part for AM could be time consuming and finally lead to the conclusion that it is impractical. Conversely, some opportunities could be missed since the advantages of a different manufacturing process are not considered. In this context, the main contribution of this paper is to provide a holistic approach composed of four main evaluation phases of increasing complexity: Preliminary Analysis, Potential Analysis, In-depth Analysis and Cost Assessment. These phases are aimed to support the designer throughout the product development in a structured and efficient way, starting from selecting parts which are suitable to this production type, required material, up to the steps to obtain a final geometry compliant with the chosen technology.
The paper is structured as follows: Section 2 presents a revision of constraints and opportunities provided by AM in the literature for the early assessment of related design opportunities, as well as related background; Section 3 presents an approach to support decision-making for the development of new products and for the redesign of existing parts; in Section 4 the approach is then applied on a test case; finally, conclusions and future works are outlined in Section 5.

2. Background Work

2.1. Adoption of AM in the Industry

The adoption of AM in the industry is becoming significant and it is pushed by the Industry 4.0 digitalization trend [1,7,8]. The benefits offered by this technology will continue to grow with the efficient processing of digital data for process and product improvements, especially when low production quantities or sophisticated geometric shapes are required [9]. The fast evolution of technical solutions, as well as the expiration of principal patents, has enormously expanded the choice on the market of systems for each process type.
A few different knowledge related spaces need to be considered and faced for an effective application in companies. The first area concerns technology awareness. AM techniques have been classified by the type of process, by how the final construct is obtained and by the source of energy which is used for the phase change of the raw material. Seven categories have been defined so far according to the deposition method used to build the parts, i.e., VAT Polymerization, Fused Deposition Modelling, Powder Bed Fusion (PBF), Sheet Lamination, Material Jetting, Direct Energy Deposition and Binder Jetting [10].
Secondly, the possible application fields to be identified in the specific business being run can be recognised in:
  • Structural components, whose goal is to maximize stiffness while reducing weight;
  • Products that need a complex and specific shape, aimed at increasing fluid dynamic efficiency or temperature distribution, such as in conformal cooling;
  • Rapid tooling, using additive techniques to produce tools for other parts, for instance moulds;
  • Parts where high customization is required, such as in fashion or biomedical prostheses and braces requiring lattice structures and specific superficial texturing [1];
  • Prototypes, which are used for physical design evaluations, even if the production of the final product uses other techniques.
Even though AM machines are already used on the shopfloor to produce prototypes and complex parts, they are still not applied systematically and extensively. Like any other production system, AM presents strengths and limitations [11], as summarized in the following Table 1.
Finally, some design organization issues must be faced. In fact, the wide and mostly unexplored design space that AM offers is a very attractive landscape for the industry. However, the complexity and novelty of reasoning patterns could result in significant factors to impede the implementation of AM techniques in practice.
Leaving the design teams to evaluate the possibilities of adopting AM technology based on subjective and unstructured considerations may lead to skewed considerations and a loss of opportunities. Designers have reported that, in many cases, extensive evaluations and design attempts have concluded without feasible solutions. Such failures have had a negative impact on the management due to the poor rate of success in AM adoption. In particular, design leaders complain about [13,14]:
  • The effort required to identify the right components to be redesigned;
  • The effort required to obtain new designs which need to face novel geometric shapes and careful structural and thermal simulations;
  • The variability of metallurgical properties of 3D printed materials makes the quality and reliability of new products uncertain;
  • Necessity of dealing with a new supply chain and the relative logistic aspects.
The method presented in the paper aims to provide a framework to systematically operate in such a complex environment.

2.2. Review from the Literature of Decision Methods in AM Adoption

A design process targeting AM consists of a digital dataflow that precedes the transformation of the raw materials into final parts [1]. The development of complex and organic shapes is based on traditional geometric modelling in CAD systems, even if new emerging tools and Topology Optimization (TO) systems are also used for this purpose [15]. The 3D CAD models are exchanged with other tools using STL, or better, by AMF, 3MF, STEP and STEP-NC formats, which are all geometric exchange file formats which provide appropriate set of data [16]. Simulations with specific Computer Aided Design (CAE) software are usually necessary to foresee manufacturing distortions due to thermal effects and improve the surface quality by operating on part orientation and production parameters. Then, slices and the tool paths (G-CODE) are generated and sent to the machine. At this stage, it is possible to manage further parameters to optimize the geometric, finishing, and mechanical characteristics of the final piece. Post processing activities, such as post-curing, cleaning, successive machining, and treatments, must be carefully assessed since they strongly influence the resources needed to obtain the parts.
The depicted workflow reveals that, at an early stage, there are many heterogeneous aspects a designer must consider and anticipate when deciding to adopt AM. Before starting such activities and investing considerable time, the design requirements must be carefully assessed against the possibilities and constraints given by the manufacturing technology to finally succeed in the AM adoption. In this context, Design for Additive Manufacturing (DFAM) guidelines [17] and some related standards [18,19,20] are just at the beginning and more studies are needed to obtain a more complete view [21]. Design methods and tools are needed whereby functional performance and/or other key product life-cycle considerations such as producibility, reliability, validation and costs can be optimized and subjected to the capabilities of AM technologies [17]. In the industrial practice, the absence of clear DFAM patterns and guidelines often still results in occasional and unstructured usage of AM at the design stage. Additionally, there are only a few software programs that fully support the specific AM digital process, since most tools cover just limited aspects of the whole process, such as geometric modelling or thermal distortion simulations.
Moreover, there are a few procedures to establish that a product is manufacturable with additive techniques. As a matter of fact, there are numerous product development approaches in the literature for various design contexts. Additionally, tools have been developed to support the designer to select the most suitable approach according to requirements [22]. However, there is a need to develop specific tools for AM product design in order to guide engineers and designers to understand this novel production method. For example, Kumke et al. [23] have developed a modular framework on the basis of VDI 2221 aimed at guiding designers throughout product development in an AM context. Lindemann et al. in [24] have developed a Trade-Off Methodology (TOM) matrix that guides designers and engineers to understand which products should be redesigned to exploit the advantages of AM. Additionally, Klahn et al. [25] have developed a tool to evaluate the suitability of products to be produced with additive technologies by using four criteria: integrated design, individualization, lightweight and efficient design. However, according to [2], a holistic framework in an AM perspective aimed at guiding the engineer or designer throughout product development is still missing, guaranteeing process optimization, thus minimizing material waste and costs. Furthermore, the theme of sustainable design [26,27], a topic of high interest nowadays, needs to be embraced.

2.3. Multi Criteria Decision Methods as a Formal Support to an Objective Design Process

In the context of fostering the spread of AM applications, it is beneficial to help designers understand when and how to adopt AM technologies to improve designs with better performing and cost-saving solutions. There is a need for a broader and holistic assessment that includes diverse aspects, as well as the possibility of adopting different and new design principles. The discipline of DFAM targets the geometric shape definition phase, while additional efforts are needed to fully understand the potential of AM in an earlier stage, when multiple, conflicting, and often fuzzy requirements must be evaluated. Therefore, to define a structured evaluation workflow to assess the design opportunities, decision-making approaches must be considered.
Multi Criteria Decision Analysis (MCDA) [28] is the discipline aimed at supporting the decision-maker while operating with numerous and conflicting evaluations, allowing them to obtain a compromise solution in a structured way [29,30]. Contrary to numeric simulation tools, which rely on precise quantities, MCDA is better suited to weight subjected, discrete or fuzzy evaluations.
Scarce applications of such methods in early AM design phases are found in the literature. Among them, in [31] the authors have used the Analytical Hierarchical Process (AHP) procedure to rank the most appropriate technologies and machines. Another study in this sense was developed by Zaman et al. in [32], where the authors have introduced a generic decision methodology to provide a set of compromised AM materials, processes, and machines and to guide designers to achieve feasible material–machine combinations from a current database of AM vendors in the world.
Weighted Sum Model (WSM) and AHP appear to be able to support the qualitative and quantitative analyses required by the scope of this paper. The two approaches are briefly recalled here. The AHP method is based on a series of pairwise comparisons between a set of criteria, giving them a score of relative importance and assigning percentage weights [33]. An example of the values for the pair evaluation is reported in Table 2 below.
Subsequently, a matrix nxn is constructed, where n is equal to the number of criteria to be compared. Supposing that n = 3 (D1, D2 and D3), the matrix has the following construction (Table 3):
In Table 3 X is the relative importance value of D1 compared to D2, Y is the relative importance value of D1 compared to D3 and Z is the relative importance value of D2 compared to D3. To calculate the vector of the percentage weights to assign to each driver, it is enough to determine the maximum eigenvalue λ and the relative eigenvector Vλ of the matrix [32]. Normalizing the eigenvector Vλ so that the sum of its elements is equal to 1, the vector of the percentage weights or priorities relating to the driver Di is obtained. Once the priority vector has been determined, it is fundamental to understand the quality of the pairwise matrix, measuring the consistency of the decision-maker’s subjective judgments. To this aim, the Consistency Index (CI) is defined as (Equation (1)):
C I = λ n n 1 ,
Finally, the Consistency Ratio (CR) is defined as follows (Equation (2)):
C R = C I R I ,
where RI is the Random Index, which is a value that depends on the number of criteria as explained in [33]. For n > 4, the pairwise matrix is consistent if CR is lower than 0.1.
On the other hand, the WSM is used to find the best solution among those available, thus solving a decision-making problem. Here, the criteria values (aij) are multiplied by the weights calculated with AHP (wj), and finally the sum is performed for each alternative (Ai), as in Equation (3). The criteria values should be normalized to have the same unit [34].
A i = j = 1 n w j × a i j ,  

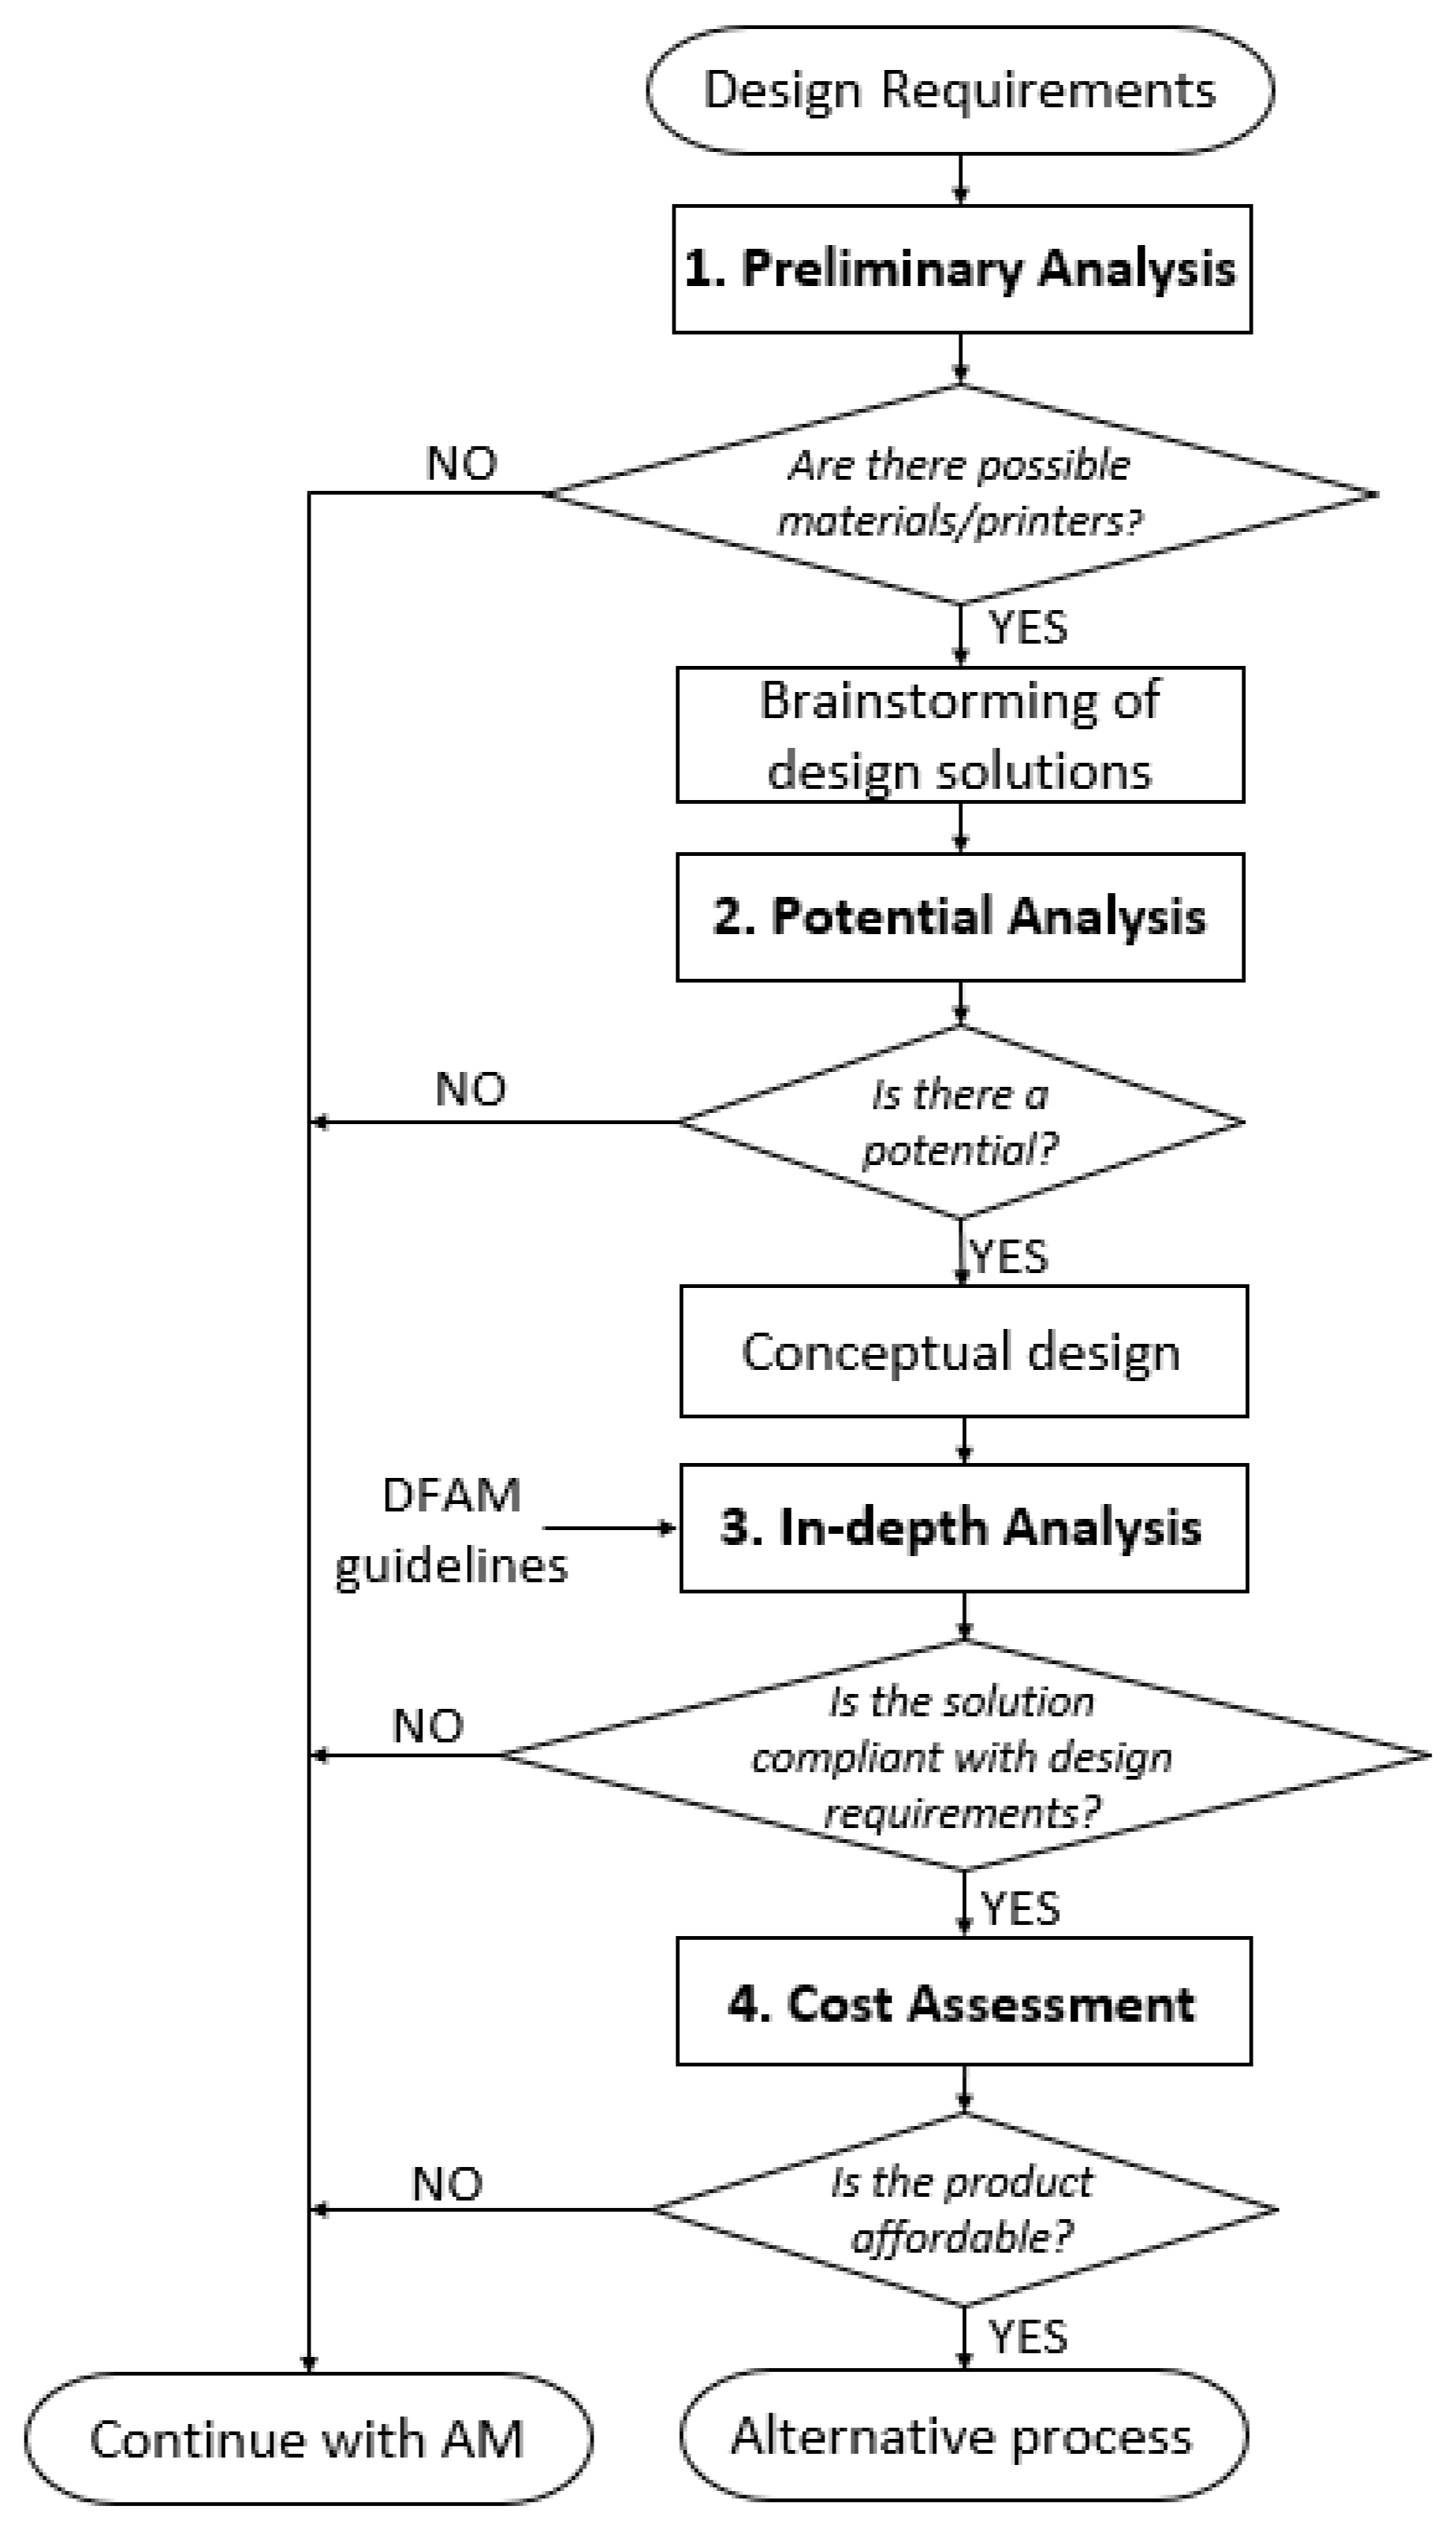
3. Methodology and Guidelines

As anticipated above, it is desirable to guide the designer to select suitable candidates for AM efficiently, reducing wasted time during more complex phases for unattractive products. Therefore, the main goal of this paper is to provide guidelines which are framed in a general framework to support designers, even the less experienced, to better understand the potential offered by additive technologies in a given design context. The framework acts as a foundation of specific step guidelines, which are defined on an algorithmic basis to also be implementable in a software supporting tool.
The proposed framework is presented in Figure 1; it is framed in a systematic process [35], even if it presents its specificities. It can be applied both in the case of new design or redesign of an already existing product. A decision-making process has been defined to select feasible candidates and then progressively move on to further analysis, only if the previous phase has succeeded. Specifically, the process is composed of four main phases which are explored in the following sections:
  • Preliminary Analysis;
  • Potential Analysis;
  • In-depth Analysis;
  • Cost assessment.
Figure 2 reports an example of the timeline required to accomplish each step. The times have been collected by the authors based on some informal interviews with designers who have had experience in designing parts for AM in their companies in the field of machined parts of limited size. The observation of the timeline, even if referring to a particular product category, highlights the necessity of tackling the design activities in a systematic manner, quitting the process as soon as the solution spaces become empty.
In the following sections, each step of the proposed approach is presented in detail, providing specific application guidelines.

3.1. Design Requirements

The process moves from a collection of basic facts and main design requirements of the product under analysis. Table 4 reports a selection of possible data to be gathered, many of them being optional depending on the application.
Generic numbers and information are sufficient at this stage, also in the form of expected values or possible ranges. More precise parameters and requirements will be defined or refined in successive evaluation steps. It is important to point out that the table can be adapted, expanding or reducing the requirements, according to the specific application field.

3.2. Preliminary Analysis of AM Constraints

Following the flow in Figure 1, the next step of the process is the Preliminary Analysis, which is a rough examination of main manufacturing constraints to exclude unfeasible applications. Three aspects have been identified as overwhelming limitations that could impede the usage of AM. Even if the three evaluations can be regarded as subjective and depending on the evolution of the technologies, it is reasonable to evaluate them early and to skip the process from the beginning if one of them cannot be surely met by the application:
  • Lack of a material with some mandatory properties;
  • Excessively large or small product dimensions for currently available technologies;
  • Excessively large production batches.
In Figure 3, the sub-steps of the Preliminary Analysis are presented:
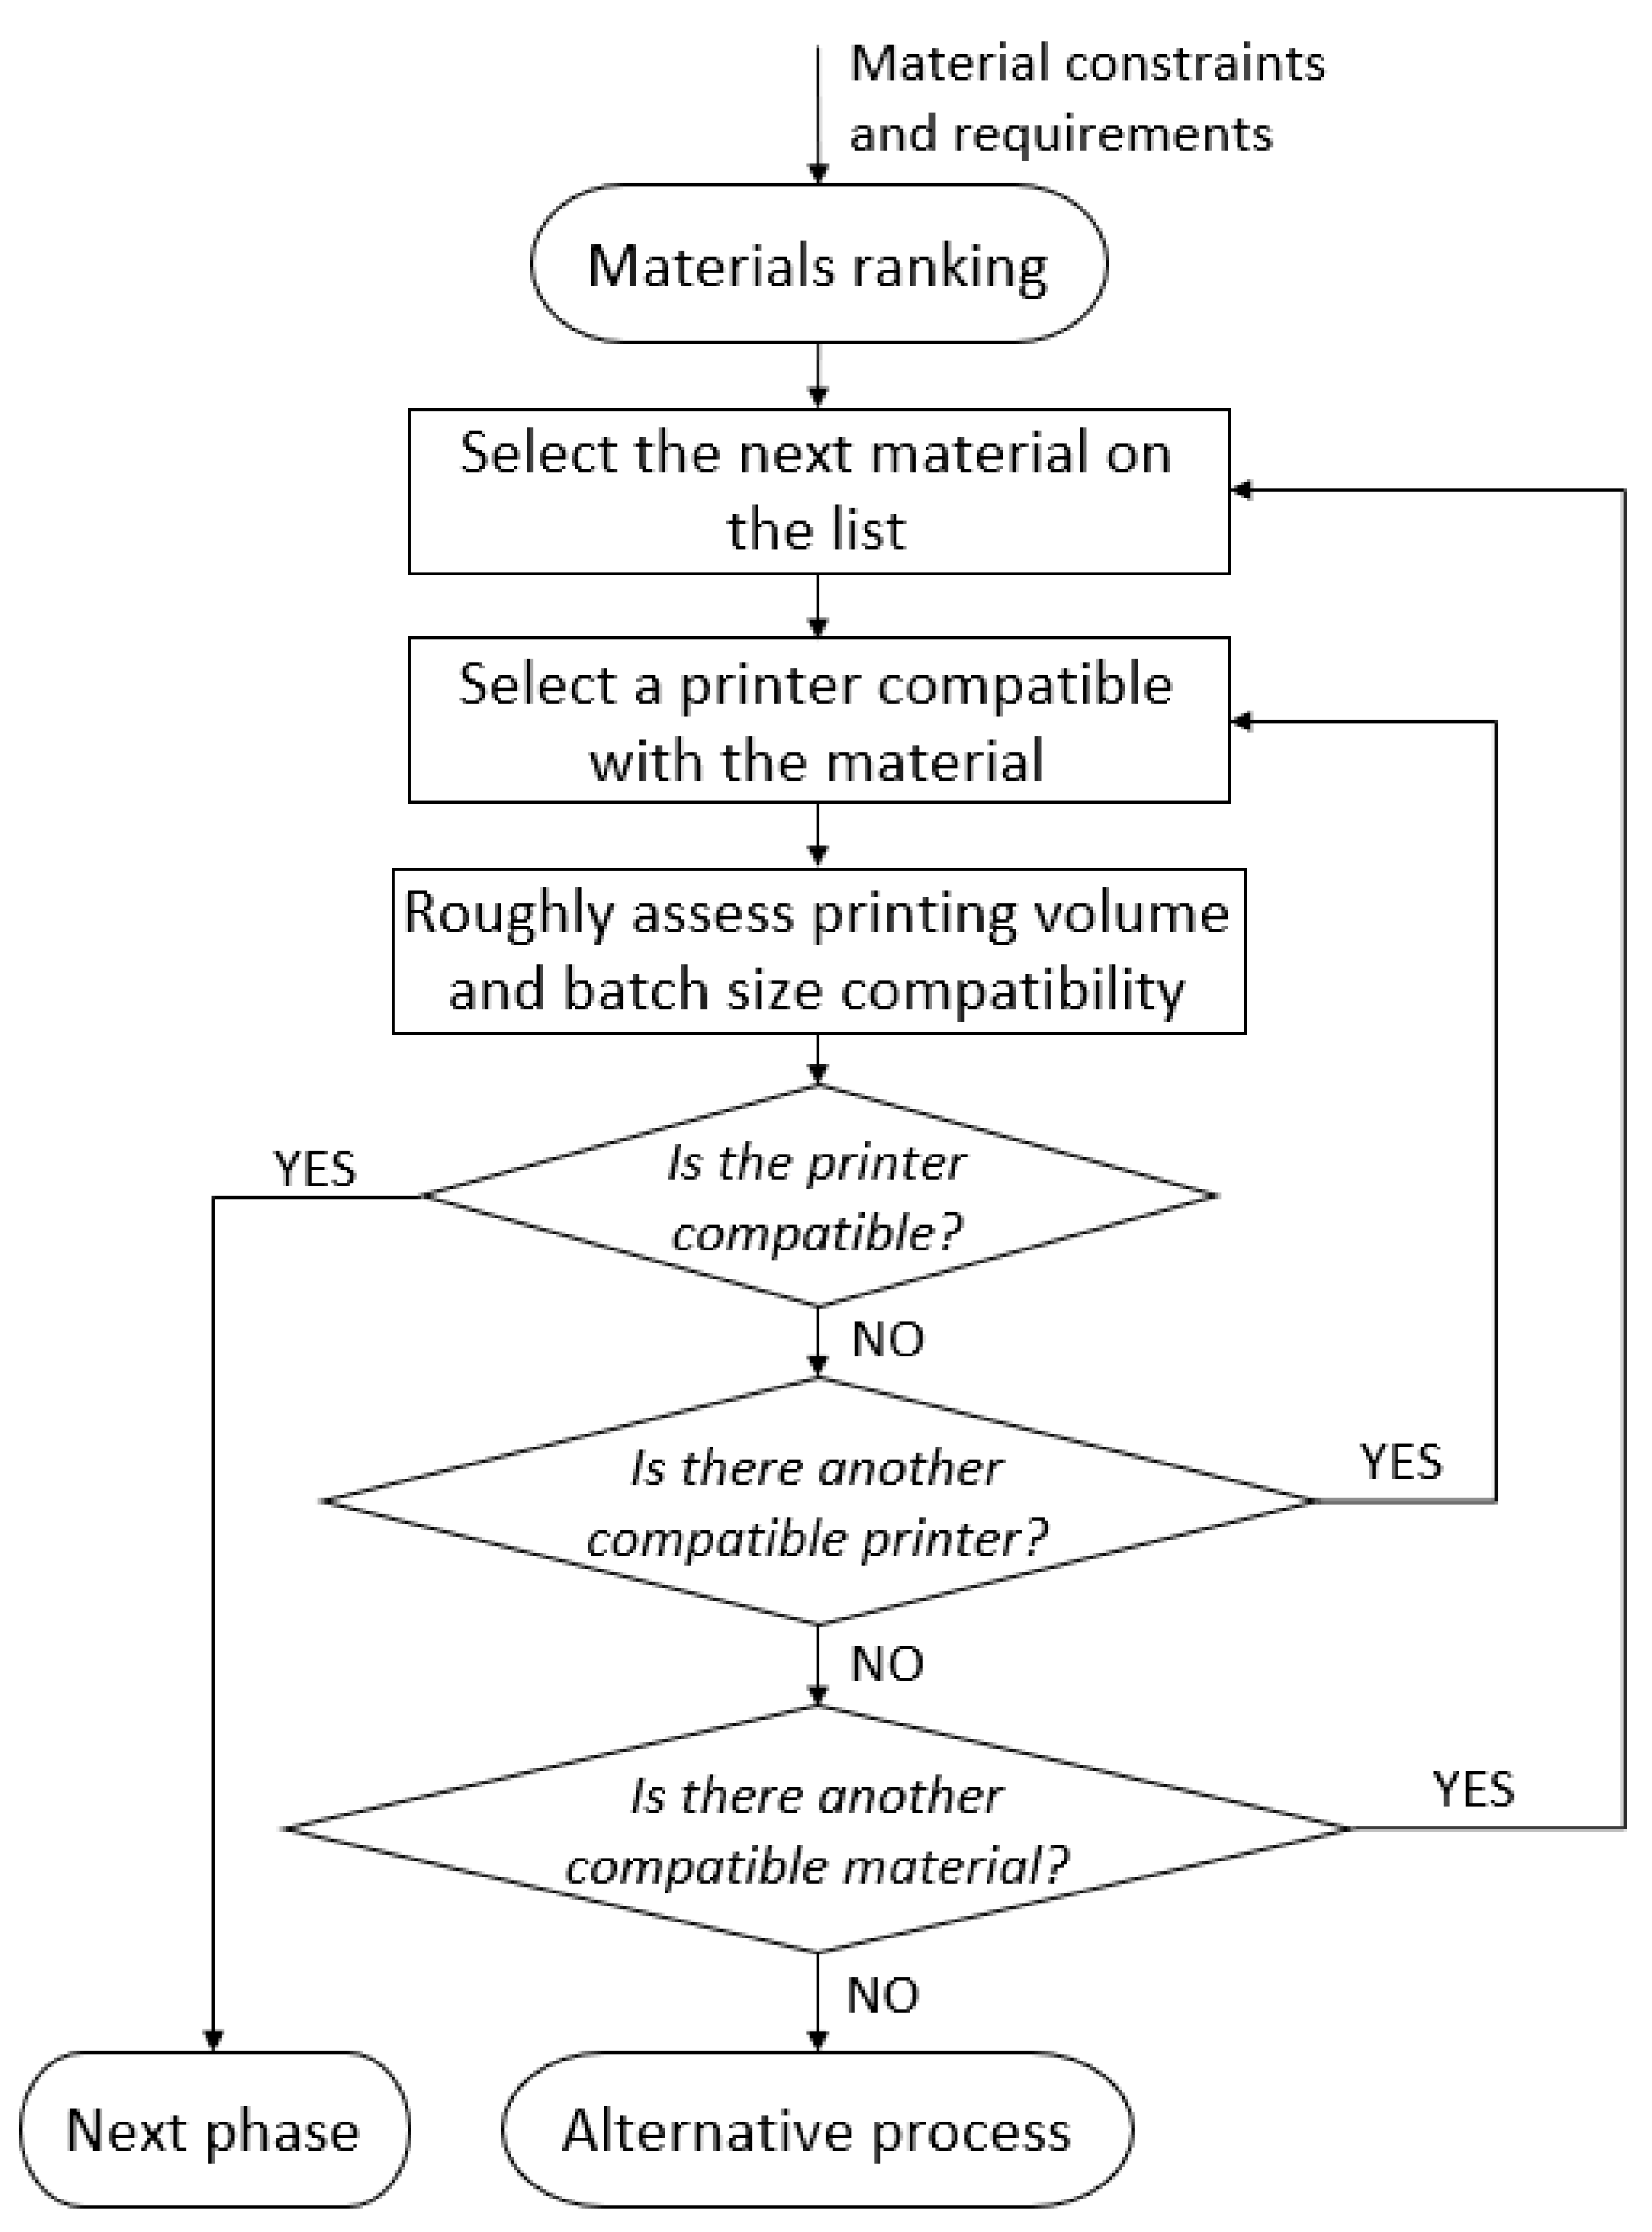
  • Screening of materials compatible with the given constraints (i.e., minimum stiffness, minimum yield strength, electric conductibility, etc.);
  • Computation of a set of indices according to Ashby [36] for each compatible material;
  • Definition of index weights using AHP and computation of an overall Compliant Index (CI) for each material through WSM normalization;
  • Materials ranking;
  • Selection of possible printers proceeding in the sorted list of materials;
  • Check of printer capabilities according to required volume and batch size.
Therefore, the first step is to identify suitable materials out of a list. The materials database is built from data provided by technology suppliers, mostly available on the web [36], where the value range of properties of available materials is reported. It is possible that only a few or no materials are compatible if numerous and strict constraints are imposed, making AM an impractical solution for the imposed requirements.
A list of seven indices, drawn from Ashby [37], are suggested to evaluate the materials. The selected indices are:
  • I1 = σr/ρ
  • I2 = σy/ρ
  • I3 = σf/ρ
  • I4 = E/ρ
  • I5 = E^(1/2)/ρ
  • I6 = σy/(ρ*C)
  • I7 = E/(ρ*C)
where σr = ultimate tensile strength (N/mm2), σy = yield strength (N/mm2), σf = fatigue strength (N/mm2), E= yield modulus (GPa), ρ = density (kg/cm3), C = raw material cost (EUR/kg).
The first four indices are related to the mechanical performance of the material, the fifth index refers to the vibration behaviour, while the last two indices consider the cost. The relative weight of the indices must be assigned by the user according to company production range and company strategy. Such indices are normalized to calculate a CI for each material through the WSM. The index weights are determined by the AHP method according to design strategies. Then, the materials are ranked from best (high CI) to worst (low CI). This process is summarized in Figure 4.
Printers compatible with the selected material are then listed, verifying the production requirements relating to the volume of the product and the batch size. Additionally, the designer must consider the intrinsic material anisotropy of AM processes, the bounding surface weakness between two different materials [12] and the technology deposition maturity, thus selecting the most suitable printer. If no printer is compatible with the production requirements, the next material in the ranking is selected, repeating the check of the compatibility of available printers with the imposed constraints. A printer database is built for this purpose from data available on the web [36] or from supplier’s data. If a valid combination of material and printer is found that meets the defined requirements, Potential Analysis is performed.

3.3. Potential Analysis

The aim of this phase is to guide brainstorming around the product considering a list of design drivers. Each driver is given a score which is combined to compute an overall potentiality index. Fourteen drivers, D1 to D14, have been identified to evaluate the potentiality of an AM employment [2]. Table 5 presents the drivers and list guidelines, mainly considerations and clues, which have been gathered in the literature and from experts to foster the decision on a score to assign to each of them.
A value from 1 to 10 is required for each driver, where 1 corresponds to an irrelevant driver and 10 corresponds to a major driver for the product under development. The Potential Index (PI) is then calculated according to Equation (4):
P I = i = 1 14 D i × Q i 10 100 ,
where Di = weight of i-th driver, Qi = value assigned by the development team to the i-th driver.
The weights of drivers should be calculated using the AHP method, incorporating strategic views of the company. High index values correspond to a great potential of the part to be produced through AM. The PI threshold can be fixed by the user based on a trade-off analysis between the risk of losing opportunities and the need to develop deeper and costly analyses with the possibility of having poor results.

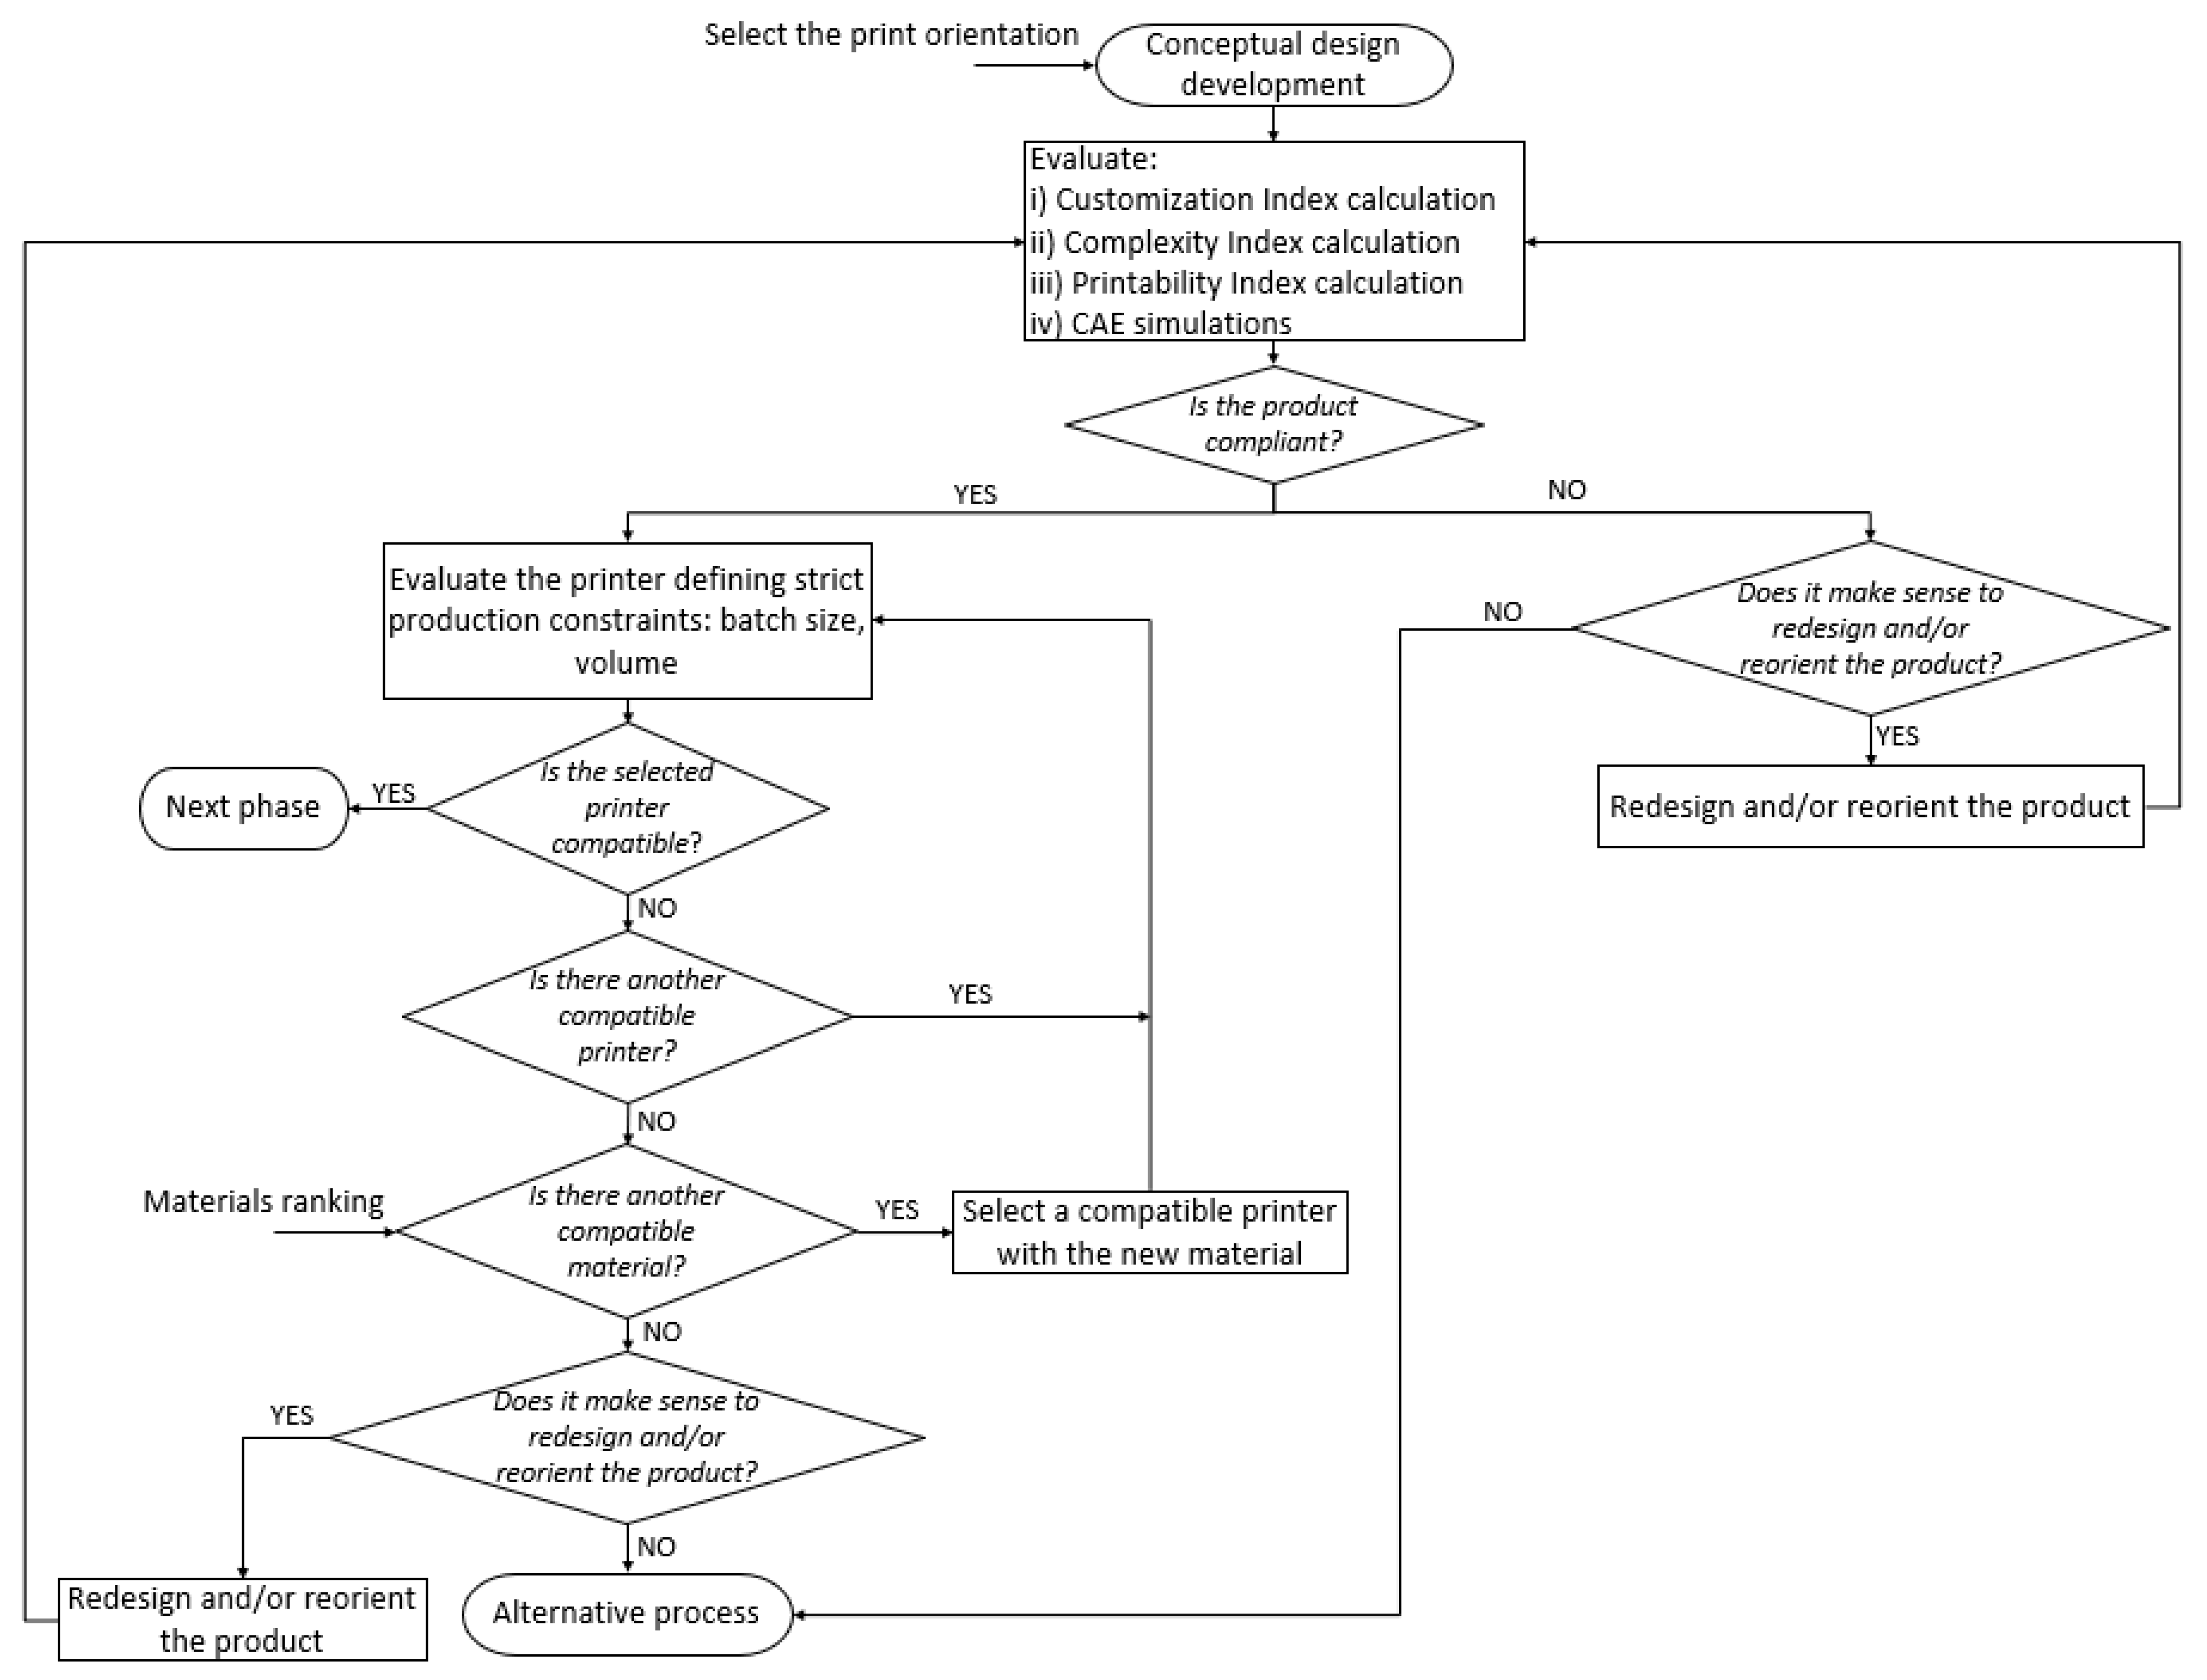
3.4. In-Depth Analysis

After the Potential Analysis, a preliminary design solution is required. In fact, deeper assessments on the manufacturability by AM and its convenience against other production systems follow a conceptual design of the product itself, at least at a sufficient level of geometrical detail. Generally speaking, the conceptualization phase is highly onerous in terms of time and work and impacts on the design department. So, before developing a conceptual design, it is advisable to discard unpromising ideas following the steps described above, thus focusing efforts only on the most attractive candidates. Therefore, the In-depth Analysis stage has been conceived to include the following evaluations (Figure 5):
  • Develop a conceptual design and its preliminary geometry;
  • Evaluate the geometry according to three indices: Customization Index, Complexity Index, Printability Index;
  • If necessary, refine the geometry or change the intended orientation of the part in the printer;
  • Accurately evaluate the manufacturing process on the selected printer by suitable numeric tools.
The conceived geometry, either by direct CAD modelling or TO tools, is then evaluated according to three indices that are strictly related to the designed shapes:
  • Customization Index: the term customization means the product development according to individual/personal specifications or preference. This index refers to the level of customization that the product must comply to satisfy the customer’s requirements, ranging from no customized products to truly unique parts [38,39].
  • Complexity Index: it assesses the complexity of geometries in relation to the difficulty of achieving the shape with AM competing techniques. For instance, in [40], the authors have developed such an index to calculate the shape complexity of cast parts.
  • Printability Index: it is composed of indices related to the limits of AM in obtaining certain geometric features [41]. For example, excessively bulk geometries can lead to distortions; too thin walls and too small holes are difficult to produce; cantilevered surfaces require supports which must then be removed. In Table 6, indices to be considered are summarized. The weights to balance the indices should be assigned accordingly to the specific needs and application context. Indeed, the Printability Index is closely related to the part orientation in the printer.
The first two indices are used to estimate the level of customization and complexity of the geometry according to standard technologies. The Printability Index aims to highlight the criticalities in the conceived design according to the main DFAM guidelines and common geometric limits of AM. Such an index allows the designer to identify changes in the geometry as well as more convenient orientations of the part.
At this stage, numeric simulations are required to verify the stress level in the part according to operating conditions and the peculiar characteristics of the metallurgic microstructure or the anisotropy induced by the layered deposition. Moreover, the thermal gradients usually arising in the process lead to residual stress, which must be carefully assessed with dedicated software tools which are consolidating in the market.
This process leads to a detailed and definitive geometry which allows more precise evaluations on the printing process. Parts nesting can be computed, and selected machine volume optimally occupied. Indeed, if more printers are available and compatible with the chosen material and part size, the optimal one can be selected by iteratively simulating the printing process and expected parts quality against the fixed requirements.
Ultimately, if there is at least one printer compatible with the production requirements, it is possible to move on to the last step of the workflow.

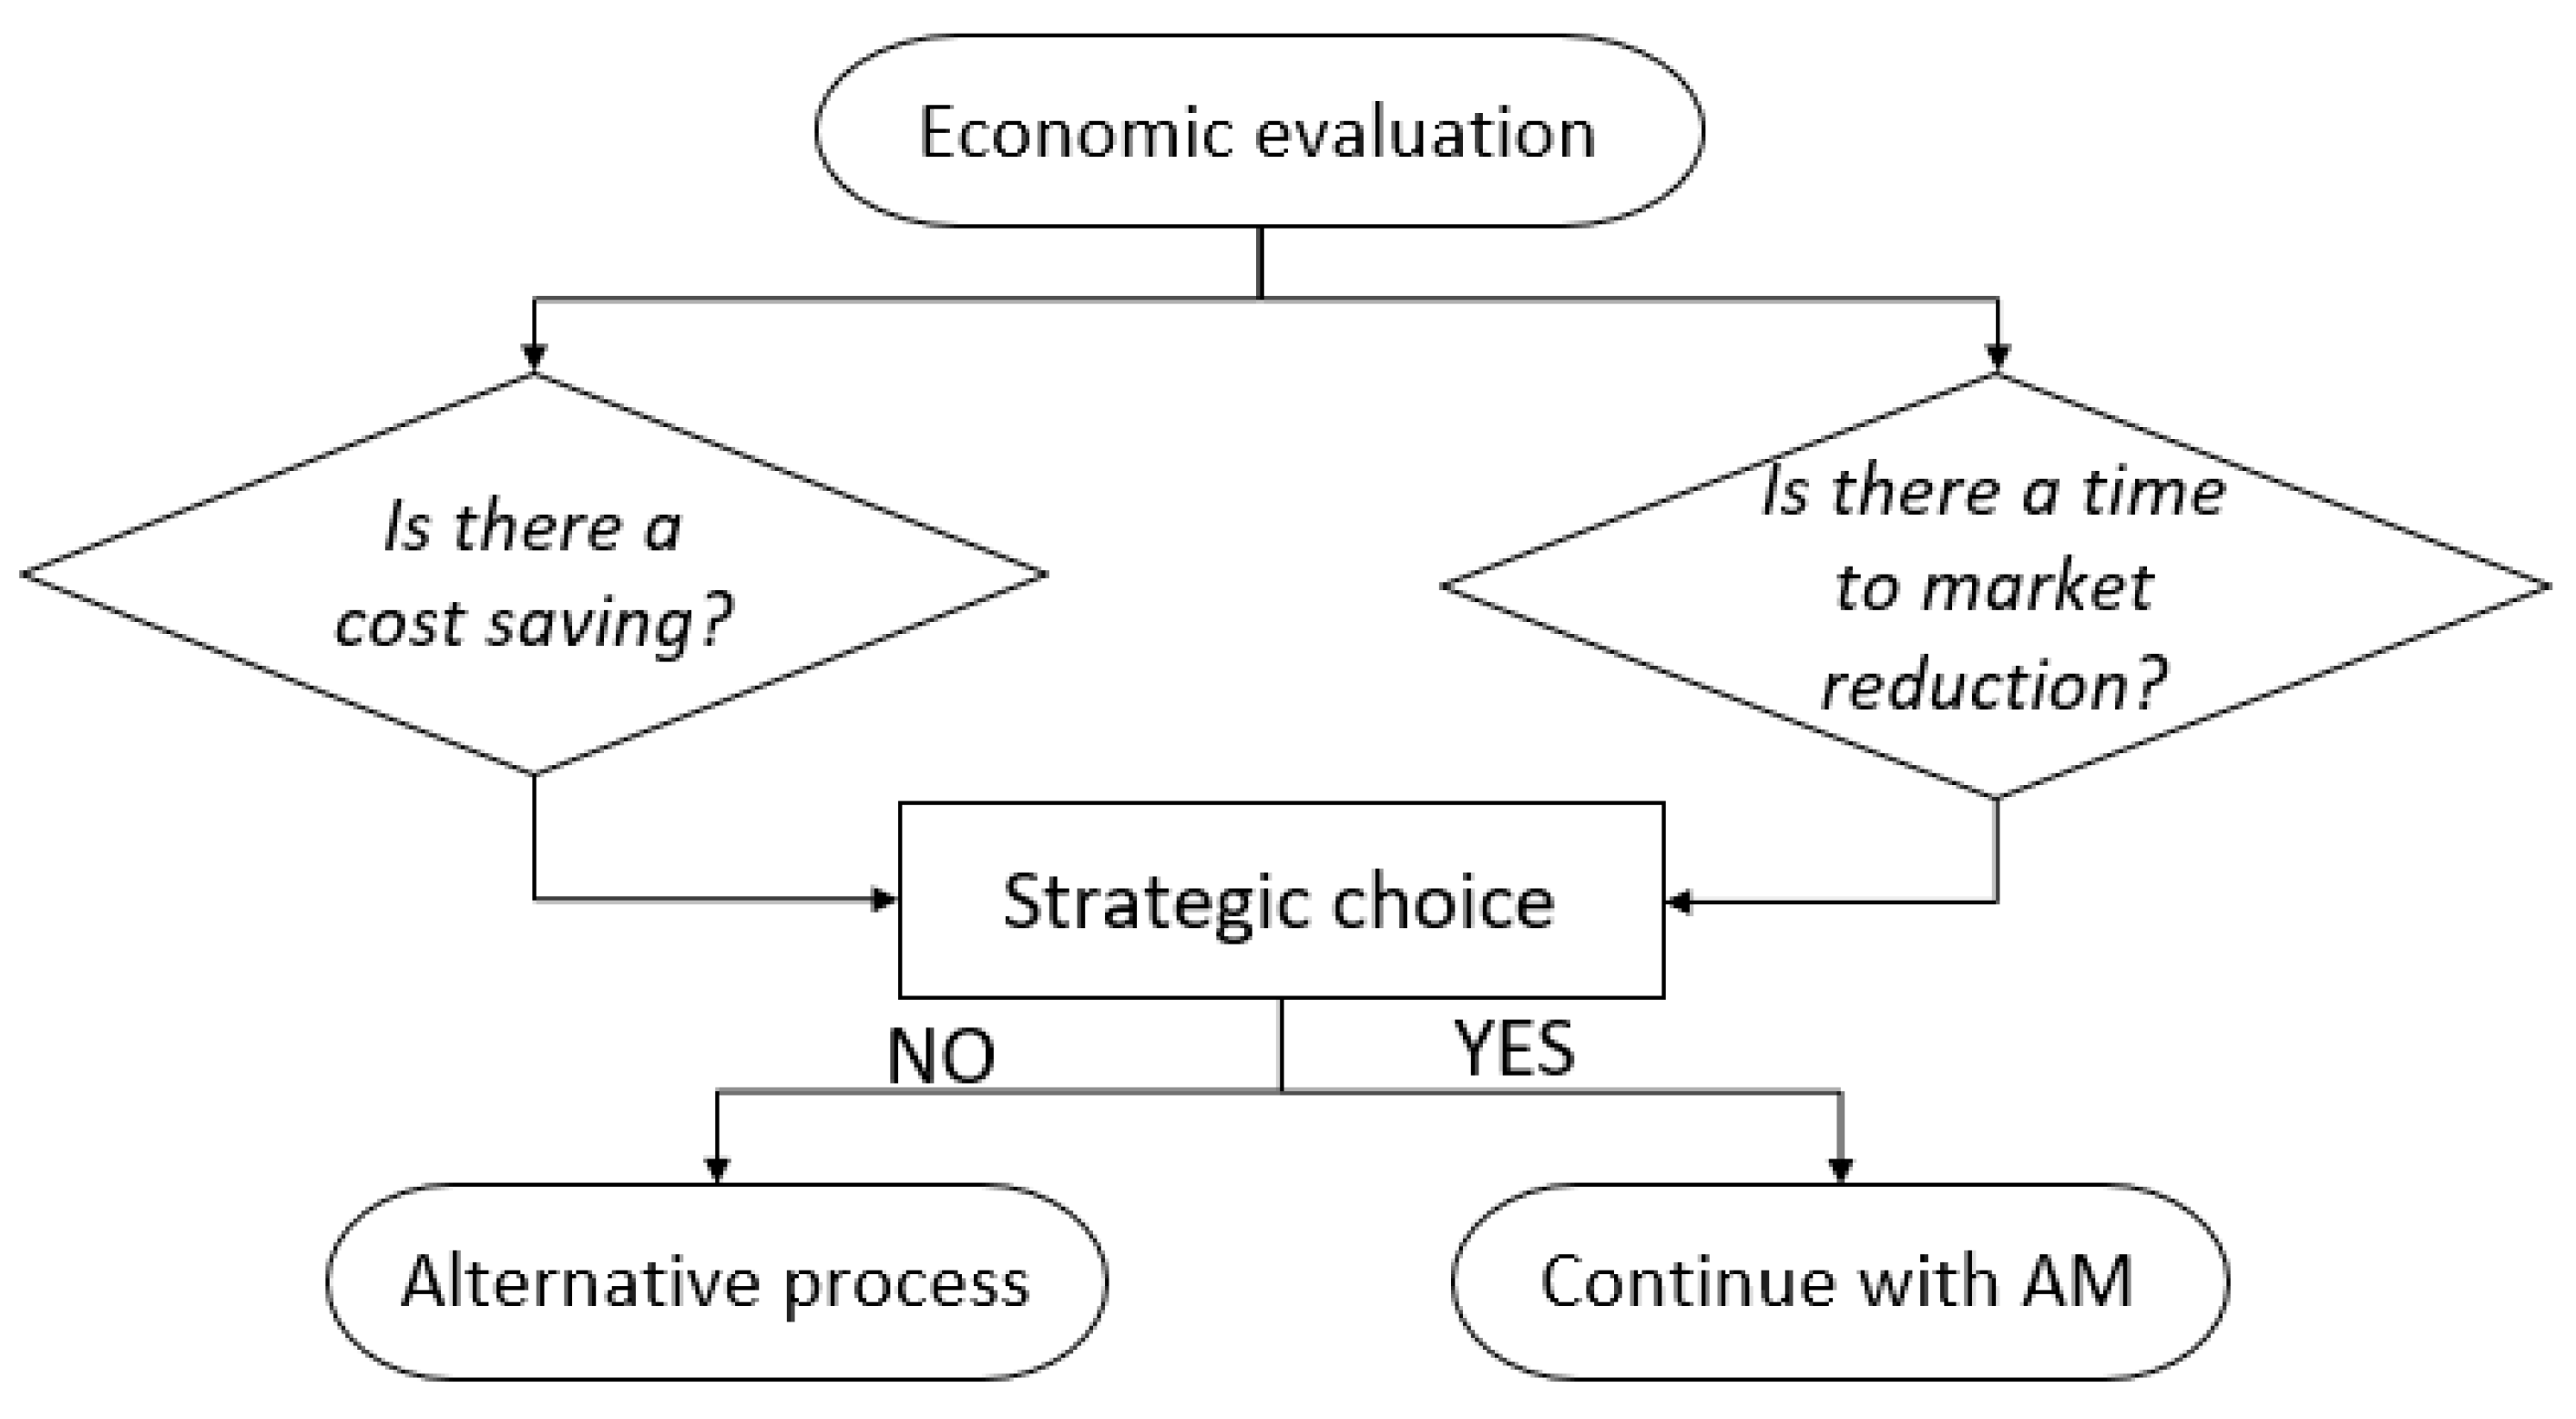
3.5. Cost Assessment
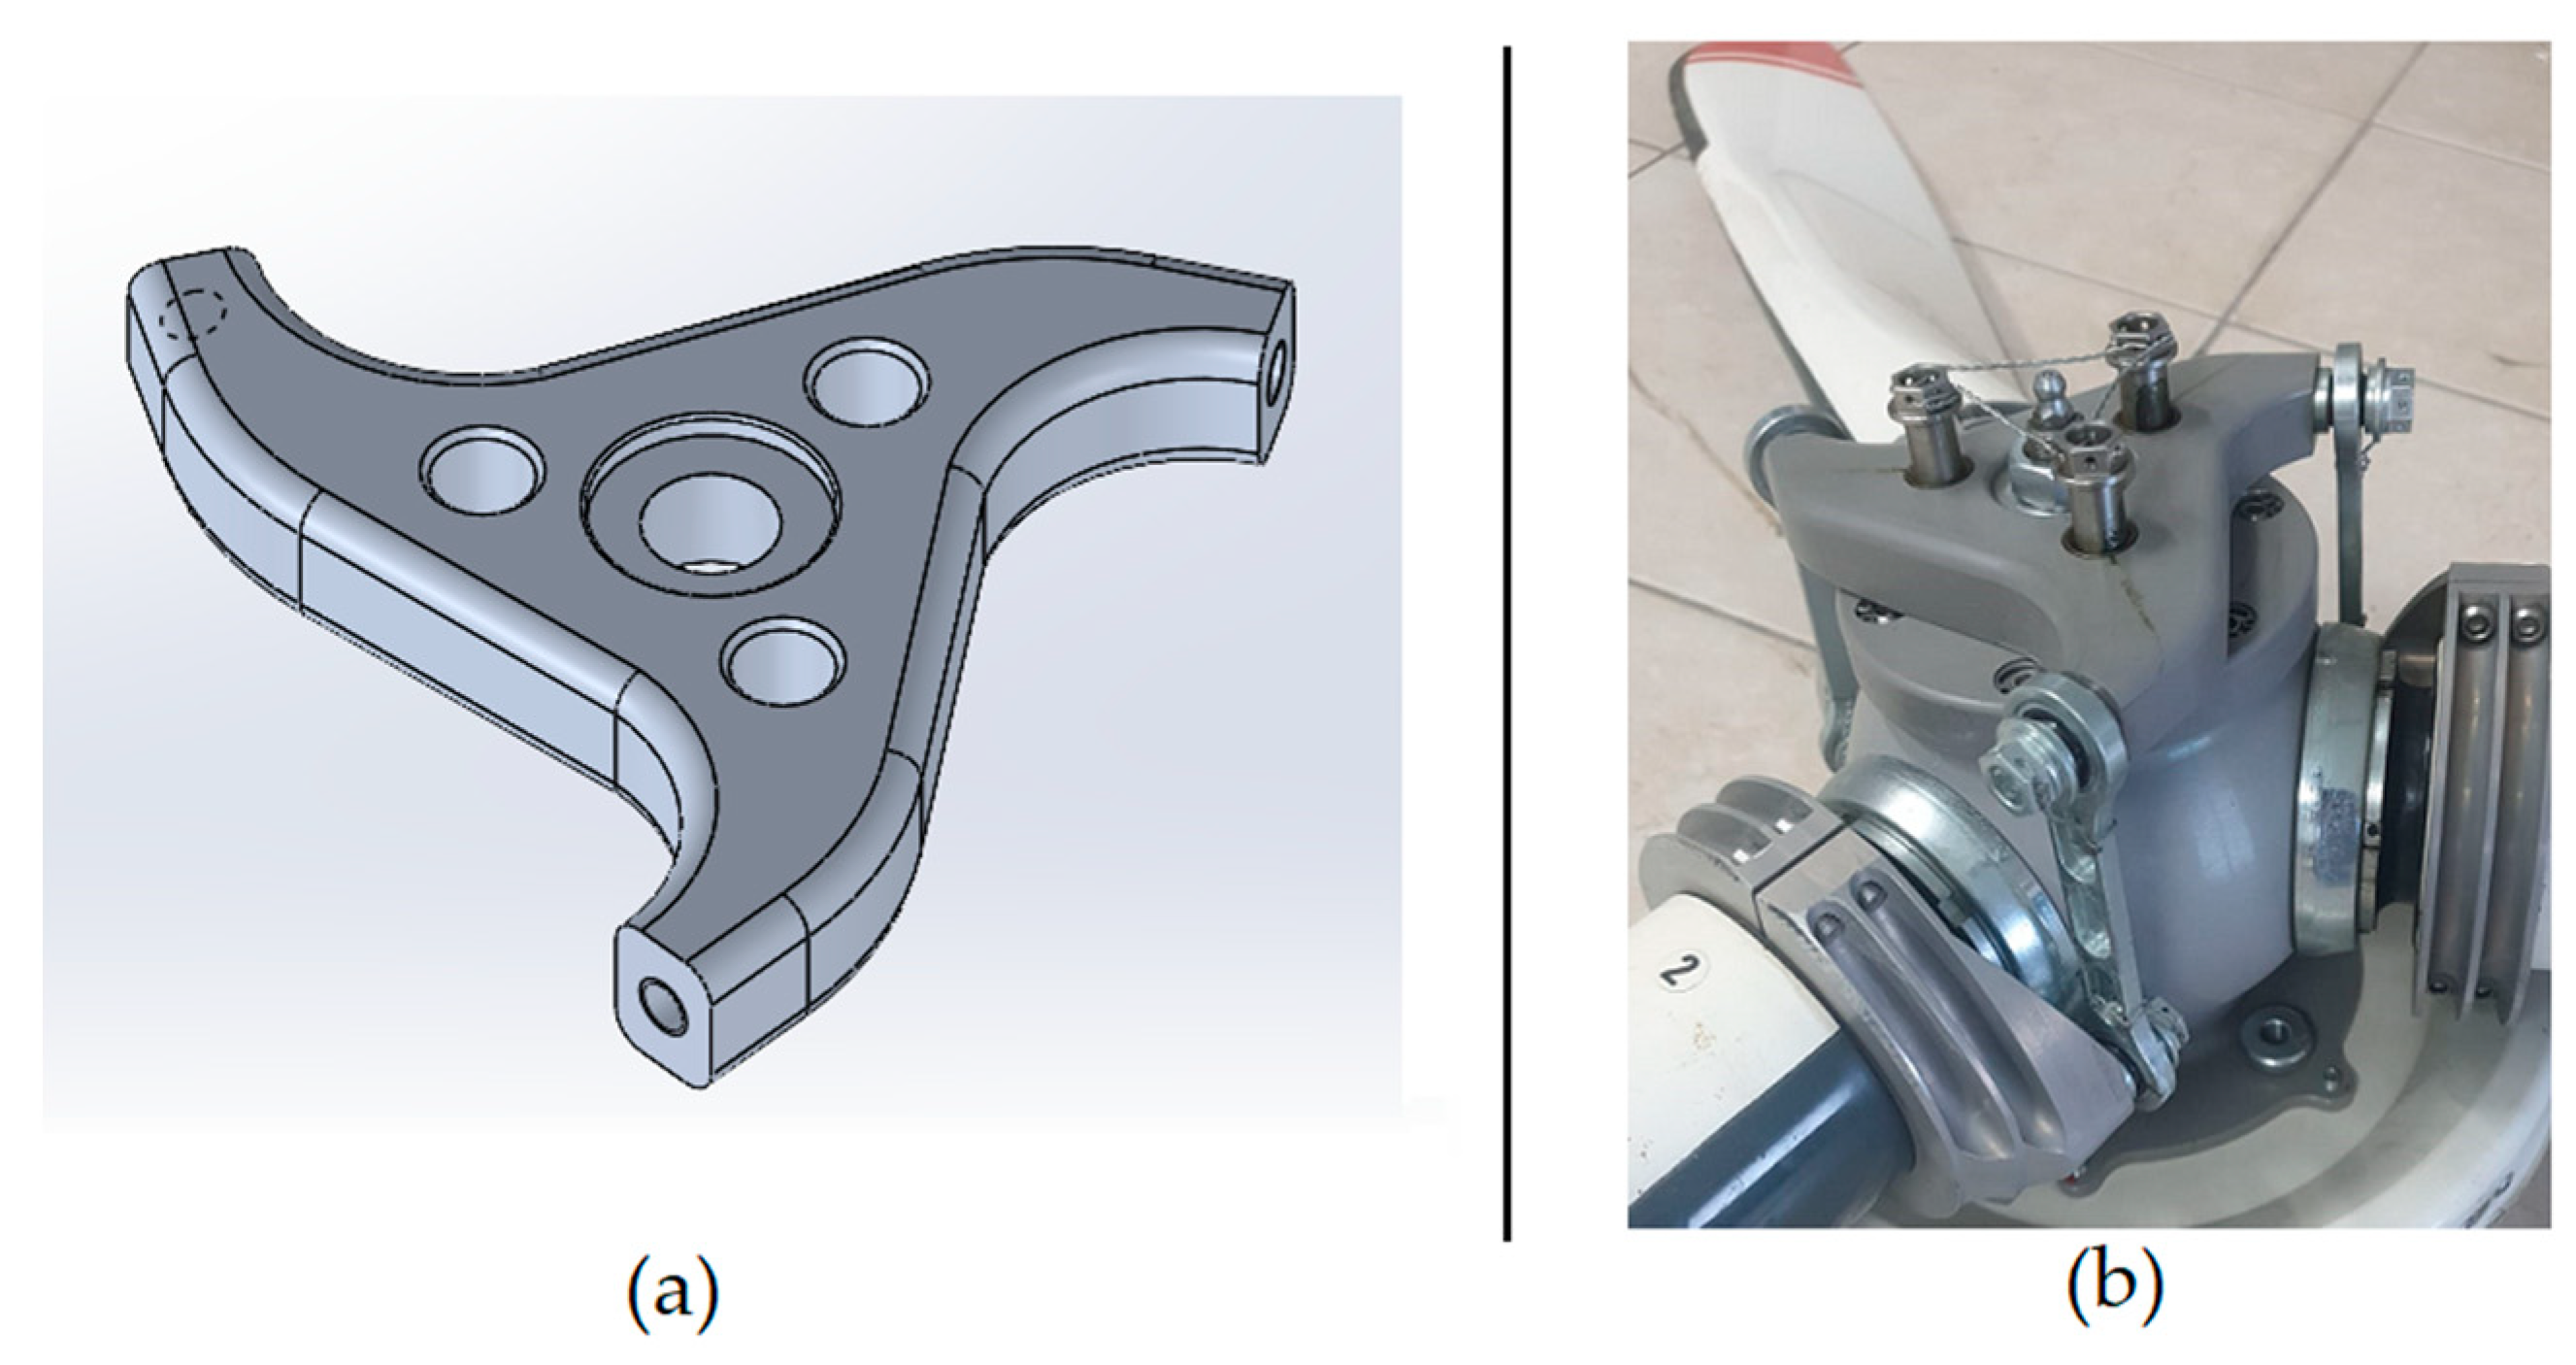
The final step of the proposed approach is an assessment of the reached design in terms of production and life cycle costs, possibly including additional considerations such as logistical aspects and production lead time. So, it is necessary to evaluate whether the use of AM leads to an overall economic advantage compared to other production methods. In Figure 6, the flow is represented. Here, the economic aspects are highlighted to understand if there is a saving in terms of costs and/or time-to-market. Strategic decisions must be taken by the company management in case of contrasting results.

4. Case study

In this section, the framework and relative guidelines are exemplified with a case study. An ultralight aircraft part called Propeller Pitch Controller (PPC) has been selected, and it is represented in Figure 7. Given the interest in parts obtainable by metal deposition, which are collected in the industrial field nowadays, a metal component has been selected to demonstrate the proposed design workflow. This product is assembled on the variable pitch aircraft propellers with three blades and it is connected through three connecting rods to them (Figure 7b). It allows the pitch of the blades to change thanks to a translation movement, thus regulating the provided engine thrust.
Analog design procedures could be applied in case studies employing plastic materials and technologies such as Fused Deposition Modelling or Stereolithography. Some considerations, requirements and data reported in the papers should be modified accordingly to the different application contexts and specificities.

4.1. Preliminary Analysis Application

As it is depicted in Figure 7, the PPC bears three main loads transmitted by the connecting rods. Three screws fix the part. The original material is aluminium alloy. In Table 7, all the features and the design requirements are summarized.
The three main initial constraints outlined in Section 3.2 are fulfilled by the specific application. Most of the constraints push the choice towards metals, mainly aluminium and steel, which are widely available as powders to be employed in PBF processes. The size of the part is limited and compatible with most of the printers. Indeed, the size allows multiple parts to be processed simultaneously, thus small batch sizes, as required, are definitely feasible.
The approach depicted in Section 3 has been followed for the PPC and the main results are reported here. The process has moved from the computation of the AHP pairwise matrix to assess the relative weights of the material selection indices (Table 8). The table was compiled with the help of the industrial partner and the resulting weights computed according to the AHP method are reported in Table 9.
Table 10 reports a part of the evaluated materials list, including the values of the selected material properties. So, the upper part of the sorted list of materials according to the computed CI is reported in Table 11.
Table 11 provides minimum and maximum values of the CI in consideration of the ranges of physical properties of the materials in the market.
The best choices for the PPC application are Laserform 17-4PH (heat treated) and LaserForm AlSi7Mg0.6 (direct aging). Following the formalized path, compatible printers need to be selected according to product dimensions and batch size. As already pointed out, many machines are compatible with the application. Considering the main manufacturers, some machines are listed in Table 12 to confirm the compatibility with the product geometry.

4.2. Brainstorming and Potential Analysis Application

The main goal of the PPC redesign process is the mass reduction. The new geometry could reduce the total weight of aircrafts which leads to a reduction in fuel consumption during the flight and a lower inertia in the orientation of the blades. Thanks to a brainstorming session with students and industry experts, the AHP pairwise matrix of the drivers for a generic structural application has been completed (Table 13).
Since the PPC case study falls in this category of products, the resulting indices, as reported in Table 14, have been used to compute an overall PI value.
The obtained PI is 74.28%, which shows good potential in the application of AM. So far, the product has passed the two steps of the early phase: it is possible to invest in a possible design solution and carry out an in-depth analysis where a new geometry is developed.

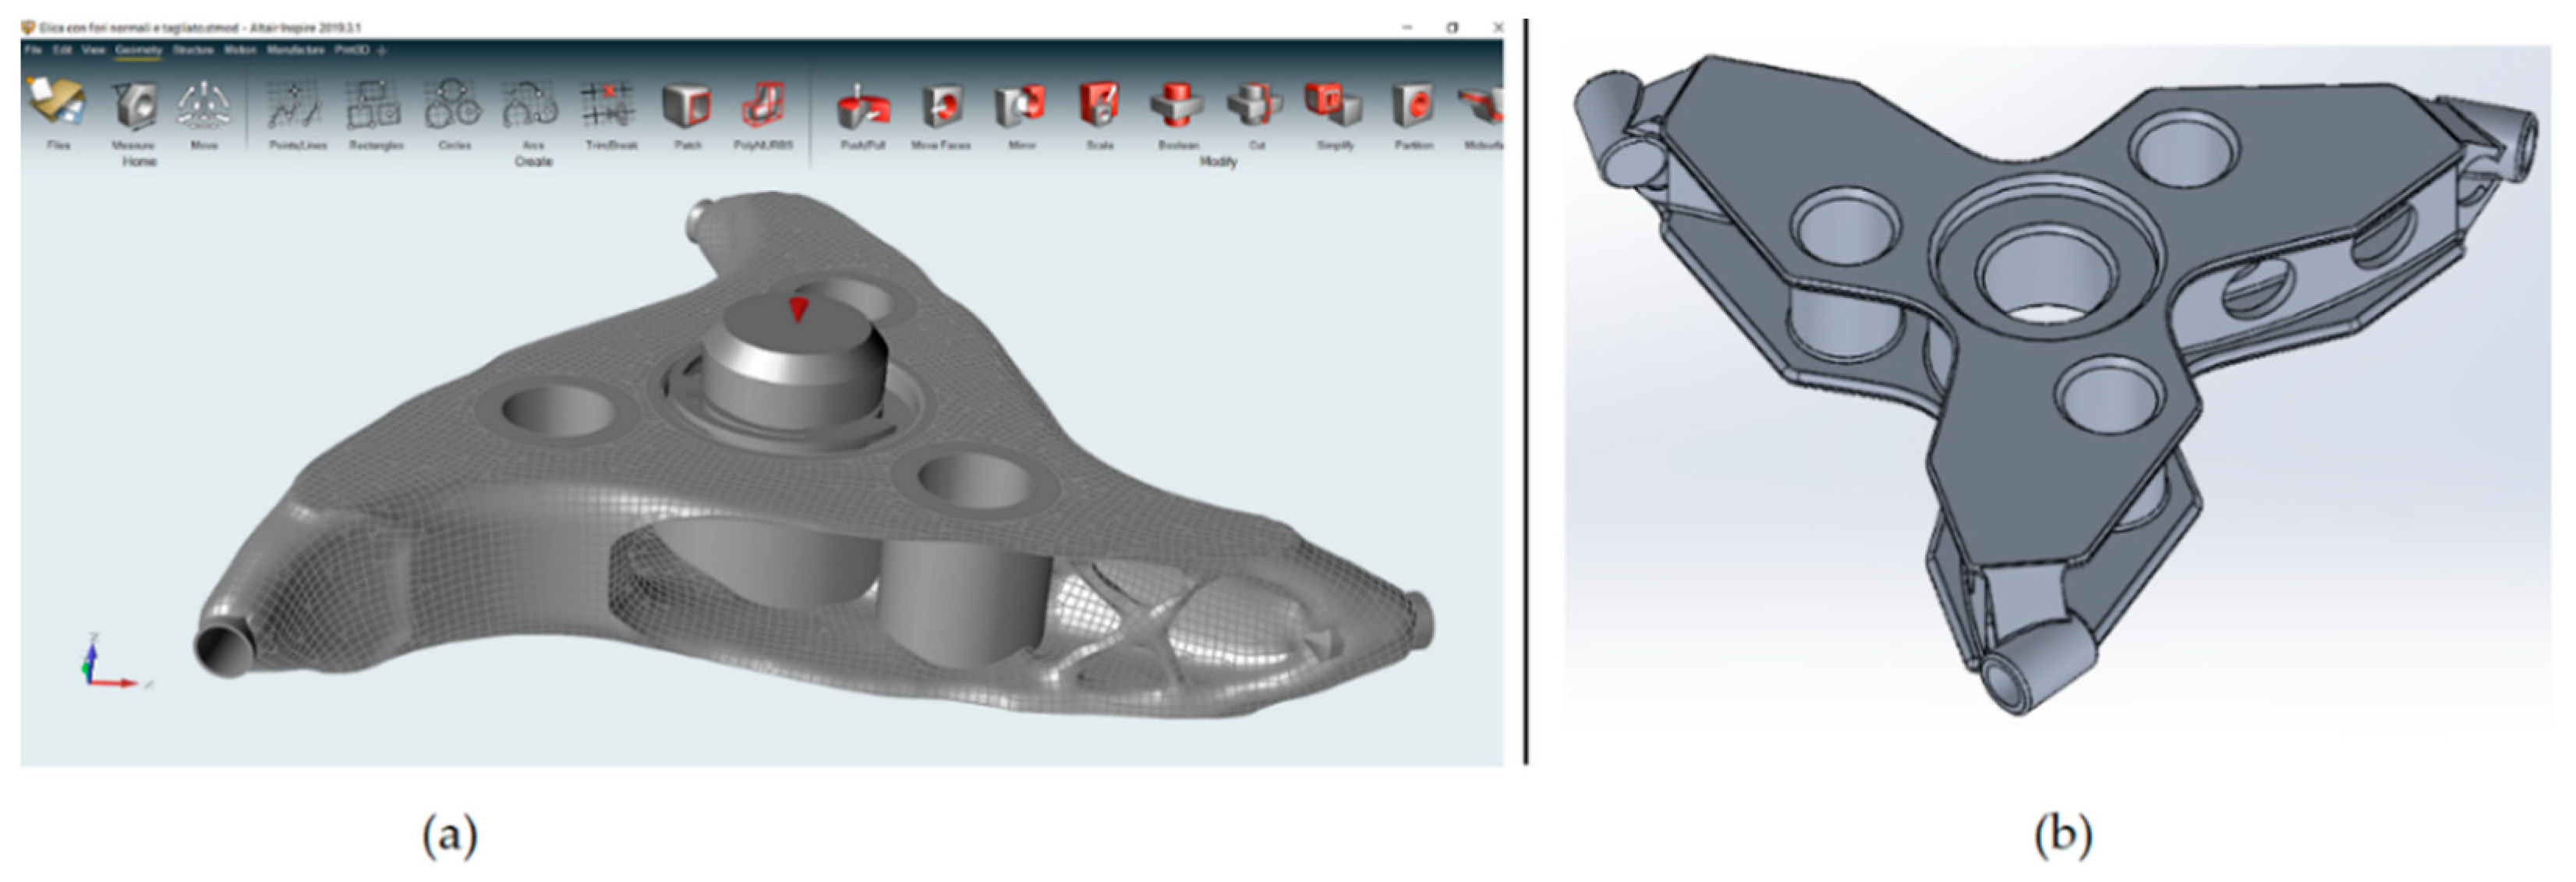
4.3. Topological Optimization Result

Given the structural application, the definition of a new geometry has been based on the TO approach. Altair Inspire 2019 was used as TO software. An optimized design has been developed by selecting the material and imposing the constraints and loads to which the part is subjected. After that, the geometry has been redesigned in Solidworks 2020 to achieve more regular shapes. Standard algorithms to create Non-Uniform Rational B-Spline (NURBS) patches from the tessellated models have not be employed due to the strong irregularity of the surfaces. Instead, a new geometry has been modelled by tracing the OT result. In Figure 8, the new geometry is presented.
The new geometry has been verified by an additional FEM simulation, using the Solidworks 2020 dedicated module. Two solutions have been devised, using aluminium and steel as alternative materials. By using aluminium, the weight can be dramatically reduced, from 250 g of the original design up to 100 g. If steel is employed, the weight can be reduced to 215 g, thus reaching 14% mass reduction. The starting volume was around 90,000 mm3, while the final design volume is around 28,200 mm3 for a steel component and around 40,000 mm3 for the aluminium version. So, the designer has the chance to choose whether to use steel, which is better in terms of mechanical performance and cost, or aluminium, which guarantees a lower weight but more material consumption is required.
The following step of the in-depth analysis has focused on the optimization of the design to evaluate punctual geometric features by means of the proposed indices. The geometric shape has been properly refined to fulfil the DFAM design guidelines and maximise the expected quality of the part. Finally, some printers compatible with the selected materials have been identified. In particular, the ProX 320 is selected as it guarantees the lowest production cost.
For the sake of a complete assessment, alternative manufacturing solutions have been evaluated. The complexity of the new shape is hardly obtainable with other processes, for instance, casting, due to the deep recess and inner features. Indeed, the small production batch hardly justifies the investment for a complicated mould.
The manufacturing costs of the new solution are still higher than the original one, as confirmed by process simulations carried out in collaboration with a printing service supplier. In fact, almost 3 h are required for the printing process, even taking advantage of the possibility of producing multiple parts at the same time. Indeed, additional machining is required to reach acceptable levels of roughness and tolerances in the functional coupling faces. Such costs could be balanced by an improved lightness of the component and better dynamic properties, which are conferred to the aircraft. However, this trade-off needs to be validated accurately, considering a broader design context extended to the whole airplane performance.

5. Conclusions

Few works in the literature address the evaluation of AM adoption in early product design. Even fewer are the works that implement multi criteria decision processes to systematically validate the results obtained. Furthermore, a gap that has been highlighted is the absence of a clear distinction between considerations and information that can be extrapolated or calculated in an early phase from those that require a more in-depth study.
The main objective of this paper is to provide a procedural approach that supports the designer to understand the potential offered by additive technologies in a given design context. This paper focuses on the early phase, consisting of the Preliminary Analysis and the Potential Analysis, where multicriteria decision approaches have been leveraged. Since the detailed redesign phase turns out to be the most onerous task, it is limited to only promising situations resulting from a potentiality assessment.
The application of these stages has been exemplified by analysing a propeller pitch controller test case. The proposed flow has proved to be a useful approach as the designer is able to evaluate whether a product can be produced through AM, leveraging the limited information available at an early stage. A new optimized product geometry has then been presented to be realized by PBF. Furthermore, the new part has benefits over the initial design, thus confirming the assumptions of the previous phases. In conclusion, it can be affirmed that the case study is suitable to AM production as foreseen by the application of the preliminary evaluations.
In future work, the approach, as conceived in an algorithmic way, is suitable to be embedded in a software tool to operatively support and speed up the designer activity, especially in the context of configuring customized products [42]. Following the phases described in this work, such a tool would aim at automating the process, such as indices computation and geometry evaluation, also verifying the geometric and production limits of AM and traditional technologies. Finally, a cost assessment phase based on geometric product features needs to be added to complete the analysis for an effective application in companies.

Author Contributions

Conceptualization and methodology, R.R.; validation and data curation, J.L.; writing—original draft preparation, J.L., J.S.; writing—review and editing, M.P. (Margherita Peruzzini); supervision and funding acquisition, M.P. (Marcello Pellicciari). All authors have read and agreed to the published version of the manuscript.

Funding

This research received no external funding.

Institutional Review Board Statement

Not applicable.

Informed Consent Statement

Not applicable.

Data Availability Statement

All data is contained within the paper.

Conflicts of Interest

The authors declare no conflict of interests.

References

  1. Thompson, M.K.; Moroni, G.; Vaneker, T.; Fadel, G.; Campbell, R.I.; Gibson, I.; Bernard, A.; Schulz, J.; Graf, P.; Ahuja, B.; et al. Design for Additive Manufacturing: Trends, opportunities, considerations, and constraints. CIRP Ann. 2016, 65, 737–760. [Google Scholar] [CrossRef]
  2. Lettori, J.; Raffaeli, R.; Peruzzini, M.; Schmidt, J.; Pellicciari, M. Additive manufacturing adoption in product design: An overview from literature and industry. Procedia Manuf. 2020, 51, 655–662. [Google Scholar] [CrossRef]
  3. Boothroyd, G.; Dewhurst, P.; Knight, W.A. Product Design for Manufacture and Assembly, 3rd ed.; CRC Press: Boca Raton, FL, USA, 2010. [Google Scholar]
  4. Gardan, N.; Schneider, A. Topological optimization of internal patterns and support in additive manufacturing. J. Manuf. Syst. 2015, 37, 417–425. [Google Scholar] [CrossRef]
  5. Raffaeli, R.; Mengoni, M.; Germani, M. A software system for “Design for X” impact evaluations in redesign processes. J. Mech. Eng. 2010, 56, 707–717. [Google Scholar]
  6. Campbell, R.; Bourell, D.L.; Gibson, I. Additive manufacturing: Rapid prototyping comes of age. Rapid Prototyp. J. 2012, 18, 255–258. [Google Scholar] [CrossRef] [Green Version]
  7. Butt, J. Exploring the interrelationship between additive manufacturing and Industry 4.0. Designs 2020, 4, 13. [Google Scholar] [CrossRef]
  8. Gibson, L.; Rosen, W.D.; Stucker, B. Additive Manufacturing Technologies; Springer: New York, NY, USA, 2014; Volume 17. [Google Scholar]
  9. Global Additive Manufacturing Market and Technology Forecast to 2028, Business Wire, Dublin. 2020. Available online: https://www.businesswire.com/news/home/20200914005395/en/Global-Additive-Manufacturing-Market-Generated-12-Billion-Revenue-in-2020-and-is-Forecast-to-Reach-78-Billion-by-2028---ResearchAndMarkets.com (accessed on 17 January 2021).
  10. ASTM F2792-12a. Standard Terminology for Additive Manufacturing Technologies; ASTM: West Conshohocken, PA, USA, 2015. [Google Scholar]
  11. Duty, C. Pros and Cons of Additive Manufacturing. Composites Manufacturing. 2014. Available online: http://compositesmanufacturingmagazine.com/2014/10/pros-cons-additive-manufacturing/ (accessed on 17 January 2021).
  12. Lopes, L.; Da Silva, A.F.; Carneiro, O. Multi-material 3D printing: The relevance of materials affinity on the boundary interface performance. Addit. Manuf. 2018, 23, 45–52. [Google Scholar] [CrossRef]
  13. Proof, H.; Staffen, A. Challenge of Additive Manufacturing—Why Companies Don’t Use Additive Manufacturing in Serial Production. 2019. Available online: https://www2.deloitte.com/content/dam/Deloitte/de/Documents/operations/Deloitte_Challenges_of_Additive_Manufacturing.pdf (accessed on 17 January 2021).
  14. Ngo, T.D.; Kashani, A.; Imbalzano, G.; Nguyen, K.; Hui, D. Additive manufacturing (3D printing): A review of materials, methods, applications and challenges. Compos. Part B Eng. 2018, 143, 172–196. [Google Scholar] [CrossRef]
  15. Kim, D.B.; Witherell, P.; Lipman, R.; Feng, S.C. Streamlining the additive manufacturing digital spectrum: A systems approach. Addit. Manuf. 2015, 5, 20–30. [Google Scholar] [CrossRef]
  16. Pei, E.; Ressin, M.; Campbell, R.I.; Eynard, B.; Xiao, J. Investigating the impact of additive manufacturing data exchange standards for re-distributed manufacturing. Prog. Addit. Manuf. 2019, 4, 331–344. [Google Scholar] [CrossRef] [Green Version]
  17. Tang, Y.; Zhao, Y.F. A survey of the design methods for additive manufacturing to improve functional performance. Rapid Prototyp. J. 2016, 22, 569–590. [Google Scholar] [CrossRef]
  18. ISO/ASTM DIS 20195. Guide for Design for Additive Manufacturing; ISO/ASTM: West Conshohocken, PA, USA, 2018. [Google Scholar]
  19. VDI-Guideline NN. 304: Additive Fabrication-Rapid Technologies (Rapid Prototyping)-Fundamentals, Terms and Definitions, Quality Parameter, Supply Agreements; VDI: Düsseldorf, Germany, 2010. [Google Scholar]
  20. ISO. DIS 17296—Part 1,2,3,4; ISO: Geneva, Switzerland, 2015. [Google Scholar]
  21. King, W.; Anderson, A.T.; Ferencz, R.M.; Hodge, N.E.; Kamath, C.; Khairallah, S.A. Overview of modelling and simulation of metal powder bed fusion process at Lawrence Livermore National Laboratory. Mater. Sci. Technol. 2015, 31, 957–968. [Google Scholar] [CrossRef]
  22. Stewart, S.; Giambalvo, J.; Vance, J.; Faludi, J.; Hoffenson, S. A Product Development Approach Advisor for Navigating Common Design Methods, Processes, and Environments. Designs 2020, 4, 4. [Google Scholar] [CrossRef] [Green Version]
  23. Kumke, M.; Watschke, H.; Vietor, T. A new methodological framework for design for additive manufacturing. Virtual Phys. Prototyp. 2016, 11, 3–19. [Google Scholar] [CrossRef]
  24. Lindemann, C.; Reiher, T.; Jahnke, U.; Koch, R. Towards a sustainable and economic selection of part candidates for additive manufacturing. Rapid Prototyp. J. 2015, 21, 216–227. [Google Scholar] [CrossRef]
  25. Klahn, C.; Leutenecker, B.; Meboldt, M. Design for Additive Manufacturing—Supporting the Substitution of Components in Series Products. Procedia CIRP 2014, 21, 138–143. [Google Scholar] [CrossRef] [Green Version]
  26. Faludi, J.; Cline-Thomas, N.; Agrawala, S. 3D printing and its environmental implications. In The Next Production Revolution: Implications for Governments and Businesses; OECD Publishing: Paris, France, 2017. [Google Scholar]
  27. Favi, C.; Raffaeli, R.; Germani, M.; Gregori, F.; Manieri, S.; Vita, A. A life cycle model to assess costs and environmental impacts of different maritime vessel typologies. In Proceedings of the ASME Design Engineering Technical Conference, Cleveland, OH, USA, 6–9 August 2017. [Google Scholar]
  28. Greco, S.; Figueira, J.; Ehrgott, M. Multiple Criteria Decision Analysis; Springer: New York, NY, USA, 2016. [Google Scholar]
  29. Greco, S.; Matarazzo, B.; Slowinski, R. Rough sets theory for multicriteria decision analysis. Eur. J. Oper. Res. 2001, 129, 1–47. [Google Scholar] [CrossRef]
  30. Stylidis, K.; Wickman, C.; Söderberg, R. Perceived quality of products: A framework and attributes ranking method. J. Eng. Des. 2020, 31, 37–67. [Google Scholar] [CrossRef] [Green Version]
  31. Mançanares, C.G.; Zancul, E.; Da Silva, J.C.; Miguel, P.A.C. Additive manufacturing process selection based on parts’ selection criteria. Int. J. Adv. Manuf. Technol. 2015, 80, 1007–1014. [Google Scholar] [CrossRef]
  32. Zaman, U.K.U.; Rivette, M.; Siadat, A.; Mousavi, S.M. Integrated product-process design: Material and manufacturing process selection for additive manufacturing using multi-criteria decision making. Robot. Comput. Manuf. 2018, 51, 169–180. [Google Scholar] [CrossRef] [Green Version]
  33. Saaty, T.L. Fundamentals of Decision Making and Priority Theory with the Analytic Hierarchy Process; RWS Publications: Pittsburgh, PA, USA, 2000; Volume 6. [Google Scholar]
  34. Jahan, A.; Edwards, K. A state-of-the-art survey on the influence of normalization techniques in ranking: Improving the materials selection process in engineering design. Mater. Des. 2015, 65, 335–342. [Google Scholar] [CrossRef]
  35. Pahl, G.; Beitz, W.; Feldhusen, J.; Grote, K. Engineering Design: A systematic Approach, 3rd ed.; Springer Science+ Business Media Deutschland GmbH: Berlin/Heidelberg, Germany, 2007. [Google Scholar]
  36. Available online: http://senvol.com/ (accessed on 17 January 2021).
  37. Ashby, M.F.; Cebon, D. Materials selection in mechanical design. J. Phys. IV Fr. 1993, 3, C7-1–C7-9. [Google Scholar] [CrossRef] [Green Version]
  38. Conner, B.; Manogharan, G.P.; Martof, A.N.; Rodomsky, L.M.; Rodomsky, C.M.; Jordan, D.C.; Limperos, J.W. Making sense of 3-D printing: Creating a map of additive manufacturing products and services. Addit. Manuf. 2014, 1, 64–76. [Google Scholar] [CrossRef]
  39. Raffaeli, R.; Mengoni, M.; Germani, M.; Mandorli, F. An approach to support the implementation of product configuration tools. In Proceedings of the ASME International Design Engineering Technical Conferences and Computers and Information in Engineering Conference DETC 2009, San Diego, CA, USA, 30 August–2 September 2009; pp. 559–570. [Google Scholar]
  40. Joshi, D.; Ravi, B. Quantifying the Shape Complexity of Cast Parts. Comput. Des. Appl. 2010, 7, 685–700. [Google Scholar] [CrossRef]
  41. Diegel, O.; Nordin, A.; Motte, D. A Practical Guide to Design for Additive Manufacturing; Springer: Berlin/Heidelberg, Germany, 2019. [Google Scholar]
  42. Raffaeli, R.; Cicconi, P.; Mengoni, M.; Germani, M. Modular product configuration: An automatic tool for eliciting design knowledge from parametric cad models. In Proceedings of the ASME Design Engineering Technical Conference 2010, Montreal, QC, Canada, 15–18 August 2010; pp. 207–218. [Google Scholar]
Figure 1. General framework of the design approach for AM parts.
Applsci 11 01210 g001
Figure 2. Example of timeline for a common design process involving additive technologies in the field of machined parts.
Applsci 11 01210 g002
Figure 3. Workflow of the preliminary analysis of AM constraints.
Applsci 11 01210 g003
Figure 4. Materials ranking process.
Applsci 11 01210 g004
Figure 5. In-depth Analysis.
Applsci 11 01210 g005
Figure 6. Final assessment of cost and time-to-market.
Applsci 11 01210 g006
Figure 7. (a) 3D CAD model of the Propeller Pitch Controller (PPC); (b) Real part assembled with the blades.
Applsci 11 01210 g007
Figure 8. (a) One of the geometries obtained by TO in Altair Inspire 2019. (b) Redesigned PPC geometry modelled in Solidworks 2020.
Applsci 11 01210 g008
Table 1. Strengths and limitations of Additive Manufacturing (AM), on a general basis.
StrengthsLimitations
Possibility of freeform parts with limited additional costParts need surface finishing in coupling faces
Possibility of hierarchical complexity (i.e., lattice structure)Low dimensional and geometrical tolerances
Customized performance by multi-material structuresLow building volume
Material usage only where it is neededLong processing time
Possibility of light weight partsNeed of support structures for overhanging portions
Reduction in logistic costsHigh energy consumption
Reduction in lead timeLower mechanical properties compared to other processes
Consolidation of assembliesResidual thermal tensions and distortions in the parts
Bounding surface weakness between two different materials [12]
Intrinsic process anisotropy
Table 2. Analytical Hierarchical Process (AHP) method: scale of relative importance.
Driver DijMeaning
1i and j are equally important
3i is slightly more important than j
5i is quite a bit more important than j
7i is much more important than j
9i is largely more important than j
1/3i is slightly less important than j
1/5i is quite a bit less important than j
1/7i is much less important than j
1/9i is largely less important than j
Table 3. Example of pairwise matrix.
D1D2D3
D11XY
D21/X1Z
D31/Y1/Z1
Table 4. Example of initial requirements of a product to be evaluated.
RequirementValue
ApplicationStructural, prototype, complex shape, tooling, customized
Expected overall sizeSizeX × SizeY × SizeZ
LoadRough description of expected loads
ConstrainsRough description of expected constraints
Target properties of the materialCurrent material, in case of redesign process
Density [kg/m3]
Stiffness [GPa]
Max working T [°C]
Conductivity E
Conductivity T
Hardness [Rock]
Wear resistance
Corrosion resistance
Tensile strength [N/mm2]
Fatigue strength [N/mm2]
Yield strength [N/mm2]
Production methodReport current production process, in case of redesign process
Buy-to-fly ratioReport current ratio, in case of redesign process
Batch sizeExpected parts/year
Time-to-MarketRequired time-to-market
Production costReport current production cost, in case of redesign process
Other requirements
Table 5. Description of the drivers to evaluate the potentiality of AM in a specific application.
DriverGuidelines to Help the Designer to Decide a Score
(D1) Does the use of AM lead to potential cost savings considering the entire life cycle?AM is generally more expensive than a forming or machining technique due to long cycle times and high energy consumption. However, such a gap may reduce if considering the entire product lifecycle. It is the case of complex shapes optimized for highly efficient fluid-dynamic performances, devices such as blowers, diffusers, etc. Indeed, in some applications, AM allows us to reduce the mass, which is beneficial for product operating costs. For example, airplane mass reduction leads to fuel saving.
(D2) Can assembly, logistic or procurement cost be reduced?Forming technologies allow the realization of complex shapes but require investments for tooling that are recovered only if many parts are produced. Conversely, AM does not require fixed costs (apart from the printer itself) and it allows us to consolidate parts in less components of more complex components. A reduced number of parts is beneficial in terms of logistics, assembly times and supply chain management.
(D3) Can the product benefit from a reduced time-to-market?AM can be set up rapidly since it is based on a digital toolchain. Even if the realization time is high and some post processing activities can be required (support removal, post treatments, additional machining, surface coatings, …), the whole process can be generally accomplished in few days, which is competitive with processes which require the elaboration of CNC toolpaths or the design and manufacturing of tooling and several sequential separated machines. Thus, the overall time-to-market could be significantly reduced.
(D4) Is the production batch size limited?As any other technology requiring limited fixed costs but longer manufacturing cost for each part, AM is more suited to small batch quantities.
(D5) Is the post processing phase limited?AM aims to produce near net shape parts. However, depending on the specific technology, post processing to consolidate the material, annealing residual stresses or improving surface quality may be required. The quantity of such activities can strongly reduce the competitiveness of additive solutions.
(D6) Can material waste be reduced?Nowadays, many materials are available to be processed with AM, some of them being expensive advanced metals. The advantage of adding material only where it is needed, conceiving complex organic shapes, and the possibility of recovering unused powders can lead to a reduction in material waste and improved sustainability.
(D7) Would the product benefit from a mass reduction?Mass reduction is one of the major strengths of AM parts, which has strongly pushed its diffusion.
(D8) It is beneficial to increase the complexity of the part?In some applications, such as fluid dynamics, biomedical applications (e.g., increase the osteointegration of the prostheses thanks to a porous layer), multiple functions integration, etc., key benefits arise from the freedom in the complexity of the shapes.
(D9) It is feasible to consolidate parts?Considerable advantages in terms of cost are gained if the number of parts can be reduced. AM can leverage the consolidation of parts if assembly and functional constraints are respected, also benefiting from grading material properties which can be conferred thanks to inner cavities or lattice structures.
(D10) Is customization required?The limited investment costs of AM pave the way to the paradigm of Mass Customization. Specific parts could be produced according to specific customer requirements, controlling the increase in production costs.
(D11) Would the product benefit from areas with differentiated material properties?One of the features of AM refers to the capability of calibrating the properties of the material along the part, recurring to modulation of micro-structures up to vary the distribution and parameters of lattice cells. For example, material properties can be varied accordingly to applied force, leading to uniform stress level and deflection behaviour that cannot be obtained with uniform material properties. If combining regions with different materials, the compatibility and weakness at the interfaces must be carefully assessed [12].
(D12) Would the product benefit from varied density along the volume?The volumetric mass of a product can be modulated according to specific design objectives, thanks to lattice structures, inner voids or honeycomb structures.
(D13) Is a volumetric lattice or a superficial texture required?Superficial or volumetric structures can be obtained, enhancing weight reduction, or increasing osteointegration as well as grip.
(D14) Is it advantageous to add functionalities in the parts?The extended design freedom of AM allows multiple functionalities to be incorporated in a part, such as the possibility of integrating electric circuits.
Table 6. Indices contributing to the Printability Index.
NameEquationDescription
BuyToFly index C v = V t o t V b b Where Vtot is the product volume and Vbb is the volume of the bounding box.
Functional surface index C f = S f S t o t Where ∑Sf is the sum of functional surface and Stot is the product surface.
Supported surface index C s = S s S t o t Where ∑Ss is the sum of the surfaces that need supports and Stot is the product surface.
Hole index C h = n ° H a H t o t Where ∑n°Ha is the sum of the holes that do not have the axis parallel to the production direction and Htot is the number of the total holes.
Massive volumes index C n = V m V t o t Where ∑Vm is the sum of the massive volumes and Vtot is the overall product volume.
Height ratio index C l = H p L m a x Where Hp is the product height and Lmax is the maximum length of the part in one of its three principal directions.
Small holes index C d = n ° H d H t o t Where ∑n°Hd is the sum of the holes number with the diameter below a critical value that depends on the specific type of technology and Htot is the number of the total holes.
Thickness distribution index C d = V t n V t o t Where ∑Stn is the sum of the walls volume with thickness below a critical value that depends on the specific type of technology and Vtot is the product volume.
Surface orientation index C e = S p S t o t Where Sp is the surface parallel to the build direction and Stot is the product surface.
Layer variation index C l = i = 1 N | ( S l i S l ( i 1 ) ) | S l t o t Where Sli is the surface of the i-th layer and Sl(I − 1) is surface of the (i − 1)-th layer. Sltot is the maximum trace of the product. N is the total number of the layers.
Table 7. Design requirements for the analysed product.
RequirementValue
ApplicationStructural
Expected overall size130 × 130 × 20 mm
Load3 × 3000 N
ConstraintsRotation blocked by 3 screws M6
Target properties of the materialCurrent material: Aluminium
Current density: 2700 [Kg/m3]
Current Stiffness: 50 [GPa]
Twork: −30 °C to 130 °C
Conductivity E: Not important
Conductivity T: Not important
Required Hardness: 20 [Rock]
Wear resistance: Good resistance
Corrosion resistance: Good resistance
Current tensile strength: 210 [N/mm2]
Fatigue strength: Millions of cycles required
Current yield strength: 120 [N/mm2]
Maximum expected powder cost: EUR 75/kg
Production methodMilling from block
Buy-to-fly ratioCurrent: 0.347
Batch size150 p/years
Time-to-MarketFew weeks
Production cost25 EUR/p
Table 8. AHP pairwise matrix of the indices of materials for the PPC case study. I1 to I7 refers to the seven selected material indices to rank materials, as defined in Section 3.2.
I1I2I3I4I5I6I7
I11.000.200.200.140.500.200.20
I25.001.005.001.005.002.002.00
I35.000.201.000.201.000.500.50
I47.001.005.001.005.002.002.00
I52.000.201.000.201.001.001.00
I65.000.502.000.501.001.001.00
I75.000.502.000.501.001.001.00
Table 9. Weights of the material selection indices calculated for the case study.
I1I2I3I4I5I6I7
PPC case study3.2627.147.7028.098.1312.8412.84
Table 10. Indices values of the compatible materials (index 3 is omitted since it is not significant for aluminium alloys).
I1 = σr/ρI2 = σy/ρI4 = E/ρI5 = E^ (1/2) /ρI6 = σy/(ρ*C)I7 = E/(ρ*C)
MaterialMINMAXMINMAXMINMAXMINMAXMINMAXMINMAX
LaserForm AlSi12171,642186,56793,284108,2090026,11927,9853122323113331546
LaserForm AlSi7Mg0.6131,086161,04978,652101,1240026,21726,9663134317812691631
LaserForm AlSi7Mg0.6 (DA)149,813172,285108,614123,5960027,34127,7153200322217241962
AlSi10Mg (HT)131,086161,04986,142112,3600022,47224,3452901302013051702
CL 30Al (AlSi12) (SR)116,105121,72363,67082,3970028,09028,090324432449361212
CL 32Al (AlSi10Mg) (HT)126,217132,21073,03488,0150028,09028,0903244324411241354
EOS AlSi10Mg164,794179,77586,142104,8690024,34531,8353020345313461639
EOS AlSi10Mg (SR)125,468134,83180,52491,7600018,72729,9632648335012201390
AlSi10Mg133,708149,06478,27789,5130026,96631,4613178343312631444
Laserform 17-4PH (HT)177,333188,000156,000174,66728,00032,00025,33328,0001838193226002911
Maraging steel137,500137,500116,250116,25042,87576,87517,50017,5001479147921142114
CL 91 RW (HT)212,500212,50020,000200,00030,00031,25025,00025,000176817682742740
17-4 PH SS130,250130,25082,50082,50027,50031,25024,37524,3751746174616501650
EOS Maraging steel125,000150,000112,500143,75042,87576,87516,87523,1251452170016072054
CL 91 RW (HT)212,500212,50020,000200,00030,00031,25025,00025,000176817682742740
SLM Solution 1.2709121,500131,25095,125114,12591,50091,50017,87523,8751495172819032283
Table 11. Sorted list of materials based on Compliance Index CI (HT = heat treated; SR = stress relief; DA = direct aging).
MaterialCI MINCI MAX
%%
(1) Laserform 17-4PH (HT)86.1283.18
(2) LaserForm AlSi7Mg0.6 (DA)76.5071.24
(3) CL 91 RW (HT)49.0780.00
(4) EOS AlSi10Mg66.0973.02
(5) SLM Solution 1.270966.5572.49
(6) LaserForm AlSi7Mg0.667.1765.67
(7) EOS Maraging steel59.9070.10
(8) AlSi10Mg (SR)68.2969.48
(9) LaserForm AlSi1269.2166.78
(10) CL 32Al (AlSi10Mg) (HT)67.7963.30
(11) 17-4 PH SS68.4061.05
(12) Maraging steel65.9760.65
(13) CL 30Al (AlSi12) (SR)64.5861.27
(14) AlSi10Mg (HT)62.1563.15
(15) EOS AlSi10Mg (SR)54.8066.46
(16) LaserForm AlSi7Mg0.6 (SR)61.1863.70
(17) …
Table 12. Extract of the printer database showing the models compatible with the required part size.
SupplierNameTechnologyBuild SizeCompatible Materials
3D SystemDMP Factory 350
DMP Felx 350
ProX DMP 320
Powder Bed Fusion (PBF)275 × 275 × 380 mm
275 × 275 × 380 mm
275 × 275 × 420 mm
LaserForm AlSi10Mg
LaserForm AlSi10Mg
LaserForm AlSi12
Laserform 316L (SR)
Laserform 17-4PH
Maraging steel
Concept LaserX line 2000R
M2 Cusing
PBF800 × 400 × 500 mm
250 × 250 × 280 mm
CL 30Al (AlSi12)
CL 32Al (AlSi10Mg)
CL 20ES (SS 1.4404)
CL 91 RW (HT)
17-4 PH SS
RenishawAM 250
AM 400
RenAM 500Q
PBF250 × 250 × 365 mm
250 × 250 × 300 mm
245 × 245 × 335 mm
AlSi10Mg (HT)
Maraging steel
SLM SolutionSLM 280 2.0
SLM 500
PBF280 × 280 × 350 mm
500 × 280 × 325 mm
SLM Solution AlSi10Mg
SLM Solution AlSi9Cu3
EOS Maraging steel
EOS 316L
SLM Solution 1.2709
Table 13. AHP pairwise matrix to compute relative weights of the drivers for a generic structural application.
D1D2D3D4D5D6D7D8D9D10D11D12D13D14
D11.002.001.001.001.002.002.007.009.007.007.007.009.009.00
D20.501.000.500.500.501.000.501.005.002.002.002.001.007.00
D31.002.001.001.001.002.001.007.007.007.007.007.007.009.00
D41.002.001.001.000.502.001.007.007.007.007.007.007.009.00
D51.002.001.002.001.002.001.007.007.007.007.007.007.009.00
D60.501.000.500.500.501.000.502.005.002.002.002.001.007.00
D70.502.001.001.001.002.001.005.007.002.007.007.002.009.00
D80.141.000.140.140.140.500.201.002.001.001.001.001.005.00
D90.110.200.140.140.140.200.140.501.001.000.500.500.502.00
D100.140.500.140.140.140.500.501.001.001.000.500.501.005.00
D110.140.500.140.140.140.500.141.002.002.001.001.001.005.00
D120.140.500.140.140.140.500.141.002.002.001.001.001.005.00
D130.111.000.140.140.141.000.501.002.001.001.001.001.005.00
D140.110.140.110.110.110.140.110.200.500.200.200.200.201.00
Table 14. Potential index calculation for the PPC case.
DriversWeightGiven Score
(D1) Does the use of AM lead to potential cost savings considering the entire life cycle?0.15739
(D2) Can assembly, logistic or procurement cost be reduced?0.05937
(D3) Can the product benefit from a reduced time-to-market?0.14317
(D4) Is the production batch size limited?0.13759
(D5) Is the post processing phase limited?0.15206
(D6) Can material waste be reduced?0.06108
(D7) Would the product benefit from a mass reduction?0.116610
(D8) It is beneficial to increase the complexity of the part?0.02947
(D9) It is feasible to consolidate parts?0.01651
(D10) Is customization required?0.02684
(D11) Would the product benefit from areas with differentiated material properties?0.02845
(D12) Would the product benefit from varied density along the volume?0.02845
(D13) Is a volumetric lattice or a superficial texture required?0.03385
(D14) Is it advantageous to add functionalities in the parts?0.00991
Potential Index (PI)74.28
Publisher’s Note: MDPI stays neutral with regard to jurisdictional claims in published maps and institutional affiliations.

