1. Introduction
The vibroacoustic analysis of structural components, used in aircraft [
1], spacecraft [
2], land vehicles [
3], and ships [
4,
5], plays a vital role in the design of these systems with regard to human health and living comfort.
The numerical tools of the Finite Element Method [
6,
7] and Boundary Element Method [
8] have been applied extensively for modeling acoustic problems. Such numerical techniques are adopted stand-alone or in conjunction (hybrid methods) [
9].
New materials as alternatives to petroleum-based composite materials are needed due to the adverse effects of the latter on nature. On the other hand, there is a need to characterize and evaluate such new alternative materials to be effectively used in practical applications.
Nowadays, in the automotive field, it is usual to see isotropic materials for vibrating plates replaced by composite materials, also due to their superior damping characteristics [
10], even if their vibroacoustic characteristics have not yet been extensively examined. In particular, the main challenge in implementing a new composite roof for a car body is related not only to its structural assessment but also to guarantee its compliance with vibroacoustic requirements.
In Genovese et al. [
11], the traditional metallic roof has been compared with the newly proposed solution in terms of structural and vibroacoustic performances. The different stiffness and the different mass of the roof change the vibrational behavior of the entire vehicle and consequently its transmission loss.
Lightweight components are typically stiff and thin-walled and thus tend to have significant sound radiation. Due to structure complexity, composites exhibit great variability in mechanical properties and need to be analyzed on the basis of different ply angles, wall thickness, and damping ratio [
12]. Namely, using fiber-reinforced materials offers a wide range of possibilities for adjusting their properties, such as stiffness and damping, by manipulating layup, fiber, and matrix material, or fiber volume content [
13]. With such numerous degrees of freedom when designing a composite, there is a need for efficient simulation methods for vibroacoustic analyses involving complex multi-physical models, possibly with allowance for fluid–structure interaction.
Fiber-reinforced composites exhibit random fiber orientations due to the manufacturing tolerances. The study in [
14] concerns with a numerical investigation of the vibrational behavior of the long fiber-reinforced composites under uncertainty in fiber orientations. A numerical case study is used to illustrate the features of the method, where the impact of the uncertainty in fiber orientations on the natural frequencies and mode shapes of a rectangular composite plate with nominal orientation is investigated.
The vibroacoustic behavior of bio-composites, including damping and elastic properties, sound absorption, and transmission loss levels, are investigated in [
15]. Despite having less detrimental environmental effects and thorough availability, natural fibers are still unsuitable for wide implementation in industrial components. Some shortcomings, such as the presence of moisture contents, thicker diameter, and lower antifungus quality, hold up the progress of natural fiber composites in staying competitive with synthetic composites. The review in [
16] aims at investigating the acoustic absorption behavior of natural fiber composites due to the incorporation of granular materials. The possible influential factors of fibers and grains were described for the enhancement of low-frequency acoustic absorption of the composites.
The impact of elastic parameter uncertainty on the natural frequency and the radiated acoustic power of laminated composite plates is investigated in [
17]. Numerical results show that the natural frequencies and the radiated acoustic powers are strongly affected by uncertainty in input parameters.
Coupled vibroacoustic analyses of plates produced from composite materials can be performed by using finite element analysis software. The study in [
18] has been carried out for E-glass/Epoxy, Kevlar/Epoxy and Carbon/Epoxy plates with different ply angles and numbers of ply. The effects of composite material, ply orientation, and number of layers on coupled vibroacoustic characteristics of plates have been statistically analyzed for various combinations.
A review of major developments in numerical and experimental methods for vibroacoustic analysis of cavities for predicting low-frequency sound field or noise is provided in [
19]. Details of formulation of both the acoustic and coupled vibroacoustic problems are presented. Applications of cavity acoustic to the problem of vehicle noise are also reviewed. Mode shapes of the composite panel are dependent on the fiber orientation, as shown in [
20], where modal analysis for different fiber orientations (at 0°, 30°, 45°, 60°, and 90°) is carried out by using ABAQUS software.
The objective of this work is the vibroacoustic evaluation of PP 23 CF (a polypropylene matrix reinforced with a percentage of vegetable fibers) for the sports car roof, aiming at replacing fiberglass composite materials (the current car pavilion is made of a thermosetting fiberglass composite material).
In the present case study, the design activities have been focused on the optimization of the geometries and masses under service loads of flatwise panels composed of elements made of new generation composite materials, with the aim to make lighter the existing components of a car.
In the following, the reported graphs lack some numerical values because of a non-disclosure agreement with FCA.
2. Material and Methods
2.1. Fiberglass Composites
Nowadays, fiberglass molded composite materials are widely used in the automotive industry. These composite materials are, in particular, used for car panels, and they are competitive compared to aluminum alloy for small or medium volumes since for high volumes, metal alloys exhibit lower production costs.
Furthermore, fiberglass composite materials have numerous positive aspects that have increased their appeal for this kind of applications (
Figure 1).
On the other hand, fiberglass composites cannot be easily cut. In order to avoid the diffusion and inhalation of dust they require special precautions and to operate in a protected environment. The polymerization reaction is not reversible, in fact, they do not regain their original liquid form through heating, as thermoplastic materials usually do, therefore, fiberglass scrap cannot be melted and remodeled as often happens in plastic recycling.
Current waste management of fiberglass composite materials is carried out according to the following practice:
Disposal in landfills (certainly not the optimal solution, also due to the non-biodegradability of the material),
Incineration, with the enormous problem of smoke pollution,
Recycling through regrinding: The composite is ground to be reused as a filler (usually in building materials),
Recycling by pyrolysis, by means of which the polymer is thermally decomposed in the absence of oxygen, the fibers are separated and used again as fillers (this solution is, however, economically not very convenient),
Recycling through acid digestion, through chemical dissolution of the composite (this process is, however, economically prohibitive).
2.2. Biocomposite Materials
In January 2007, the European Commission proposed a reduction in the transport sector connected to GHG (greenhouse gas) by redefining the emissions target of new vehicles at 95 g of CO2 per km, starting from the beginning of 2021.
The LIFE BIOBCOMPO project, from which this work is developed, aims to reduce the environmental impact of new vehicles through innovative low-density thermoplastic composites, derived from renewable resources (bio-based).
The main goals are:
Very low-density thermoplastic materials that allow saving weight compared to traditional composites, with a proportional reduction in CO2 emissions,
Replacement of conventional mineral fibers with bio-based fibers, thus promoting the use of more sustainable, biodegradable resources, minimizing the environmental impact,
Demonstrate that these new technologies are applicable on an industrial scale and overcome the problems associated with the industrialization of the new solutions proposed.
The most promising biocomposite developed is a polypropylene (PP) matrix reinforced with a percentage of vegetable fibers. This material has been applied to the injection molding of some components of the Alfa Romeo Giulia FCA car, which are normally made of glass fibers (GF).
The material analyzed in this work is PP 23 CF, in which the abbreviation stands for:
Polypropylene (PP) matrix, a thermoplastic polymer characterized by a high rupture load, low density, good thermal, and abrasion resistance;
Reinforcement in vegetable cellulose fibers (cellulose fiber, CF).
2.3. Experimental and Numerical Setup
The inertance values on different points of some sheets made of PP 23 CF were evaluated by an in-house made experimental activity, performed at CRF (Fiat Research Center, Turin, Italy) test room, and by a numerical analysis, performed with the MSC Nastran software, obtaining a satisfactory agreement and consequently validation of the virtual modeling of the new material. Then, the car roof of the Alfa Romeo 4C car, made with PP 23 CF, was modeled and analyzed from the vibroacoustic point of view.
A mere switch to the new material, with no changes in the geometry/structure of the car roof, would not have preserved the values of static rigidity, dynamic rigidity, and the configuration of modal shapes of the fiberglass car roof. For this reason, a geometric/structural optimization of the component was necessary.
Once the new geometry/structure was defined, a vibroacoustic analysis was carried out, consisting of the following phases: The fluid cavity of the passenger compartment, the seats, and the dashboard of the vehicle were modeled with the ANSA software (a multidisciplinary CAE pre-processing tool that provides all the necessary functionality for full-model build up, from CAD data to ready-to-run solver input file), then a modal analysis was carried out to check any coupling of the fluid cavity modes with the structure car body modes, in order to decide if a weak rather than a strong coupled analysis was needed. Finally, the vibroacoustic transfer functions to the driver’s ear node were assessed considering two different excitation points on the structure.
3. Damping Coefficient Assessment for the New Biocomposite Material
3.1. Procedure
The mechanical properties of the biocomposite material, reinforced with vegetable fibers, were measured at CRF in Turin, obtaining a Young modulus and a density lower than traditional composite materials.
For damping measurements of different types of materials, in particular polymers and composite materials, the CRF Composite Materials Laboratory is equipped with a machine (
Figure 2) that provides the damping loss factor, η, and the damping ratio, ζ.
These parameters are obtained according to ASTM E756 “Standard Test Method for Measuring Vibration-Damping Properties of Materials”. The starting data are acquired in the time domain as an oscillating response of the specimen. The frequency analysis returns the values of loss factor, η, and damping ratio, ζ, vs. frequency for the material under examination.
The aforementioned procedure is based on the following steps:
the specimen is clamped at one end in a fixed-free configuration,
an electromagnetic coil actuator applies an excitation force that causes the specimen to vibrate,
two measuring sensors provide displacement and acceleration of a specific point.
The analysis software enables the control of the whole measurement process, driving the forcing signal and analyzing the output signal in the time/frequency domain. Typically, the vibrating modes of the bar are sufficiently separated in frequency to allow an easy estimate of the damping parameters, in accordance with ASTM E756.
The damping parameters are determined through the half power method, in which an intermediate parameter is evaluated by:
where
fn is the resonant frequency and
. is the half-power bandwidth of the n-th mode estimated at −3 dB with respect to the peak at
.
According to the Complex–Spring model, the loss factor
η is determined from the relationship:
According to the Kelvin–Voigt model, the damping ratio
ζ is determined by the relationship:
The software uses the two previous exact formulas for the calculation of η and ζ.
The input signal is of simple harmonic type, with fixed amplitude and frequency, and the FRF (Frequency Response Function) is measured point by point for each frequency value considered.
The measurement with this type of input proceeds in two phases: A first exploration, carried out with a large frequency range, (0–2000 Hz), with the purpose of identifying the resonance peaks (
Figure 3), followed by a detailed analysis carried out around the resonance peaks with very small frequency increases in order to accurately collect the most significant data relating to the individual modes.
3.2. Results and Discussion
From
Figure 3, it is possible to highlight the most relevant peaks of the FRF measured for the oscillating specimen of
Figure 2. In the case under examination, it can be seen that the peaks of greater amplitude are at about 50, 300, 800, and 1450 Hz. The latter, however, has not been analyzed, since it goes well beyond the frequency range of interest, which is (0–500) Hz.
The Resonance Test software identifies and calculates for each peak: The resonance frequency, the loss factor η, and damping ratio ζ.
Being unknown the real fiber orientation for the components under analysis, the values of η and ζ adopted are calculated by averaging the values in correspondence of three different orientations of the fibers (0°, 45°, 90°).
The results show that, over the entire frequency range analyzed, there is an increase in damping values compared to a glass fiber-reinforced composite material.
These frequency variable damping values are used for subsequent analyses, such as the calculation of inertance, dynamic stiffness, and vibroacoustic transfer function.
4. Experimental-Numerical Correlation on FRF of a Real Component
Experimental tests were conducted in order to acquire the frequency response functions at specific points on a component made of PP 23 CF, through the following steps:
the tested component is the central rear aerodynamic guard of the Alfa Romeo Giulia car, dimensions are 1370 × 537 × 2.5 mm;
the component was suspended from a rigid frame by means of 50 cm long low stiffness elastic tie rods,
the instrument that excites the structure is an instrumented hammer, with a load cell impedance of 3.96 Ω
the system response was recorded with a PCB HT 356B21 piezoelectric accelerometer.
The accelerometer was glued in each point of analysis, and, in the same point, the component was excited with an instrumented hammer (
Figure 4).
For each point, three shots were given in the normal direction to the component (in case of an overload or an underload, the software automatically rejects the measurement), the hammer input and accelerometer output signals were post-processed with the LMS Test.Lab—Impact Testing software (Munich, Germany).
Three blow repetitions are necessary for each acquisition point in order to evaluate the coherence function γ, which must be close to 1 for the entire frequency range of interest, in the case under consideration from 0 to 400 Hz.
Twenty FRF curves were exported, one for each acquisition point, in order to perform an experimental numerical correlation on a sufficient number of points.
The Frequency Response calculation was performed through post-modal reconstruction (Real Eigenvalue Analysis—SOL 103-Nastran), exciting the component in a point and calculating the acceleration vs. frequency at the same point.
The composite material was modeled as homogeneous and the preprocessing was carried out using the Altair HyperMesh software [
21].
The shelter components are all plastic made and were modeled by using two-dimensional shell elements.
A mesh consisting mainly of Quad elements and a small percentage of Tria elements, with an average size of 3.5 mm was created (
Figure 5).
Numerical and experimental inertances, in the frequency range [0–400] Hz, are explicitly shown in
Figure 6 for a couple of points.
To numerically evaluate the numerical-experimental correlation, the Frequency Response Assurance Criterion (FRAC) was chosen (Equation (4)), its values ranging in the interval [0–1]: A FRAC value equal to 1 indicates an optimal correlation and values greater than 0.90 are considered satisfactory.
In the case in question, the obtained FRAC values were greater than 0.9 for all points with a coherence function close to 1 (the coherence function . is obtained by the ratio between two spectral density functions calculated from different experimental data). Such results allowed concluding that the virtual component, characterized as a homogeneous material, with the mechanical and damping properties measured experimentally, satisfactorily approximates reality.
The next step is the modeling of the car roof of the Alfa Romeo 4C car.
5. Evaluation of the Vibroacoustic Behavior of the Alfa Romeo 4C Car Roof
Having carrying out the experimental-numerical correlation of the PP23CF plant-fiber composite material, the next step is to evaluate its possible use for a coupe sports car roof (
Figure 7).
5.1. FE Model
The finite element model used (
Figure 8) consists of a mesh characterized as described in
Table 1.
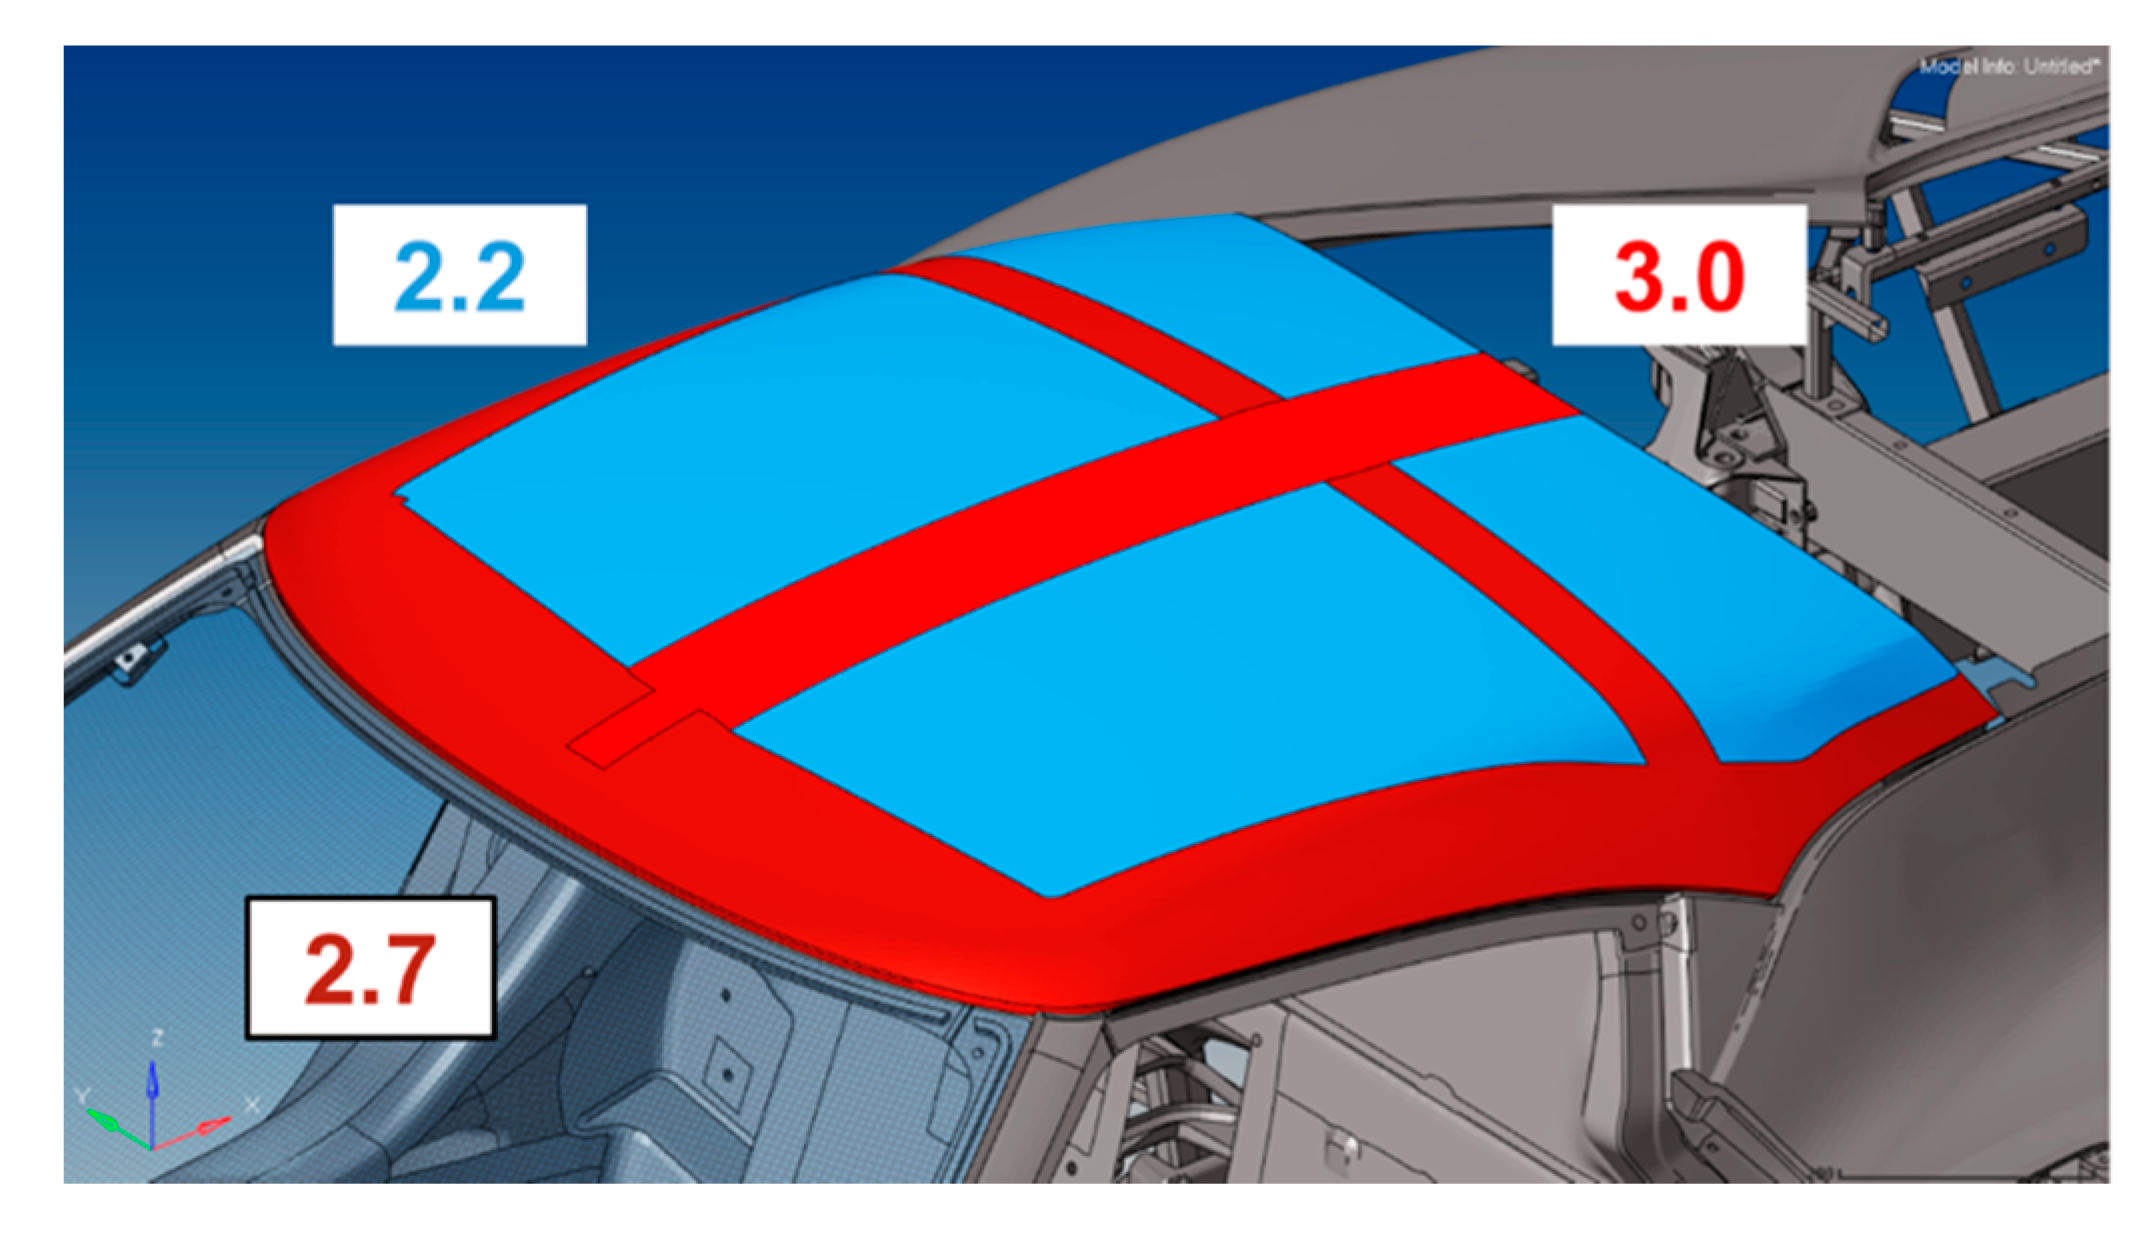
The car roof in question was originally composed of a fiberglass composite material with a variable thickness, ranging from 2.2 to 3.0 mm (
Figure 9).
PP23CF material has a lower Young modulus than glass fiber material, but a lower density.
As regards the damping, the TCA material data are available and are compared with the average damping values of the PP23CF, previously measured according to the ASTM E756 standard (
Figure 10): It can be noted that the damping of PP23CF is triple than TCA.
5.2. Static Stiffness
The static stiffness of the PP 23 FC pavilion with unchanged geometry was calculated at different points.
In particular, nine points uniformly distributed, were considered on the pavilion (
Figure 11).
The static stiffness of the pavilion is evaluated as:
where
F is the normal (unitary) force applied to the pavilion at the specific point and
x is the displacement of the same point in the direction of excitation.
The points are suitably defined with the Hypermesh software, and the static stiffness is calculated with the Nastran code (
Figure 12), in particular with a SOL 101 (Linear Static Analysis).
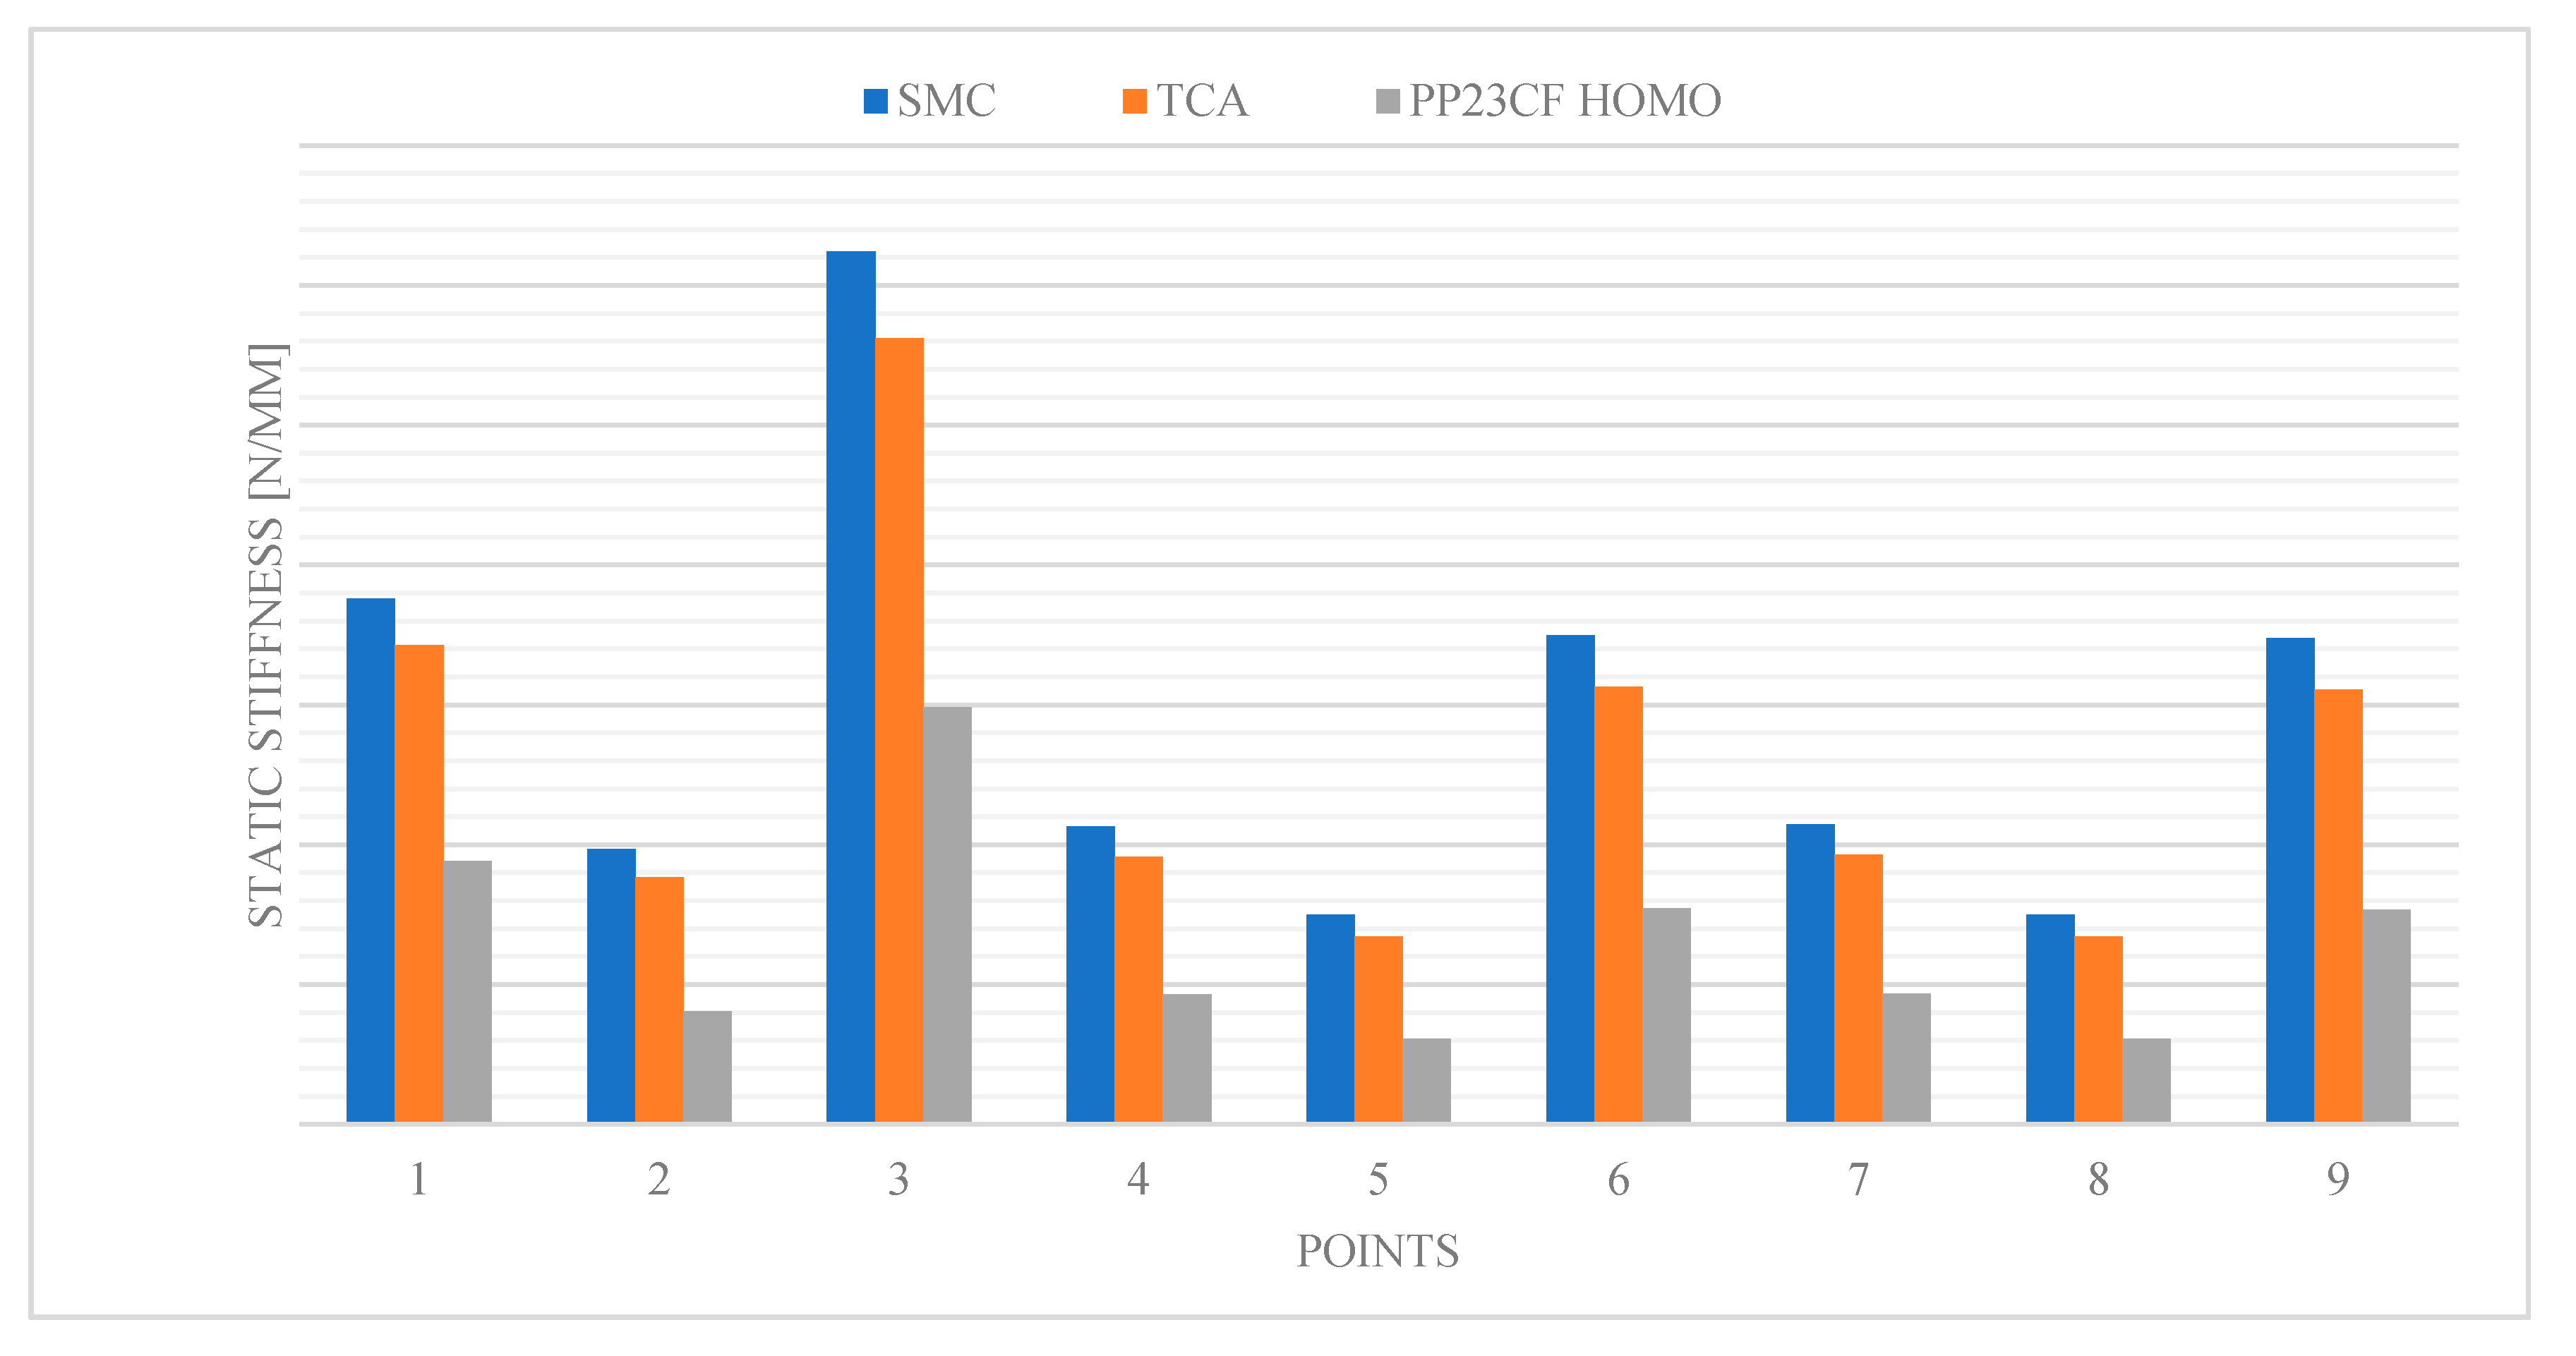
Static stiffness was calculated for the nine points for the three materials, i.e., SMC, TCA and PP23CF (
Figure 13).
From the results, it is possible to observe that changing from the glass-reinforced material to the biocomposite, there is a halving of the static stiffness, due to the lower value of Young’s modulus compared to the PP23CF material.
5.3. Car Roof Optimization
In order to recover the static rigidity of the pavilion, the design of the component had to be optimized, as the only increase of thickness would cause exceeding the weight of the pavilion made of fiberglass.
The design proposed during the optimization was based on a series of ribs, 10 mm high and 2 mm wide, along the entire surface of the pavilion (
Figure 14) and a reduction of its thickness (
Figure 15) in order to reduce the weight.
The realization of the pavilion thus constituted is possible if the component is made by injection. It can be seen that the weight of the optimized pavilion (
Figure 16) was 7% higher than the base component made of the same PP23CF material, but it was 31% lower than the SMC pavilion and 14% lower than the TCA pavilion. Moreover, the static stiffness was recovered in all the points considered in the roof (
Figure 17).
5.4. Dynamic Stiffness
The dynamic stiffness is defined as the ratio between the dynamic force and the corresponding displacement. It characterizes the elastic deformation of a component subject to a dynamic load.
Therefore, after the evaluation of the static stiffness, the next comparison between the different materials is based on their respective dynamic stiffness in the frequency range 50–400 Hz.
This analysis was carried out with the Nastran code, running a SOL 103 (Real Eigenvalue Analysis). The structure is excited in the frequency range with a unitary force and, at the same point, the corresponding displacement is recorded. Frequencies below 50 Hz are not considered because the global modes of the car predominate on the vibration modes of the pavilion.
In
Figure 18 the dynamic stiffness of the PP23CF component with the optimized geometry is compared with that of the component in TCA.
The results were post-processed with the HyperView software, showing, for all the considered points of the pavilion, an increase in the dynamic rigidity provided by the new material for the entire frequency range considered (50–400 Hz). Such an outcome is positive and plausible as the static rigidity of the component had already been recovered.
5.5. Modal Analysis
In order to assess the frequency modes and their shapes, a modal analysis was necessary but, if applied to the entire vehicle, including every subcomponent, would have involved a significant computational burden in terms of memory requirements, to store nearly 700 mode shapes in the range 0–400 Hz. For this reason, in order to be able to extract only the vibrating modes of the pavilion, it was necessary to perform a calculation of the pavilion inertia and, from the graphic display of the peaks of inertances, pinpoint the resonant frequencies corresponding to pavilion modes.
The procedure was implemented as follows:
calculation of pavilion inertance with a SOL 103 analysis,
graphical display of inertance peaks with highlight of the corresponding frequencies,
modal analysis of the complete model,
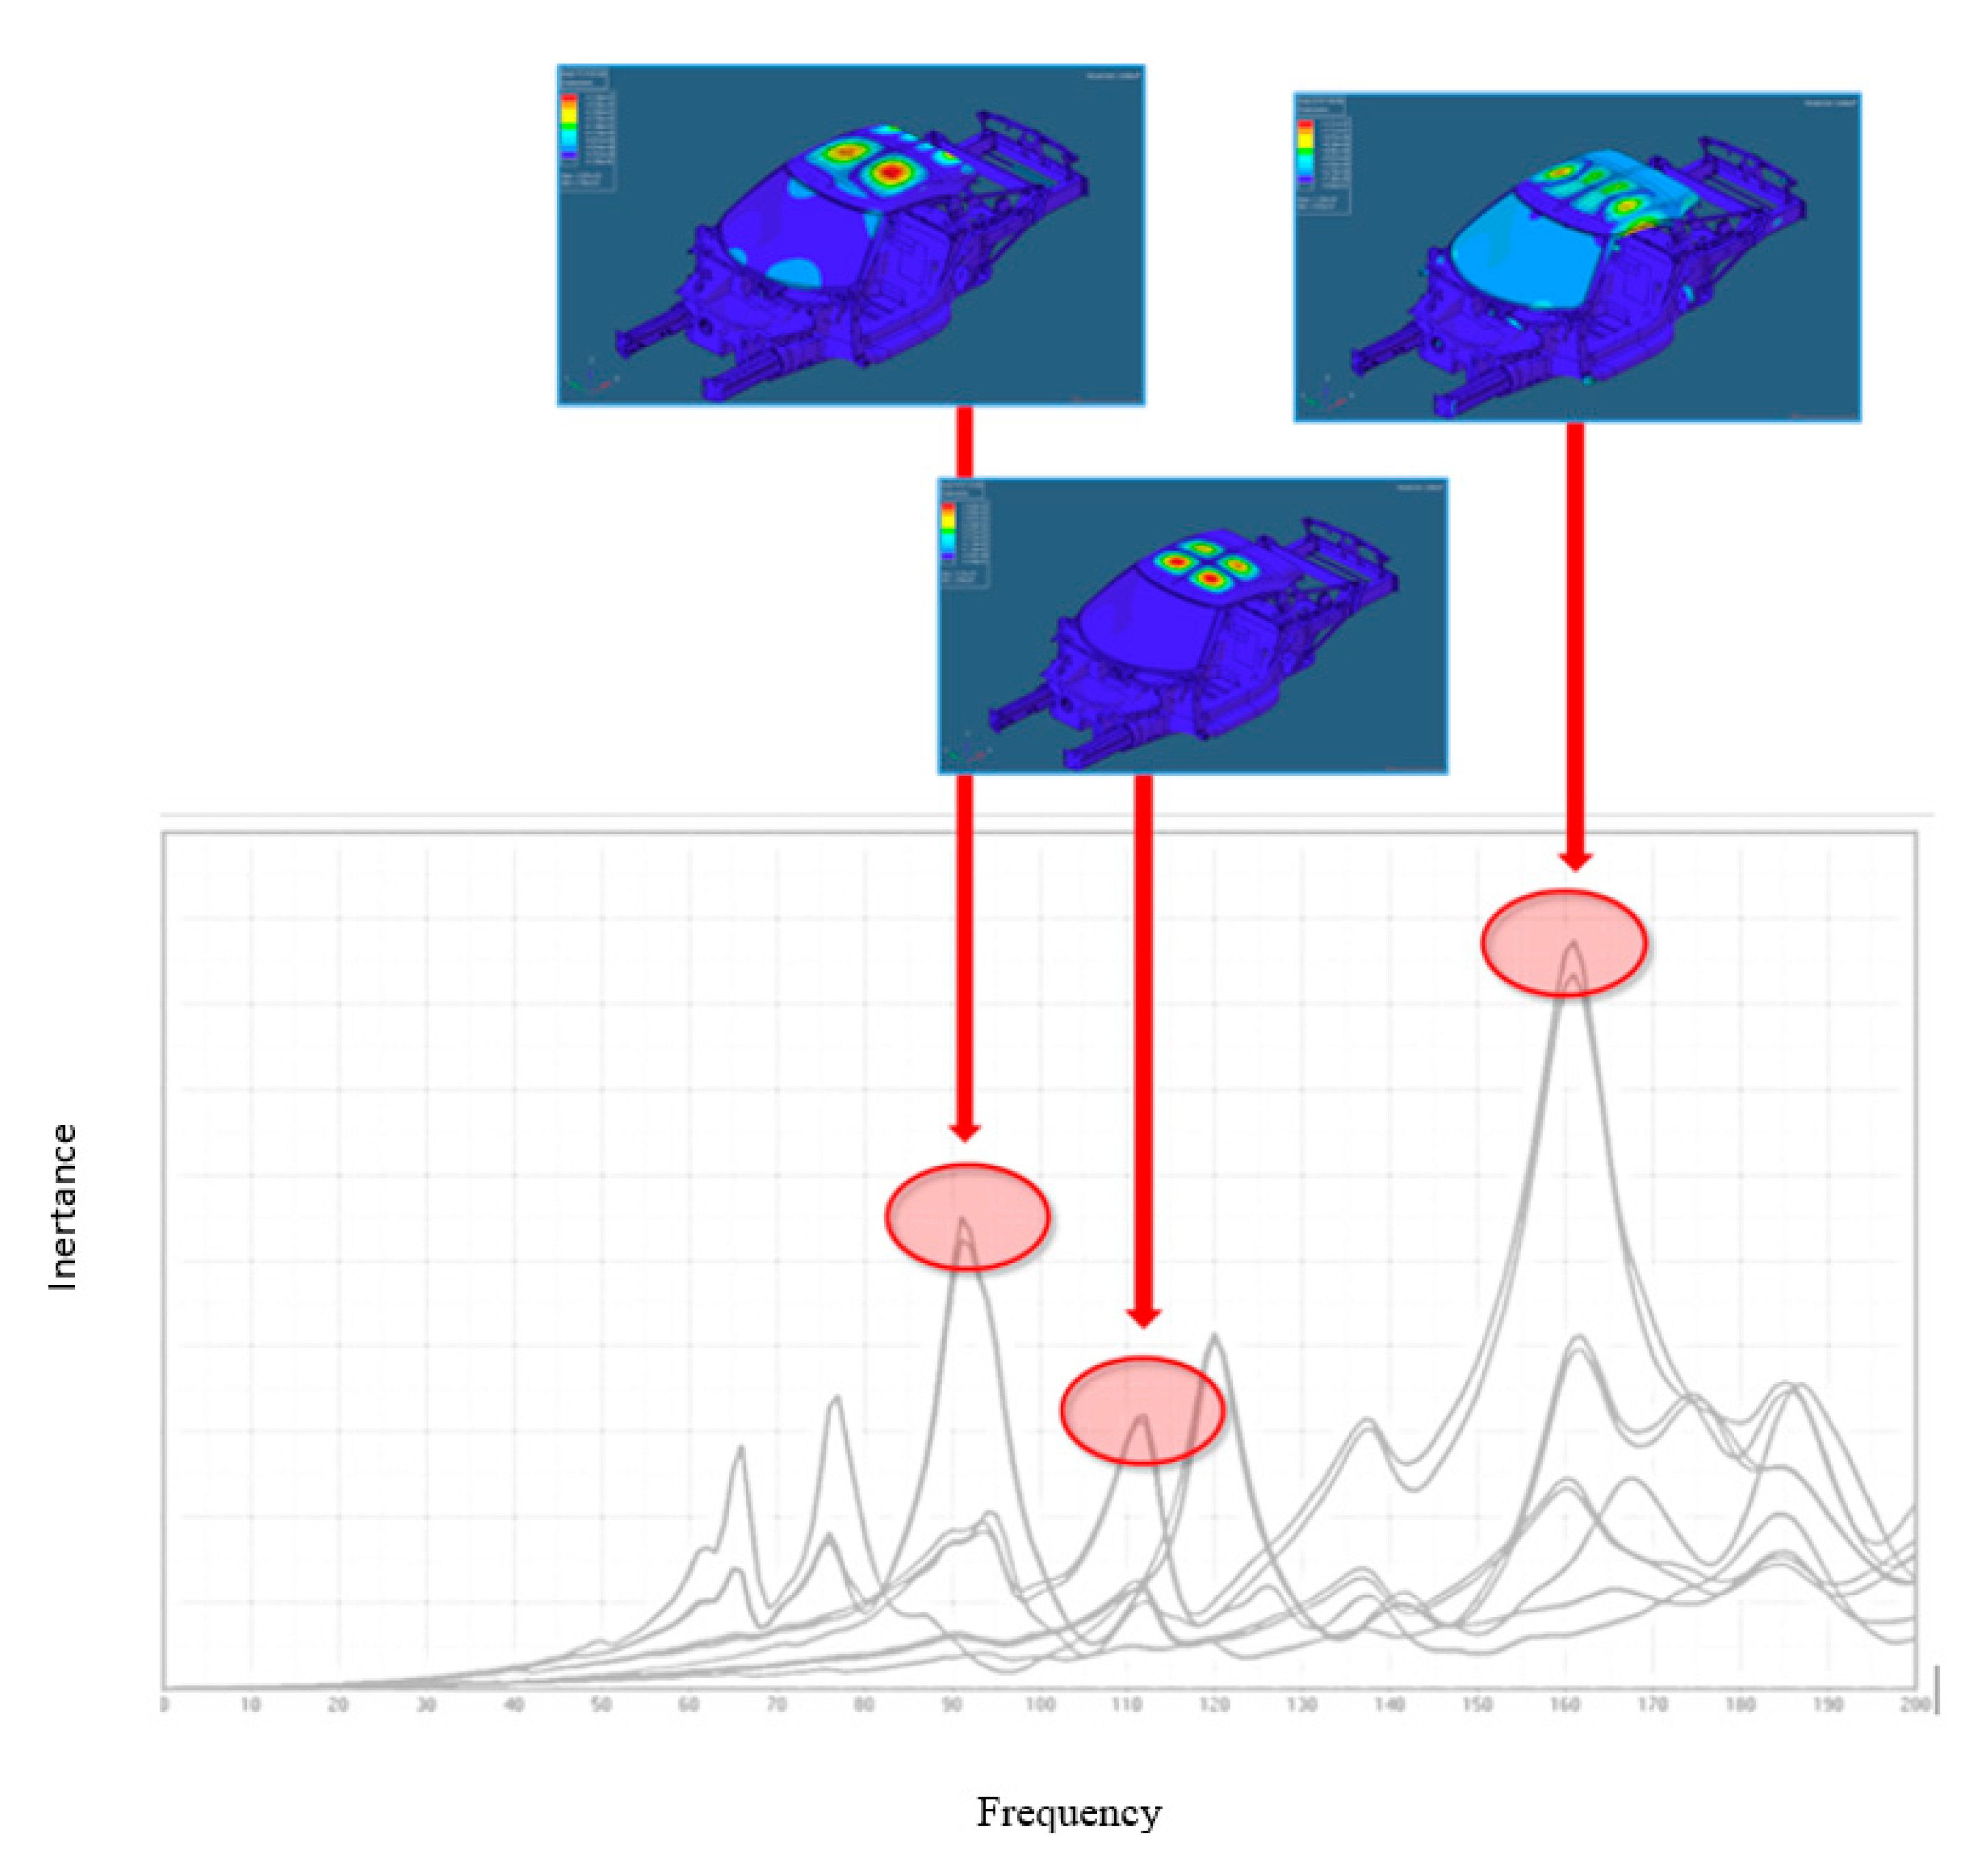
selection of the mode shapes whose frequencies are close to those identified by inertance peaks (
Figure 19).
The analysis was restricted to the vibration modes up to 160 Hz because, beyond this frequency, the modes become local and consequently not involving the pavilion.
Such an approach was applied to the pavilion made of TCA and PP23CF (
Figure 20).
For the pavilion made of composite material PP23CF OPTIMIZED it is possible to observe:
an increase in the number of resonant modes and a shape modification at lower frequencies (70–100 Hz) due to the geometric modifications of the pavilion,
a reduction in the number of resonant modes at higher frequencies (f > 130 Hz)
Usually, an increase in the number of resonant modes at lower frequencies is not positive, however, it is to be verified whether such modes are excited in the normal operation of the vehicle and if there is a coupling with the cavity modes.
5.6. Modeling of the Acoustic Cavity
In order to evaluate the cavity modes and vibroacoustic transfer functions, the modeling of the acoustic cavity of the passenger compartment was performed (
Figure 21).
This fluid volume was discretized by FEM with the ANSA software, discretizing it with cubic solid elements of variable size (
Table 2).
The choice of the maximum size for the cavity mesh (
Figure 22) was made by considering six elements per wavelength:
where
f is the maximum frequency of interest, equal to 900 Hz,
c is the speed of sound in the fluid of interest, in this case, air.
After having discretized the cavity, a FEM modal analysis was carried out to find out the cavity modes (
Figure 23). The analysis was carried out with the Nastran SOL 103 in the frequency range 0–900 Hz. From
Figure 23, it is possible to highlight a first longitudinal mode at 107.6 Hz and a second transversal mode at 131.6 Hz, then a mixed local (involving the anterior part of the cavity transversely)-global (involving in an oblique direction the remaining part of the cavity) mode at 182.1 Hz, etc. (increasing the frequency, the modes assume a more complex shape and, on the other hand, progressively become of reduced interest for our purposes).
5.7. Fluid-Structure Coupling
To evaluate possible couplings of the pavilion’s vibrating modes and cavity’s vibrating modes, it is necessary to evaluate and compare their resonant frequencies and mode shapes.
The pavilion was energized in the center (point 2), and the inertances between 0 and 400 Hz were calculated for both PP23FC and TCA (
Figure 24).
The PP23CF pavilion presents two structural modes at low frequencies, up to the frequency of 80 Hz. However, the absence of cavity modes in the frequency range 0–80 Hz and the high damping level provided by the new material should protect against very significant in-cabin sound pressure increases.
Some problems could come in the interval between 120 Hz (structural mode) and 132 Hz (cavity mode), not only because of the vicinity of the two peaks but also because of the similarity of related mode shapes. Much relevant in this case is the structural damping value that should be sufficiently high to smooth the structural peak within a small frequency interval.
5.8. Vibroacoustic Transfer Functions
The Vibroacoustic Transfer Functions, FdT, (also called “P/F”) represent the ratio between the sound pressure levels at the listening points inside the passenger compartment and the force levels that, applied at the body entry points, generated them. They characterize the acoustic response of the car body evaluated at the standard listening points (from a customer perspective), in correspondence of the driver’s right ear and the passenger’s left ear. In the case in question, since the car is the Alfa Romeo 4C, the rear passenger is not present.
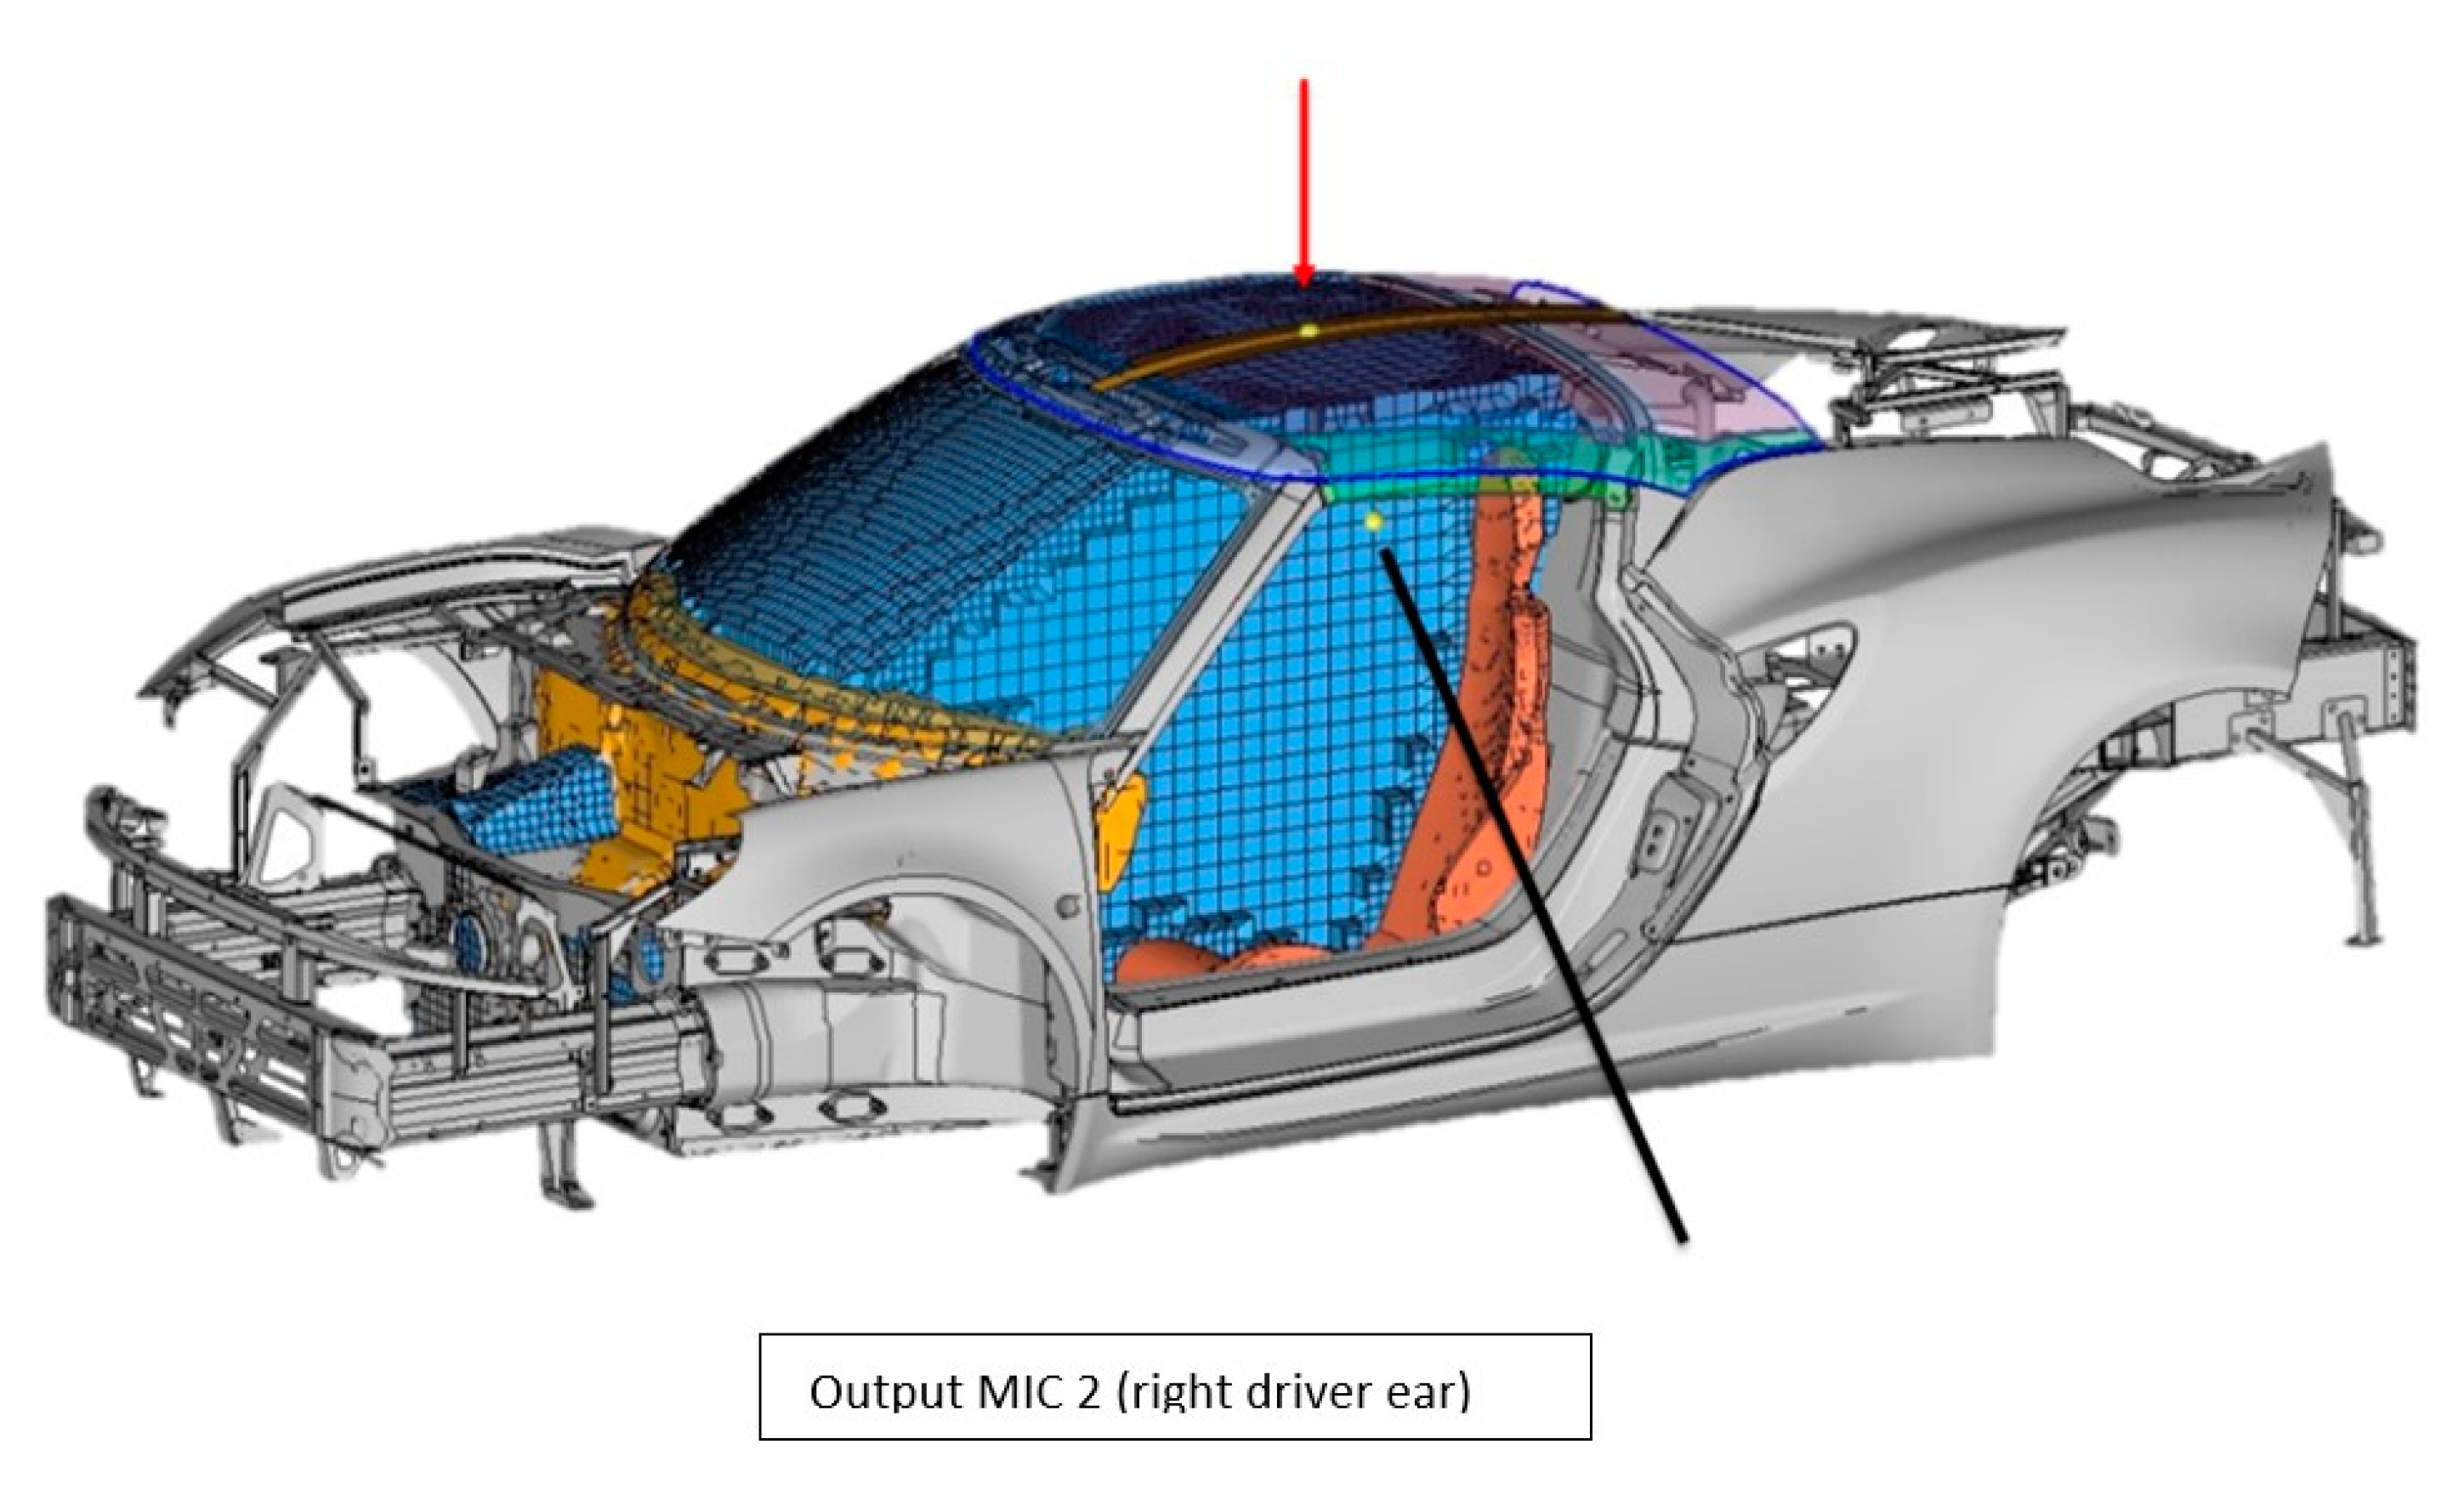
The coordinates of the driver listening points are calculated with respect to the seats (
Figure 25) as in the followings:
X: Back seat intersection,
Y: Center line back + 20 cm,
Z: Back seat intersection + 70 cm.
In order to observe and compare the acoustic contribution in the aforementioned points provided by the PP23CF OPTIMIZED or TCA pavilion, the point where exciting the structure was chosen in the pavilion center (
Figure 26).
The vibroacoustic transfer functions were calculated with the Nastran SOL 111 Modal Frequency Response Analysis (according to FCA internal rules).
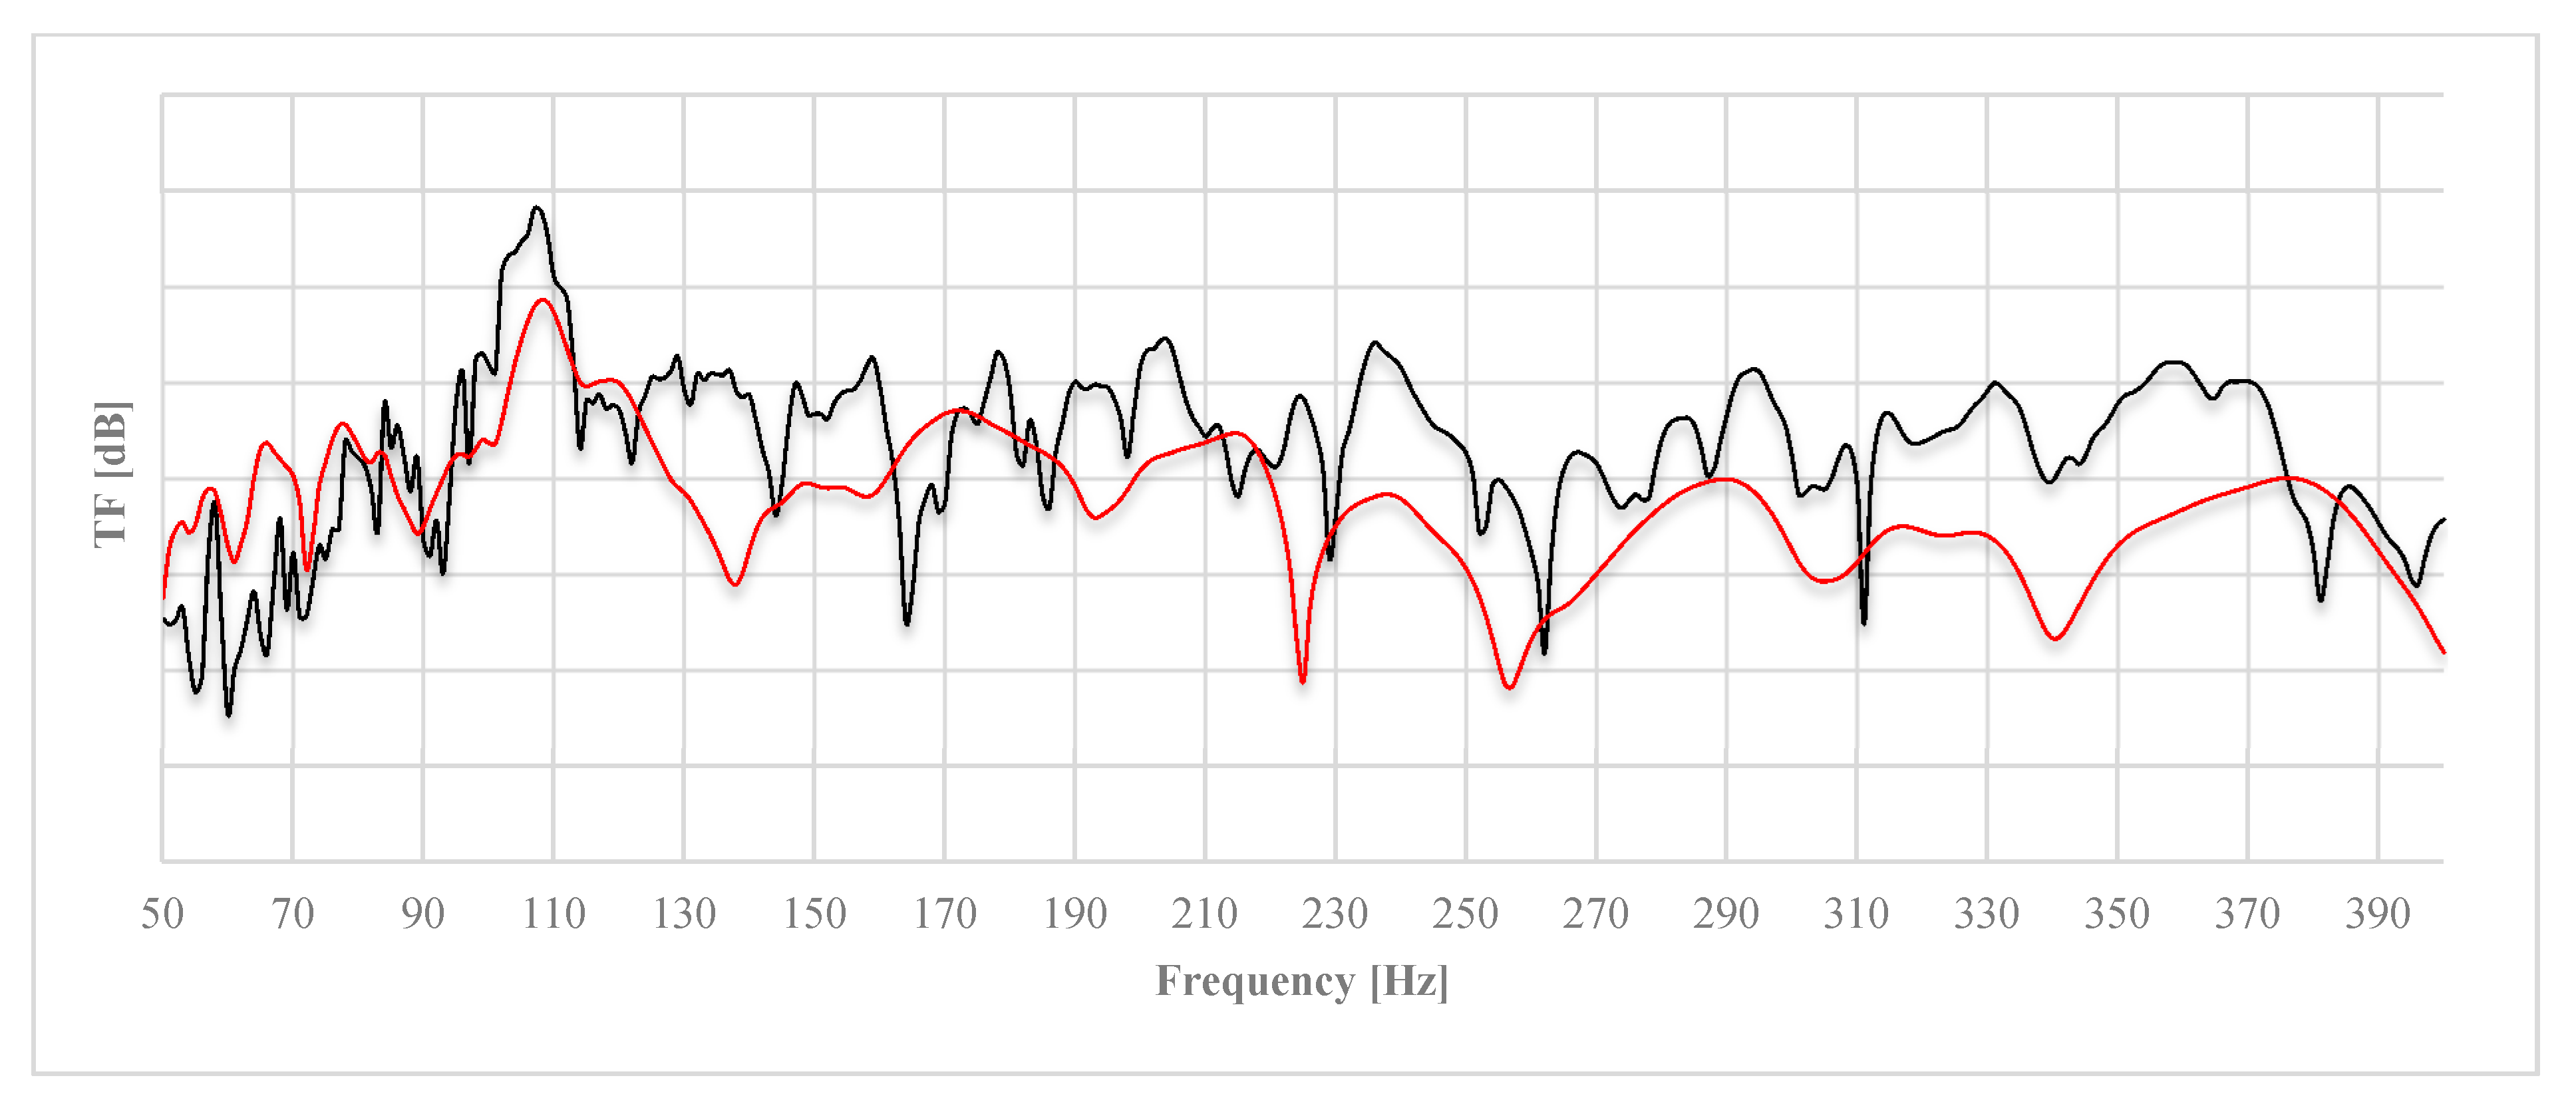
From the graph in
Figure 27, it is possible to observe:
an improvement in almost the entire frequency range provided by the new material,
a worsening limited to the very low frequencies, where the PP23CF pavilion strongly vibrates, when exciting the pavilion in the center.
Moreover, in order to reproduce the working conditions of the vehicle, it was decided to excite the shock absorber attachment point, which is the most critical point, on which all the weight of the vehicle rests (
Figure 28).
The vibroacoustic transfer functions were assessed in the same way, evaluating both the contribution of the pavilion alone (
Figure 29) and the vibroacoustic transfer functions, which include all the contributions of the panels adjacent to the cavity (
Figure 30).
there is no longer a deterioration at low frequencies because the involved vibration modes are not excited,
there is an improvement in the whole frequency range, with improvement peaks of 9%.


