
Geochemical Assessment and Mobility of Undesired Elements in the Sludge of the Phosphate Industry of Gafsa-Metlaoui Basin, (Southern Tunisia)


Abstract
1. Introduction
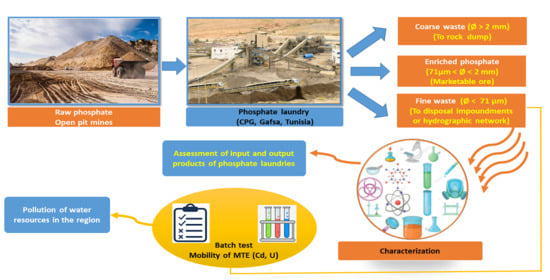
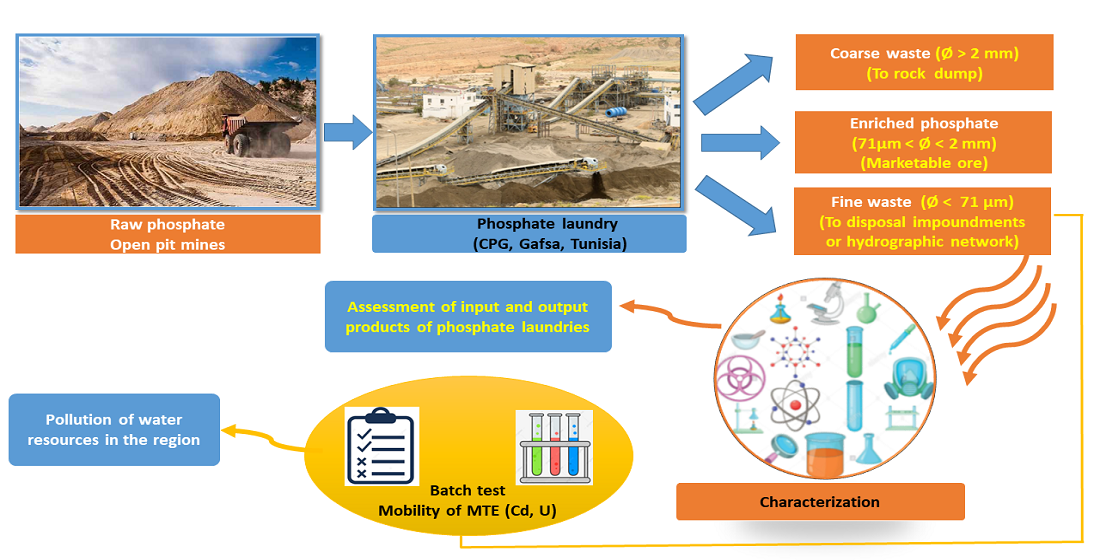
2. Materials and Methods
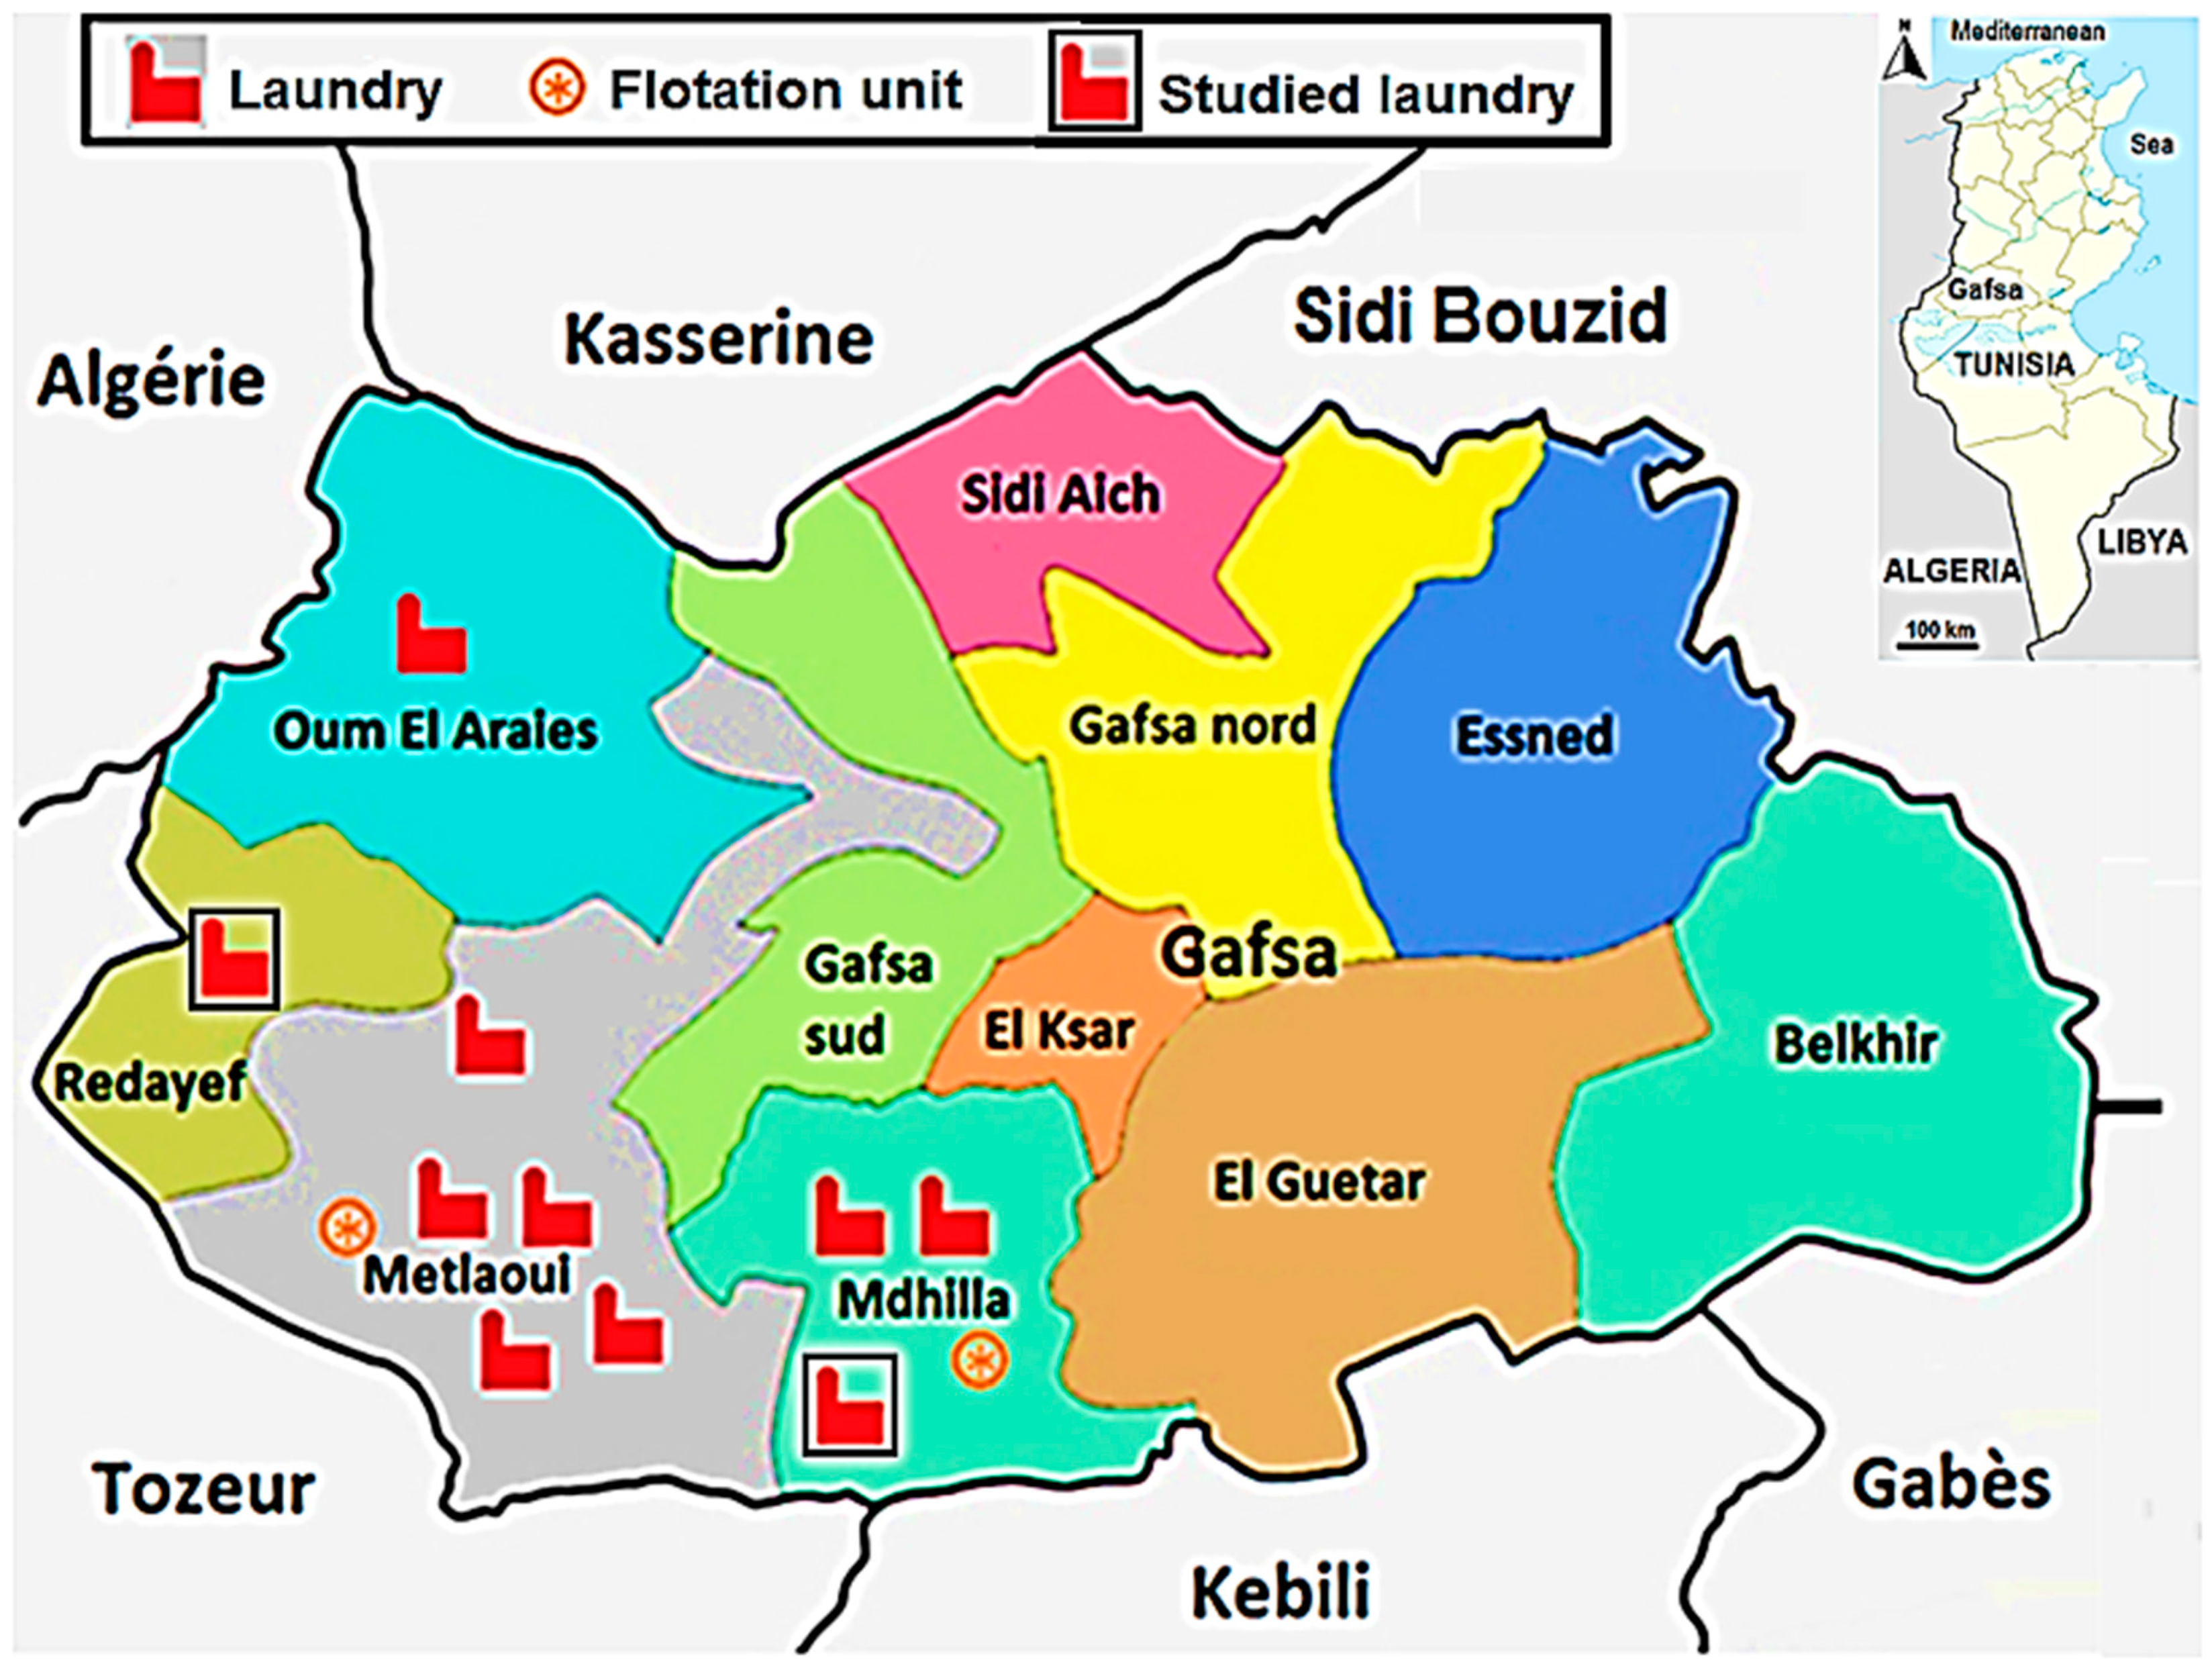
2.1. Study Area
2.2. Phosphates Deposits
2.3. Sampling and Preparation
2.4. Methods
3. Results and Discussion
3.1. Characterization of the Inputs and Output Products of the Phosphate Laundries
3.1.1. Particle-Size Analysis
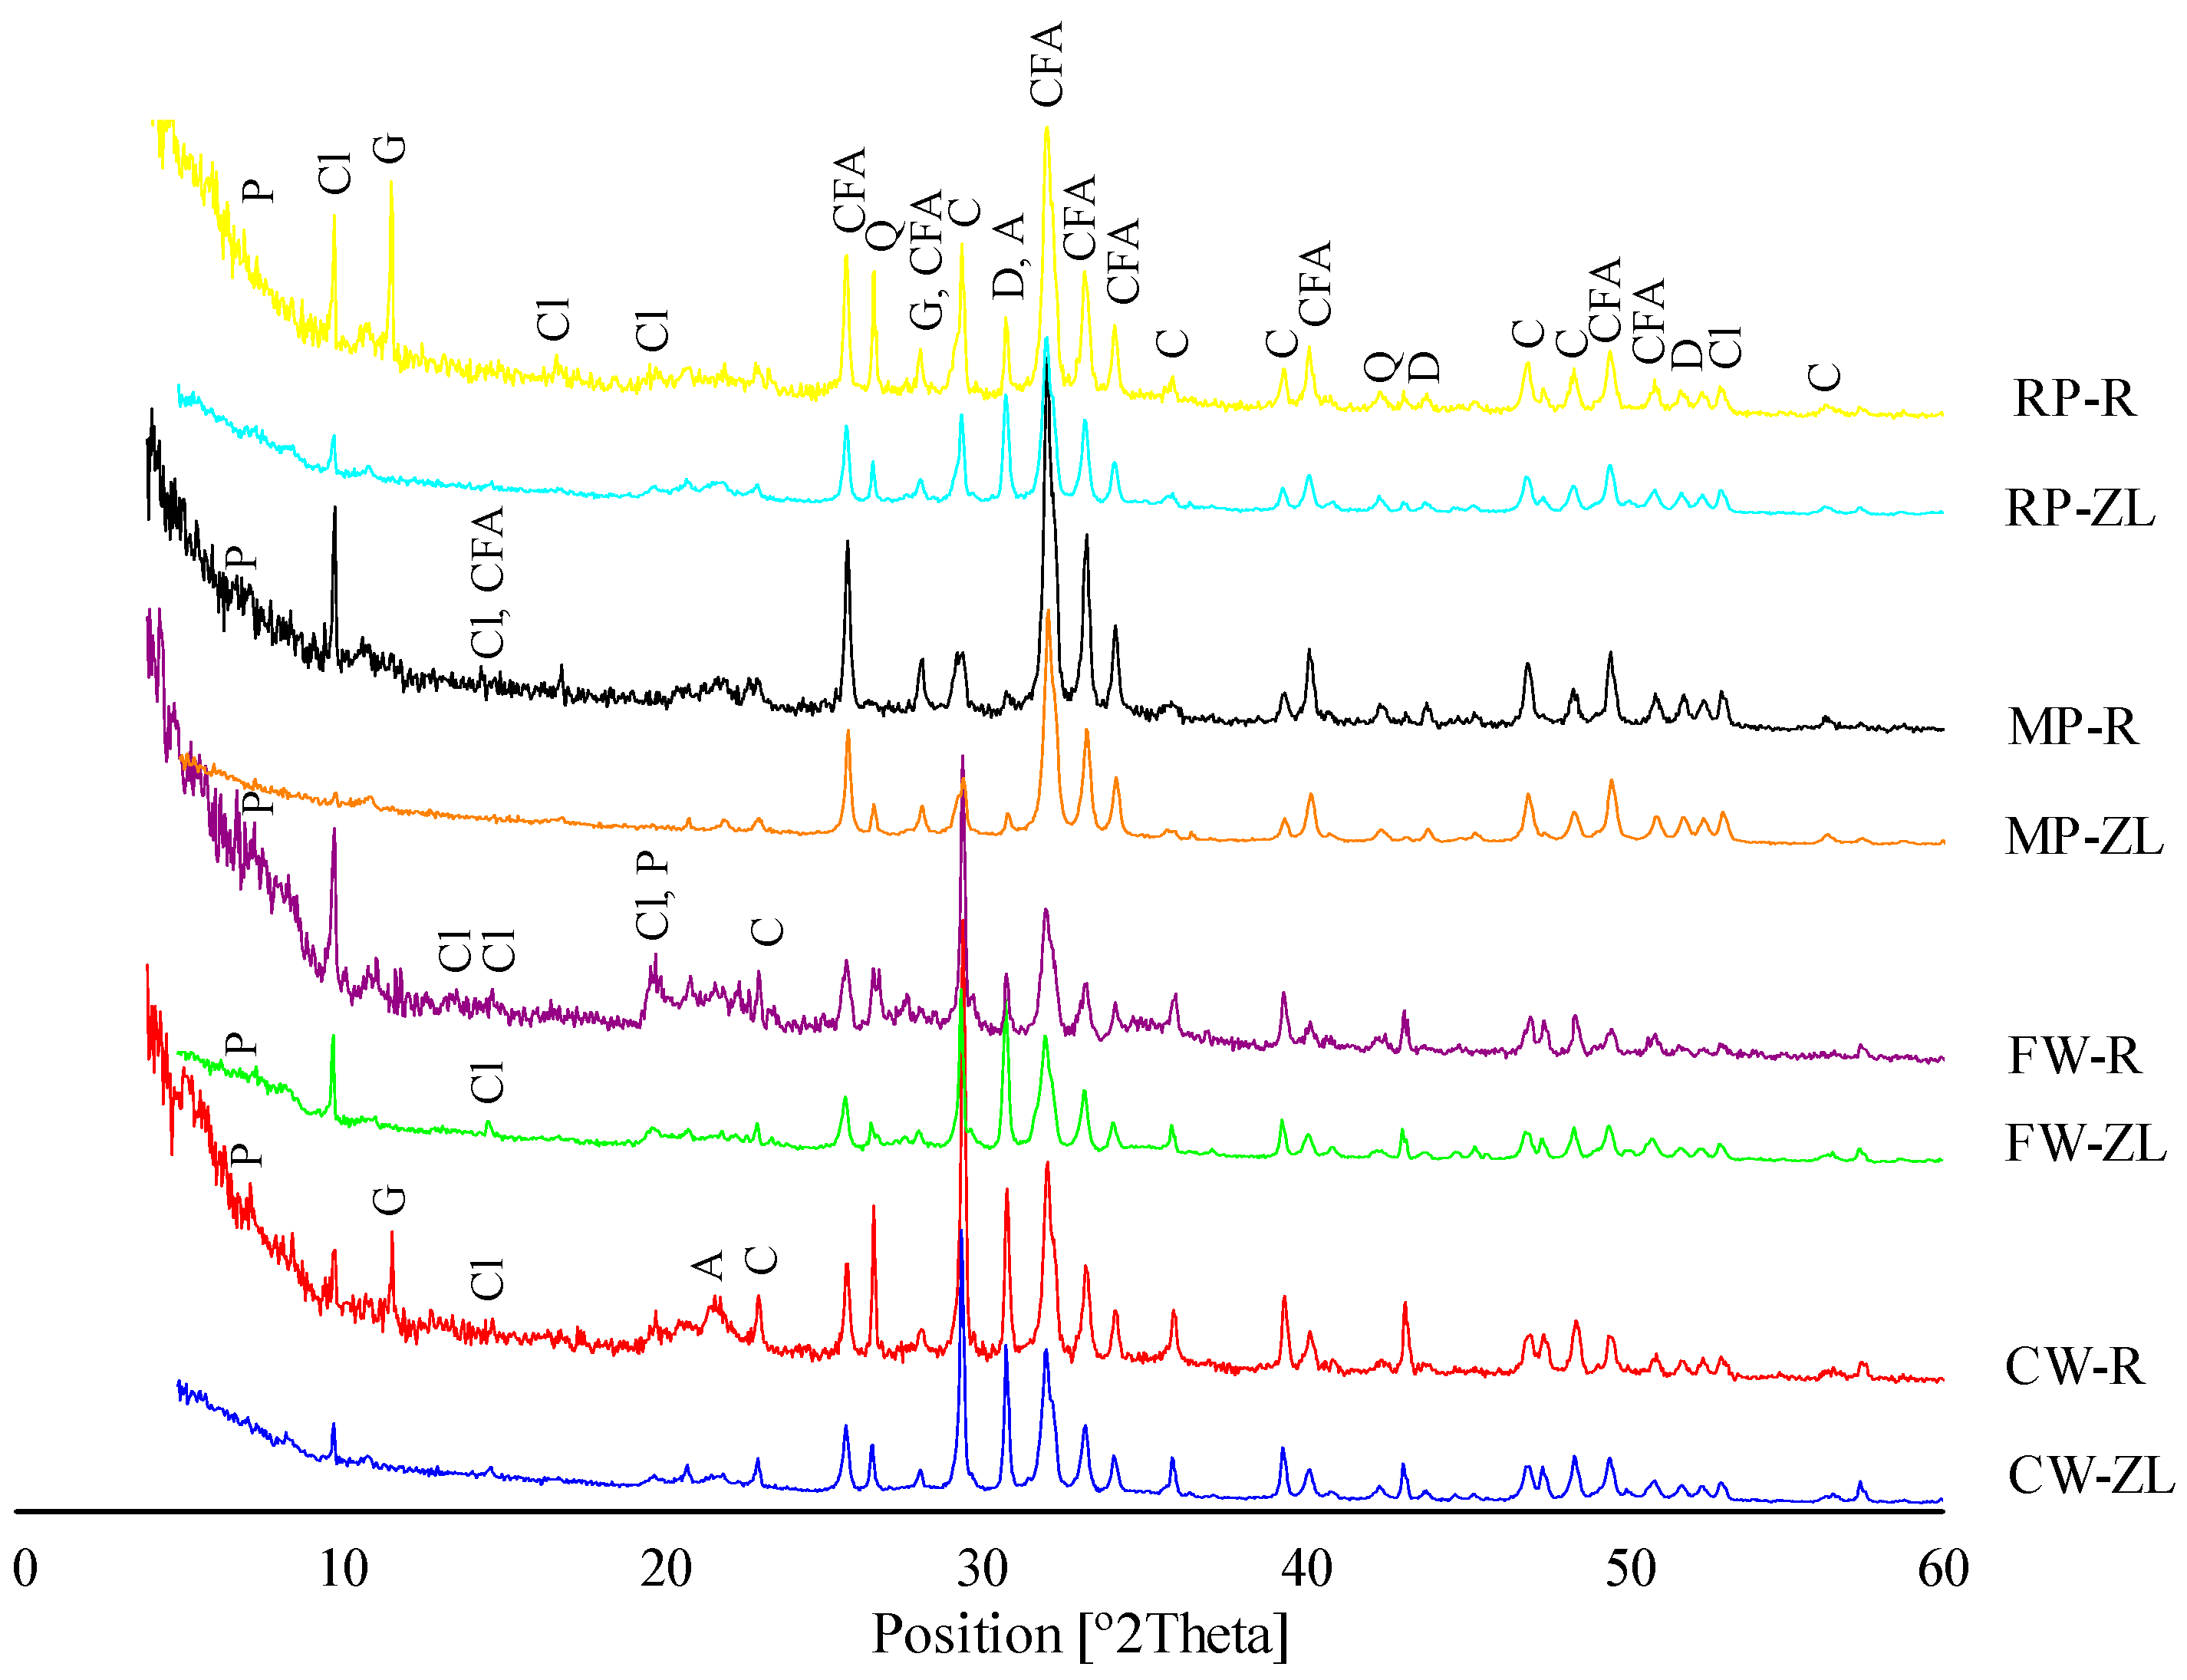
3.1.2. Mineralogy
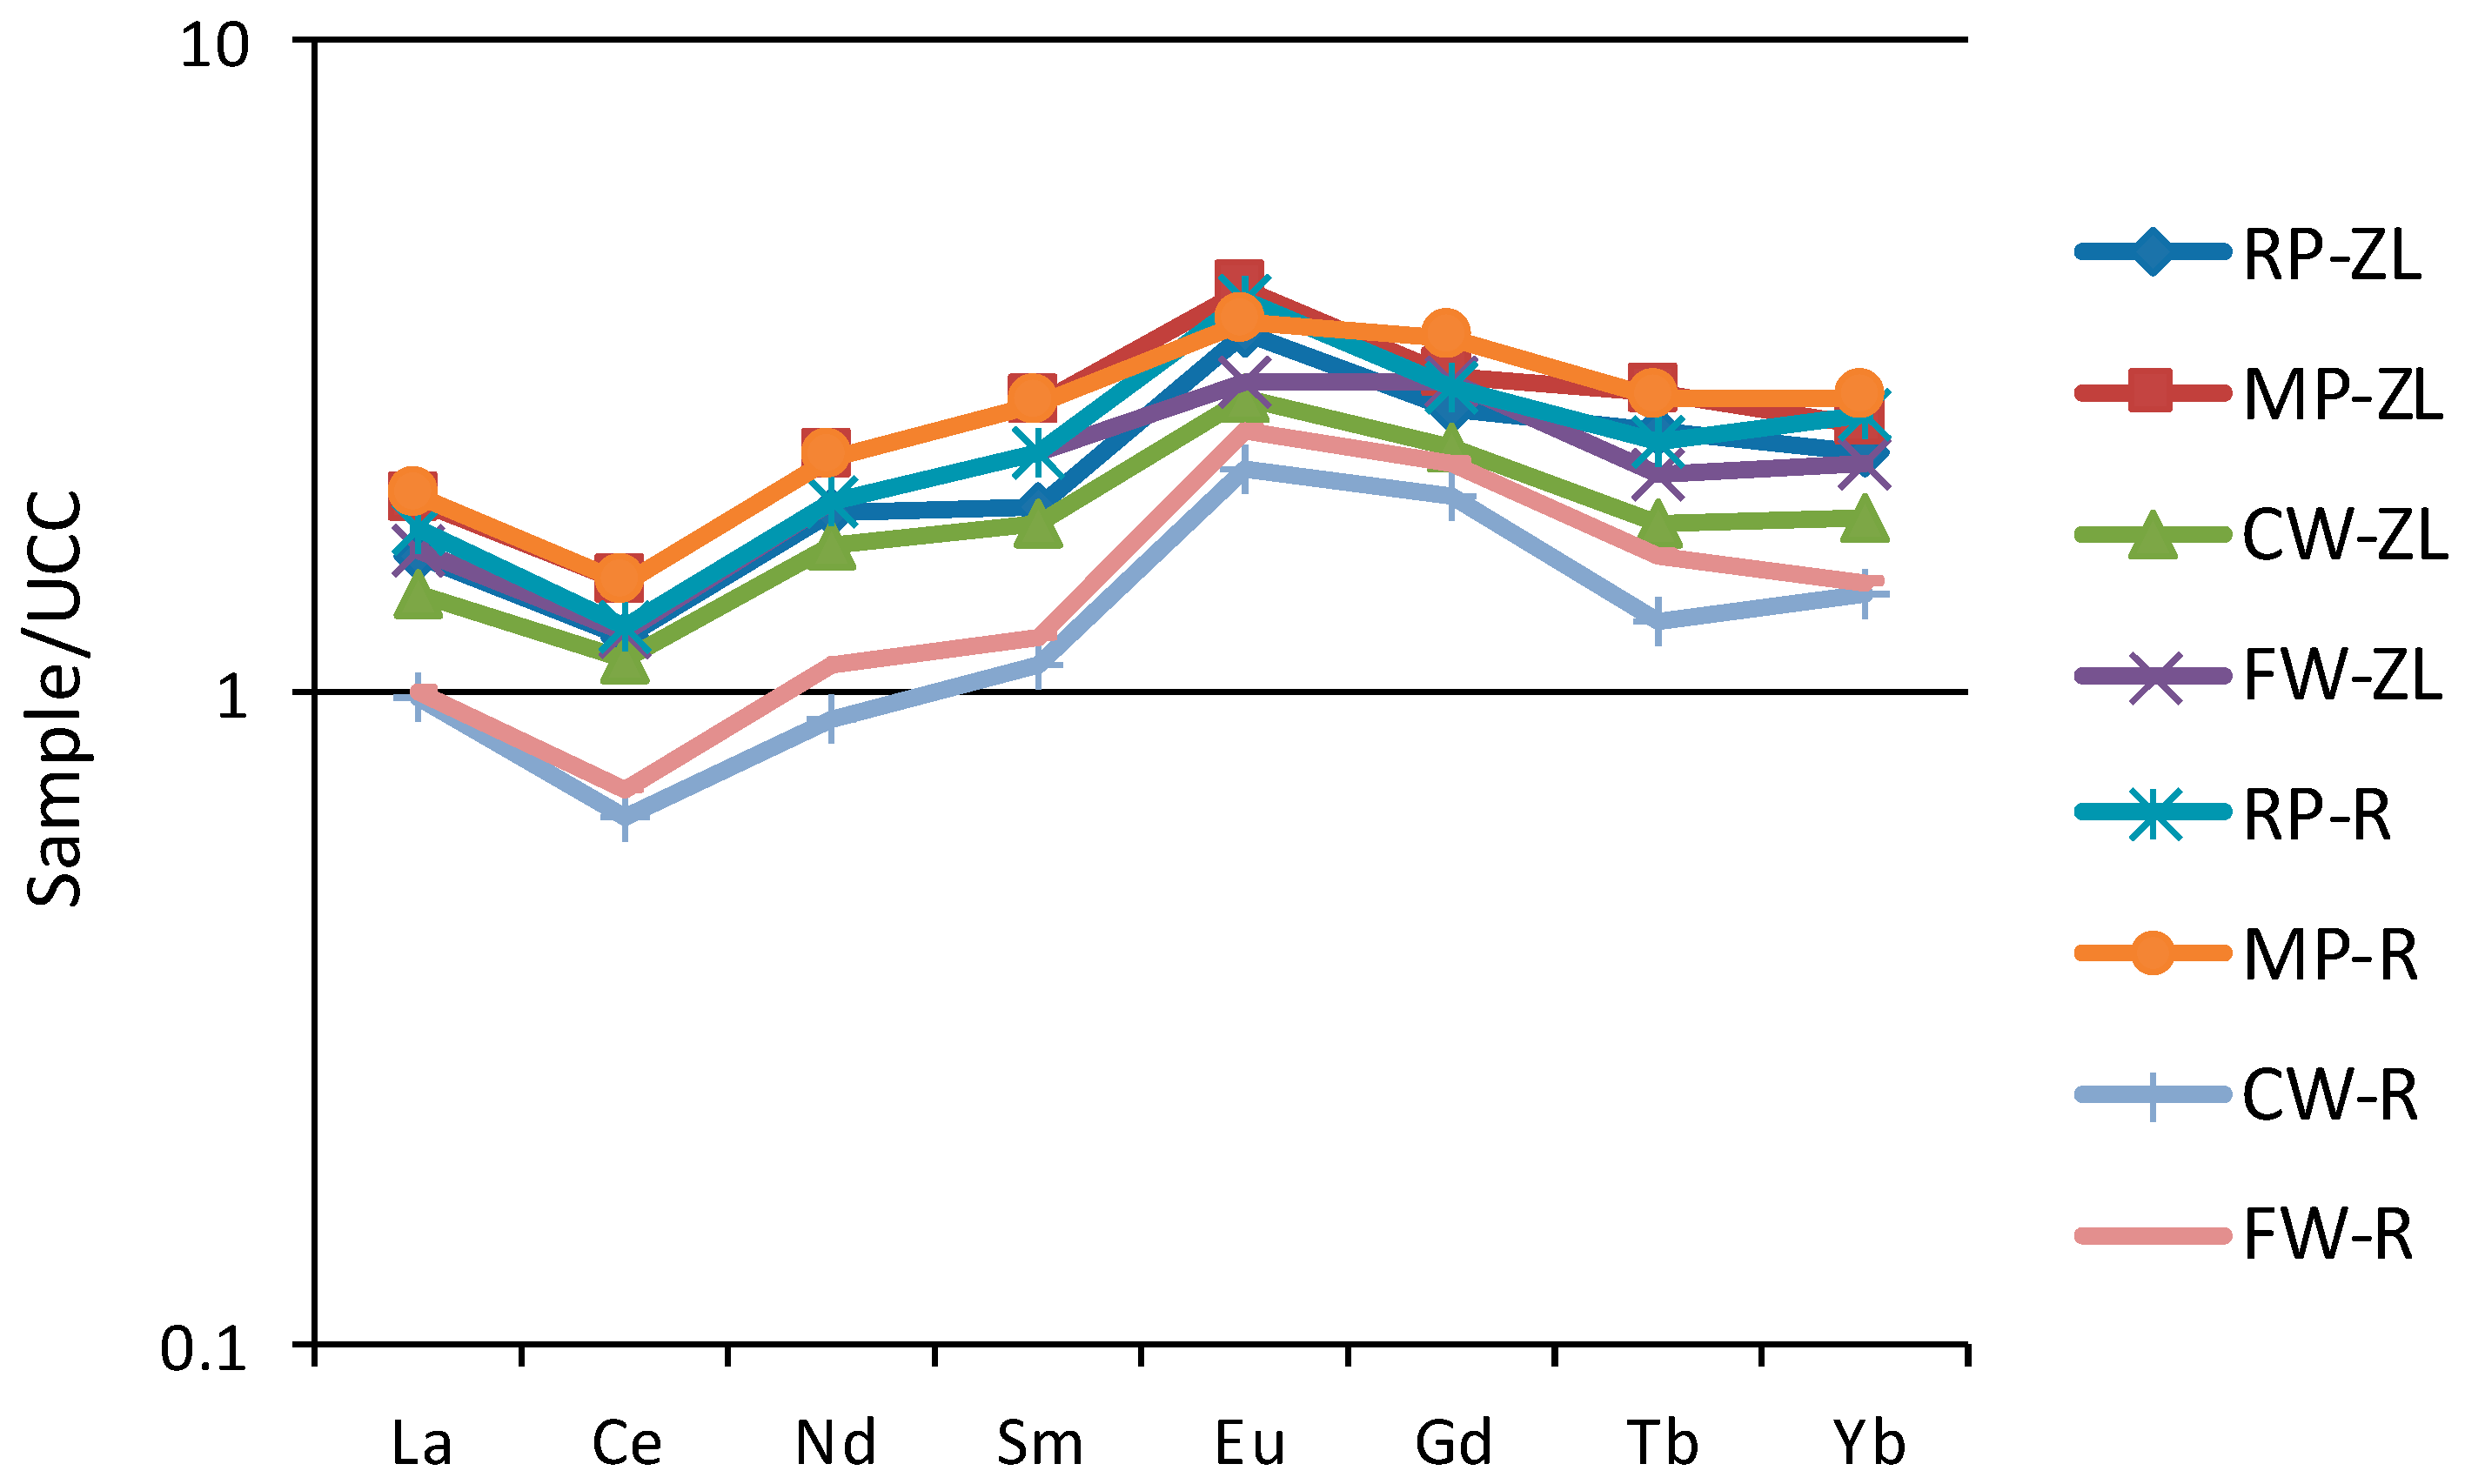
3.1.3. Geochemistry
3.1.4. Water Quality
3.2. Evaluation of Fine Waste-Iron Mobility: Batch Experiments
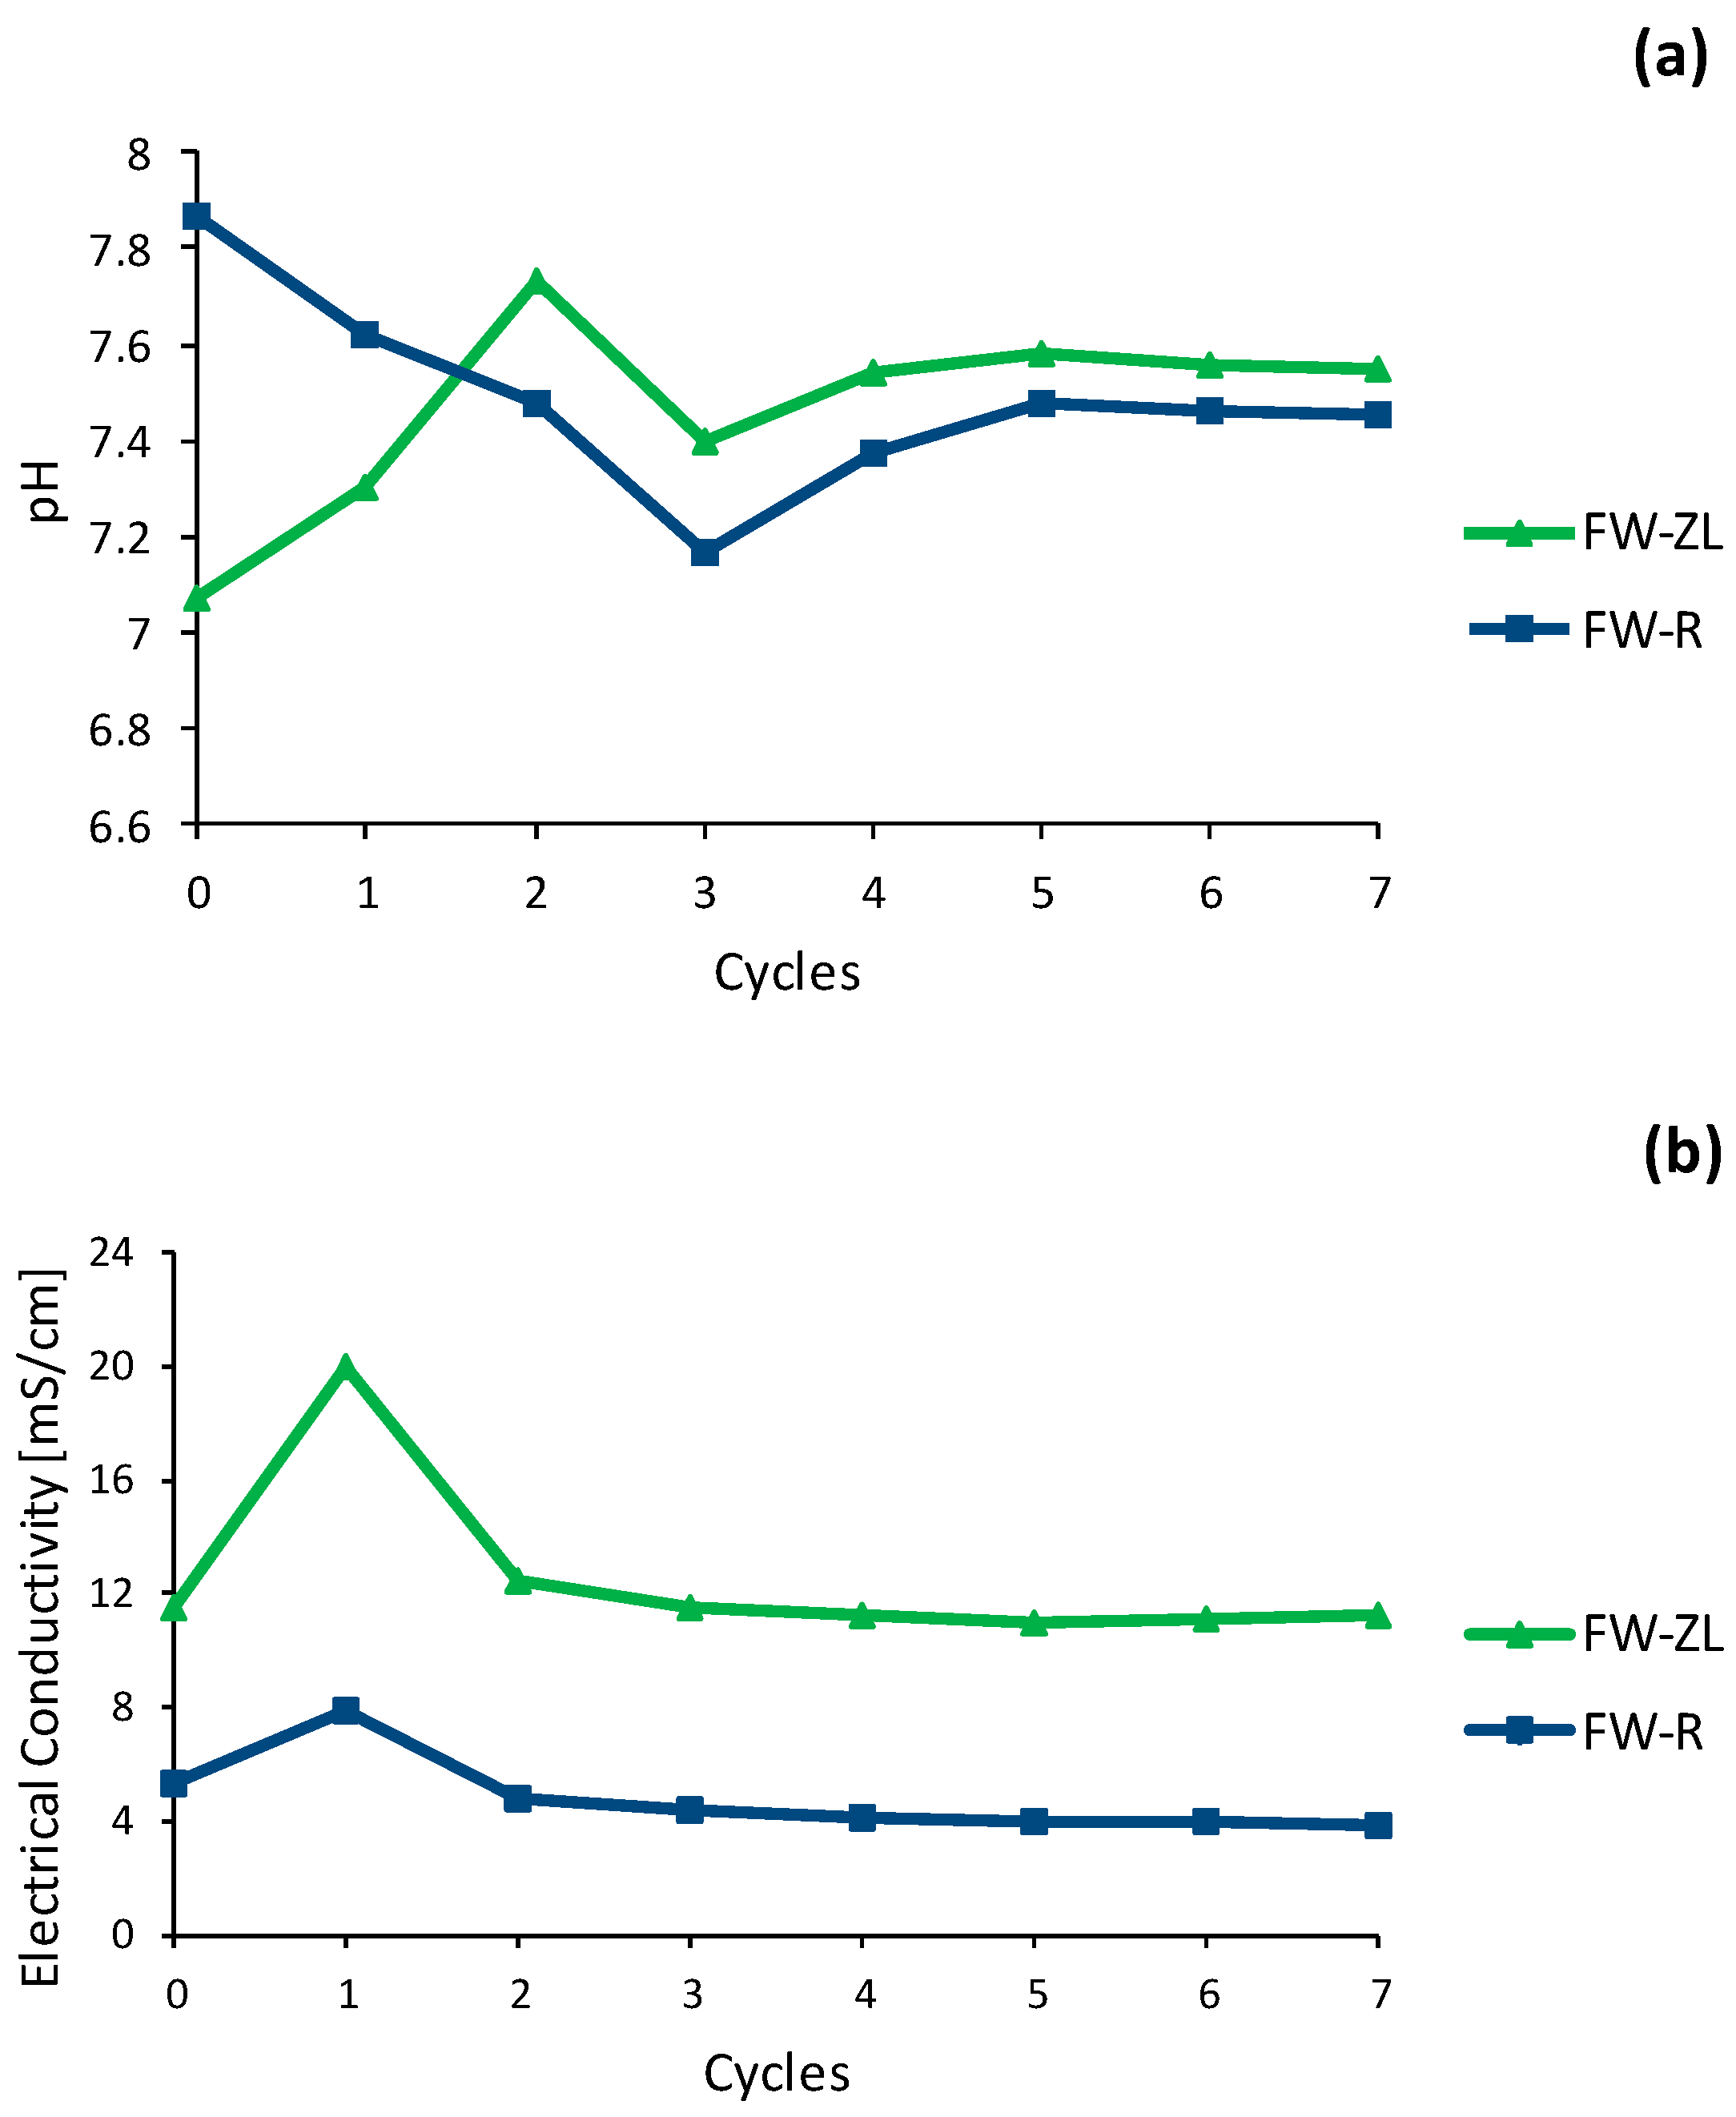
3.2.1. pH and Conductivity
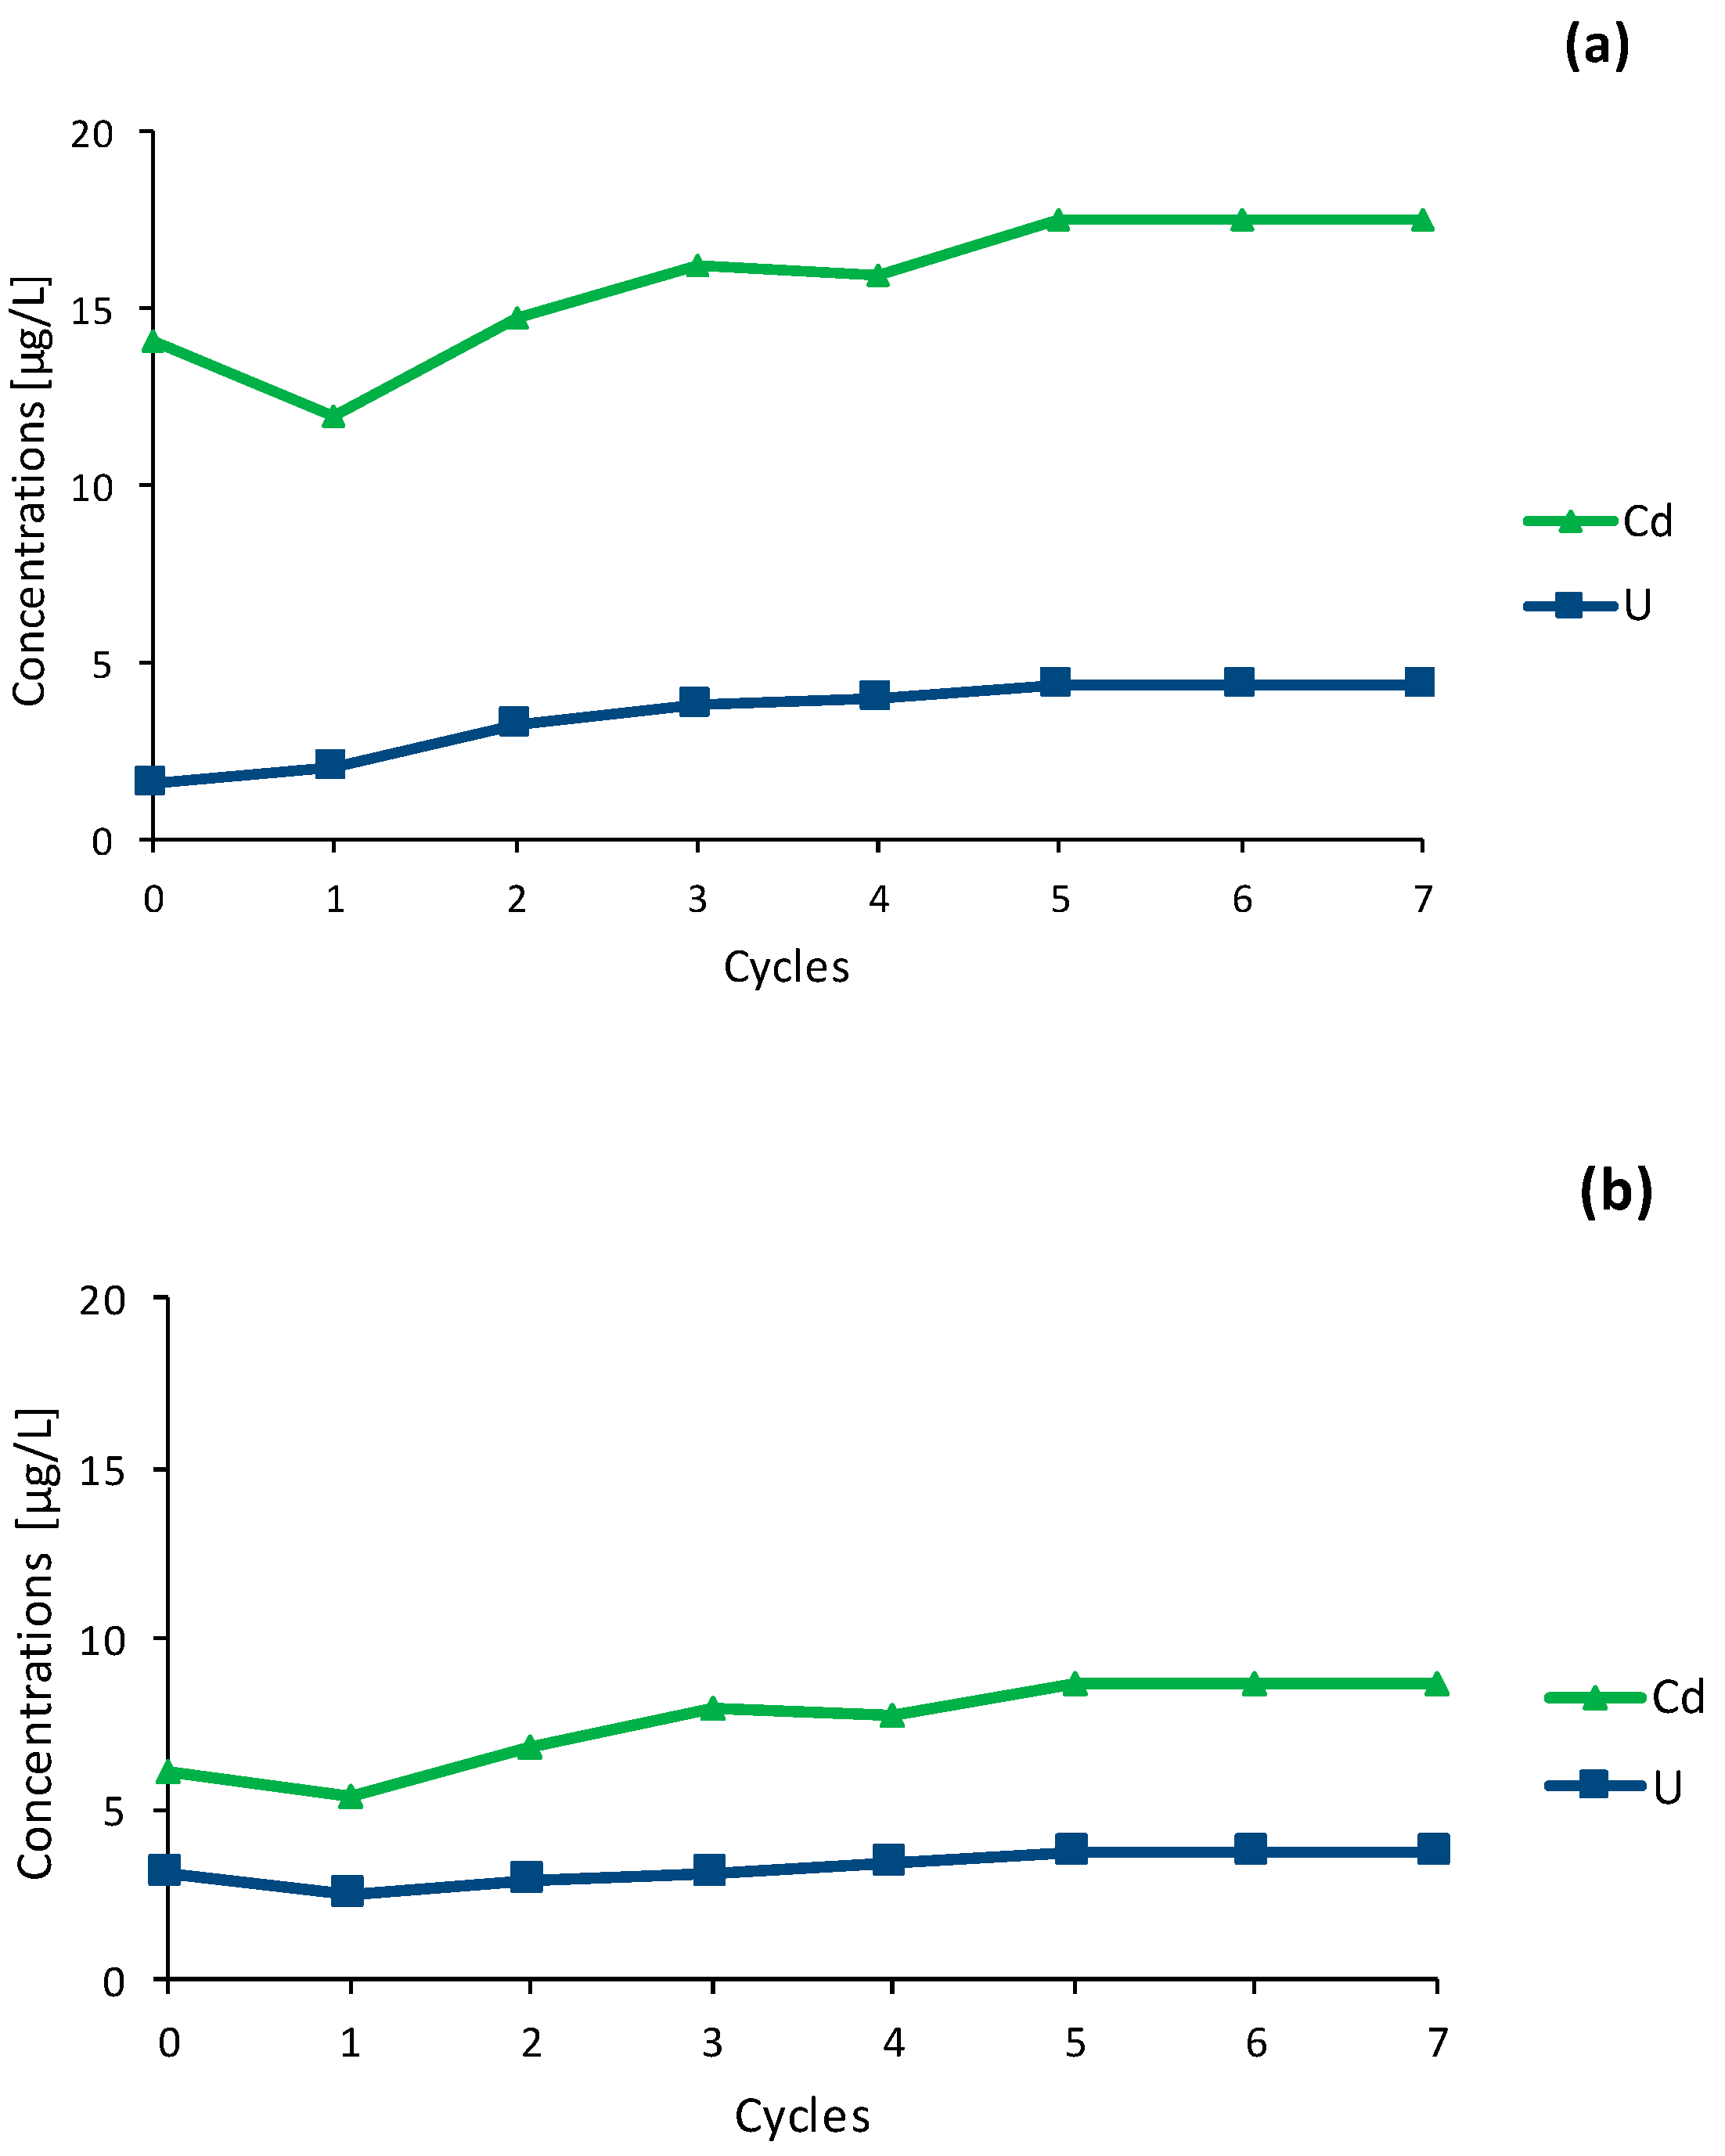
3.2.2. Mobilisation of Cd and U
3.3. Discussion
4. Conclusions
Author Contributions
Funding
Acknowledgments
Conflicts of Interest
References
- U.S. Geological Survey (USGS). Mineral Commodity Summaries 2020; U.S. Government Publishing Office: Reston, VA, USA, 2020.
- Ruan, Y.; He, D.; Chi, R. Review on beneficiation techniques and reagents used for phosphate ores. Minerals 2019, 9, 253. [Google Scholar] [CrossRef]
- Boujlel, H.; Daldoul, G.H.; Tlil, H.; Souissi, R.; Chebbi, N.; Fattah, N.; Souissi, F. The beneficiation processes of low-grade sedimentary phosphates of Tozeur-Nefta deposit (Gafsa-Métlaoui Basin: South of Tunisia). Minerals 2019, 9, 2. [Google Scholar] [CrossRef]
- Groupe-conseil Genivar Inc (GCGI); Société Centrale pour l’Equipement du Territoire (SCET). Environmental Impact Study of the Fine Discharges from the Phosphate Laundries of the Compagnie des Phosphates de Gafsa. Phase I, Step A: Description of the Receiving Environment; Internal Report; The Compagnie des phosphates de Gafsa, Document SCET: Tunis, Tunisia, 2001. [Google Scholar]
- Mhemdi, S. Study of Fine Discharges from Laundries and the Phosphate Processing Industry and Their Impact on the Environment; D.A.S., University of Tunis II: Tunis, Tunisia, 1999. [Google Scholar]
- Ounis, A. Environmental characterization of the M’Dhilla region (South Gafsa Basin). In Study of Discharges from the M’Dhilla Plant and the Gafsa Phosphate Company’s Laundries; D.A.S., University of Tunis El Manar: Tunis, Tunisia, 2002. [Google Scholar]
- Galfati, I.; Bilal, E.; Beji Sassi, A.; Abdallah, H.; Zaeir, A. Accumulation of heavy metals in native plants growing near the phosphate treatment industry, Tunisia. Carpathian J. Earth Environ. Sci. 2011, 6, 85–100. [Google Scholar]
- Galfati, I.; Bilal, E.; Abdallah, H.; Sassi, A.B. Geochemistry of solid effluents and phosphate ore washed from Métlaoui-Gafsa Basin, Tunisia. Rom. J. Mineral. Depos. 2014, 87, 83–86. [Google Scholar]
- Chokri, A.; Hatira, A.; Zarai, N.; Abdeljaouad, S. Impact of discharges from phosphate laundries on the concentration of heavy metals in soils and plants in the Gafsa-Métlaoui mining basin (Southwest Tunisia). Rev. Méditerranéenne L’Environnement 2006, 1, 121–134. [Google Scholar]
- Galfati, I. Study of the phosphorites of Jbel Oum EL Khecheb and Impact of Discharges from the Phosphate Industry on the Environment in the Gafsa-Métlaoui Basin. Ph.D. Thesis, University of Tunis El Manar, Tunis, Tunisia, 2010. [Google Scholar]
- Giroux, M.; Audesse, P. Comparison of two methods for the determination of organic carbon, total nitrogen and C/N ratio of various organic amendments and farmyard fertilizers. Agrosol Revue Agroenvironnement 2004, 15, 107–110. [Google Scholar]
- Taylor, S.R.; McLennan, S.M. The Continental Crust: Its Composition and Evolution; Blackwell Scientific Publications: Oxford, UK, 1985. [Google Scholar]
- Juste, C. Application of mobility and bioavailability of trace elements in soil. Sci. Du Sol. 1988, 26, 103–112. [Google Scholar]
- Manceau, A.; Marcus, M.A.; Tamura, N. Quantitative speciation of heavy metals in soils and sediments by synchrotron X-ray techniques. In Reviews in Mineralogy and Geochemistry Applications of Synchrotron Radiation in Low-Temperature Geochemistry and Environmental Science; Fenter, P., Rivers, M., Sturchio, N.C., Sutton, S., Eds.; Mineralogical Society of America: Washington, DC, USA, 2002; pp. 341–428. [Google Scholar]
- Sigg, L.; Behra, P.; Stumm, W. Chemistry of aquatic environments—Chemistry of natural waters and interfaces in the environment; Dunod: Paris, France, 2000. [Google Scholar]
- Deurer, R.; Forstner, U.; Schmoll, G. Selective chemical extraction of carbonate-associated metals from recent lacustrine sediments. Geochim. Cosmochim. Acta 1978, 42, 425–427. [Google Scholar] [CrossRef]
- Gibbs, R.J. Mechanism of trace metal transport in rivers. Nature 1973, 180, 71–73. [Google Scholar] [CrossRef]
- Cameron, E.M. Geochemical methods of exploration for massive sulphide mineralization in the Canadian Shield. In Geochemical Exploration; Elliott, I.L., Fletcher, W.K., Eds.; Elsevier: Amesterdam, The Netherlands, 1974; pp. 21–49. [Google Scholar]
- Kim, A.G. Leaching methods applied to the characterization of coal utilization by-products. Proceedings of Regulation Risk, and Reclamation with Coal Combustion by-Productsat Mines; Vories, K.C., Harrington, A., Eds.; A technical inetractive forum, Held in Conjunction with the World of Coal Ash. Lexington Center, Heritage Hall: Lexington, KY, USA, 2005; pp. 89–96. [Google Scholar]
- Esakku, S.; Karthikeyan, O.P.; Joseph, K.; Nagendran, R. Heavy Metal Fractionation and Leachability Studies on Fresh and Partially Decomposed Municipal Solid Waste. Pract. Period. Hazard. Toxic Radioact. Waste Manag. 2008, 12, 127–132. [Google Scholar] [CrossRef]
- Kosson, D.S.; Van der Sloot, H.A.; Sanchez, F.; Garrabrants, A.C. An Integrated Framework for Evaluating Leaching in Waste Management and Utilization of Secondary Materials. Environ. Eng. Sci. 2002, 19, 159–204. [Google Scholar] [CrossRef]
- Townsend, T.; Jang, Y.C.; Tolaymat, T. A Guide to the Use of Leaching Tests in Solid Waste Management Decision Making, Report #03-01(A), Prepared for: The Florida Center for Solid and Hazardous Waste Management, University of Florida. 2003. Available online: https://semspub.epa.gov/work/09/1112378.pdf (accessed on 3 September 2020).
- Van Der Sloot, H.A.; Heasman, L.; Quevauvillier, P. Harmonization of Leaching/Extraction Tests; Elsevier Science: Amsterdam, The Netherlands, 1997; eBook; ISBN 9780080533308. [Google Scholar]
- Lassin, A.; Bodénan, F.; Piantone, P.; Blanc, P. Tests of Waste Behaviour during Leaching and Modelling of the Associated “Hydro-Physico-Chemical” Processes; Bibliographical Study, BRGM/RP-51518-FR.; B.R.G.M: Orleans, France, 2002. [Google Scholar]
- Garrabrants, A.C.; Kosson, D.S.; Van der Sloot, H.A.; Sanchez, F.; Hjelmar, O. Background Information for the Leaching Environmental Assessment Framework (LEAF) Test Methods; U.S. Environmental Protection Agency: Washington, DC, USA, 2010; EPA-600/R-10/170.
- Belayouni, H. Study of the Organic Matter in the Phosphate Series of the Gafsa-Métlaoui Basin (Tunisia). Ph.D. Thesis, University of Orléans, Orléans, France, 1983. [Google Scholar]
- McLennan, G.H.; Lehr, J.R. Crystal chemical investigation of natural apatites. Am. Mineral. 1969, 54, 1374–1391. [Google Scholar]
- Gadd, M.G.; Layton-Matthews, D.; Peter, J.M. Non-hydrothermal origin of apatite in SEDEX mineralization and host rocks of the Howard’s Pass district, Yukon, Canada. Am. Mineral. 2016, 101, 1061–1071. [Google Scholar] [CrossRef]
- Sassi, S. Phosphate Sedimentation in the Paleocene in Southern and Central Tunisia. Ph.D. Thesis, University of Paris–Sud, Orsay, France, 1974. [Google Scholar]
- Slansky, M. Geology of Sedimentary Phosphates; B.R.G.M: Orleans, France, 1980. [Google Scholar]
- McLennan, G.H.; Van Kauwerberch, S.V. Clay mineralogy of the phosphorites of the southeastern United States. In Phosphate Deposits from the World: Genesis of Neogene to Recent Phosphorite; Riggs, S.R., Burnet, W.L., Eds.; Cambridge University Press: Cambridge, UK, 1990; pp. 337–351. [Google Scholar]
- Chaabani, F. Dynamics of the Eastern Part of the Gafsa Basin in the Cretaceous and Paleogene. Mineralogical and Geochemical Study of the Eocene—Southern Tunisia Phosphate Series. Ph.D. Thesis, University of Tunis El Manar, Tunis, Tunisia, 1995. [Google Scholar]
- Beji-Sassi, A. Phosphates in the Paleogenic Basins of the Southern Part of the North-South Axis. Ph.D. Thesis, University of Tunis El Manar, Tunis, Tunisia, 1999. [Google Scholar]
- Zaier, A. Tectono-Sedimentary Evolution of the Phosphate Basin of Central Western Tunisia: Mineralogy, Petrography, Geochemistry and Genesis of Phosphorites. Ph.D. Thesis, University of Tunis El Manar, Tunis, Tunisia, 1999. [Google Scholar]
- Boughzala, K.H.; Fattah, N.; Bouzouita, K.H.; Ben Hassine, H. Mineralogical and chemical study of Oum El Khecheb rock phosphate (Gafsa, Tunisia). Rev. Sci. Des Matériaux Lab. LARHYSS 2015, 6, 11–29. [Google Scholar]
- Gallala, W.; Saïdia, M.; El Hajiib, S.; Zayani, K.; Gaied, M.E.; Montacer, M. Characterization and Valorization of Tozeur-Nefta Phosphate Ore Deposit (Southwestern Tunisia). Procedia Eng. 2016, 138, 8–18. [Google Scholar] [CrossRef]
- Altschuler, Z.S. The geochemistry of trace elements in marine phosphorites: Part I. characteristic abundances and enrichment. Soc. Econ. Paleontol. Mineral. 1980, 29, 19–30. [Google Scholar]
- Chaabani, F. Phosphorites of the Foum Selja Type Section (Metlaoui, Tunisia): A Sequential Sedimentary Series with Paleocene Evaporites. Ph.D. Thesis, University of Louis Pasteur, Strasbourg, France, 1978. [Google Scholar]
- Beji-Sassi, A. Petrology, Mineralogy and Geochemistry of Phosphate Sediments of the Eastern Border of the Island of Kasserine (Tunisia). Ph.D. Thesis, University of Tunis El Manar, Tunis, Tunisia, 1984. [Google Scholar]
- Garnit, H.; Bouhlel, S.; Jarvis, I. Geochemistry and depositional environments of PaleoceneEocene phosphorites: Métlaoui Group, Tunisia. J. Afr. Earth Sci. 2017, 134. [Google Scholar] [CrossRef]
- Jarvis, I.; Burnett, W.C.; Nathan, Y.; Almbaydin, F.; Attia, K.M.; Castro, L.N.; Flicoteaux, R.; Hilmy, M.E.; Husain, V.; Qutawna, A.A.; et al. Phosphorite geochemistry: State-of-the-art and enviromental concerns. Eclogae Geol. Helv. 1994, 87, 643–700. [Google Scholar]
- Cordero, B.; Gómez, V.; Platero-Prats, A.E.; Revés, M.; Echeverría, J.; Cremades, E.; Flavia Barragán, F.; Santiago Alvarez, S. Covalent radii revisited. Dalton Trans. 2008, 21, 2832–2838. [Google Scholar] [CrossRef]
- Beji-Sassi, A.; Sassi, S. Cadmium associated with phosphate deposits in southern Tunisia. J. Afr. Earth Sci. 1999, 29, 501–513. [Google Scholar]
- Ahrens, L.H. Origin and Distribution of the Elements; Pergamon Press: Paris, France, 1977. [Google Scholar]
- Semenov, E.I.; Kholodov, V.N.; Barinsky, R.L. Rare earths in phosphorites. Geokhimiya 1962, 5, 434–439. [Google Scholar]
- Dill, H.G.; Weiss, W.; Botz, R.; Dohrmann, R. Paleontological, mineralogical and chemical studies of syngenetic and epigenetic Pb–Zn–Ba–P mineralizations at the stratotype of the K/P boundary (El Kef area, Tunisia). Int. J. Earth Sci. 2010, 100, 805–846. [Google Scholar] [CrossRef]
- Garnit, H.; Bouhlel, S.; Barca, D.; Johnson, C.A.; Chtara, C. Phosphorite-hosted zinc and lead mineralization in the Sekarna deposit (Central Tunisia). Miner. Depos. 2011, 47, 545–562. [Google Scholar] [CrossRef]
- Pattan, J.N.; Pearce, N.J.G.; Mislankar, P.G. Constraints in using Cerium-anomaly of bulk sediments as an indicator of paleobottom water redox environment: A case study from the Central Indian Ocean Basin. Chem. Geol. 2005, 221, 260–278. [Google Scholar] [CrossRef]
- Tlig, S.; Beji Sassi, A.; Belayouni, H.; Michel, D. Distribution of Uranium, Thorium, Zirconium, Hafnium and Rare Earth Elements (REE) in sedimentary phosphate grains. Chem. Geol. 1987, 62, 209–221. [Google Scholar] [CrossRef]
- Ounis, A.; Kocsis, L.; Chaabani, F.; Rudolf Pfeifer, H. Rare earth elements and stable isotope geochemistry (δ13C and δ18O) of phosphorite deposits in the Gafsa Basin, Tunisia. Palaeogeogr. Palaeoclimatol. Palaeoecol. 2008, 268, 1–18. [Google Scholar] [CrossRef]
- Elderfield, H.; Greaves, M.J. The rare earth elements in seawater. Nature 1982, 296, 214–219. [Google Scholar] [CrossRef]
- McLennan, S.M. REE in sedimentary rocks: Influence of provenance and sedimentary processes. Rev. Mineral. 1989, 21, 169–200. [Google Scholar]
- Fryer, B. Rare earth evidence in iron-formations for changing Precambrian oxidation states. Geochim. Cosmochim. Acta 1977, 41, 361–367. [Google Scholar] [CrossRef]
- Souissi, R.; Souissi, F.; Chakroun, H.K.; Bouchardon, J.L. Mineralogical and geochemical characterization of the mine tailings and assessment of Zn, Cd, Pbmobility in a carbonated setting (northern Tunisia). Mine Water Environ. 2013, 32, 16–27. [Google Scholar] [CrossRef]
- Godfrin, J.M.; Bladel, R.V. Influence of pH on the adsorption of copper and zinc by soils. Sci. Du Sol. 1990, 28, 15–26. [Google Scholar]
- Gould, M.S.; Genetelli, E.J. Heavy metal complexation behavior in anaerobi- cally digested sludges. Water Res. 1978, 12, 505–512. [Google Scholar] [CrossRef]
- Pigozzo, A.T.J.; Lenzi, E.; Junior, J.L.; Scapim, C.A.; Da Costa, A.C.S. Transition Metal Rates in Latosol Twice Treated With Sewage Sludge. Brazil. Arch. Biol. Technol. 2006, 49, 515–526. [Google Scholar] [CrossRef]
- Institut de Radioprotection et de Sureté Nucléaire (IRSN). Radionuclide Sheet: Cadmium and Environment. 2004. Available online: https://www.irsn.fr/FR/Larecherche/publications-documentation/fiches-radionucleides/Documents/environnement/Cadmium_Cd109_v1.pdf (accessed on 10 January 2020).
- Tollefson, T. Soils and Their Environment. Department of Soil Science University of Saskatchewan. Text Translated by Bélanger N. 2005. Available online: http://www.cef-cfr.ca/uploads/Membres/module_4_sols.pdf (accessed on 15 December 2018).
- Mermoud, A. Basic Properties of the Soil and the Liquid Phase. Soil Physics Course. 2006. Available online: https://fr.scribd.com/document/338544201/02-Proprietes-de-base-du-sol-et-de-la-phase-liquide-pdf (accessed on 12 January 2018).
- Deschamps, T.; Benzaazoua, M.; Bussiere, B.; Belem, T.; Mbonimpa, M. Retention mechanisms for heavy metals in the solid phase: The case of the stabilization of contaminated soils and industrial waste. Rev. Electron. Sci. L’environnement 2006. [Google Scholar] [CrossRef]
- Babel, S.; Kurniawan, T.A. Low-cost adsorbent for heavy metal uptake from contaminated water: A review. J. Hazard. Mater. 2003, 97, 219–243. [Google Scholar] [CrossRef]
- Rose, A.W.; Hawks, H.E.; Webb, J.H. Geochemistry in Mineral Exploration. Academic Press: New York, NY, USA, 1979. [Google Scholar]
- Cossa, D.; Lassus, P. Cadmium in the Marine Environment/Biogeochemistry and Ecotoxicology; IFREMER Scientific and Technical Report N°16; Ifremer: Plouzané, France, 1989. [Google Scholar]
- National Research Council (NRC). Subcommittee on Zinc Cadmium Sulfide, Toxicologic Assessment of the Army’s Zinc Cadmium Sulfide Dispersion Tests; National Academies Press (US): Washington, DC, USA, 1997. [Google Scholar]
- Marchat, D. Fixation of Cadmium by a Phosphocalcic Hydroxyapatite—Kinetic and Thermodynamic Study. Ph.D. Thesis, University of Limoges, Limoges, France, 2005. [Google Scholar]
- Health Canada. Cadmium in Drinking Water. Guideline Technical Document for Public Consultation. 2019. Available online: https://www.canada.ca/en/health-canada/programs/consultation-cadmium-drinking-water/document.html (accessed on 15 April 2019).
- Health Canada. Priority Substances List, Assessment Report, Cadmium and Its Compounds. Canadian Environmental Protection Act. 1994. Available online: https://www.canada.ca/content/dam/hc-sc/migration/hc-sc/ewh-semt/alt_formats/hecs-sesc/pdf/pubs/contaminants/psl1-lsp1/cadmium_comp/cadmium_comp-fra.pdf (accessed on 12 April 2019).
- Gauthier, J. Cadmium Toxicity and Bioaccumulation in Juvenile Atlantic Salmon (Sa/mo sa/ar) in the Presence of Synthetic or Natural Dissolved Organic Matter (DOM); Institut National de la Recherche Scientifique, INRS-Eau Sainte-Foy: Québec, QC, Canada, 1995. [Google Scholar]
- Qasim, B.H. Determination, Speciation and Bioavailability of Metallic Trace Elements in Contaminated Soils and Techno Soils. Ph.D. Thesis, University of Orléans, Orléans, France, 2015. [Google Scholar]
- Altschuler, Z.S.; Clarke, R.S.; Young, E.J. Geochemistry of uranium in apatite and phosphorites. US Geol. Surv. 1958, 314, 87. [Google Scholar]
- Baturin, G.N.; Dubinchuk, V.T. Microstructures of Agulhas Banks phosphorites. Mar. Geol. 1974, 16, M63–M70. [Google Scholar] [CrossRef]
- Giresse, P.; N’landou, J.D.; Wiber, M. Uranium concentrations of phosphates in the Congo according to marine and continental mineralogensis. Bull. Geol. Fr. 1984, 7, 1097–1105. [Google Scholar] [CrossRef]
- Favas, P.J.C.; Pratas, J.; Mitra, S.; Sarkar, S.K.; Venkatachalam, P. Biogeochemistry of uranium in the soil-plant and water-plant systems in an old uranium mine. Sci. Total Environ. 2016, 568, 350–368. [Google Scholar] [CrossRef]
- Langmuir, D. Aqueous Environmental Geochemistry; Prentice Hall: Englewood Cliffs, NJ, USA, 1997. [Google Scholar]
- Lottermoser, B.G. Mine Wastes Characterization, Treatment, Environmental Impacts; Springer: Berlin/Heidelberg, Germany, 2007. [Google Scholar]
- Laurette, J.; Larue, C.; Mariet, C.; Brisset, F.; Khodja, H.; Bourguignon, J.; Marie Carriere, M. Influence of uranium speciation on its accumulation and translocation in three plant species: Oilseed rape, sunflower and wheat. Environ. Exp. Bot. 2012, 77, 96–107. [Google Scholar] [CrossRef]
- Qiao, J.; Hansen, V.; Hou, X.; Aldahan, A.; Possnert, G. Speciation analysis of 129I, 137Cs, 232Th, 238U, 239Pu and 240Pu in environementalsoiland sediment. Appl. Radiat. Isot. 2012, 70, 1698–1708. [Google Scholar] [CrossRef] [PubMed]
- United States Environmental Protection Agency (EPA). Understanding Variation in Partition Coefficient, Kd, Values: Volume I, The Kd Model, Methods of Measurement, and Application of Chemical Reaction Codes (EPA402-R-99-004A). 1999. Available online: https://www.epa.gov/sites/production/files/2015-05/documents/402-r-99-004a.pdf (accessed on 15 May 2019).
- Commissariat à L’énergie Atomique (CEA). Uranium in the Environment. 2001. Available online: https://inis.iaea.org/collection/NCLCollectionStore/_Public/33/003/33003392.pdf (accessed on 10 April 2019).
- Institut de Radioprotection et de Sureté Nucléaire (IRSN). Radionuclide File: Natural Uranium and the Environment. 2010. Available online: https://www.irsn.fr/FR/Larecherche/publications-documentation/fiches-radionucleides/environnement/Pages/Uranium-naturel-environnement.aspx#.XmedwnL7TIU (accessed on 10 May 2018).
- Laurette, J. Role of Speciation of Uranium on Its Bioaccumulation, Transport, and Toxicity in Plants. Ph.D. Thesis, University of ParisTech, Paris, France, 2011. [Google Scholar]
- Pratas, J.; Favas, P.J.C.; Paulo, C.; Rodrigues, N.; Prasad, M.N.V. Uranium accumulation by aquatic plants from uranium-contaminated water plants in Central Portugal. Int. J. Phytoremediation 2012, 14, 221–234. [Google Scholar] [CrossRef] [PubMed]
- Harguindegui, S. Uranium Transport in Water and Soil: Combined Colloidal and Isotopic Approach. Ph.D. Thesis, University of Pau and the Adour Region, Pau, France, 2013. [Google Scholar]


| Fraction | Sample | |||||
|---|---|---|---|---|---|---|
| RP–ZL | MP–ZL | FW–ZL | RP–R | MP–R | FW–R | |
| Medium and coarse sand (250 μm< X < 2 mm) | 24.7 | 30.62 | 6.45 | 23.64 | 21.76 | 1.07 |
| Fine to very fine sand (63 μm< X < 250 μm) | 65 | 69.42 | 34.5 | 66.54 | 78.23 | 15.94 |
| Medium to coarse silt (16 μm< X < 63 μm) | 7.2 | 0 | 24.8 | 7.20 | 0 | 35.37 |
| Fine to very fine silt (2 μm< X < 16 μm) | 2.83 | 0 | 32.94 | 2.51 | 0 | 45.87 |
| Clay (X < 2 μm) | 0 | 0 | 1.13 | 0 | 0 | 1.6 |
| Mineralogy | Sample | |||||||
|---|---|---|---|---|---|---|---|---|
| RP–ZL | MP–ZL | CW–ZL | FW–ZL | RP–R | MP–R | CW–R | FW–R | |
| Carbonate fluorapatite(CFA) | 34 | 48.5 | 26.3 | 23.2 | 27.3 | 35.7 | 16.2 | 17 |
| Calcite | 8 | 7.9 | 23.2 | 16.2 | 9.1 | 4.1 | 22.2 | 18 |
| Ankerite | 13 | 3 | 12.1 | 14.2 | 6.1 | 2 | 6.1 | 2 |
| Dolomite | 14 | 5 | 16.2 | 17.2 | 6.1 | 2 | 9.1 | 4 |
| Clinoptilolite | 23 | 27.7 | 18.2 | 24.2 | 25.3 | 37.8 | 17.2 | 34 |
| Gypsum | 6 | 6.9 | 3 | 3 | 8.1 | 5.2 | 4 | 4 |
| Quartz | 2 | 1 | 1 | 1 | 5.1 | 1 | 9 | 1 |
| Palygorskite | - | - | - | 1 | 12.9 | 12.2 | 16.2 | 20 |
| Elements (%) | Sample | |||||||
|---|---|---|---|---|---|---|---|---|
| RP–ZL | MP–ZL | CW–ZL | FW–ZL | RP–R | MP–R | CW–R | FW–R | |
| OM | 1.36 | 0.60 | 0.58 | 1.51 | 1.22 | 1.56 | 1.72 | 3.89 |
| CaCO3 | 16.87 | 14.81 | 27.16 | 17.47 | 15.85 | 14.63 | 24.19 | 8.46 |
| N | 0.004 | 0.004 | 0.003 | 0.003 | 0.005 | 0.005 | 0.005 | 0.01 |
| CaO | 41.7 | 47.93 | 39.6 | 38.3 | 45.3 | 49.51 | 36.8 | 21.5 |
| Fe2O3 | 1.44 | 0.21 | 1.64 | 2.34 | 1.48 | 0.34 | 2.25 | 5.97 |
| Na2O | 0.08 | 0.01 | n.a 1 | 0.21 | 0.02 | 0.3 | n.a | n.a |
| K2O | 0.17 | 0.02 | 0.16 | 0.31 | 0.21 | 0.04 | 0.15 | 0.66 |
| Al2O3 | 1.96 | 0.51 | 2.4 | 3.26 | 2.13 | 0.82 | 2.95 | 7.34 |
| MgO | 1.15 | 0.46 | 1.44 | 1.96 | 0.89 | 0.6 | 1.5 | 2.25 |
| P2O5 | 25.05 | 29.37 | 18.38 | 18.81 | 23.28 | 28,45 | 15.1 | 8.45 |
| SiO2 | 10.3 | 3.84 | 12.73 | 14.84 | 10.03 | 5.73 | 20.68 | 32.29 |
| LOI * | 15.1 | 15.8 | 22.65 | 18.8 | 14.44 | 13.23 | 19.47 | 20.20 |
| CaO/P2O5 | 1.66 | 1.63 | 2.15 | 2.03 | 1.94 | 1.74 | 2.43 | 2.54 |
| Elements(mg/kg) | ||||||||
| Cd | 19.7 | 17.61 | 1.34 | 26 | 28.8 | 22 | n.d | 30.6 |
| Cr | 164 | 122.2 | 130 | 302.5 | 187 | 147 | 144.7 | 466.5 |
| Pb | 5.15 | 1.44 | n.d 2 | 4.37 | 3.9 | 3.4 | n.d | 8.9 |
| Sr | 1307 | 1583 | 1096 | 1240 | 1392 | 1507 | 1007 | 705 |
| Zn | 172 | 151.6 | 160 | 271.6 | 220 | 171.5 | 164 | 292 |
| U | 31 | 28.87 | 23 | 30.2 | 28.7 | 35.1 | 19.35 | 23 |
| La | 48.54 | 58.8 | 42.67 | 49.79 | 53.98 | 60.39 | 29.99 | 30.25 |
| Ce | 77.9 | 95.3 | 72.63 | 78.93 | 80.72 | 94.06 | 42.16 | 45.49 |
| Nd | 49.04 | 59.33 | 43.87 | 50.81 | 51.24 | 59.63 | 23.76 | 29 |
| Sm | 8.69 | 12.45 | 8.22 | 10.47 | 10.61 | 12.64 | 4.98 | 5.5 |
| Eu | 3.15 | 3.65 | 2.5 | 2.64 | 3.54 | 3.29 | 1.93 | 2.2 |
| Gd | 10.3 | 11.6 | 9.12 | 11.33 | 11.1 | 13.19 | 7.65 | 8.55 |
| Tb | 1.63 | 1.86 | 1.16 | 1.39 | 1.56 | 1.81 | 0.83 | 1.04 |
| Yb | 5.14 | 5.69 | 4.12 | 4.96 | 5.91 | 6.28 | 3.12 | 3.24 |
| ∑REE | 204.39 | 248.68 | 184.3 | 210.32 | 218.66 | 251.29 | 114.42 | 125.27 |
| Element (mg/L) | Laundry ZL | Laundry R | Regulation Limit 1 | ||||
|---|---|---|---|---|---|---|---|
| Gouifla (DW) | Sludge Water (SW) | Recycled Water (RW) | Tarfaya (DW) | Sludge Water (SW) | Recycled Water (RW) | ||
| F− | 2.37 | 4.7 | 2.32 | 1.9 | 0.77 | 1.28 | 1.5 |
| NO2− | 15.30 | <d.l 3 | 1.57 | 0.34 | 0.32 | <d.l | 3 |
| NO3− | 17.70 | 48.6 | 17.15 | 32.74 | 32.88 | 32.94 | 50 |
| PO43− | 14 | 24.8 | 15.40 | 22.2 | 33 | 23.6 | ₋ 4 |
| SO42− | 1979 | 2570 | 2495 | 51.2 | 312.5 | 22.7 | 500 |
| Element (µg/L) | |||||||
| Cd | 1 | 14.14 | 5 | 1 | 6.12 | 1 | 3 |
| Fe | 10 | 10 | 10 | 10 | 10 | 10 | ₋ |
| Pb | 2 | 1 | 2 | 4 | 2 | 3 | 10 |
| Zn | 19 | 53 | 21 | 20 | 66 | 14 | 3000 |
| U | n.a 2 | 1.58 | n.a | n.a | 3.13 | n.a | 15 |
Publisher’s Note: MDPI stays neutral with regard to jurisdictional claims in published maps and institutional affiliations. |
© 2021 by the authors. Licensee MDPI, Basel, Switzerland. This article is an open access article distributed under the terms and conditions of the Creative Commons Attribution (CC BY) license (http://creativecommons.org/licenses/by/4.0/).
Share and Cite
Smida, O.; Souissi, R.; Salem, M.; Souissi, F. Geochemical Assessment and Mobility of Undesired Elements in the Sludge of the Phosphate Industry of Gafsa-Metlaoui Basin, (Southern Tunisia). Appl. Sci. 2021, 11, 1075. https://doi.org/10.3390/app11031075
Smida O, Souissi R, Salem M, Souissi F. Geochemical Assessment and Mobility of Undesired Elements in the Sludge of the Phosphate Industry of Gafsa-Metlaoui Basin, (Southern Tunisia). Applied Sciences. 2021; 11(3):1075. https://doi.org/10.3390/app11031075
Chicago/Turabian StyleSmida, Olfa, Radhia Souissi, Marzougui Salem, and Fouad Souissi. 2021. "Geochemical Assessment and Mobility of Undesired Elements in the Sludge of the Phosphate Industry of Gafsa-Metlaoui Basin, (Southern Tunisia)" Applied Sciences 11, no. 3: 1075. https://doi.org/10.3390/app11031075
APA StyleSmida, O., Souissi, R., Salem, M., & Souissi, F. (2021). Geochemical Assessment and Mobility of Undesired Elements in the Sludge of the Phosphate Industry of Gafsa-Metlaoui Basin, (Southern Tunisia). Applied Sciences, 11(3), 1075. https://doi.org/10.3390/app11031075