
Critical Comparison of Spherical Microindentation, Small Punch Test, and Uniaxial Tensile Testing for Selective Laser Melted Inconel 718


Abstract
1. Introduction
2. Materials and Methods
2.1. Sample Prototyping Using SLM
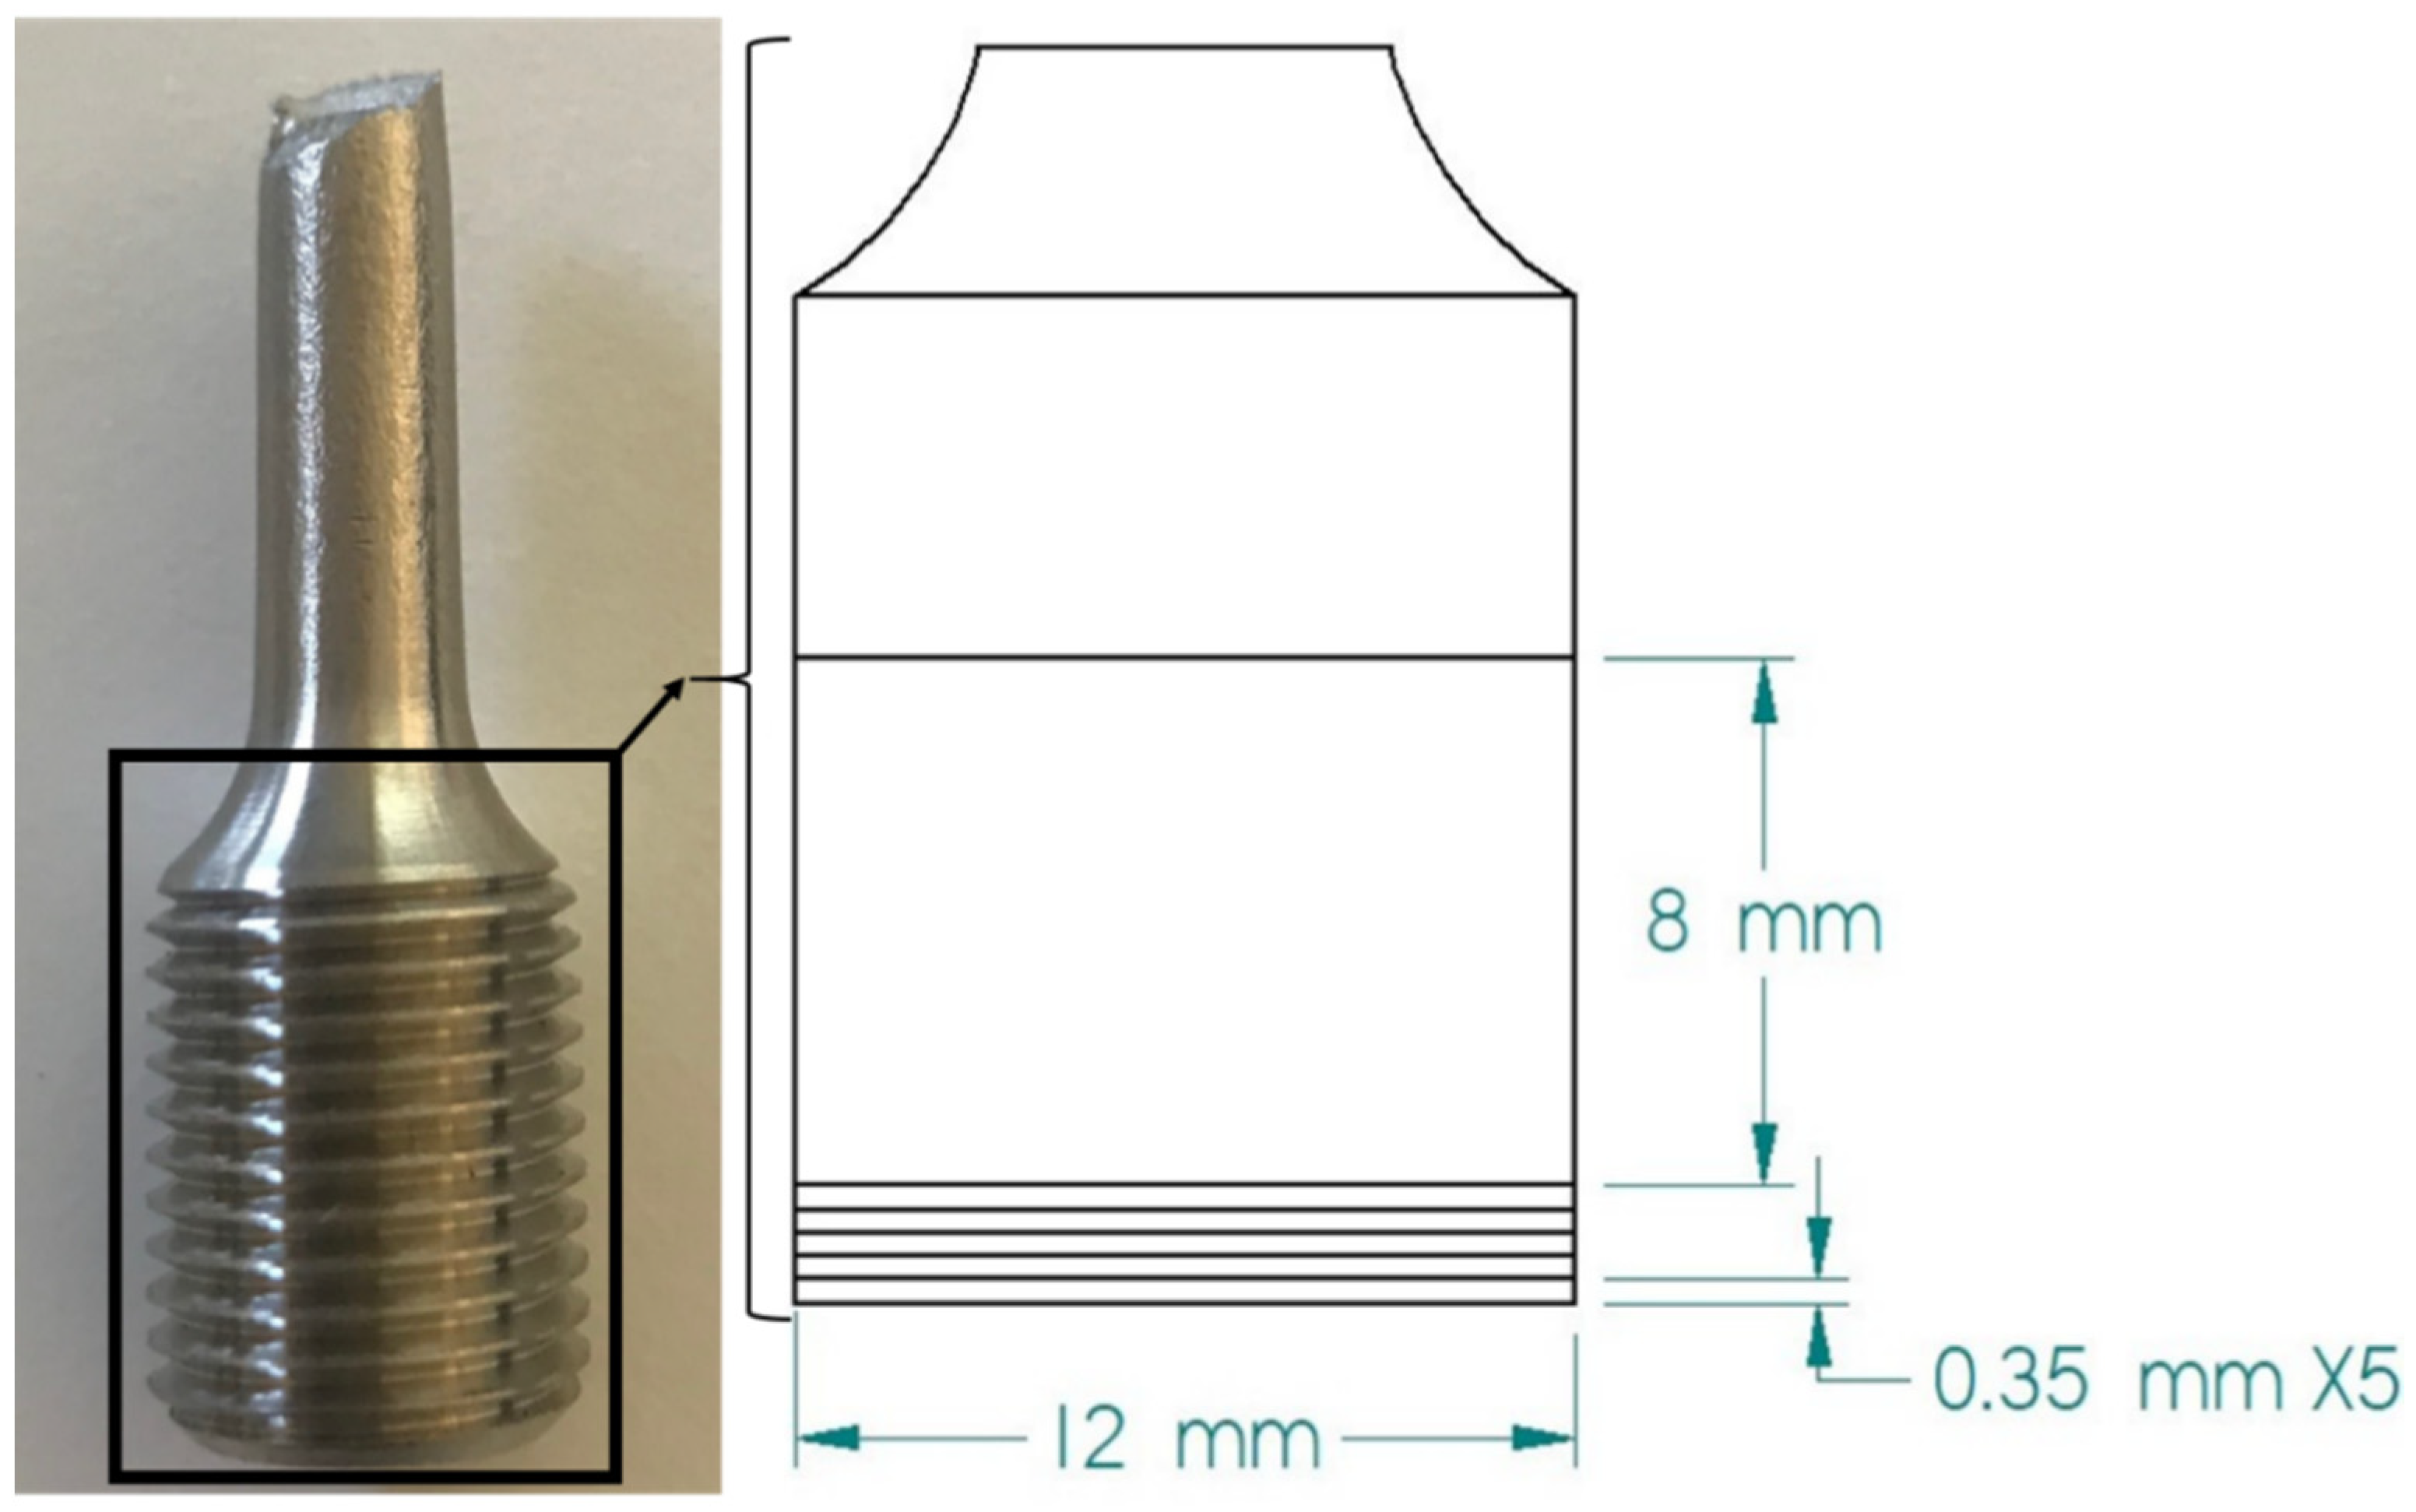
2.2. Uniaxial Tensile Test (UTT)
2.3. Sample Preparation for MSS and SPT
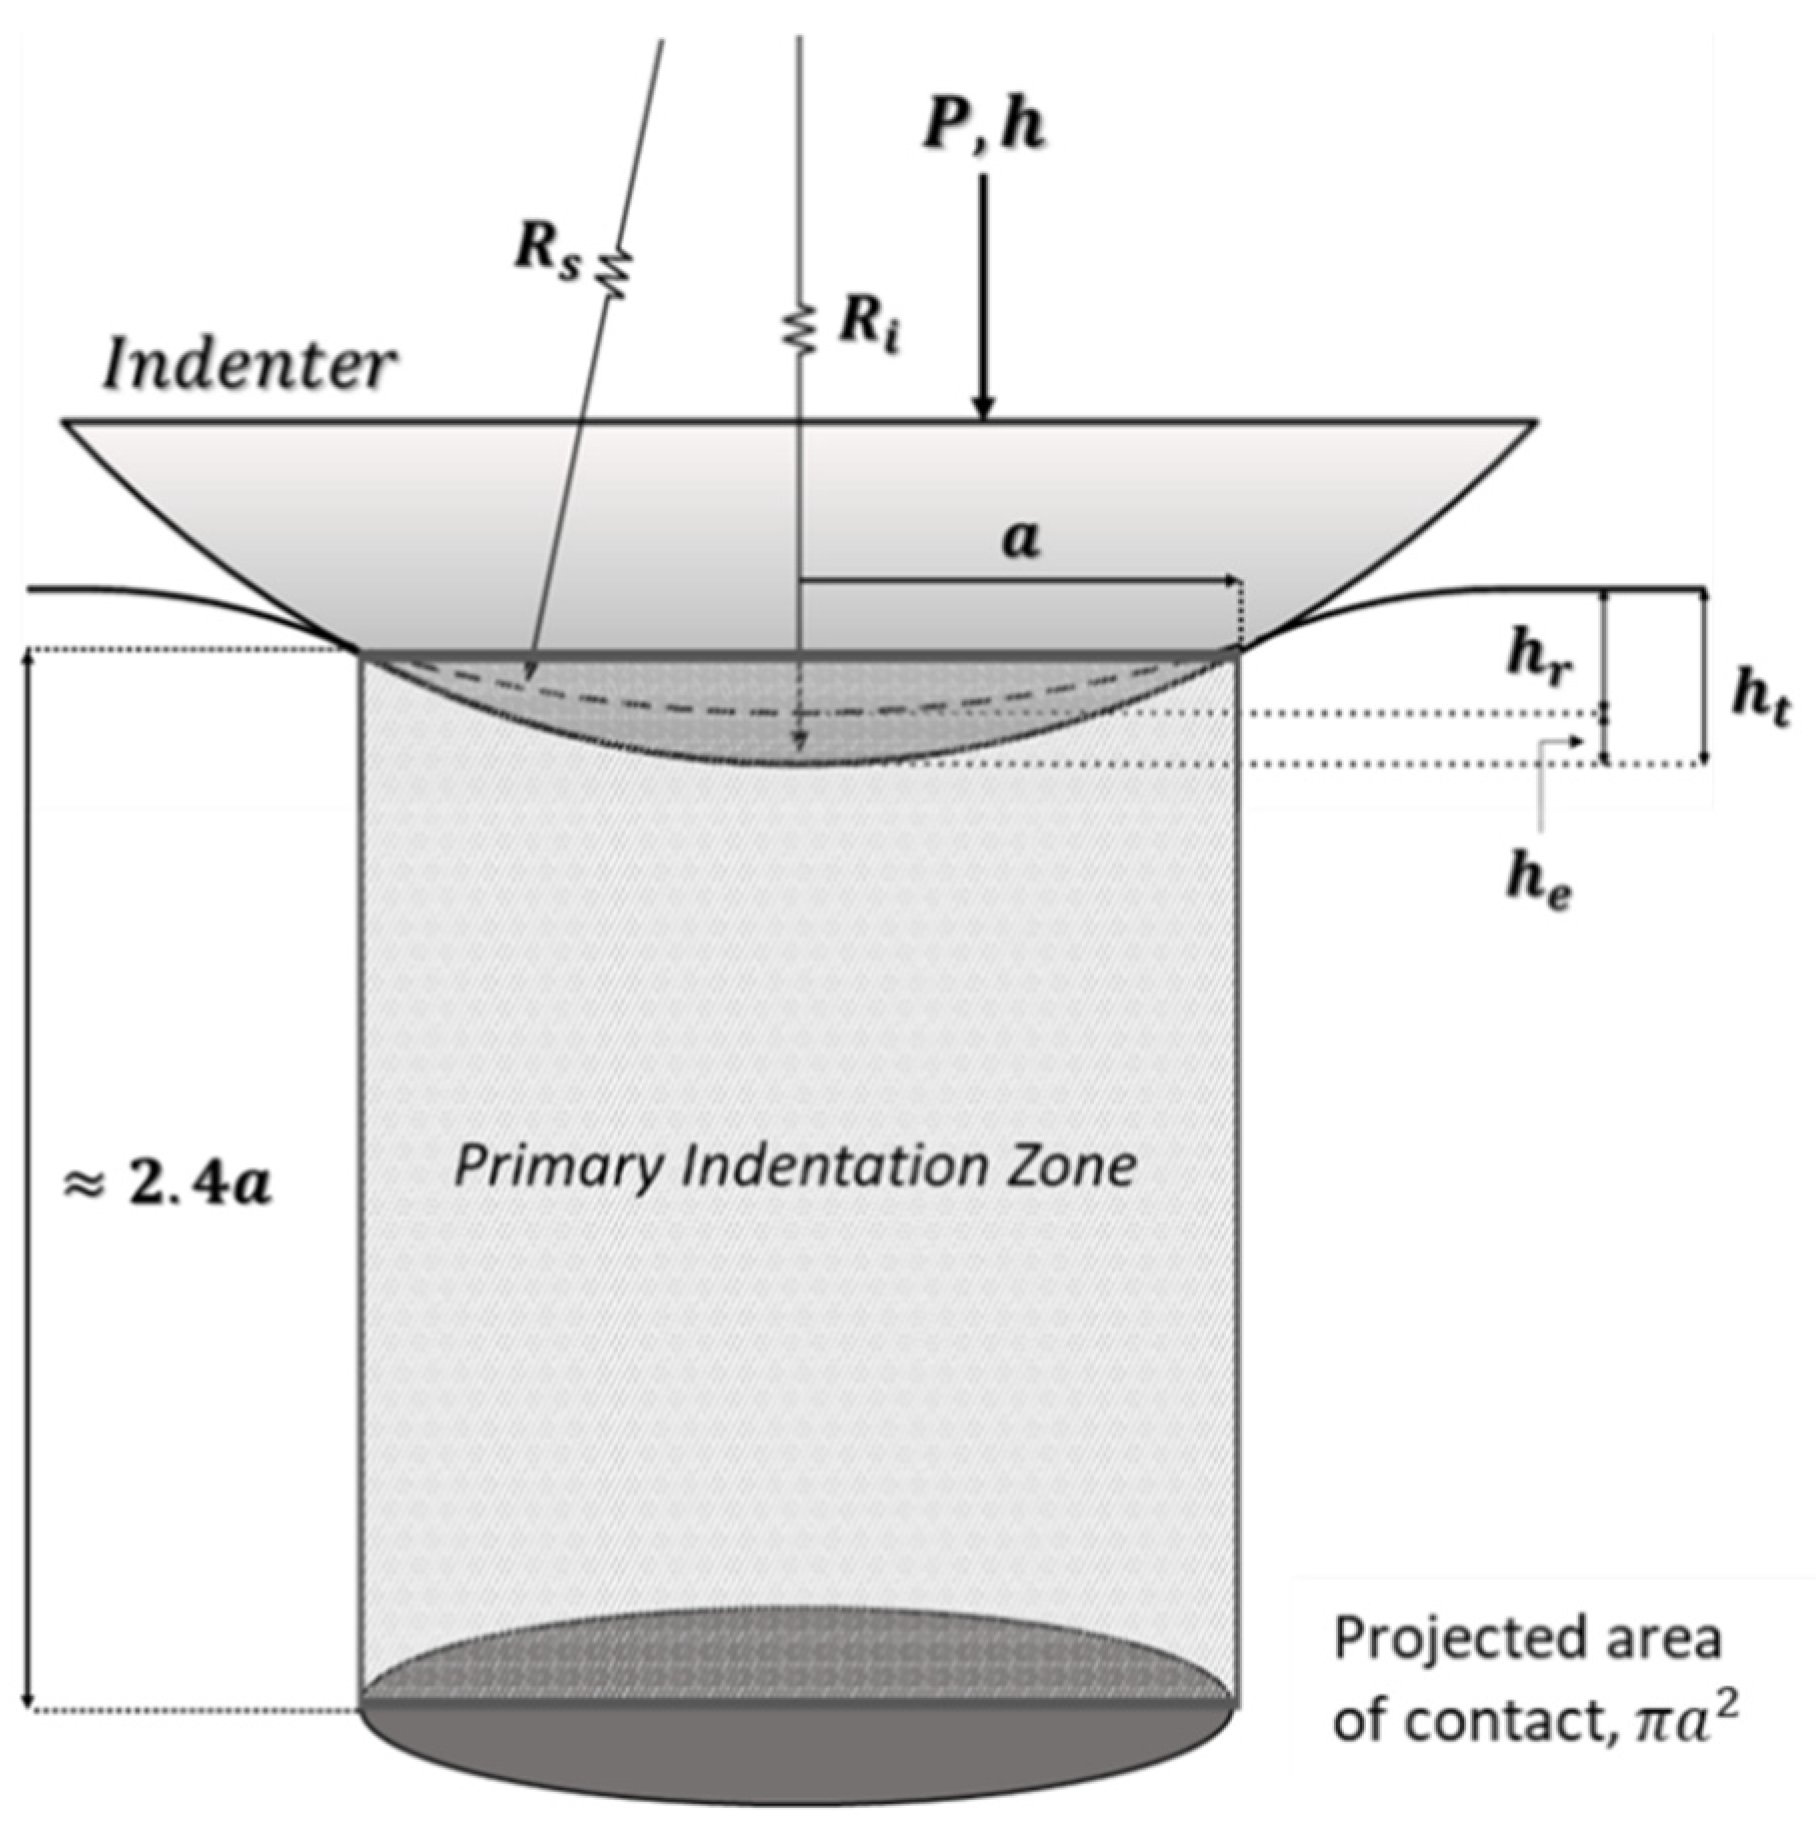
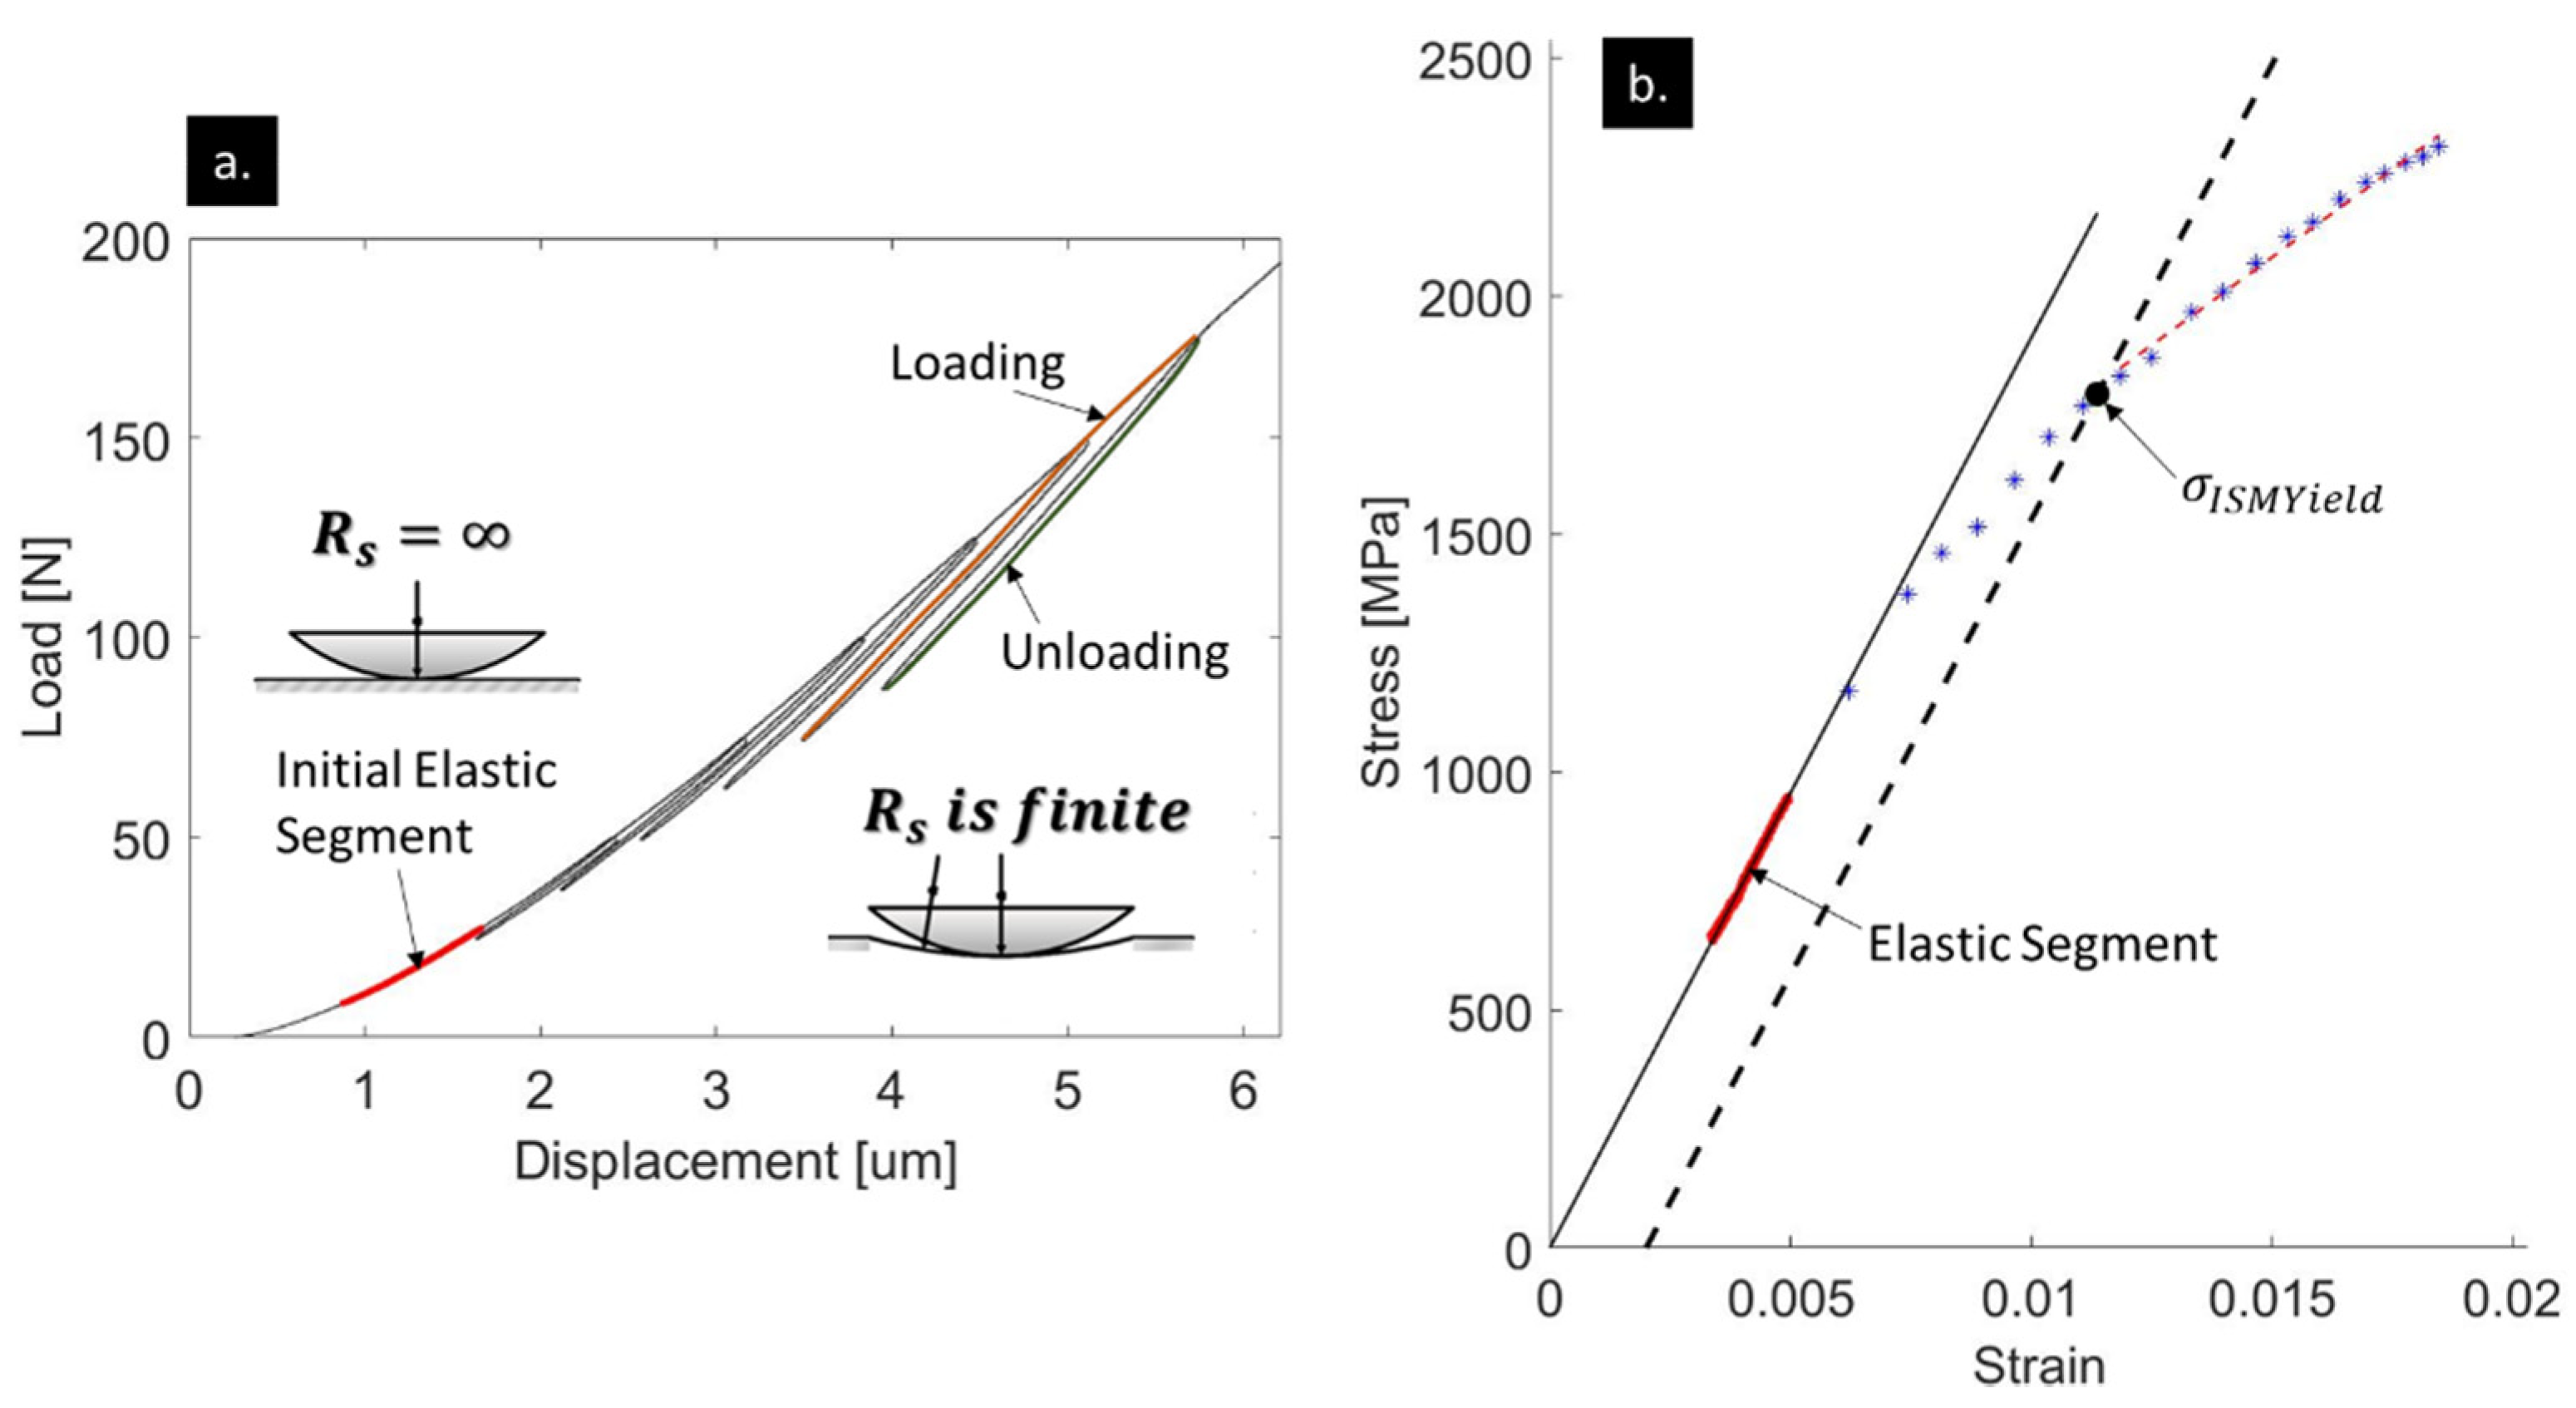
2.4. Microindentation Stress-Strain (MSS) Protocols
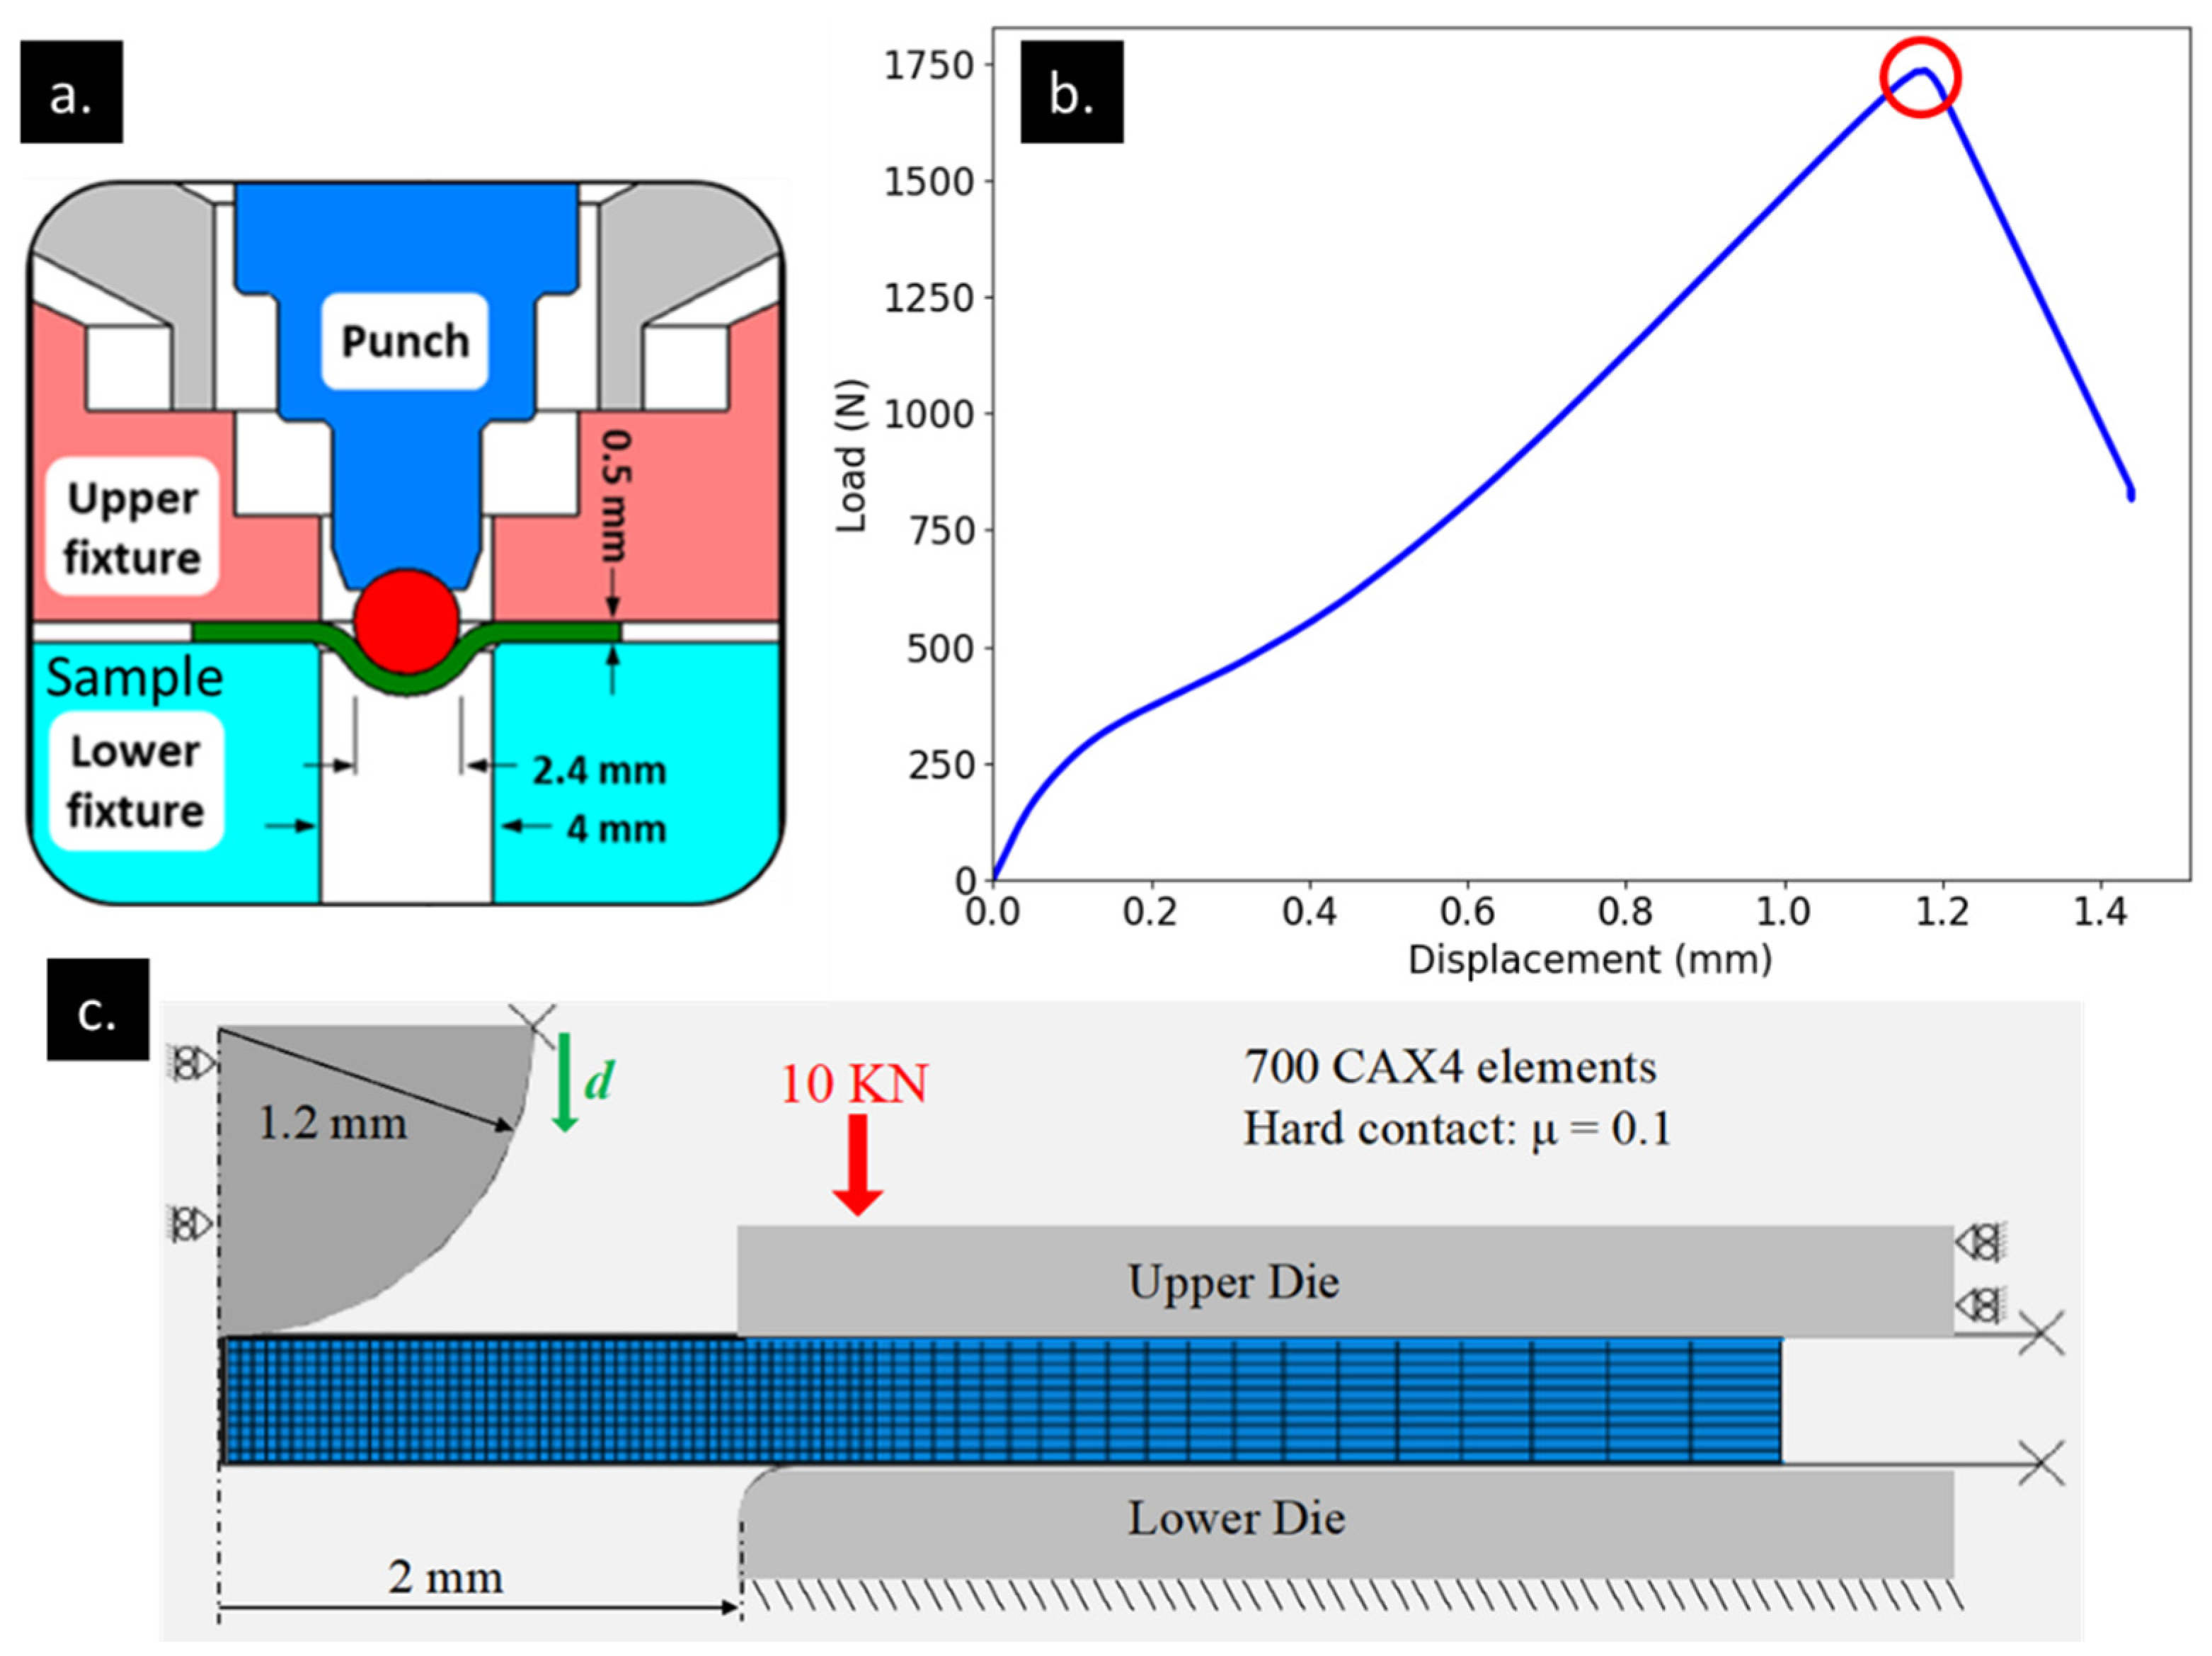
2.5. Small Punch Test (SPT) Protocols
3. Results
3.1. MSS Measurements
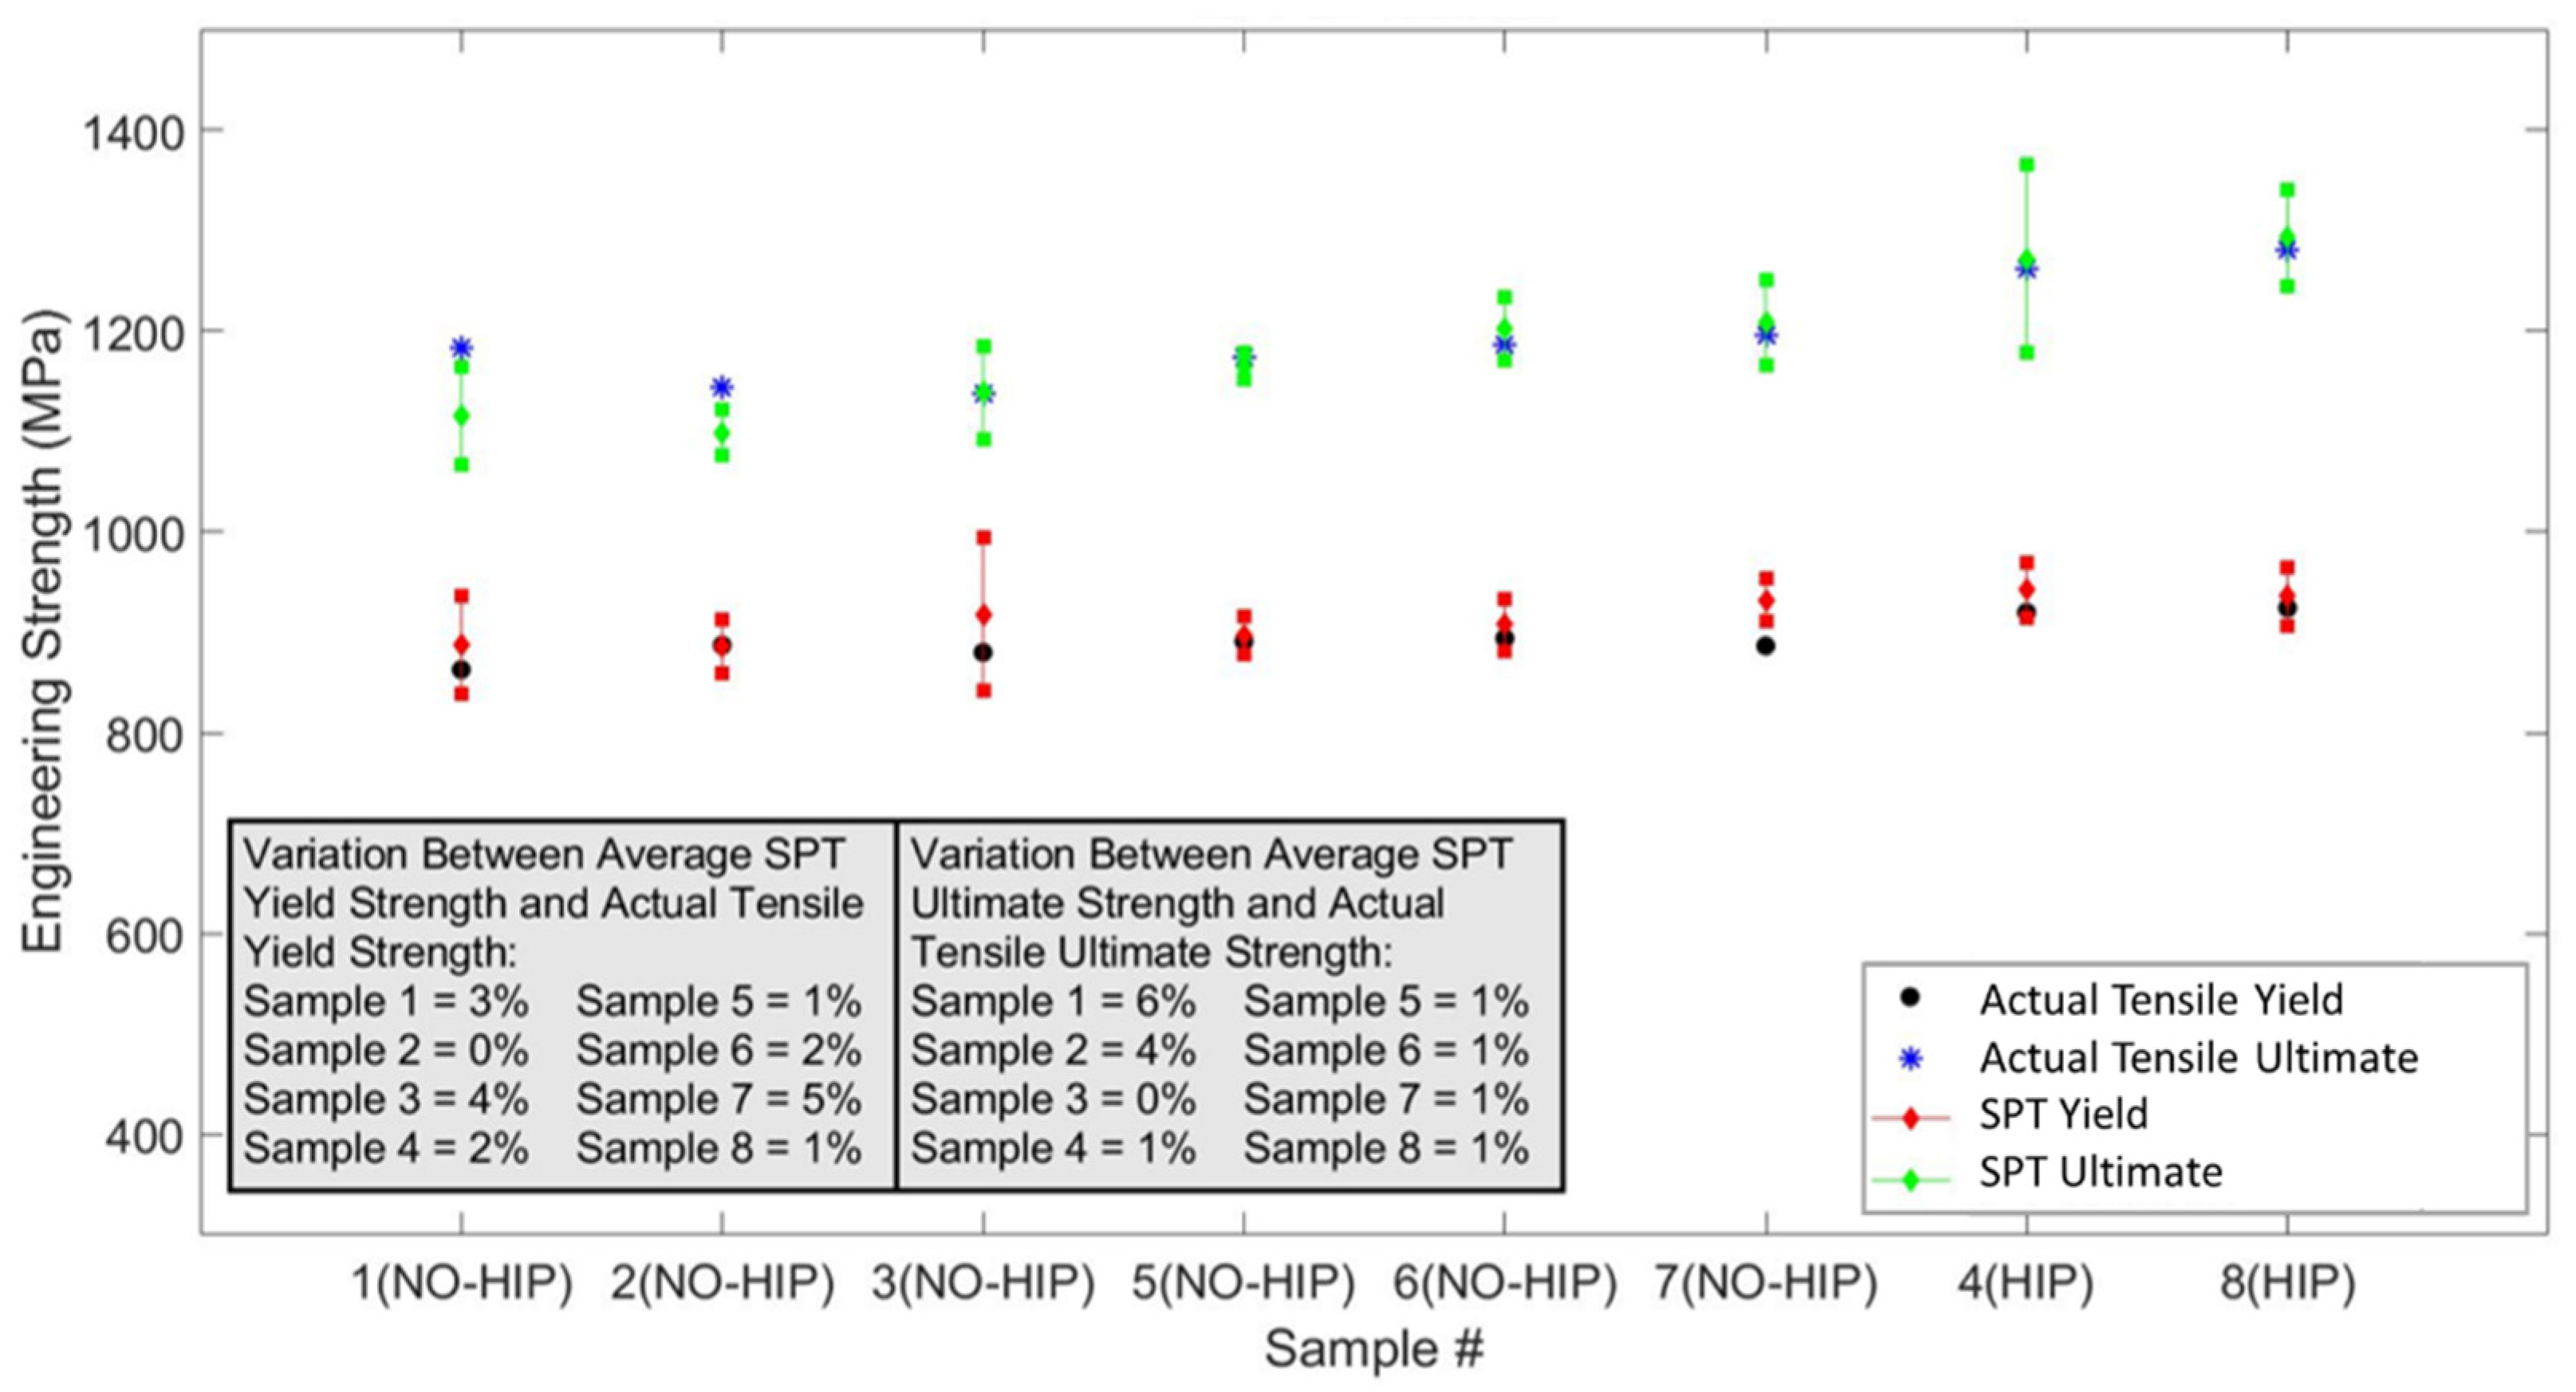
3.2. SPT
4. Discussion
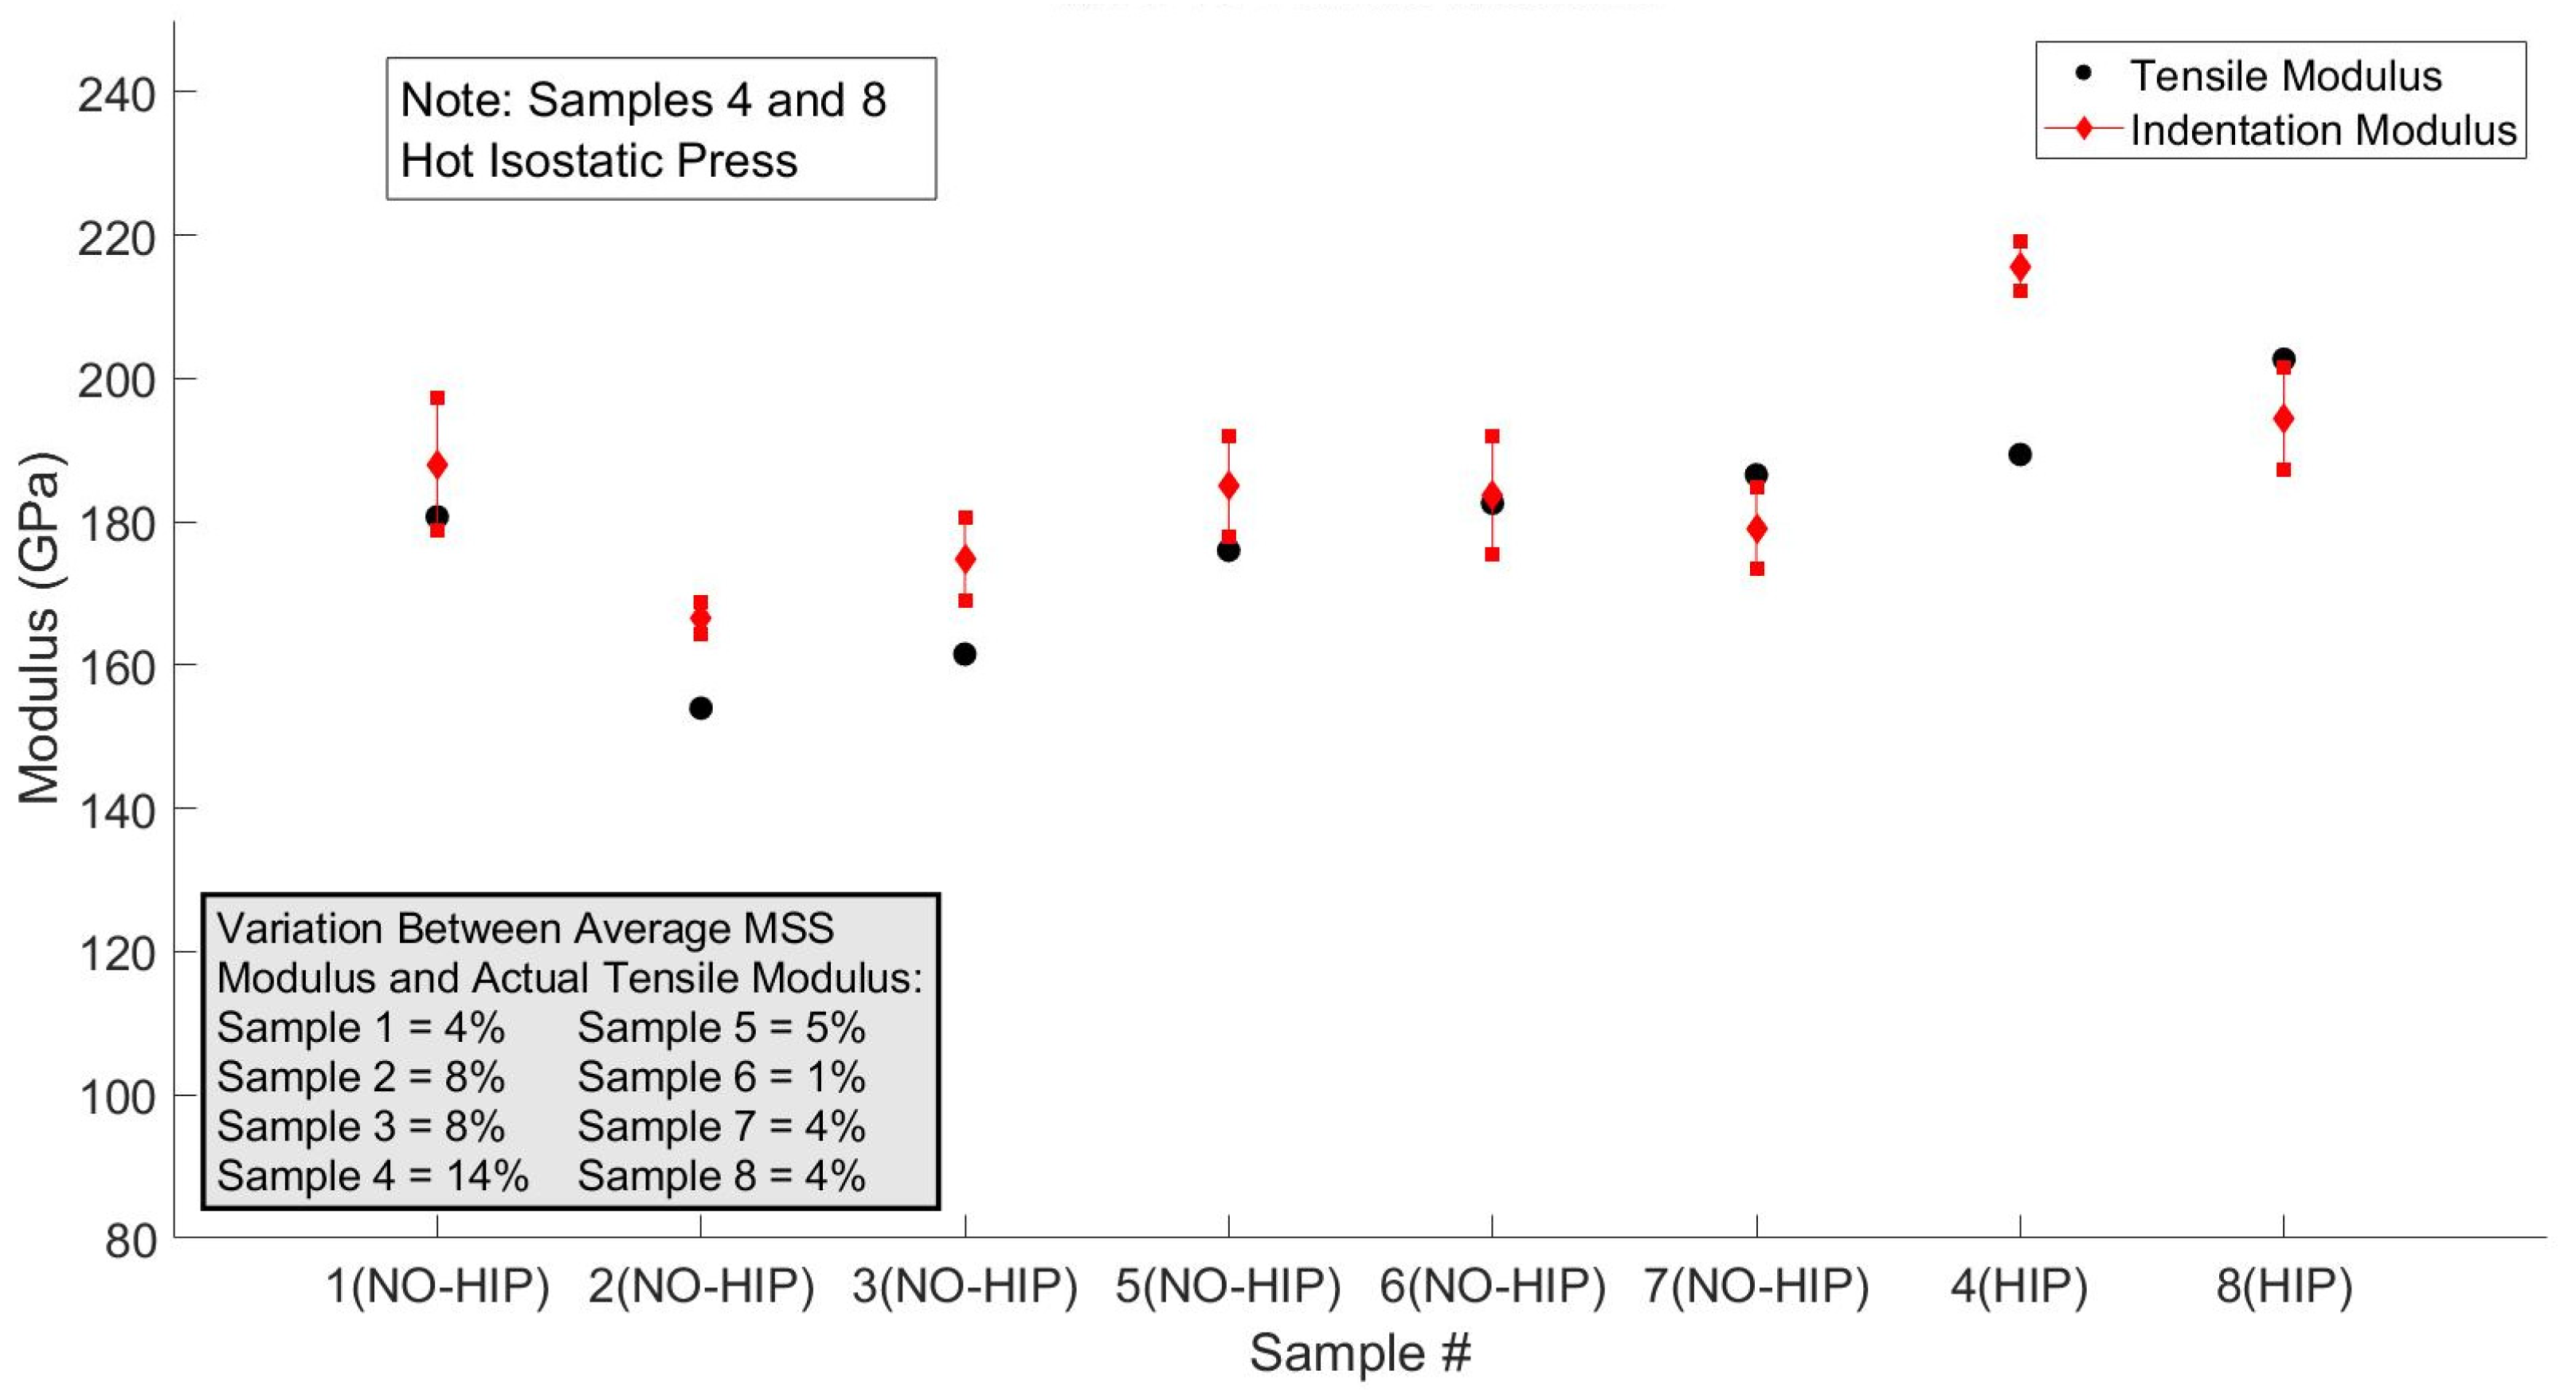
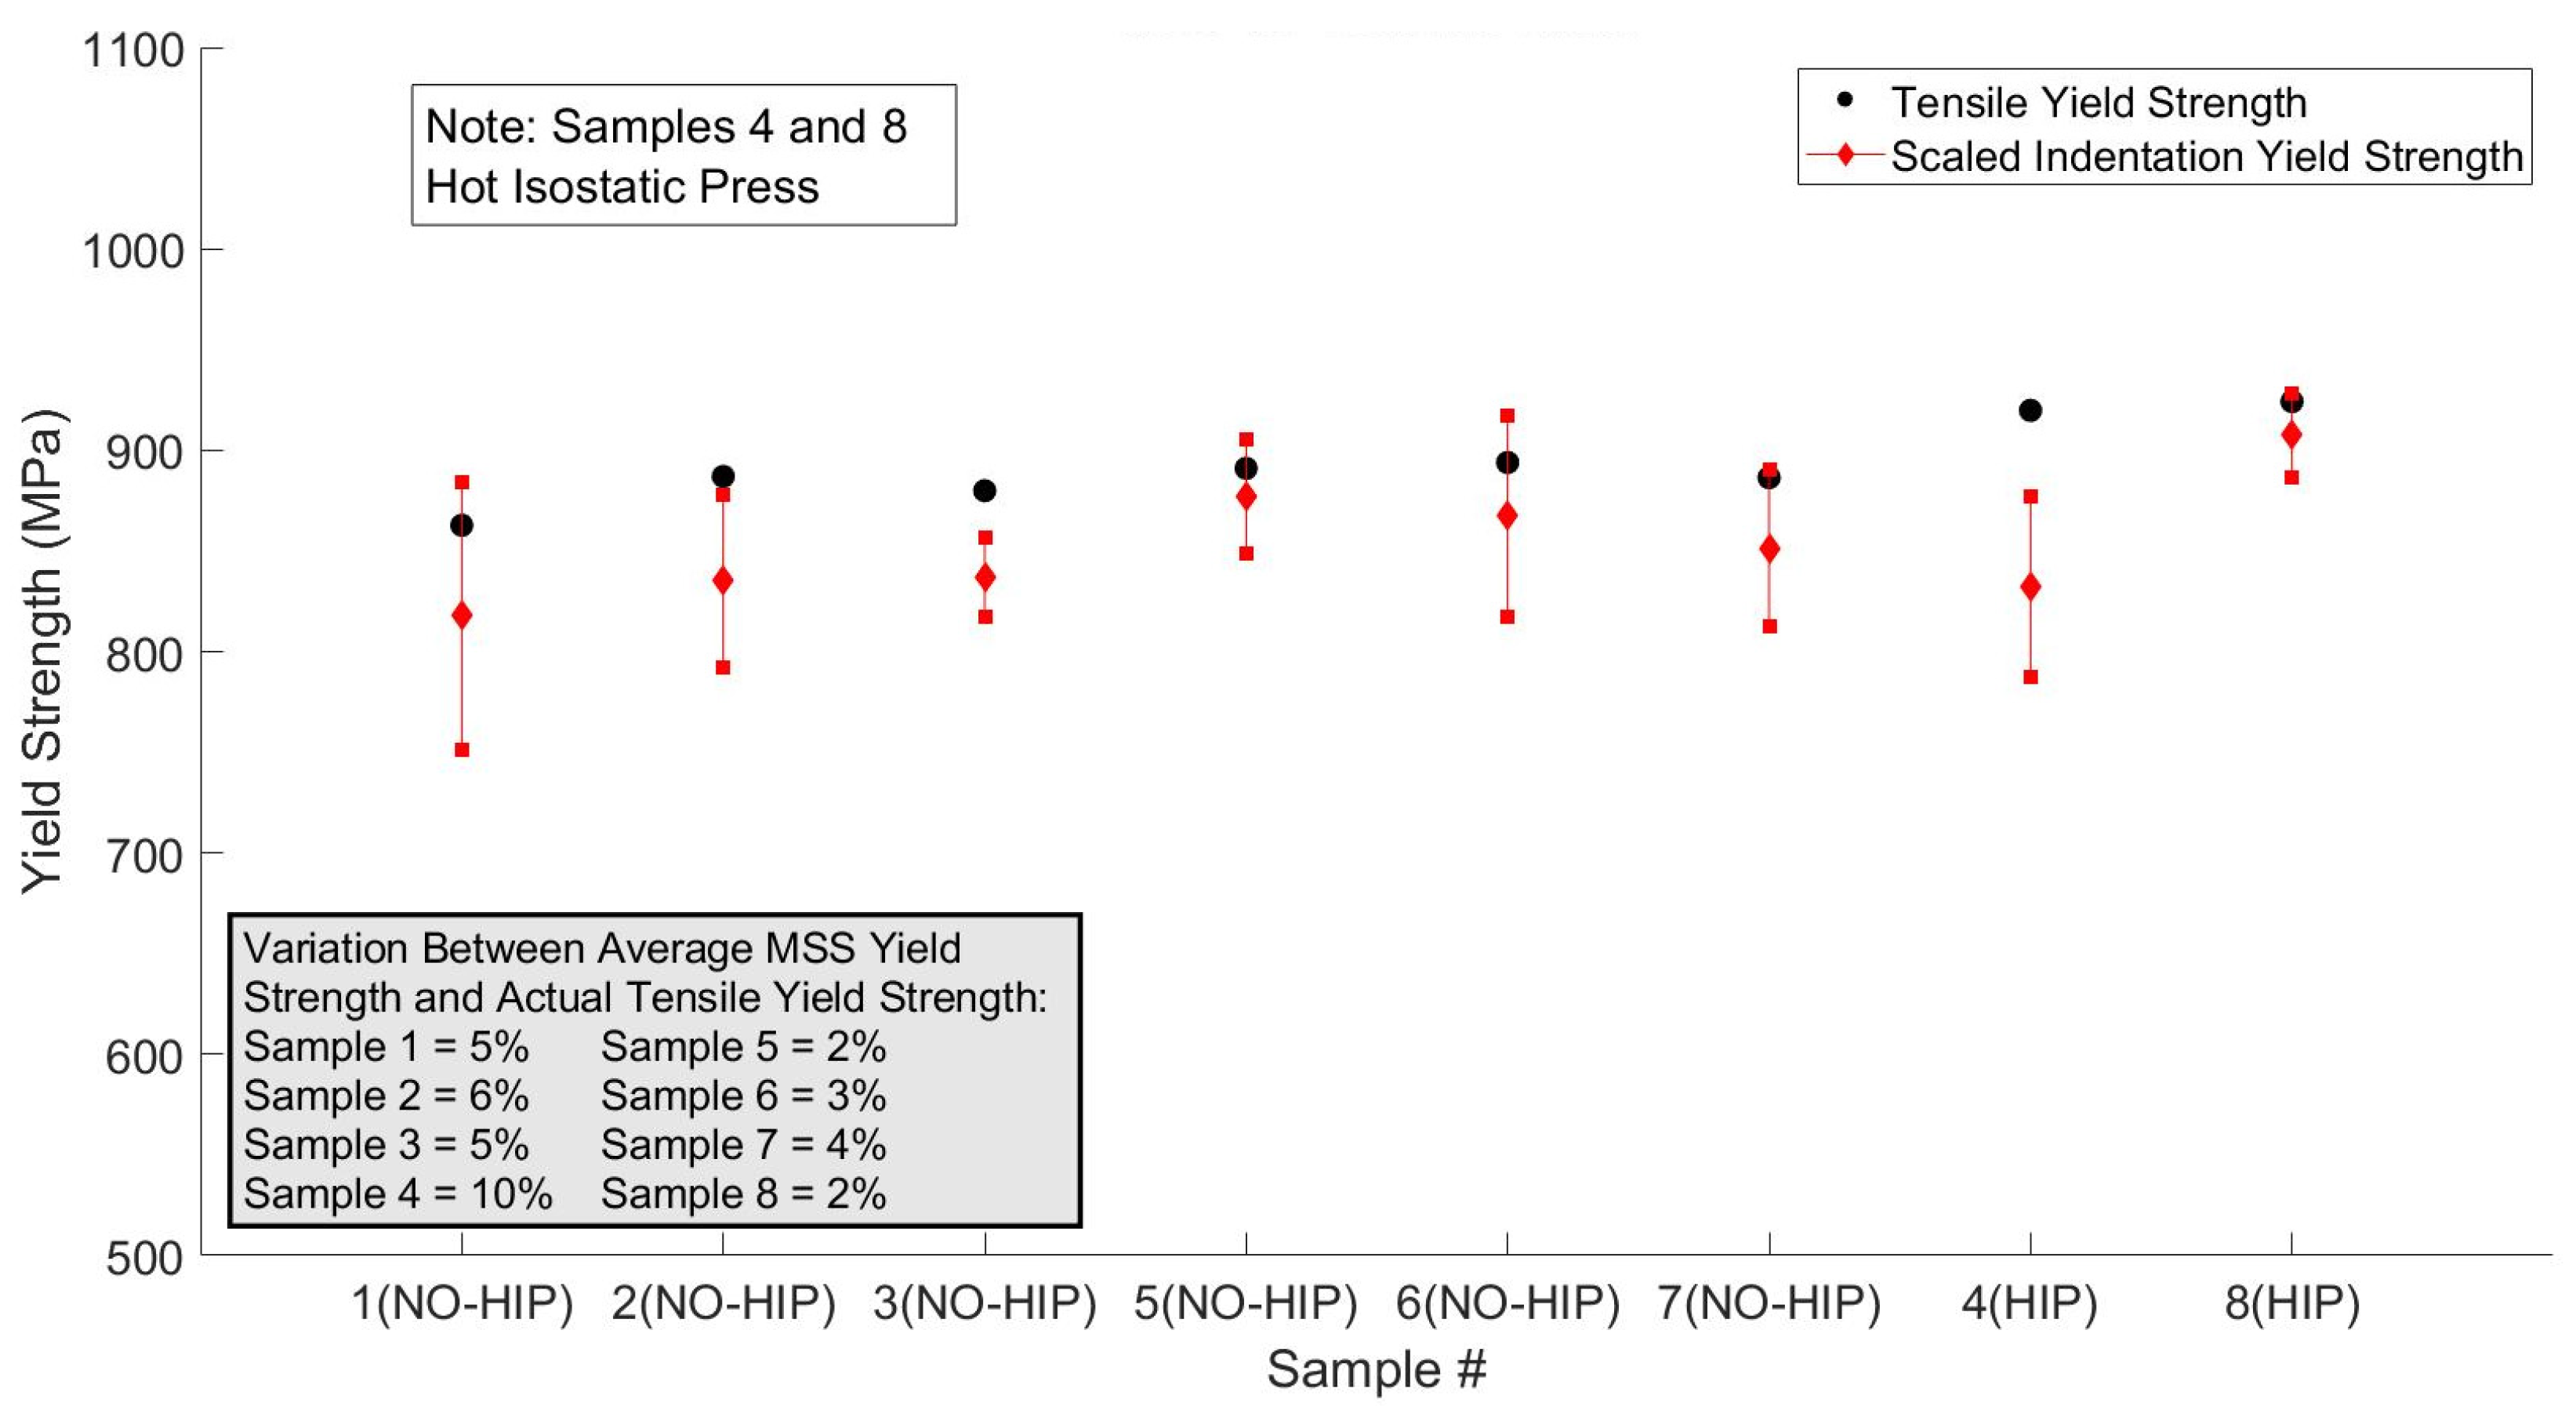
4.1. MSS
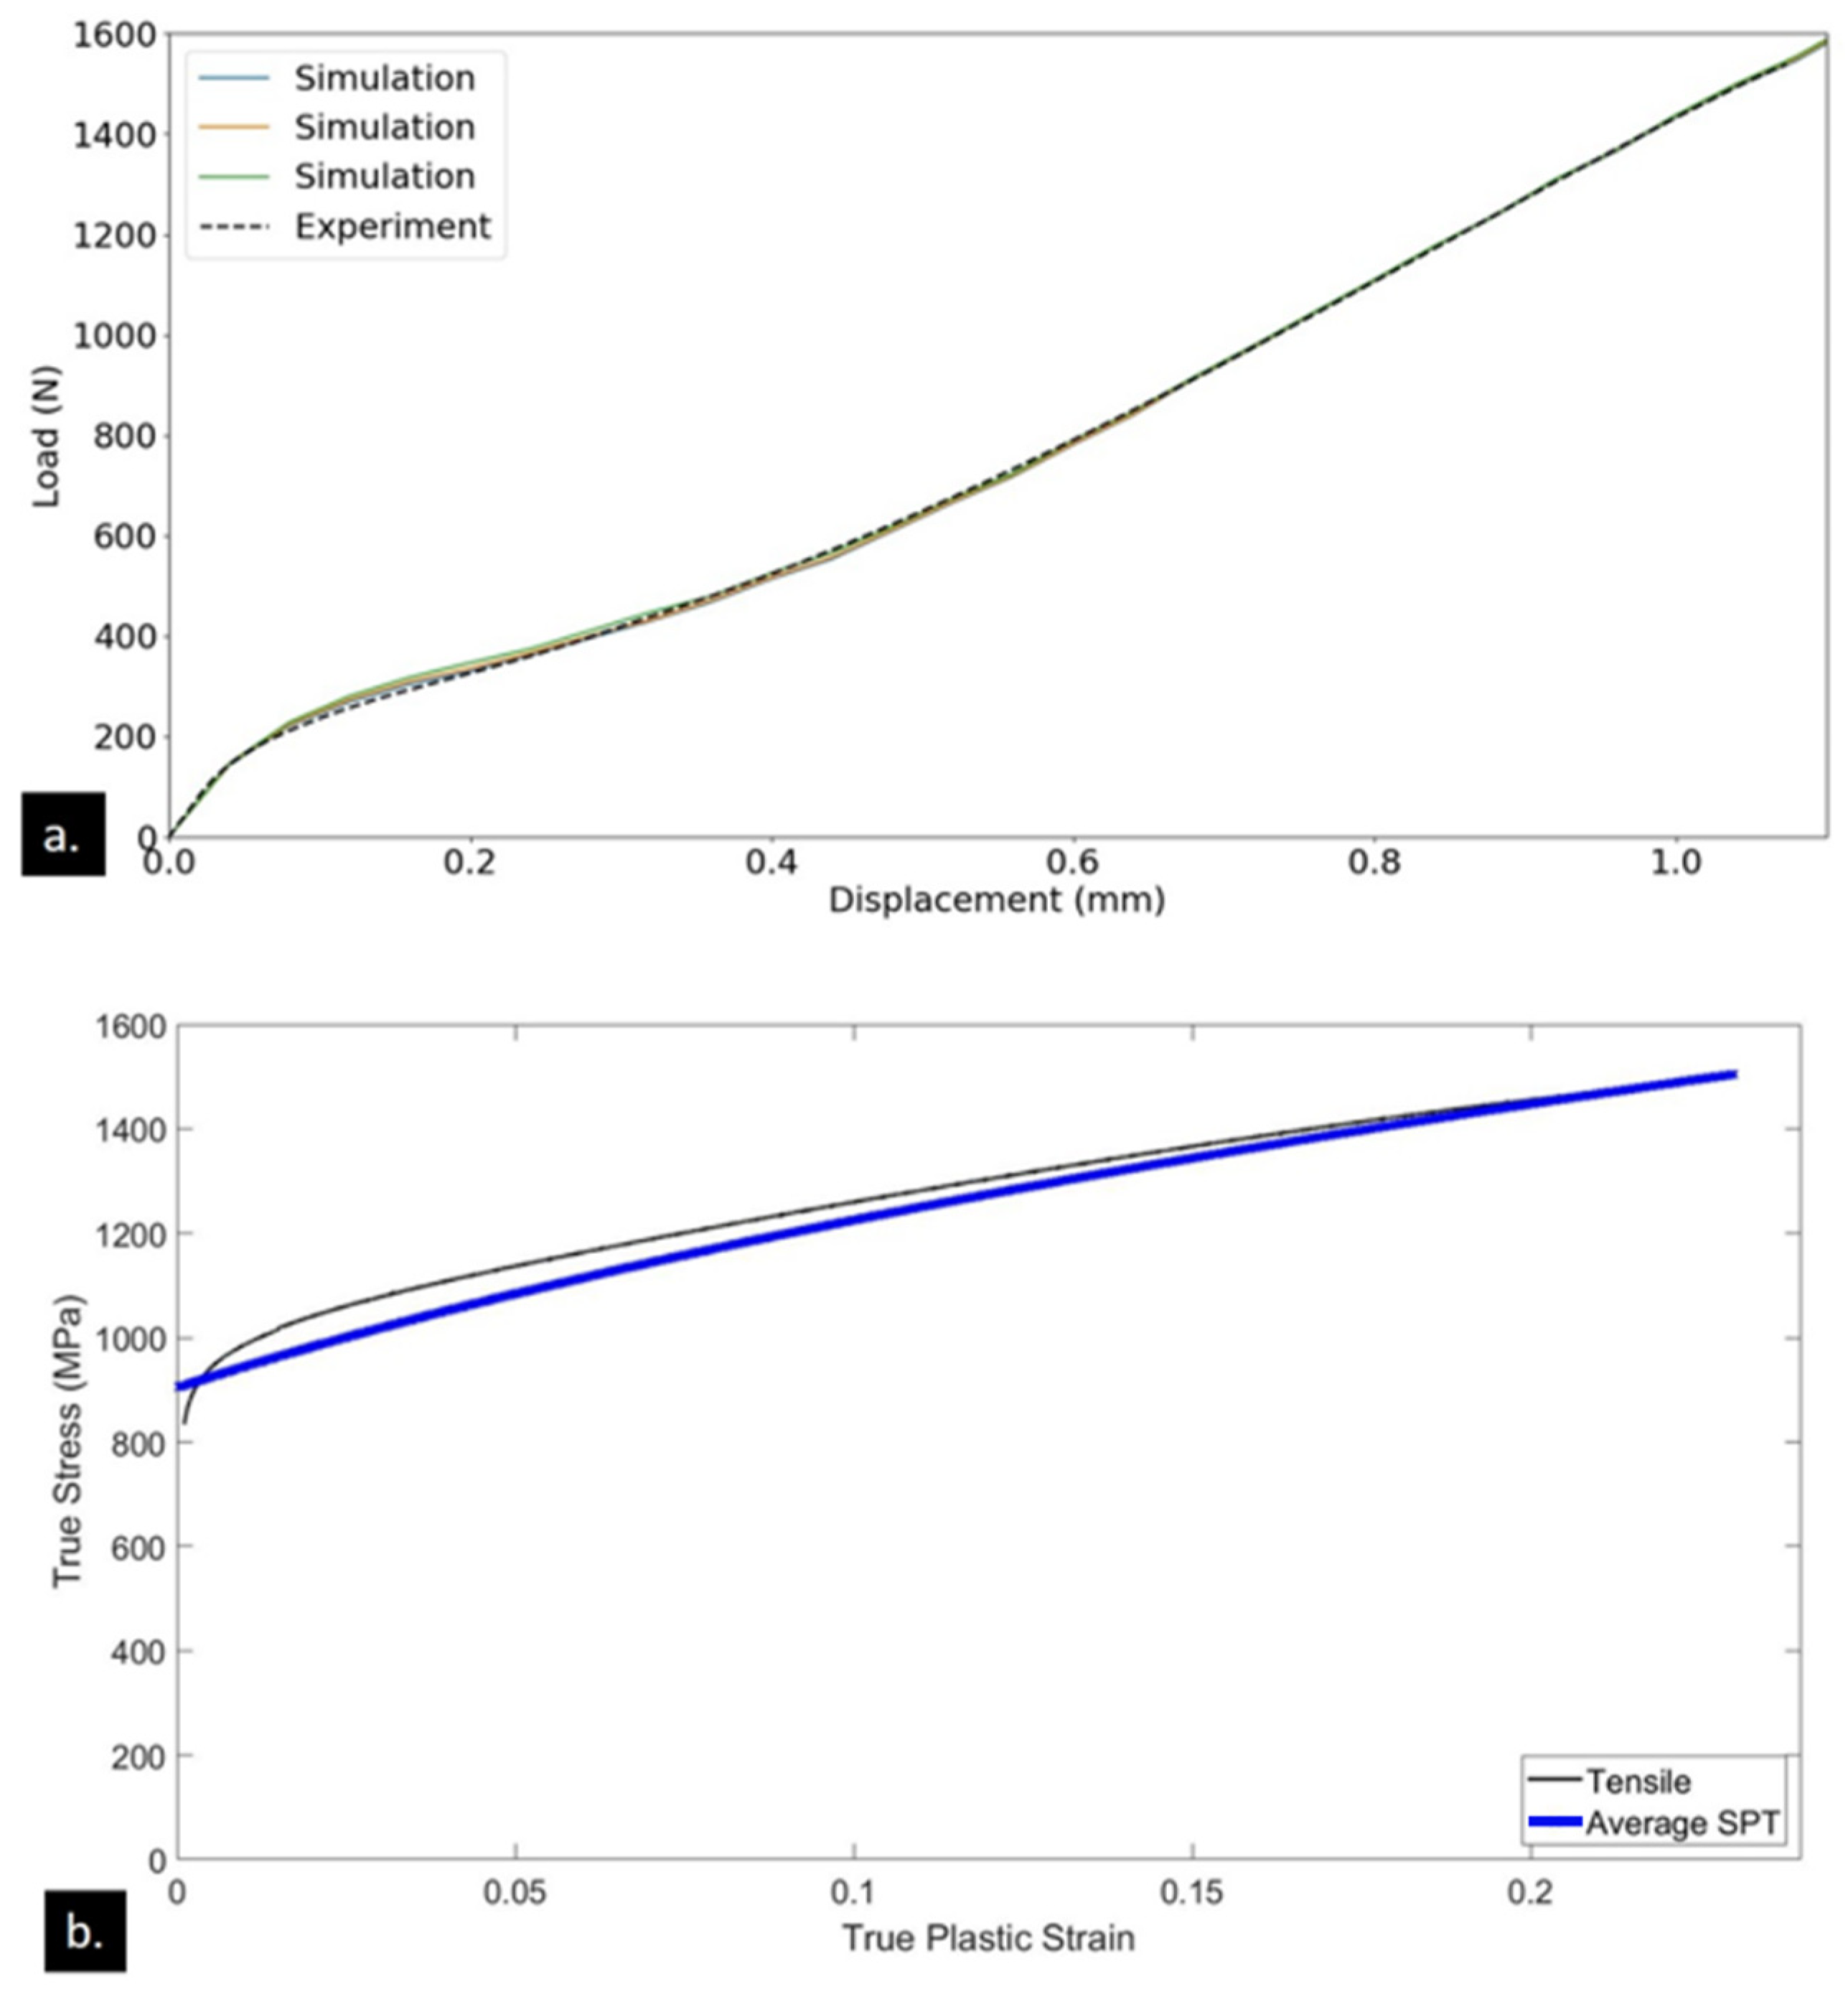
4.2. SPT
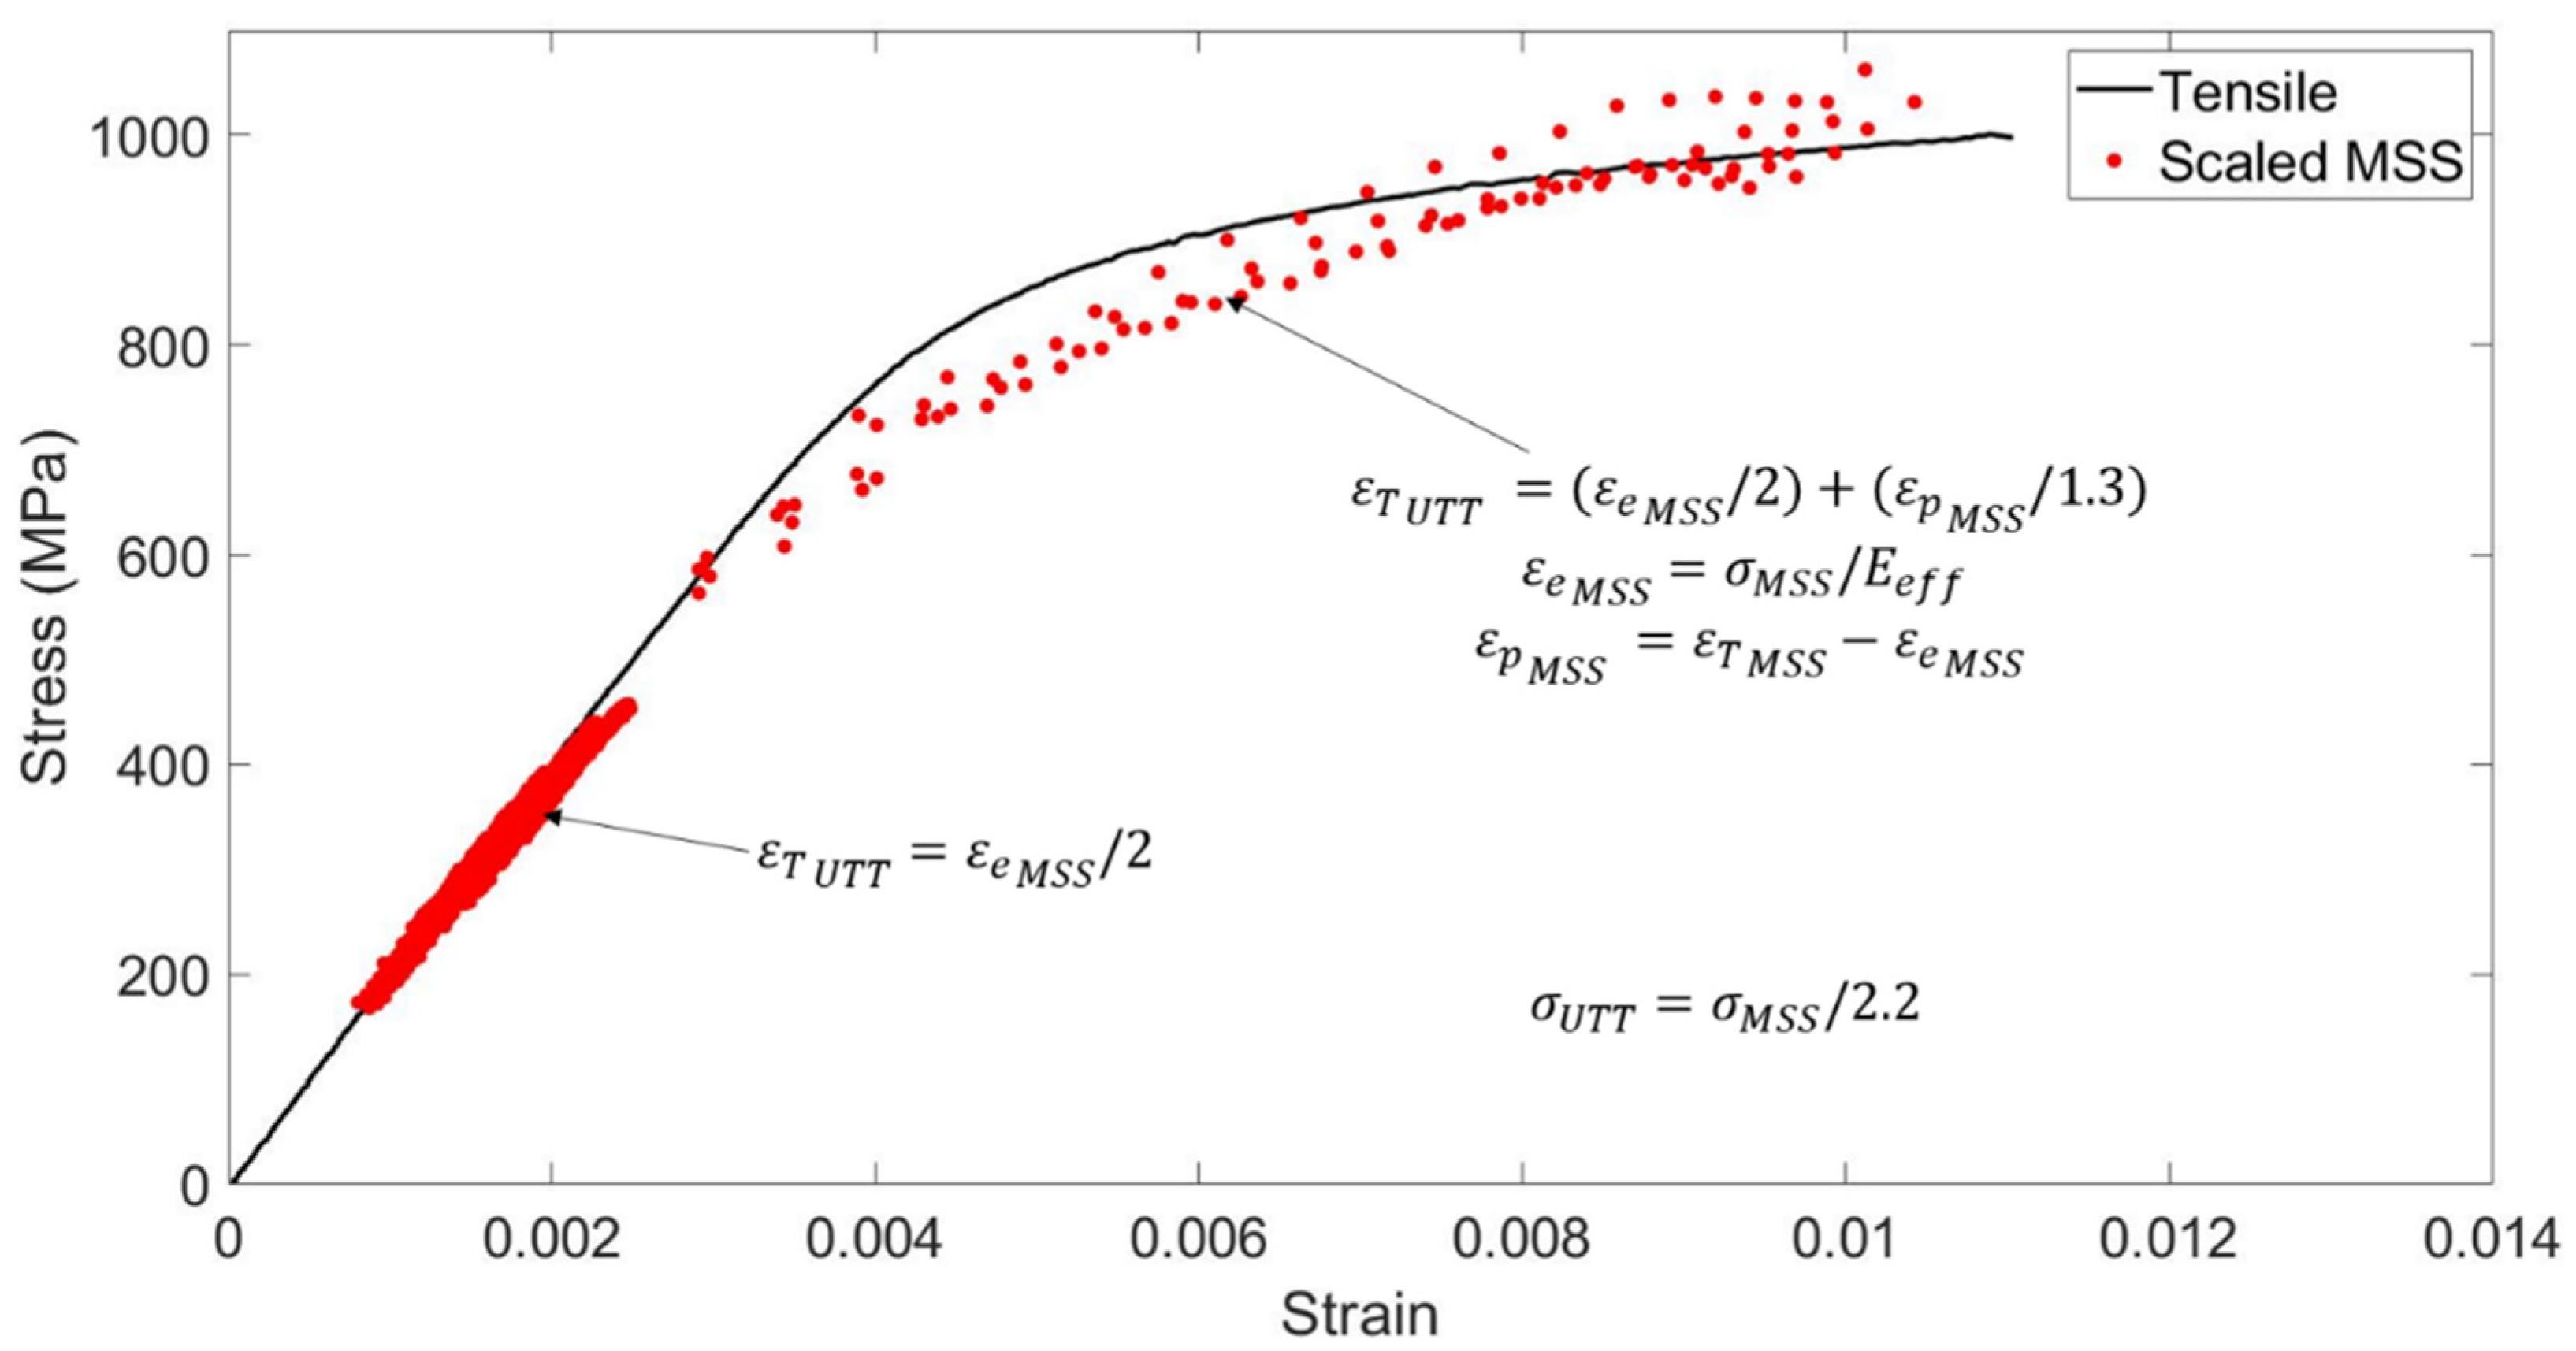
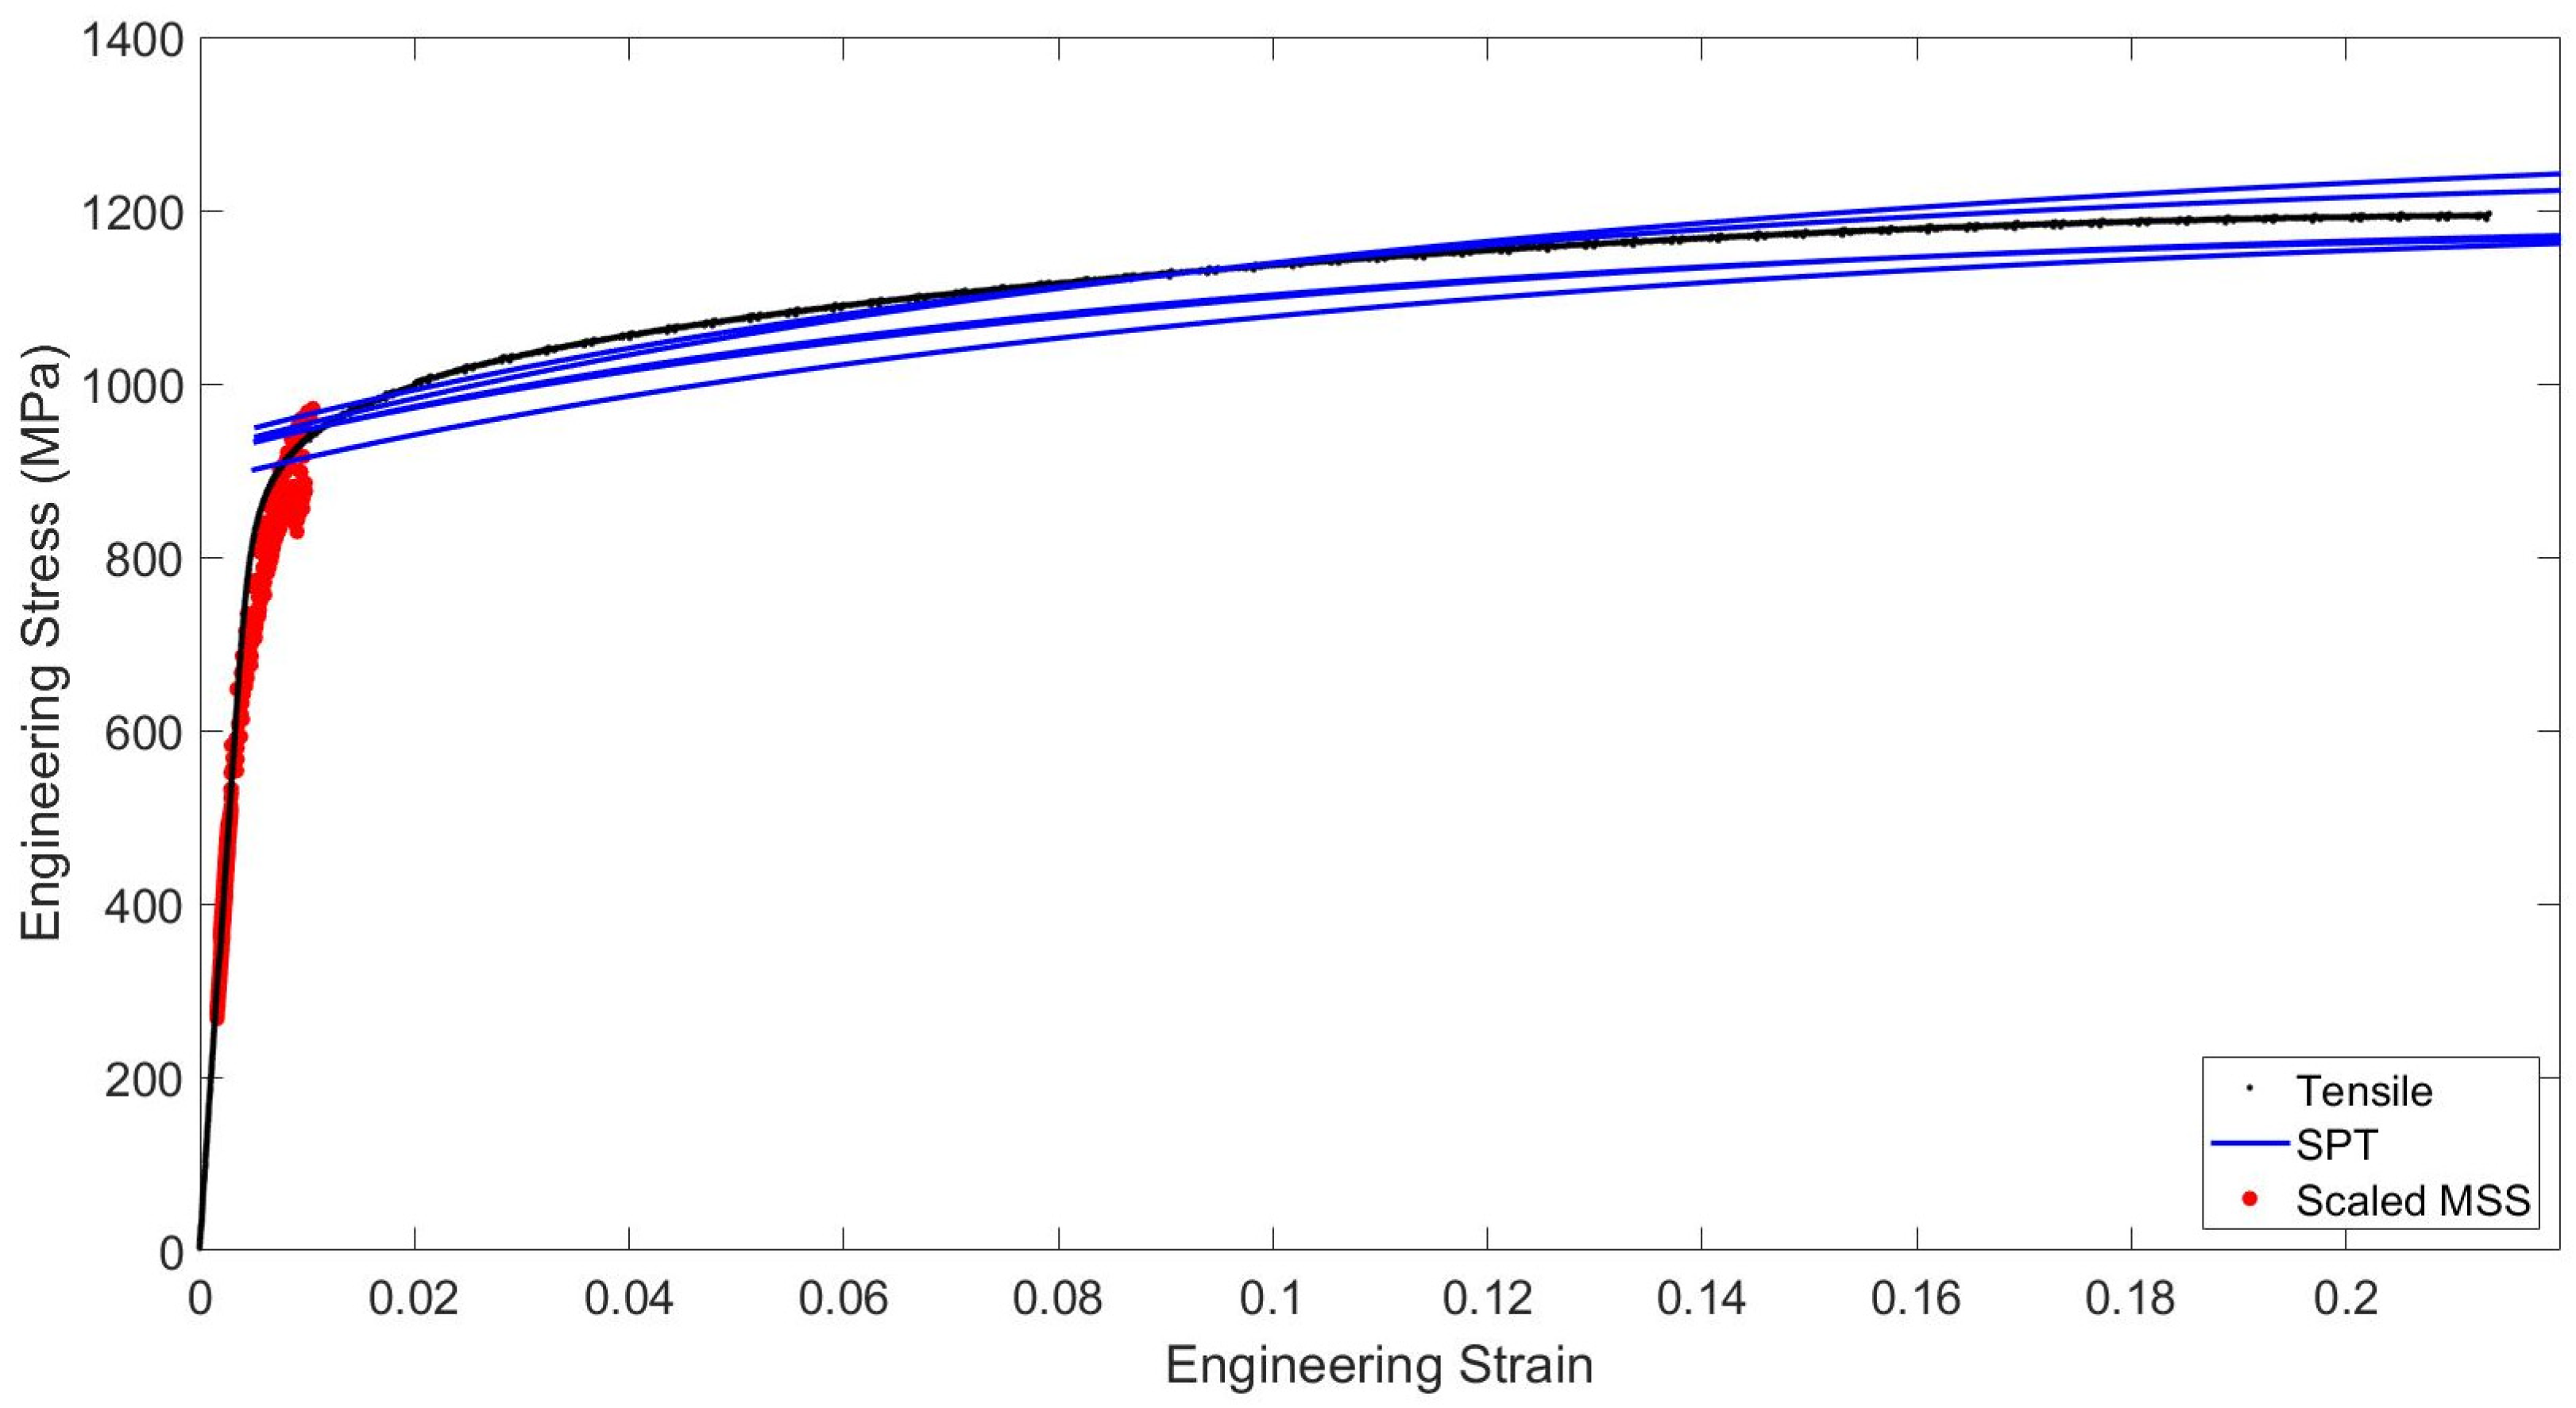
4.3. Relationship between UTT and Combined MSS and SPT
5. Conclusions
Author Contributions
Funding
Institutional Review Board Statement
Informed Consent Statement
Data Availability Statement
Acknowledgments
Conflicts of Interest
References
- Attaran, M. The rise of 3-D printing: The advantages of additive manufacturing over traditional manufacturing. Bus. Horiz. 2017, 60, 677–688. [Google Scholar] [CrossRef]
- Jared, B.H.; Aguilo, M.A.; Beghini, L.L.; Boyce, B.L.; Clark, B.W.; Cook, A.; Kaehr, B.J.; Robbins, J. Additive manufacturing: Toward holistic design. Scr. Mater. 2017, 135, 141–147. [Google Scholar] [CrossRef]
- Gibson, I.; Khorasani, A.M. Metallic Additive Manufacturing: Design, Process, and Post-Processing; Multidisciplinary Digital Publishing Institute, 2019. [Google Scholar]
- Waller, J.M.; Parker, B.H.; Hodges, K.L.; Burke, E.R.; Walker, J.L. Nondestructive evaluation of additive manufacturing. Natl. Aeronaut. Space Adm. 2014. [Google Scholar]
- Trosch, T.; Strößner, J.; Völkl, R.; Glatzel, U. Microstructure and mechanical properties of selective laser melted Inconel 718 compared to forging and casting. Mater. Lett. 2016, 164, 428–431. [Google Scholar] [CrossRef]
- Babuska, T.F.; Wilson, M.A.; Johnson, K.L.; Whetten, S.R.; Curry, J.F.; Rodelas, J.M.; Atkinson, C.; Lu, P.; Chandross, M.; Krick, B.A.; et al. Achieving high strength and ductility in traditionally brittle soft magnetic intermetallics via additive manufacturing. Acta Mater. 2019, 180, 149–157. [Google Scholar] [CrossRef]
- Kok, Y.; Tan, X.; Wang, P.; Nai, M.; Loh, N.; Liu, E.; Tor, S. Anisotropy and heterogeneity of microstructure and mechanical properties in metal additive manufacturing: A critical review. Mater. Des. 2018, 139, 565–586. [Google Scholar] [CrossRef]
- Seifi, M.; Gorelik, M.; Waller, J.; Hrabe, N.; Shamsaei, N.; Daniewicz, S.; Lewandowski, J.J. Progress Towards Metal Additive Manufacturing Standardization to Support Qualification and Certification. JOM 2017, 69, 439–455. [Google Scholar] [CrossRef]
- Gradl, P.; Brandsmeier, W.; Calvert, M.; Greene, S.; O’Neal, D.; Protz, C.; Richard, J.; Morgan, K. Additive manufacturing overview: Propulsion applications, design for and lessons learned. 2017. [Google Scholar]
- Clinton, R., Jr. NASA’s in Space Manufacturing Initiative and Additive Manufacturing Development and Quality Standards Approach for Rocket Engine Space Flight Hardware. Addit. Manuf. Def. Aerosp. 2016, 29–30. [Google Scholar]
- Magagnosc, D.J.; Ligda, J.P.; Sano, T.; Schuster, B.E. Femtosecond Laser Machining of Micro-tensile Specimens for High Throughput Mechanical Testing. In Nonlinear Structures and Systems, Volume 1; Springer Nature: London, UK, 2017; Volume 5, pp. 7–9. [Google Scholar]
- Aboulkhair, N.T.; Maskery, I.; Tuck, C.; Ashcroft, I.; Everitt, N.M. The microstructure and mechanical properties of selectively laser melted AlSi10Mg: The effect of a conventional T6-like heat treatment. Mater. Sci. Eng. A 2016, 667, 139–146. [Google Scholar] [CrossRef]
- Rodriguez, R.A.; Gutiérrez, I. Correlation between nanoindentation and tensile propertiesInfluence of the indentation size effect. Mater. Sci. Eng. A 2003, 361, 377–384. [Google Scholar] [CrossRef]
- Pathak, S.; Shaffer, J.; Kalidindi, S. Determination of an effective zero-point and extraction of indentation stress–strain curves without the continuous stiffness measurement signal. Scr. Mater. 2009, 60, 439–442. [Google Scholar] [CrossRef]
- Abendroth, M.; Kuna, M. Determination of deformation and failure properties of ductile materials by means of the small punch test and neural networks. Comput. Mater. Sci. 2003, 28, 633–644. [Google Scholar] [CrossRef]
- Calaf Chica, J.; Bravo Díez, P.M.; Preciado Calzada, M. A new prediction method for the ultimate tensile strength of steel alloys with small punch test. Materials 2018, 11, 1491. [Google Scholar] [CrossRef] [PubMed]
- Patel, D.K.; Kalidindi, S.R. Correlation of spherical nanoindentation stress-strain curves to simple compression stress-strain curves for elastic-plastic isotropic materials using finite element models. Acta Mater. 2016, 112, 295–302. [Google Scholar] [CrossRef]
- Khosravani, A.; Morsdorf, L.; Tasan, C.C.; Kalidindi, S.R. Multiresolution mechanical characterization of hierarchical materials: Spherical nanoindentation on martensitic Fe-Ni-C steels. Acta Mater. 2018, 153, 257–269. [Google Scholar] [CrossRef]
- Weaver, J.S.; Khosravani, A.; Castillo, A.; Kalidindi, S.R. High throughput exploration of process-property linkages in Al-6061 using instrumented spherical microindentation and microstructurally graded samples. Integr. Mater. Manuf. Innov. 2016, 5, 192–211. [Google Scholar] [CrossRef]
- Fernández, M.; Rodríguez, C.; Belzunce, F.J.; García, T.E. Use of small punch test to estimate the mechanical properties of sintered products and application to synchronizer hubs. Met. Powder Rep. 2017, 72, 355–360. [Google Scholar] [CrossRef]
- Abendroth, M. FEM Analysis of Small Punch Tests. Key Eng. Mater. 2017, 734, 23–36. [Google Scholar] [CrossRef]
- ASTM-E8, E. Standard test methods for tension testing of metallic materials. In Annual Book of ASTM Standards; American Society for Testing and Materials: West Conshohocken, PA, USA, 2001. [Google Scholar]
- ASTM-E10-12. E10-12: Standard Test Methods for Brinell Hardness of Metallic Materials; American Society for Testing and Materials: West Conshohocken, PA, USA, 2012. [Google Scholar]
- Kalidindi, S.R.; Pathak, S. Determination of the effective zero-point and the extraction of spherical nanoindentation stress–strain curves. Acta Mater. 2008, 56, 3523–3532. [Google Scholar] [CrossRef]
- Donohue, B.R.; Ambrus, A.; Kalidindi, S.R. Critical evaluation of the indentation data analyses methods for the extraction of isotropic uniaxial mechanical properties using finite element models. Acta Mater. 2012, 60, 3943–3952. [Google Scholar] [CrossRef]
- Pathak, S.; Kalidindi, S.R. Spherical nanoindentation stress–strain curves. Mater. Sci. Eng. R Rep. 2015, 91, 1–36. [Google Scholar] [CrossRef]
- Abendroth, M.; Soltysiak, S. Assessment of Material Properties by Means of the Small Punch Test. In Recent Trends in Fracture and Damage Mechanics; Springer Nature: London, UK, 2015; pp. 127–157. [Google Scholar]
- Manahan, M.; Argon, A.; Harling, O. The development of a miniaturized disk bend test for the determination of postirradiation mechanical properties. J. Nucl. Mater. 1981, 104, 1545–1550. [Google Scholar] [CrossRef]
- Wolfenden, A.; Mao, X.; Shoji, T.; Takahashi, H. Characterization of Fracture Behavior in Small Punch Test by Combined Recrystallization-Etch Method and Rigid Plastic Analysis. J. Test. Eval. 1987, 15, 30. [Google Scholar] [CrossRef]
- García, T.; Rodriguez, C.; Belzunce, F.J.; Suárez, C. Estimation of the mechanical properties of metallic materials by means of the small punch test. J. Alloys Compd. 2014, 582, 708–717. [Google Scholar] [CrossRef]
- CWA-15627. CWA 15627: 2006 E, “Small Punch Test Method for Metallic Materials”, PART A: A Code of Practice for Small Punch Creep Testing; CEN: Brussels, Belgium, 2006. [Google Scholar]
- Bruchhausen, M.; Austin, T.; Holmström, S.; Altstadt, E.; Dymacek, P.; Jeffs, S.; Lancaster, R.; Lacalle, R.; Matocha, K.; Petzová, J. European standard on small punch testing of metallic materials. In ASME 2017 Pressure Vessels and Piping Conference; American Society of Mechanical Engineers: New York, NY, USA, 2017. [Google Scholar]
- Leclerc, N.; Khosravani, A.; Hashemi, S.; Miracle, D.B.; Kalidindi, S.R. Correlation of Measured Load-Displacement Curves in Small Punch Tests with Tensile Stress-Strain Curves. Acta Mater. 2021, 204, 116501. [Google Scholar] [CrossRef]
- Moussa, C.; Hernot, X.; Bartier, O.; Delattre, G.; Mauvoisin, G. Evaluation of the tensile properties of a material through spherical indentation: Definition of an average representative strain and a confidence domain. J. Mater. Sci. 2013, 49, 592–603. [Google Scholar] [CrossRef]
- Chen, Y.H.; Park, S.U.; Wei, D.; Newstadt, G.E.; Jackson, M.A.; Simmons, J.P.; De Graef, M.; Hero, A.O. A Dictionary Approach to Electron Backscatter Diffraction Indexing. Microsc. Microanal. 2015, 21, 739–752. [Google Scholar] [CrossRef]
- Yabansu, Y.C.; Iskakov, A.; Kapustina, A.; Rajagopalan, S.; Kalidindi, S.R. Application of Gaussian process regression models for capturing the evolution of microstructure statistics in aging of nickel-based superalloys. Acta Mater. 2019, 178, 45–58. [Google Scholar] [CrossRef]
- Kleemola, H.J.; Nieminen, M.A. On the strain-hardening parameters of metals. Met. Mater. Trans. A 1974, 5, 1863–1866. [Google Scholar] [CrossRef]
- Zarzour, J.F.; Konkol, P.J.; Dong, H. Stress-strain characteristics of the heat-affected zone in an HY-100 weldment as determined by microindentation testing. Mater. Charact. 1996, 37, 195–209. [Google Scholar] [CrossRef]
- Kim, H.N.; Mandal, S.; Basu, B.; Kalidindi, S.R. Probing Local Mechanical Properties in Polymer-Ceramic Hybrid Acetabular Sockets Using Spherical Indentation Stress-Strain Protocols. Integr. Mater. Manuf. Innov. 2019, 8, 257–272. [Google Scholar] [CrossRef]
- Clijsters, S.; Craeghs, T.; Moesen, M.; Kruth, J.P. Optimization of thin wall structures in SLM. In Proceedings of the Direct Digital Manufacturing Conference, Berlin, Germany, 14–15 March 2012. [Google Scholar]
- Czotscher, T.; Wielki, N.; Vetter, K.; Vollertsen, F.; Meyer, D. Rapid Material Characterization of Deep-Alloyed Steels by Shock Wave-Based Indentation Technique and Deep Rolling. Nanomanuf. Metrol. 2019, 2, 56–64. [Google Scholar] [CrossRef]
- Tsai, P.; Flores, K.M. High-throughput discovery and characterization of multicomponent bulk metallic glass alloys. Acta Mater. 2016, 120, 426–434. [Google Scholar] [CrossRef]
- Parvinian, S.; Yabansu, Y.C.; Khosravani, A.; Garmestani, H.; Kalidindi, S.R. High-Throughput Exploration of the Process Space in 18% Ni (350) Maraging Steels via Spherical Indentation Stress–Strain Protocols and Gaussian Process Models. Integr. Mater. Manuf. Innov. 2020, 9, 199–212. [Google Scholar] [CrossRef]
- Coll, G.T.; Webster, G.; Pankiewicz, O.; Schlee, K.; Aranyos, T.; Nufer, B.; Fothergill, J.; Tamasy, G.; Kandula, M.; Felt, A.; et al. Satellite Servicing Projects Division Restore-L Propellant Transfer Subsystem Progress 2020. In Proceedings of the AIAA Propulsion and Energy 2020 Forum, 24–28 August 2020. [Google Scholar]
- Crocker, L. Literature Review on Tensile Test Standards for Metal Additive Manufacturing; National Physical Laboratory: Middlesex, UK, 2019. [Google Scholar]
- NASA-MSFC. Specification for Control and Qualification of Laser Powder Bed Fusion Metallurgical Processes; NASA: Washington, DC, USA, 2018. [Google Scholar]
- Wang, M.; Pang, J.; Qiu, Y.; Liu, H.; Li, S.; Zhang, Z. Tensile Strength Evolution and Damage Mechanisms of Al-Si Piston Alloy at Different Temperatures. Adv. Eng. Mater. 2018, 20, 1700610. [Google Scholar] [CrossRef]
- NASA-MSFC. Standard for Additively Manufactured Spaceflight Hardware by Laser Powder Bed Fusion in Metals; NASA: Huntsville, AL, USA, 2018. [Google Scholar]
- Lancaster, R.; Jeffs, S.; Illsley, H.; Argyrakis, C.; Hurst, R.; Baxter, G. Development of a novel methodology to study fatigue properties using the small punch test. Mater. Sci. Eng. A 2019, 748, 21–29. [Google Scholar] [CrossRef]


| Sample Number | HIP (Y/N) | Machine |
|---|---|---|
| 1 | N | M1 |
| 2 | N | M1 |
| 3 | N | M1 |
| 4 | Y | M1 |
| 5 | N | M2 |
| 6 | N | M2 |
| 7 | N | M2 |
| 8 | Y | M2 |
| Sample Processing Cost and Time | SPT | Tensile |
|---|---|---|
| Machining Cost for 18 Samples ($) | 112.5 | 562 |
| Machining Time for 18 Samples (hours) | 1.25 | 7.5 |
| Cost per Test ($) | <2 | 115 |
Publisher’s Note: MDPI stays neutral with regard to jurisdictional claims in published maps and institutional affiliations. |
© 2021 by the authors. Licensee MDPI, Basel, Switzerland. This article is an open access article distributed under the terms and conditions of the Creative Commons Attribution (CC BY) license (http://creativecommons.org/licenses/by/4.0/).
Share and Cite
Courtright, Z.S.; Leclerc, N.P.; Kim, H.N.; Kalidindi, S.R. Critical Comparison of Spherical Microindentation, Small Punch Test, and Uniaxial Tensile Testing for Selective Laser Melted Inconel 718. Appl. Sci. 2021, 11, 1061. https://doi.org/10.3390/app11031061
Courtright ZS, Leclerc NP, Kim HN, Kalidindi SR. Critical Comparison of Spherical Microindentation, Small Punch Test, and Uniaxial Tensile Testing for Selective Laser Melted Inconel 718. Applied Sciences. 2021; 11(3):1061. https://doi.org/10.3390/app11031061
Chicago/Turabian StyleCourtright, Zachary S., Nicolas P. Leclerc, Hyung Nun Kim, and Surya R. Kalidindi. 2021. "Critical Comparison of Spherical Microindentation, Small Punch Test, and Uniaxial Tensile Testing for Selective Laser Melted Inconel 718" Applied Sciences 11, no. 3: 1061. https://doi.org/10.3390/app11031061
APA StyleCourtright, Z. S., Leclerc, N. P., Kim, H. N., & Kalidindi, S. R. (2021). Critical Comparison of Spherical Microindentation, Small Punch Test, and Uniaxial Tensile Testing for Selective Laser Melted Inconel 718. Applied Sciences, 11(3), 1061. https://doi.org/10.3390/app11031061