Featured Application
This study provides morphometric data of the Thai distal femur based on the computed tomography data and reversed engineering technique, which can be used for application in knee implant design-included forensic anthropology.
Abstract
This study evaluates the distal femur morphology of the Thai population using a three-dimensional (3D) measurement method, measuring the distance between the triangular point of the femoral 3D model. The 3D model of 360 Thai femoral obtained from 180 volunteers (90 males, 90 females; range 20–50 years, average 32.8 years) was created using reverse engineering techniques from computed tomography imaging data. Using the 3D identified landmark method, the morphometric parameters evaluated included transepicondylar axis length (TEA), mediolateral length (ML), anteroposterior width (AP), medial anteroposterior width (MAP), lateral anteroposterior width (LAP), medial condyle width (MCW), lateral condyle width (LCW), intercondylar notch width (WIN), intercondylar notch depth (DIN), medial posterior condyle height (MPC), lateral posterior condyle height (LPC), femoral aspect ratio (ML/AP), lateral femoral aspect ratio (ML/LAP), and medial femoral aspect ratio (ML/MAP). The measured data were summarized for the analysis of an average value and standard deviation. Statistical analysis was performed using the independent samples t-test, unequal variances t-test, and linear regression. A p-value less than 0.05 (<0.05) was regarded as statistically significant and indicates strong evidence of the hypothesis. Additionally, the K-means clustering analysis of Thai distal femoral to the optimum size of the prosthesis with the correlation between ML length and AP width was performed. The results found that the morphometric parameters of the Thai male distal femur were significantly different and higher than those of Thai females, except for the ratio of ML/AP and ML/MAP. Comparatively, there was a significant difference between the specific size of Thai distal femur and that of the Korean population, which was also smaller than that for Caucasians. In addition, there was a mismatch between the distal femoral component sizing of knee prosthesis and what is available and commonly used in Thailand. At least six sizes of ML and/or AP should be recommended for the reasonable design of distal femoral prosthesis for covering the anatomy of Thais. These data are useful for predicting the morphometric parameters in forensic anthropology and provide basic data for the design of knee prostheses suitable for the Thai population.
1. Introduction
The largest bone in the human body is a femur, which is widely researched in fields such as forensic anthropology and orthopedics. For forensic anthropology research, the femur’s morphology, both proximal and distal parts, was investigated to determine differences in the femur concerning populations and sex [,]. The orthopedics research involves an analysis of the proximal femur, including a femoral head, neck, and the proximal femoral medullary canal for hip joint studies [,,]. The dimensions of the distal femur are important, especially in the prostheses or implants design for a knee joint such as total knee arthroplasty (TKA) [,,]. Generally, the femur’s morphometric studies could be conducted by direct measurements based on a dry bone using Vernier calipers or rulers [,,,]. Alternatively, the indirect method was performed using a reversed engineering technique based on the data from radiography, computed tomography scans (CT), and magnetic resonance imaging (MRI). The advantage of this method is the investigation in a digital format that is non-destructive of the specimen, and the useful assessment identified anatomical landmarks and included the automatically calculated measurement []. Computed tomography data can be measured in both two-dimensional (2D) and three-dimensional (3D) formats [,,,]. Based on three-dimensional measurement, the femoral 3D models were created by a reverse engineering technique, which involves returning the physical product to virtual models that can be considered as two phases, including a digitization and reconstruction phase. The digitization phase relates data acquisition from physical objects, a sample part or prototype, using various forms of a scanner. The data from scanning have been collected as images or a 3D coordinates representation of the object’s surface (point cloud data). Then, in the reconstruction phase, the data are transferred to Computer-Aided Reverse Engineering (CARE) software for the reconstruction of the three-dimensional model in which the surface is represented as a polygonal mesh [,,,,]. In addition, the morphological evaluation based on 3D models is an adequate accurate dimension and convenient measurement. Moreover, the models can be configured such as rotation, translation, and clipping [,].
There are several studies featuring the morphometric analysis of Thai femoral such as a study of morphological parameters of the proximal femur with a three-dimensional measurement technique [], a measurement of the anteroposterior and mediolateral length of distal femur based on MRI [], and intraoperative anthropometric measurement of resected Thai distal femurs during surgery []. However, a morphometric study of the Thai distal femur has reported some parameters that may be insufficient for the application, such as the sexual prediction in forensic science or knee prosthesis design. For the design of the knee implant, the dimension of implant geometry is one factor that affects the durability of the prostheses. The optimization of the implant dimension coverage surface area between bone and implant component is one approach to improving the longevity of the prostheses because it can reduce stress around the bone and wear in the tibial insert []. In addition, the biomechanics of the knee joint should be considered in the designing process of the knee implant. Finite Element Analysis (FEA), the process of simulating the behavior of a physical problem using a numerical mathematic technique, is the method that is used to analyze the biomechanics of various knee prosthesis designs []. This method allows the modeling of complex geometry and system of loads such as forces, pressure, and movement that corresponding to activities in daily life. Therefore, FEM can be efficient in simulating various situations to improve the design of various implants [,,]. This study aims to provide only fundamental morphometric data of the Thai distal femur. Therefore, this study aimed to evaluate the morphometric parameters of the Thai distal femur based on a three-dimensional imaging data reconstructed from computed tomography using a reverse engineering technique. All the morphometric parameters were collected via a non-invasive technique used for any medical examination or treatment that does not cut the skin or enter any of the body’s spaces—for example, diagnosis or anatomical measurement using magnetic resonance imaging or computed tomography images. This study used measurements based on a 3D model, which was a rapid, cost-effective, and non-invasive approach to accomplish the morphometric parameters. Then, the morphometric data of the Thai distal femur was compared to the distal femoral prosthesis available and used commercially. In addition, the K-means clustering analysis was performed to the determination of the number of clusters for the distal femur parameter. The anteroposterior width and mediolateral length data were used to classify the numbers of femoral component sizing for Thais. The proper sizes were determined by the elbow method, which was one method for validating the number of clusters []. In this way, we hypothesized that the measurement data between males and females differed, and the Thai distal femur studied had no differences from other nationalities. The available distal femoral prosthesis size is not suitable for Thais.
2. Materials and Methods
In this research, three hundred and sixty Thai femora were used. These data were collected from CT-scanning and reconstructed three-dimensional models to determine the morphometric parameters. Accordingly, this section has four parts, including data acquisition, 3D CT reconstruction, measurement of morphometric parameters, and statistical analysis.
2.1. Data Acquisition
The acquired data are CT scan images of the human knee, which were stored in the Digital Imaging and Communications in Medicine (DICOM) format. This research has been approved by the ethics committee for research involving human subjects, Suranaree University of Technology (EC59-60). Subjects who participated were recruited from healthy Thai adult volunteers who had an average age of 32.8 years (in the range of 20–50 years). A total number of 360 Thai femora were obtained from 180 volunteers: 90 males and 90 females. All participants have been informed of the study and signed the consent form. The selection criteria for each subject included normal lower limb appearance, normal alignment, and no clinical history of knee arthritis. They were excluded if they were underage, suspected pregnant by loss of menstruation of more than 1 month or pregnant, refusal to undergo CT, and claustrophobia.
2.2. CT Scans and 3D Reconstruction
All participants were set up in the supine position and the foot was in a neutral position with the use of a 64-slice spiral computed tomography (CT) scanner (Optima CT660, GE Healthcare, Chicago, IL, USA). The CT protocol was defined with the following parameters: 120 kVp with automatic value in the range of 50 to 320 mA, the dose reduction of 20%, and the slice thickness of 2.5 mm with the reconstruction of 0.625 mm in the scan length of 90 to 30 cm. Next, the CT images were imported into the medical imaging processing software (MIMICS, Materialise N.V., Leuven, Belgium) for the reconstruction of 3D surface models. CT image data were segmented for selecting the required tissue type by MIMICS software as shown in Figure 1. The Hounsfield scale threshold was used to control and correct the segmentation of the CT image; the Hounsfield value depended on density. The higher Hounsfield value indicates high-density objects such as cortical bone, while the lower Hounsfield value represents low-density objects such as muscles and soft tissue. This study selected a lower limit of 226 Hounsfield units (HU) and an upper limit of 3071 HU to separate bone from soft tissue. When the segmentation had finished, there is an integrated function to calculate the 3D model from these CT images that were exported in stereolithography (STL) format. The surface of the reconstructed 3D model was meshed by a triangle. For measurement based on 3D models, the distance was measured between the triangular points. The adaptive remeshing function in Materialise 3-Matic (Materialise N.V., Belgium) was used to improve the quality of the triangular element. Since the triangle size influenced the accuracy of measurement on the 3D models, the maximum edge length of 0.2 mm (the edge length in the software ranges from 0.10 to 3.00 mm) was used in this study.
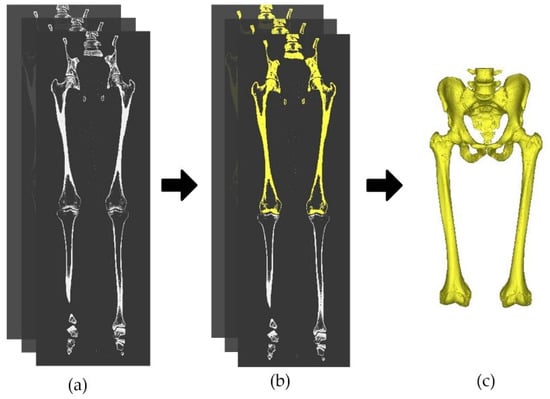
Figure 1.
Three-dimensional model reconstruction: (a) a series of raw computed tomography (CT) image, (b) segmentation of CT images, and (c) 3D model.
The femoral 3D models as shown in Figure 2 were adjusted for alignment before measurement by Materialise 3-Matic [,,]. Firstly, the mechanical axis, a line from the center of the femoral head to the apex point of the intercondylar notch, was aligned in a sagittal plane. Secondly, the line between the most medial posterior points and the most lateral posterior points of femoral condyles were aligned in a coronal plane. Finally, the transverse plane was defined as the line connecting the most inferior points of both femoral condyles.
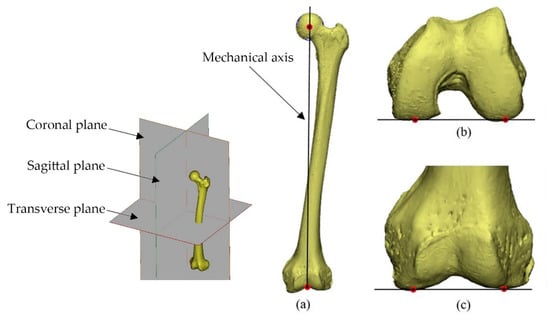
Figure 2.
The alignment of the 3D femur models: (a) the mechanical axis was aligned in a sagittal plane, (b) the most posterior point of both condyles was aligned in a coronal plane, and (c) the most inferior points of both condyles were aligned in a transverse plane.
2.3. Measurement of Morphometric Parameters
In this study, the anatomical landmarks as shown in Figure 3 were defined from previous reports for morphometric measurement of the distal femur [,,] as follows: the most prominent point of lateral epicondyle (LE), the most prominent point of medial epicondyle (ME), the most anterior cortex point (AC), the most anterior point of medial condyle (MAC), the most posterior point of medial condyle (MPC), the most anterior point of lateral condyle (LAC), the most posterior point of lateral condyle (LPC), the most medial point of medial condyle (MMC), the most lateral point of medial condyle (MLC), the most lateral point of lateral condyle (LLC), the most medial point of lateral condyle (LMC), the apex of intercondylar notch (DIN), the most inferior point of lateral condyle (HLC1), the most superior point of lateral condyle (HLC2), the most inferior point of medial condyle (HMC1), and the most superior point of medial condyle (HMC2).

Figure 3.
The anatomical landmarks on the distal femur: (a) in inferior view and (b) in posterior view.
The abbreviation and definition of the morphometric parameters of the distal femur shown in Table 1 were investigated as follows: two lengths, six widths, one depth, two heights, and three ratios. To assess the accuracy of the measurement, the intra-rater and inter-rater reliability were evaluated before measurement []. Two observers measured morphometric parameters including transepicondylar axis length (TEA), mediolateral length (ML), anteroposterior width (AP), medial anteroposterior width (MAP), lateral anteroposterior width (LAP), medial condyle width (MCW), lateral condyle width (LCW), intercondylar notch width (WIN), intercondylar notch depth (DIN), MPC, and LPC by the selection of landmark point for distance measurement with three replicates on 20 random femora, and one of the observers measured the same femur twice with a two-week interval. Measured values from two observers were analyzed by statistical software SPSS (SPSS Inc., Chicago, IL, USA).

Table 1.
Abbreviation and definition of morphometric parameters of the distal femur.
2.4. Statistical Analysis
The reliability must be established before any measurement and instrument or assessment tool is used for research or clinical applications. The intra-class correlation coefficient (ICC) is a common statistic performed to assess reliability such as inter-rater, test-retest, and intra-rater reliability, which are usually found to have a value between 0 and 1. A high ICC value close to 1 indicates that values in the same group are highly similar. The measurement data were presented in terms of the mean ± standard deviation (SD). A comparison of means between gender was analyzed with an independent t-test. The investigation of different morphometric parameters between other nationalities and Thai studies was analyzed with Welch’s t-test or unequal variances t-test. A p-value of less than 0.05 (p < 0.05) was considered as a statistically significant difference. The linear regression analysis was used to determine correlations of morphometric parameters. Additionally, the K-means clustering analysis and elbow technique were used to classify the number of sizes of the femoral prosthesis for Thais using anteroposterior width and mediolateral length data.
3. Results
After measuring the morphometric parameters was completed, these data were analyzed, and the results from this research were reported, which consists of the following six sections: reliability analyses, morphological parameters in Thais, comparing morphometric with Thai studies, comparing morphometric with other nationalities, linear regression analysis, and application of morphometric data. However, morphometric information from this study can be used for other purposes.
3.1. Intra-Rater and Inter-Rater Reliability Analyses
According to the statistical analysis, the ICC values of morphological parameters can be shown in Table 2. The intra-rater reliability showed that all parameters were highly reliable in the range between 0.85 and 0.98. Similarly, the value of inter-rater reliability was revealed in the range between 0.84 and 0.98.
Table 2.
Intra-class correlation coefficient value of morphometric parameters.
3.2. Measurement of Morphological Parameters in Thai Male and Female
Table 3 shows the result of morphometric parameters of Thai distal femur obtained from 3D models that summarized of mean ± SD (mm) in the gender groups. The results show that the morphometric parameters in the male group were significantly higher than those in the female group (p < 0.05), except for the ML/AP and ML/MAP ratio. It means the ML/AP or ML/MAP ratio of the Thais was approximately 1.26 and 1.18, respectively.
Table 3.
Summary of the morphology measurement of the Thai distal femur in mean ± SD (mm).
3.3. Comparison of the Morphometric Parameters with Thai Studies
The morphometric parameters of the Thai population were compared with previous studies as shown in Table 4, which studied morphometric data of the Thai distal femur. The results of the comparison showed that the majority of the morphometric parameters except for the femoral aspect ratio (ML/AP, ML/MAP, and ML/LAP) were higher than those of the previous study. Those differences may arise as a result of different definitions of the measured parameters and measurement techniques. However, some parameters of previous studies have not been reported in comparison with the current study.
Table 4.
Comparison of the morphometric parameters with Thai studies in mean ± SD (mm).
3.4. Comparison of the Morphometric Parameters with Other Nationalities
Table 5 showed the comparison result of morphometric parameters with other ethnic groups, including the Korean and Caucasian populations. The morphometric parameters consisting of ML, MAP, and LAP were significantly smaller than the Caucasian population but similar to the Korean population. However, there were also significant differences in the Korean population between the parameters MCW, LCW, WIN, and DIN. In addition, the ML/AP ratio of the Thai distal femur was lower than that of the Caucasian population.
Table 5.
Comparison of the morphometric parameters with other nationalities in mean ± SD (mm).
3.5. Correlation and Linear Regression Analysis of Morphometric Parameters
The correlation coefficient and linear regression analysis of morphometric parameters in male and female groups are presented in Table 6 and Table 7, respectively. The highest correlation coefficient (r) value was observed for the relationship between AP and MAP, which are 0.958 and 0.931 in the male and female groups, respectively. Other high correlation coefficients in which r > 0.7 included ML and TEA, MAP and LAP, AP and LAP, ML/MAP and ML/AP, MAP and TEA, LAP and TEA, ML/LAP and ML/AP, and LPC vs. MPC for the male group, while for the female group, they included LPC and MPC, LAP and TEA, and LPC vs. LAP. For the rest of the pairs of parameters, they had a definite relationship in which the r value falls in the range of 0.3 to 0.7. In addition, high and strong correlation pairs of parameters were presented as linear regression equations.
Table 6.
The equations for the high pairwise correlation of Thai male morphometric parameters.
Table 7.
The equations for the high pairwise correlation of Thai female morphometric parameters.
3.6. Application of Morphometric Data to Analyze the Knee Prostheses for Thais
In addition, this study provides essential data for improving the design of knee prostheses for the Thai population—for instance, to improve the design of the femoral component for total knee arthroplasty based on the morphometry of the Thai knee. Significant factors leading to the effectiveness of complete knee arthroplasty were sufficient for the prosthetic selection, precise sizing, and proper placement of the components. Two variables used to select the femoral implant sizing are anteroposterior width (AP) and mediolateral length (ML). Thus, a mismatch analysis between these variables and the femoral component sizing that is commonly used in Thailand including the DEPUY (Sigma), ZIMMER (Nexgen), SMITH & NEPHEW (Genesis II), and STRYKER (Scorpio) [] was evaluated. The correlation between anatomical and implant dimension was analyzed and is shown in Figure 4. The result was that the size distribution of four implants at the same anteroposterior width appears to undersize the mediolateral length of Thais. To improve the design of knee prostheses for Thais, the size of the femoral component, particularly mediolateral length, should be improved.
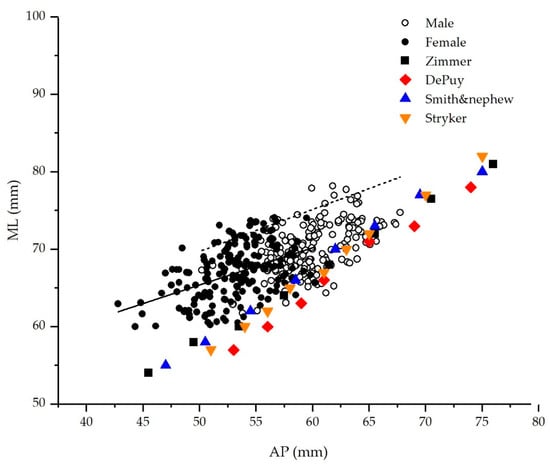
Figure 4.
Correlation analysis between the femoral mediolateral length (ML) and the medial anteroposterior width (AP) among four implants.
To determine the optimum size of the femoral component, the correlation between the femoral mediolateral length (ML) and the medial anteroposterior width (AP) shown in Figure 4 was classified as femoral component size for Thais by K-means clustering analysis. In this study, the number of clusters was evaluated with variations from three to 12 clusters, finding the cluster centroid for each group. To determine the optimal numbers of the cluster, the total within-cluster sum of squares (WSS) for each cluster was computed. Then, the WSS according to the number of clusters were plotted as curves, as shown in Figure 5. The location of a bend in the graph is generally regarded as an indicator of the number of appropriate clusters []. When the bending point was not visible obviously, the largest distance of a line that is perpendicular from a straight line drawn between the point of the first cluster and the last cluster indicated the optimal number of clusters.
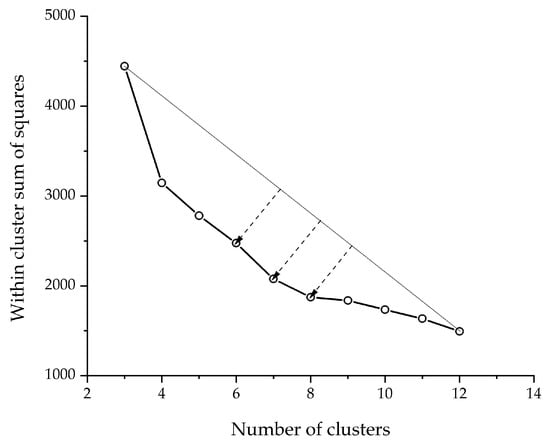
Figure 5.
The relation between the total within-cluster sum of squares and number of clusters.
In Figure 5, the range of optimal clusters for sizing the Thais’ femoral component was six to eight clusters. The centroid data for each group shown in Table 8 represented the dimension of mediolateral length (ML) and the medial anteroposterior width (AP), which suggests for sizing of the femoral component for the Thai population.
Table 8.
Sizing of the distal femoral component for the Thai population.
4. Discussion
The morphometric parameters of the distal femur are used for various applications, such as sex determination, racial and ethnic identification, and fundamental data for the design of knee prostheses [,,,]. From a systematic review, the author found that the favorite method for the morphometric study is a measurement based on 3D models reconstructed by computer software in which most of the parameters were measured, including AP, ML, and ML/AP. Therefore, this study evaluated the morphometric of Thai distal femur based on 3D models reconstructed from computed tomographic (CT) data by reverse engineering techniques, which gave more accuracy and convenience than other methods [,].
The reliability of measurement was examined by the intra-class correlation coefficient analysis. It was found that the intra- and inter-rater reliability coefficients were quite high (in a range of 0.84 to 0.98), indicating the excellent reproducibility of the measurement []. The result found that the intra-rater reliability for most parameters was higher than the inter-rater reliability. The main reason for the lower inter-rater correlation coefficients seems to be due to inconsistent identification of anatomical landmarks. However, the inter-rater reliability can be enhanced by clarifying the anatomical landmark descriptions, additional practice, and increased experience of the observers.
The results of this study found that the important morphometric parameters, such as the average of mediolateral length (ML), medial anteroposterior width (MAP), and lateral anteroposterior width (LAP) of all subjects were as follows: 71.00 ± 5.30 mm, 60.57 ± 4.83 mm, and 63.10 ± 4.48 mm, respectively. According to the comparison between genders, most of the male distal femur parameters were significantly higher than the female distal femur parameters. These results were consistent with the previous studies [,]. However, there was no significant gender difference in the ML/AP and ML/MAP ratio. This means that the ML/AP and ML/MAP ratio for Thais are approximately 1.26 and 1.18, respectively. It was confirmed that the mediolateral length was greater than the anteroposterior width.
According to the comparison of Thai morphometric studies, the distal femur morphometric data of this study were quite different from those previously reported [,]. In particular, the value of the femoral aspect ratio as shown in Table 4 was different. This may be a result of different definitions of measured parameters and measurement methods—for example, the measurement of distal femurs based on MRI images by simulation of distal femoral bone cut or intraoperative anthropometric measurement of resected Thai distal femora using a sterile Vernier caliper [,], whereas this study used measurements based on a 3D model without resection of the distal femur. In addition, the results also showed that the Thai distal femur was different from those of other nationalities. Several studies reported that the morphology of the Caucasian distal femur was larger than that of the Asian distal femur, which is consistent with previous studies [,,]. Most of the morphometric parameters in this study found that there was a significant difference compared to the Korean population [,]. The distal femur of Thais was slightly different from that of the Chinese and Japanese populations as well [,,,]. However, they were smaller than those of the Indian femur [].
To analyze the relationship between each parameter, the morphometric data of distal femur in males and females were investigated using linear regression and correlation analysis. This is due to the statistically significant difference in morphology between males and females. Correlation pairs of morphometric parameters found differences between males and females. The high correlation coefficients occurred in medial anteroposterior width (MAP) and anteroposterior width (AP) both males and females. The correlation between each pairwise is a strong linear relationship if it falls within the range between 0.7 and 1.0. The equation that is a clear linear relation can be used to estimate the dependent variable precisely. For example, a linear regression equation is used to predict morphometric parameters in forensic anthropology.
Using morphological data for the design of prosthetic knee, such as mediolateral (ML) and anteroposterior (AP), the size of Thais distal femur was compared to the commercially used prosthesis in Thailand. The results showed that there was a mismatch between the distal femur of Thai and the knee prosthesis, which is consistent with other studies [,,,]. In the prosthesis design of a distal femoral component, at least six sizes should be available to cover Thais’ anatomy, especially the ML and AP values. Femoral component overhang leads to soft tissue impingement, which causes painful irritation of the knee tendons and ligaments, while the undersized femoral component leads to increased blood loss through exposed cancellous bone, and the fit between a femoral component and a femur was also considered [].
The limitation of this study is that the volunteers in this study were healthy and between 20 and 50 years old. The morphometric data from the normal femur may differ from the osteoarthritic femur. Moreover, most volunteers who participated in this study lived in Nakhon Ratchasima province. The difference in residence of volunteers may also affect the average values of morphometric data in the Thai population. Morphometric data of the distal femur were measured based on 3D models, the accuracy of which depends on the threshold value and mesh quality. In addition, measurements based on 3D models of the femur did not include cartilage thickness.
5. Conclusions
The morphometric study on the Thai distal femur was performed based on a 3D reconstructed model from computed tomography data and the reverse engineering technique. The results showed that the morphometric parameters of Thai males were significantly different and higher than those of Thai females, except for the ratio of ML/AP and ML/MAP. By comparison, there was a significant difference between the size of the distal femur of Thai and Asian subjects, and it was also smaller than those measured from Caucasian subjects. Most of these parameters are highly correlated. There was also a mismatch between the distal femur in Thais and the commonly used prosthetic knee. The proper design of distal femoral prosthesis should include at least six sizes of ML and AP to cover the anatomy of the Thai population. These data are also useful in that they provide fundamental data for the design of knee prostheses suitable for Thais and the prediction of morphometric parameters in forensic anthropology.
Author Contributions
Conceptualization, S.R.; methodology, C.P. and S.R.; software, C.P. and S.R.; validation, C.P. and S.R.; formal analysis, C.P. and S.R.; investigation, C.P. and S.R.; resources, S.R.; data curation, C.P. and S.R.; writing—original draft preparation, C.P. and S.R.; writing—review and editing, C.P. and S.R.; supervision, S.R. and B.S. All authors have read and agreed to the published version of the manuscript.
Funding
This research was funded by Health System Research Institute, grant number 60-020.
Institutional Review Board Statement
The study was conducted according to the guidelines of the Declaration of Helsinki, and approved by the Institutional Review Board (or Ethics Committee) of Suranaree University (EC59-60, 29 December 2016).
Informed Consent Statement
Informed consent was obtained from all subjects involved in the study.
Data Availability Statement
Data sharing not applicable.
Acknowledgments
The authors gratefully thank Suranaree University of Technology, Suranaree University of Technology Hospital, and Institute of engineering. The Authors could not have been done without the cooperation of the working team of physicians, radiographers, and engineers.
Conflicts of Interest
The authors declare no conflict of interest.
References
- Kim, D.-I.; Kwak, D.-S.; Han, S.-H. Sex determination using discriminant analysis of the medial and lateral condyles of the femur in Koreans. Forensic Sci. Int. 2013, 233, 121–125. [Google Scholar] [CrossRef] [PubMed]
- Cho, H.-J.; Kwak, D.-S.; Kim, I.-B. Morphometric Evaluation of Korean Femurs by Geometric Computation: Comparisons of the Sex and the Population. BioMed Res. Int. 2015, 2015, 1–9. [Google Scholar] [CrossRef] [PubMed]
- Mahaisavariya, B.; Sitthiseripratip, K.; Tongdee, T.; Bohez, E.L.J.; Vander Sloten, J.; Oris, P. Morphological study of the proximal femur: A new method of geometrical assessment using 3-dimensional reverse engineering. Med. Eng. Phys. 2002, 24, 617–622. [Google Scholar] [CrossRef]
- Chantarapanich, N.; Rojanasthien, S.; Chernchujit, B.; Mahaisavariya, B.; Karunratanakul, K.; Chalermkarnnon, P.; Glunrawd, C.; Sitthiseripratip, K. 3D CAD/reverse engineering technique for assessment of Thai morphology: Proximal femur and acetabulum. J. Orthop. Sci. 2017, 22, 703–709. [Google Scholar] [CrossRef] [PubMed]
- Urabe, K.; Mahoney, O.; Mabuchi, K.; Itoman, M. Morphologic Differences of the Distal Femur between Caucasian and Japanese Women. J. Orthop. Surg. 2008, 16, 312–315. [Google Scholar] [CrossRef]
- Cheng, F.; Ji, X.; Lai, Y.; Feng, J.; Zheng, W.; Sun, Y.; Fu, Y.; Li, Y. Three dimensional morphometry of the knee to design the total knee arthroplasty for Chinese population. Knee 2009, 16, 341–347. [Google Scholar] [CrossRef]
- Yue, B.; Varadarajan, K.M.; Ai, S.; Tang, T.; Rubash, H.E.; Li, G. Gender differences in the knees of Chinese population. Knee Surg. Sports Traumatol. Arthrosc. 2011, 19, 80–88. [Google Scholar] [CrossRef]
- Chin, P.; Tey, T.; Ibrahim, M.; Chia, S.-L.; Yeo, S.; Lo, N. Intraoperative Morphometric Study of Gender Differences in Asian Femurs. J. Arthroplast. 2011, 26, 984–988. [Google Scholar] [CrossRef]
- Terzidis, I.; Totlis, T.; Papathanasiou, E.; Sideridis, A.; Vlasis, K.; Natsis, K. Gender and Side-to-Side Differences of Femoral Condyles Morphology: Osteometric Data from 360 Caucasian Dried Femori. Anat. Res. Int. 2012, 2012, 679658. [Google Scholar] [CrossRef]
- Zalawadia, A.; Parekh, D.; Patel, S. Morphometric study of lower end of dry femur in gujarat region and its clinical implication. Int. J. Anat. Res. 2017, 5, 4595–4599. [Google Scholar] [CrossRef][Green Version]
- Loures, F.; Carrara, R.; Góes, R.; Albuquerque, R.; Barreto, J.; Kinder, A.; Gameiro, V.; Marchiori, E. Anthropometric study of the knee in patients with osteoarthritis: Intraoperative measurement versus magnetic resonance imaging. Radiol. Bras. 2017, 50, 170–175. [Google Scholar] [CrossRef] [PubMed][Green Version]
- Rooppakhun, S.; Chantarapanich, N.; Sitthiseripratip, K. Advanced medical imaging and reverse engineering technologies in craniometric study. In Forensic Medicine—From Old Problems to New Challenges; In Tech: Rijeka, Croatia, 2011; pp. 307–326. [Google Scholar]
- Pinskerova, V.; Nemec, K.; Landor, I. Gender differences in the morphology of the trochlea and the distal femur. Knee Surg. Sports Traumatol. Arthrosc. 2014, 22, 2342–2349. [Google Scholar] [CrossRef] [PubMed]
- Cavaignac, E.; Ancelin, D.; Reina, N.; Telmon, N.; Chiron, P. Geometric morphometric analysis reveals ethnic group related differences in the distal femur. Rev. Chir. Orthop. Traumatol. 2016, 102, S181. [Google Scholar] [CrossRef]
- Fan, L.; Xu, T.; Li, X.; Zan, P.; Li, G. Morphologic features of the distal femur and tibia plateau in Southeastern Chinese population: A cross-sectional study. Medicine 2017, 96, e8524. [Google Scholar] [CrossRef]
- Bansal, V.; Mishra, A.; Verma, T.; Maini, D.; Karkhur, Y.; Maini, L. Anthropometric assessment of tibial resection surface morphology in total knee arthroplasty for tibial component design in Indian population. J. Arthrosc. Jt. Surg. 2018, 5, 24–28. [Google Scholar] [CrossRef]
- Rooppakhun, S.; Surasith, P.; Vatanapatimakul, N.; Kaewprom, Y.; Sitthiseripratip, K. Craniometric study of Thai skull based on three-dimensional computed tomography (CT) data. J. Med. Assoc. Thail. 2010, 93, 90–98. [Google Scholar]
- Magetsari, R.; Suyitno, D.; Dharmastiti, R.; Salim, U.; Hidayat, L.; Yudiman, T.; Lanodiyu, Z.; Dewo, P. Three Dimensional Morphometry of Distal Femur to Design Knee Prosthesis for Indonesian Population. Int. J. Morphol. 2015, 33, 1255–1260. [Google Scholar] [CrossRef]
- Hafez, M.A.; Sheikhedrees, S.M.; Saweeres, E.S.B. Anthropometry of Arabian Arthritic Knees: Comparison to Other Ethnic Groups and Implant Dimensions. J. Arthroplast. 2016, 31, 1109–1116. [Google Scholar] [CrossRef]
- Ma, Q.-L.; Lipman, J.D.; Cheng, C.-K.; Wang, X.-N.; Zhang, Y.-Y.; You, B. A Comparison between Chinese and Caucasian 3-Dimensional Bony Morphometry in Presimulated and Postsimulated Osteotomy for Total Knee Arthroplasty. J. Arthroplast. 2017, 32, 2878–2886. [Google Scholar] [CrossRef]
- Magarelli, N.; Milano, G.; Baudi, P.; Santagada, D.; Righi, P.; Spina, V.; Leone, A.; Amelia, R.; Fabbriciani, C.; Bonomo, L. Comparison between 2D and 3D computed tomography evaluation of glenoid bone defect in unilateral anterior gleno-humeral instability. La Radiol. Med. 2011, 117, 102–111. [Google Scholar] [CrossRef]
- Fuller, C.B.; Farnsworth, C.L.; Bomar, J.D.; Jeffords, M.E.; Murphy, J.S.; Edmonds, E.W.; Pennock, A.T.; Wenger, D.R.; Upasani, V.V. Femoral version: Comparison among advanced imaging methods. J. Orthop. Res. 2018, 36, 1536–1542. [Google Scholar] [CrossRef] [PubMed]
- Chaichankul, C.; Tanavalee, A.; Itiravivong, P. Anthropometric measurements of knee joints in Thai population: Correlation to the sizing of current knee prostheses. Knee 2011, 18, 5–10. [Google Scholar] [CrossRef] [PubMed]
- Wanitcharoenporn, W.; Chareancholvanich, K.; Pornrattanamaneewong, C. Correlation of intraoperative anthropometric measurement of resected Thai distal femurs between unisex and gender-specific implants. J. Med. Assoc. Thail. 2014, 97, 1308–1313. [Google Scholar]
- Koh, Y.-G.; Jung, K.-H.; Hong, H.-T.; Kim, K.-M.; Kang, K.-T. Optimal Design of Patient-Specific Total Knee Arthroplasty for Improvement in Wear Performance. J. Clin. Med. 2019, 8, 2023. [Google Scholar] [CrossRef] [PubMed]
- Kaviti, A. A Review of Use FEM Techniques in Modeling of Human Knee Joint. JBBBE 2016, 28, 14–25. [Google Scholar]
- Relf, H.I.; Barberio, C.G.; Espino, D.M. A Finite Element Model for Trigger Finger. Prosthesis 2020, 2, 168–184. [Google Scholar] [CrossRef]
- Paracchini, L.; Barbieri, C.; Redaelli, M.; di Croce, D.; Vincenzi, C.; Guarnieri, R. Finite Element Analysis of a New Dental Implant Design Optimized for the Desirable Stress Distribution in the Surrounding Bone Region. Prosthesis 2020, 2, 225–236. [Google Scholar] [CrossRef]
- Marutho, D.; Handaka, S.H.; Wijaya, E.; Muljono. The Determination of Cluster Number at k-Mean Using Elbow Method and Purity Evaluation on Headline News. In Proceedings of the 2018 International Seminar on Application for Technology of Information and Communication, Semarang, Indonesia, 21–22 September 2018; pp. 533–538. [Google Scholar]
- Shah, D.; Ghyar, R.; Ravi, B.; Shetty, V. 3D Morphological Study of the Indian Arthritic Knee: Comparison with Other Ethnic Groups and Conformity of Current TKA Implant. Open J. Rheumatol. Autoimmune Dis. 2013, 3, 263–269. [Google Scholar] [CrossRef]
- Zou, D.; Deusinger, R.H.; Smith, K.; Koleini, M. Reliability and gender differences of internal skeletal dimensions using volumetric quantitative computed tomography. In Proceedings of the 2011 IEEE/ICME International Conference on Complex Medical Engineering, Harbin, China, 22–25 May 2011; pp. 148–153. [Google Scholar]
- Huang, A.-B.; Luo, X.; Song, C.-H.; Zhang, J.-Y.; Yang, Y.-Q.; Yu, J.-K. Comprehensive assessment of patellar morphology using computed tomography-based three-dimensional computer models. Knee 2015, 22, 475–480. [Google Scholar] [CrossRef]
- Mahfouz, M.; Abdel Fatah, E.E.; Bowers, L.S.; Scuderi, G. Three-dimensional morphology of the knee reveals ethnic differences. Clin. Orthop. Relat. Res. 2012, 470, 172–185. [Google Scholar] [CrossRef]
- Tangruthaiwanich, A. Factors Affecting the Orthopedic Surgeons Buying Decision of Prosthesis in Bangkok Metropolitan. Master’s Thesis, Chiang Mai University, Chiang Mai, Thailand, 2017. [Google Scholar]
- Tripathi, S.; Bhardwaj, A.; Poovammal, E. Approaches to Clustering in Customer Segmentation. Int. J. Eng. Technol. 2018, 7, 802–807. [Google Scholar] [CrossRef]
- Koo, T.K.; Li, M.Y. A Guideline of Selecting and Reporting Intraclass Correlation Coefficients for Reliability Research. J. Chiropr. Med. 2016, 15, 155–163. [Google Scholar] [CrossRef] [PubMed]
- Griffin, F.M.; Math, K.; Scuderi, G.R.; Insall, J.N.; Poilvache, P.L. Anatomy of the epicondyles of the distal femur: MRI analysis of normal knees. J. Arthroplast. 2000, 15, 354–359. [Google Scholar] [CrossRef]
- Yue, B.; Varadarajan, K.; Ai, S.; Tang, T.; Rubash, H.; Li, G. Differences of Knee Anthropometry between Chinese and White Men and Women. J. Arthroplast. 2010, 26, 124–130. [Google Scholar] [CrossRef] [PubMed]
- Sharma, G.; Liu, D.; Malhotra, R.; Zhou, Y.X.; Akagi, M.; Kim, T.K. Availability of Additional Mediolateral Implant Option During Total Knee Arthroplasty Improves Femoral Component Fit Across Ethnicities: Results of a Multicenter Study. JB JS Open Access 2017, 2, e0014. [Google Scholar] [CrossRef]
Publisher’s Note: MDPI stays neutral with regard to jurisdictional claims in published maps and institutional affiliations. |
© 2021 by the authors. Licensee MDPI, Basel, Switzerland. This article is an open access article distributed under the terms and conditions of the Creative Commons Attribution (CC BY) license (http://creativecommons.org/licenses/by/4.0/).