Abstract
A method to maximize backlight dimming of liquid crystal displays (LCDs) based on human visual system are proposed to minimize power consumption of display panels. Based on images, the proposed method optimizes global, local, and red, green, blue (RGB) backlight dimming by enhancing dimming about 12% on average for various images while maintaining tolerable degradation of perceived image qualities in pixel saturation areas. The method considers and utilizes the brightness sensitivity and contrast response functions of human visual system using the mean luminance and the contrast of an image, which are mathematically modelled to allow optimization for display panels and application areas. A simulator that can calculate various dimming cases with the evaluations of numerical and perceptual image qualities as well as power consumption amount is introduced. With pattern and real photo images, the degree of power savings and the preservation of image quality of the proposed method are verified to outperform conventional approaches with high scores of the mean opinion score (MOS) and the structural similarity index measure (SSIM) over 0.97 while saving more than 10% of power dissipation.
1. Introduction
Liquid crystal displays (LCDs) still have the highest market share in the large display markets and are also used in quantum dot light emitting diode (QLED) TVs, which are widely used in the latest products such as 8K ultra high definition (UHD) TVs. LCDs consist of LCD panels and backlight units; LCD panels control the transmittance of light to display images and backlight units provide light sources. If the backlight is always fully on regardless of the image, power is wasted, and light leakage occurs because the liquid crystal panel does not completely block the light from the backlight units. Light leakage adversely affects the quality of the image such as contrast.
QLED has the LED backlight coated with quantum dot film, and the backlight is used as it is [1,2]. In addition, local dimming can be used for each panel area by dividing hundreds of full array LED backlights [3,4,5]. Modern displays can use the edge-lit method to reduce display panel thickness, but the basic principle of the backlight mechanism is the same.
Backlight dimming reduces the brightness of the backlight appropriately to reduce power consumption and light leakage and improves contrast. To prevent the image from darkening due to backlight dimming, the transmittance of the panel is adjusted, which is called backlight dimming compensation [6].
Panel transmittance is controlled through the pixel value, which cannot be above 255, so backlight dimming compensation has its own limit; in the case of excessive dimming, even though power consumption is reduced, brightness is not fully compensated, and image quality degrades due to pixel saturation. These problems need to be solved.
As an existing backlight dimming method, there is prior work of using maximum pixel value [7]. This method uses the brightest pixel value of the image as the backlight brightness, so there is no deterioration in image quality, but the backlight becomes brighter than necessary because it is greatly affected by a small number of bright pixels or noise irrespective of image characteristics. In addition, in the case of a backlight that is not properly dimmed, as described before, problems such as contrast degradation due to light leakage and excessive power consumption may occur.
Among popular backlight dimming methods using histograms: one uses the weighted average of the histogram [8,9] and the other is based on the pixel count [10,11]. The methods of using the weighted average of the histogram have a disadvantage for images with many dark areas; bright areas become dark resulting poor image quality. There is also prior work on histogram-based methods to enhance medical images. A novel framework for magnetic resonance (MR) image segmentation based on genetic algorithms (MedGA) [12] and a particle swarm optimized texture based histogram equalization (PSOTHE) technique [13] were proposed.
The methods using pixel count determine the backlight brightness as the gray level, which is found so that the number of pixels from the dark pixel in histogram equals to a constant ratio of the total number of pixels. This method does not degrade the image quality significantly. However, since only a certain ratio of pixels is considered regardless of the image characteristics, it is inefficient in reducing power consumption and improving contrast.
Although there are differences in all dimming methods, pixel saturation occurs in pixels of bright areas by excessive dimming. Therefore, while maximizing dimming, it is necessary to minimize the degradation of image quality due to the saturation. Through analysis of various image characteristics, the degree of image quality degradation needs to be more reflected. If a dimming method is optimized accordingly, the image quality can be preserved while minimizing power consumption by maximizing dimming.
Most of the existing dimming studies have used an optimization method based on a mathematical image processing or image quality measures, such as using an algorithm based on the pixel value of an image [14] or using Gaussian distributions [15]. However, since image quality is judged by human eyes, it is necessary to consider the human visual system (HVS) additionally. There was a study that considered part of HVS [16], but there are various theories on the human perceived image qualities. Therefore, methodologies are presented to maximize dimming based on brightness sensitivity and contrast response function, which is the most important in perceived brightness and contrast respectively, which are important in image quality degradation by the excessive dimming.
In addition to global dimming, local dimming is efficient and red, green, and blue (RGB) dimming is the most efficient. Local dimming is good for power efficiency because dimming can be applied to each divided image block of the backlight, and it is advantageous in improving the contrast by reducing light leakage [9]. RGB dimming can improve contrast and further minimize power consumption by separately adjusting R, G, and B backlight, but has a disadvantage of increasing implementation cost. In this paper, methods that can optimize global, local and RGB dimming altogether are proposed.
The proposed methods optimize the excessive dimming by maximizing dimming without significant perceived image quality deterioration with a certain amount of tolerance according to the application areas. The methods analyze the degree of perception of image quality deterioration caused by pixel saturation due to the compensation for excessive dimming based on image characteristics and HVS for reduction of power consumption.
The structure of this paper is as follows. In Section 2, the motivations of dimming optimization through image characteristic and human perception are described. Section 2 also describes how HVS theories can be applied to the excessive dimming. In Section 3, the proposed methods of maximizing dimming are presented. In Section 4, the performance is verified based on actual images using the dimming simulator, and Section 5 concludes the paper.
2. Background
2.1. Backlight Dimming Based on Image Analysis
Backlight dimming minimizes the backlight brightness and compensates image quality loss by correcting the brightness of the image through pixel compensation, which proportionally increases the pixel value, that is, the transmittance of the panel. Together with the maximum pixel value dimming (max. pixel dimming), Figure 1 shows the output pixel mapping function of the input pixel before and after excessive dimming. The dotted lines in the horizontal direction from the top mean the brightness of the backlight before and after the max. pixel dimming and before and after excessive dimming, which excessively increases the amount of dimming. The pairs of left and right dotted lines in the vertical direction represent the change of max. pixel on the axis of the input pixel due to the excessive dimming before and after the dimming compensation, respectively.
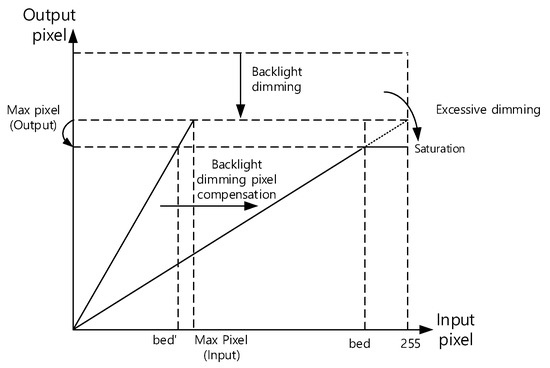
Figure 1.
Pixel compensation for excessive dimming.
As shown in Figure 1, performing the max. pixel dimming compensation by changing the output pixel mapping function of the input pixel from the steeper line on the left to the gentle line on the right can improve the contrast and reduce the power consumption without deteriorating the image quality due to dimming. In the case of excessive dimming, even if the pixel value is adjusted through the compensation, distortion happens in the area corresponding to the values from bed’ to max. pixel, which correspond to values from bed to 255 after compensation in the input pixel values as described in Figure 1. This is called pixel saturation and deteriorates the image quality. In this paper, the pixel value bed’ before the compensation will be optimized to maximize the excessive dimming while minimizing perceived image quality loss.
Considering that HVS is involved in the image quality perception, if the image quality degradation caused by the pixel saturation is unrecognizable or is below an acceptable level depending on the application fields, power consumption reduction through excessive dimming can be maximized without adversely affecting the perceived image quality.
Figure 2 shows the effect of pixel saturation on image quality, which occurs under the existing compensation. Figure 2a is the case of max. pixel dimming, where no degradation has occurred in the image quality. Figure 2b shows a 95% pixel count method, resulting in a slight saturation, but there is not much difference from Figure 2a. Figure 2c shows the histogram weighted average method [10], which illustrates that excessive dimming is the largest, minimizing power consumption. For Figure 2c peak signal-to-noise ratio (PSNR) is 24, which is a significant reduction in numerical quality; however, there is little perceptual degradation in image quality. To measure perceptual image quality, a commonly used perceptual image quality metric, mean opinion score (MOS), is used. Twelve people of eight males and four females measured MOS scores to give ratings from 1 to 10, where high scores represent better image quality.
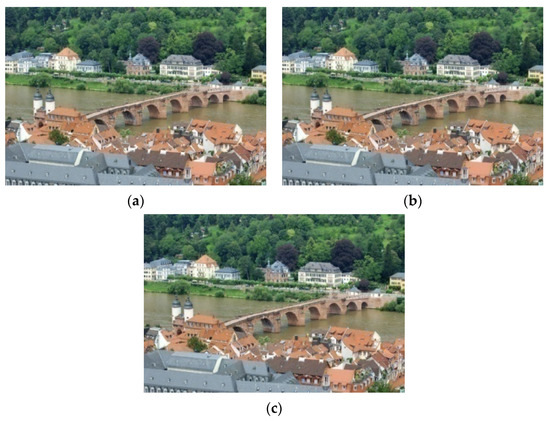
Figure 2.
Comparisons of image quality with conventional dimming. (a) Max pixel (PSNR: 51); (b) 95% pixel count (PSNR: 42); (c) Histogram weighted average (PSNR: 24).
Existing numerical approaches for degradation measure, such as PSNRs, do not exactly correspond to the degradation that humans perceive. Therefore, it is meaningful to maximize the excessive dimming through an approach that considers human cognitive characteristics. This reduces power consumption further and preserves perceived image quality, which will be discussed in Section 4.3.
2.2. Brightness Sensitivity
In this paper, a method for maximizing the amount of excessive dimming is proposed in consideration of the perceived change in brightness by human eyes of the saturated pixels. For this, we consider the brightness sensitivity [17] of the corresponding pixel range. As the number of pixels falling into the saturated pixel area increases, the degree of deterioration of image quality increases. Therefore, it is necessary to consider how many pixels exist in the area. The degree of deterioration due to excessive dimming is determined by both the pixel population ratio and the brightness sensitivity slope from the max. pixel to the excessive dimming point (bed’) among all pixels.
Figure 3a shows the two cases (A, B) of pixel saturation by excessive dimming. Figure 3b indicates a nonlinear brightness sensitivity curve that corresponds to the relationship between luminance and brightness perceived by humans [18].
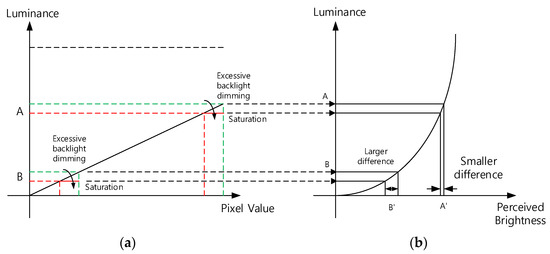
Figure 3.
Brightness sensitivity. (a) Pixel value vs. Luminance; (b) Brightness sensitivity.
The change in luminance by pixel saturation in Figure 3a can be multiplied by the brightness sensitivity of Figure 3b to obtain the brightness degradation perceived by humans. The A and B ranges shown in Figure 3a,b are based on the same luminance difference at the input pixel level, but as shown in Figure 3b, the perceived brightness difference of the range B’ is larger than that of the range A’. This means that the perceived brightness difference caused by the same amount of luminance difference by excessive dimming can vary according to the luminance or pixel value range. Considering brightness sensitivity in the excessive dimming, more excessive dimming is possible if the brightness perception becomes less sensitive as pixel values saturate. This phenomenon will be mathematically formulated later in the paper.
In addition, according to light adaptation [19], as a person adapts to a specific brightness, the difference in brightness becomes more sensitive than in other brightness levels. Therefore, it is necessary to consider that the degree of deterioration of image quality due to excessive dimming is subject to change according to several factors.
2.3. Contrast Response Function
Figure 4a indicates the degree of the perceived contrast difference degraded by the excessive dimming for each contrast level. The contrast response function indicates that if the contrast is large or small, the sensitivity to contrast change decreases [20]. Figure 4a shows the degree of deterioration of the perceived contrast if contrast decreases by the same amount, where the same amount of dimming occurs at regions A, B, and C. As shown in the figure, regions A, B, and C correspond to high, middle, and low contrast region, respectively.
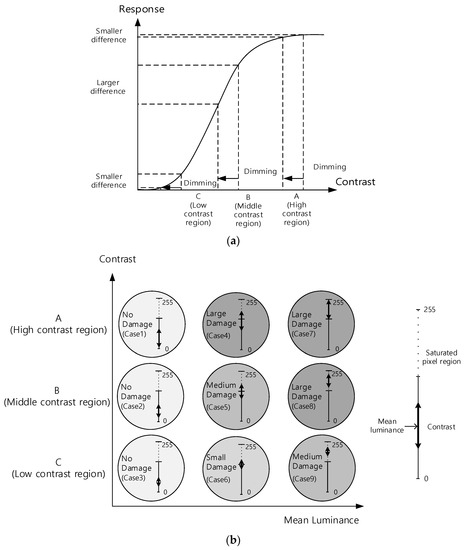
Figure 4.
Contrast response function. (a) Contrast response function; (b) Nine cases of mean luminance and contrast combinations.
In high contrast region, the image quality degradation caused by pixel saturation from excessive dimming is not perceived much. Further, there is little difference in the actual perceived contrast change during excessive dimming if the contrast is low. To mathematically model such a phenomenon, the contrast of the input image where pixel saturation occurs is evaluated using the image slope. The image slope is computed by dividing the difference in pixel values by the distance between the pixels.
To calculate the characteristics of each image block, the average image slope of the corresponding block is used. In addition, since human eyes are sensitive to the difference in adjacent pixel values, the image slope is based on a pixel block with a moderately small size, which is homogeneous, too. The level of the homogeneity of an image block can be enhanced with smaller image block sizes, which may allow more excessive dimming. The block sizes of 8 × 8 or 16 × 16 that are commonly used as the image compression standards can be used for the homogeneity. However, it increases the number of blocks for large display panels and processing complexities (power dissipation) for portable display panels. Therefore, larger block sizes are usually used for the dimming calculations.
The adjacent pixels used in the image slope calculation may be included in all, partially, or not included at all in the saturated pixel area, depending on whether the target pixel is in the bright area, the middle area, or the dark area, respectively. The degree of pixel saturation depends on where it belongs to among the above three cases, and the degree of image quality deterioration due to the contrast decrease varies correspondingly to determine which case it belongs to, mean luminance was used, which is the average of pixel values in a pixel block to maximize the excessive dimming using the brightness sensitivity.
However, if the contrast is very high and there is no homogeneity with several peaks in histogram, even though the mean luminance is in the middle, a significant portion of the pixels may exist in the region with high luminance, so that the image quality deterioration due to excessive dimming may be significant. This case is safely classified as significant image quality deterioration in Figure 4b.
Figure 4b represents the degree of image quality deterioration caused by pixel saturation coming from excessive dimming with respect to mean luminance and contrast. There are nine circles, which represent each nine different areas that are defined by three different levels of pixel value mean luminance and contrast each. The darker a circle is, the greater the loss of image quality becomes due to the excessive dimming.
For each of the above nine cases of Figure 4b, the pixel value range that is not in the saturated region so not affected by excessive dimming is indicated as thin lines, whereas the pixel value range that is saturated by excessive dimming is indicated as the dotted line and the pixel value range that exists by the mean luminance is indicated as the bold line.
Cases 1, 2, and 3 have low mean luminance, so there is no image quality damage because the pixel value range do not belong to the saturated pixel region by excessive dimming, so regardless of contrast, the quality is maintained and classified as no damage.
As explained before, cases 4, 5, and 6 represent the case of the mean luminance being middle and the degree of contrast degradation depends on the degree of homogeneity within the block or on the extent to which pixel value is concentrated in the mean luminance, or not in the saturated pixel region.
Cases 7, 8, and 9 indicate the cases where the mean luminance is high, and the pixel values are mostly included in the saturated pixel region. Since the saturated pixel generated by excessive dimming occurs in areas with high pixel value, the impact is severe for cases 7, 8 and 9, where pixels are in this area, or case 4, where the saturation may occur by more than a certain percentage since a certain portion of pixels exist in the high pixel value by high contrast. Since the pixels of the saturation region will all have the same pixel value by excessive dimming, contrast will become zero.
According to the contrast response function of Figure 4a, cases 3, 6, and 9 have a small impact even after excessive dimming. When contrast is low, there is less contrast damage perceived since the contrast before excessive dimming is low. Since contrast becomes zero by excessive dimming, so it is necessary to consider a certain degree of contrast damage for cases 1, 4, and 7 having large contrast prior to excessive dimming resulting in a larger contrast difference with a larger image quality degradation.
However, in case 1, all pixels are in an area where there is no saturation, so there is no degradation of image quality. The greater the number of pixels that belong to the saturation region, the greater the degree of degradation caused by dimming, so it is also necessary to consider how many pixels exist in the region.
It is necessary to consider that the higher the contrast before the pixel saturation, the greater the image quality deterioration, in addition to the sensitivity of the contrast change by the contrast response function and the contrast change by the population of saturated pixels due to excessive dimming. In the next section, these are encapsulated by mathematical equations. Then, Section 4 illustrates the influence of image content on the image distortion by showing results of excessive dimming on pattern and real photo images. A performance comparison is also given in Section 4.3 later with numerical metrics.
3. Methods
3.1. Optimal Excessive Dimming
In this section, by mathematically analyzing and modeling the image quality deterioration that a human perceives caused by excessive dimming, we seek a way to maximize it while preserving the perceived image quality according to all the theories described before.
The image quality degradation caused by pixel saturation due to the excessive dimming described in the previous section depends on how many the input image pixels exist in the saturation region, brightness sensitivity considering the perceived brightness change shown in Figure 3, the contrast response function for humans’ sensitivity of perceived contrast change caused by contrast magnitude difference shown in Figure 4a, and the contrast deterioration due to excessive dimming at pixel saturation region shown in Figure 4b.
Let an arbitrary pixel value in an image to be , to be the relative frequency of pixels with pixel value in the entire image, the lowest input pixel value saturated by excessive dimming to be bed’ as shown in Figure 1 and the maximum pixel value to be Max. Then, the ratio of the number of saturated pixels to the total number of pixels, , can be expressed as (1).
For excessive dimming, since additional dimming is performed beyond the Max, cannot be equal to zero.
As described in Figure 3, the lower the brightness sensitivity is, the lower the image quality degradation caused by pixel saturation is. For any pixel value , if we let humans’ perceived brightness to be , the slope on the brightness sensitivity slope (BSS) shown in Figure 3b is modeled as humans’ perceived brightness difference by input pixel luminance value after saturation:
Therefore, the smaller the BSS of (2) is, the smaller the change in brightness that people perceive by excessive dimming, making it less to recognize the saturation of brightness due to pixel saturation, enabling more excessive dimming.
As described before, as the number of pixels in the saturation region increases, the number of pixels affected by the dimming increases, and allowable excessive dimming decreases. To take this into account, the Saturated Pixel Brightness Sensitivity Slope (SPBSS) is defined as (3). In addition, fitting parameters a, b, and c are added to enable optimization according to the characteristics of the display panel and application fields. In other words, the larger the from bed’ to Max pixel, the larger the SPBSS of (3), and the image quality deterioration due to dimming is severe, limiting the excessive dimming.
where a, b, and c are constants.
Excessive dimming causes a decrease in contrast by pixel saturation. According to the contrast response function described in Figure 4a, within the range of contrast that a general image can usually have, the smaller the contrast is, the less noticeable the change of the contrast becomes, allowing more excessive dimming. The larger the number of pixels within saturation region, the less excessive dimming possible. Since the contrast between pixels increases as the difference in pixel brightness per unit distance increases, the difference between the pixel values of two arbitrary pixels, and , and the distance between them are used. That is, for any two pixels and in the pixel saturation area, the average of the pixel value difference divided by the pixel distance , which is the physical distance between pixels, is called the image slope, and the contrast can be evaluated from this. That is, the contrast response function can be evaluated with these values.
The larger the contrast and the larger the pixel population from bed’ to Max pixel, the narrower the range of excessive dimming becomes, so the degree of allowed excessive dimming can be expressed in terms of the saturated pixel slope (SPSoverall) defined in (4), which identifies the location of the contrast in the contrast response curve. As in (3), constants d, e, and f are added to enable optimization according to the contrast response function by tests.
where CR is the contrast response function, d, e and f are constants, and and are arbitrary pixels satisfying .
As described in cases 4–9 of Figure 4b, since the contrast of the saturated pixel region becomes completely zero, the smaller the original pixel contrast, the less the change of the contrast is perceived enabling more excessive dimming. In addition to the SPSoverall of (4), since the contrast decreases completely to zero by excessive dimming from the original value of the input image pixel contrast, the amount of perceived decrease of the input image contrast based on the contrast response function is determined by the image slope (SPSsat) of the saturated pixel area. Based on these, the degree of possible excessive dimming can be expressed as (5). Constants g, h, and i are also added to optimize (5).
where and g, h and i are constants, and are arbitrary pixels satisfying . As described in Figure 4b, since the contrast change is negligible if the saturation is less than a certain amount, we consider only the cases where the saturation is greater than or equal to a certain amount satmin, which is set by noticeable image quality degradation that is tolerable considering power budget.
Optimal excessive global dimming (Opt.EGD) can be modeled as (6) by considering (3)–(5) in accordance with power budget and the tolerance of image quality degradation based on different application areas.
where α, β, γ, and δ are constants.
The weights of each of (3)–(5) can be adjusted with the constants α, β, γ, and δ. While reducing bed’, evaluating the image quality by the structural similarity index measure (SSIM) or by eye test, the values of α, β, γ, and δ can be determined enabling excessive dimming as much as possible, which is optimized for display panel characteristics and applications using several sample images.
For local dimming, each block can be regarded as an independent image frame. Therefore, to optimize the amount of dimming according to the characteristics of the local block image by obtaining the SPBSS and SPSsat, SPSoverall of the local block, optimal excessive local dimming (Opt.ELD) can be modeled as (7) based on (6).
In local dimming, each local block has a homogeneous property compared to the entire image as the size of each local block decreases. Considering these characteristics, the excessive local dimming can be maximized even further. Blocking artifacts can occur if the dimming values differ significantly compared to the surrounding blocks, so it is necessary to consider this as in the other existing local dimming algorithms [10,21].
If backlights can be implemented independently for red, green, and blue, each RGB LED can be individually dimmed to maximize the excessive dimming [22], which is better for optimizing power and image quality. For R, G, and B excessive dimming, pixel saturation and image quality degradation can be optimized by extending the previously described (6) and (7) for global and local dimming, to R, G, and B backlights separately.
In other words, the values of global and local RGB dimming, which are denoted as Opt.RGBEGD and Opt.RGBELD, can be optimized by considering global and local SPBSS, SPSsat, and SPSoverall for R, G, and B.
where c is R, G, or B. After each factor in (1) to (5) is computed for an image block, (6)–(8) can be computed with a look up table (LUT), which is based on the similarity of HVS, to minimize the processing time. The parameters in (6)–(8) show the weight of each factor given in (3)–(5), which will be investigated further in Section 4.1 with pattern images. Basically, the weights of SPSoverall and SPSsat are higher than that of SPBSS with the same in (1).
Irrespective of global and local or RGB dimming, if the value of a bed’ is higher than the max. pixel or max. RGB value, it is necessary to dim down to the lower of the two values as shown by (9), because excessive dimming can be performed to the value of the max pixel or RGB always without image quality degradation.
3.2. Backlight Unit Simulator and Image Quality Measure
3.2.1. Backlight Unit Simulator
Through a backlight simulator written using MATLAB, optimal excessive dimming values proposed in this paper and the effect on image quality were evaluated according to image characteristics. It is designed for accurate calculation of backlight profile and for comparative evaluation of existing and proposed backlight dimming algorithms.
A display image is calculated by overlaying the brightness of the backlight and the transmittance of the LCD. As shown in Figure 5, the simulator consists of an image characteristic analysis unit that calculates (3)–(5) and characterizes a given image block, the backlight filter part that calculates the backlight luminance based on the excessive dimming given by (6) to (9), and the dimming compensation unit that calculates the pixel compensation and controls the transmittance of the LCD panel as in Figure 1.
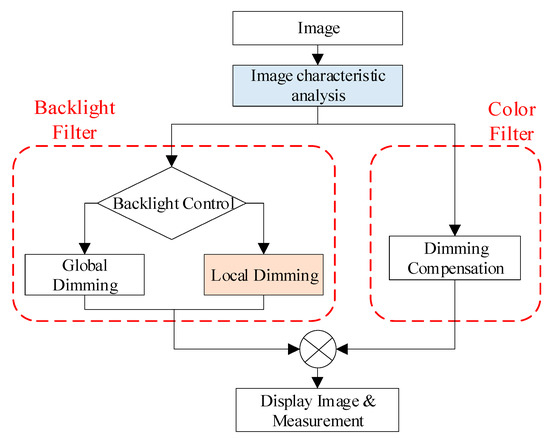
Figure 5.
Simulator structure.
3.2.2. Image Quality Measure
Using the backlight simulator, image quality degradation caused by excessive dimming and compensation was evaluated by using measures such as PSNR, distance measure, and SSIM, which are widely used in backlight dimming [7,8]. PSNR can measure a change in the brightness and the color of the pixels compared to the original image due to the excessive dimming. The distortion measure focuses on brightness to measure the degree of distortion of the image by comparing the standard deviation or the mean of brightness. Because human eyes are sensitive to changes in brightness, it is important to check for changes in picture quality through distortion measure. SSIM is a measure of image quality similar to that of humans’ eye, which separates the object through changes in color or brightness and compares the shape of the object to measure the similarity between the two images.
Since this paper optimizes dimming amount based on HVS, it is necessary to consider perceived image quality in addition to existing mathematical quality measures. The change in the brightness of the pixel due to the excessive dimming results in a lower value of PSNR. The proposed dimming method, which allows a little saturation to occur by considering cases where there is a large difference in brightness between pixels, may produce generally poor PSNR values. In the case of distortion measure, contrary to PSNR, the value is not significantly lower even if the brightness decreases, but it may not be accurate because it may still have high scores even if the image quality is not good. To compensate for this, since the mean opinion score (MOS) evaluated by humans shows relatively high correlation with SSIM, SSIM is suitable for human perceived quality assessment in objective quality measures [23].
4. Simulation Results
4.1. SPBSS, SPSsat, SPSoverall, and Their Effects
This section identifies differences in influence in the process of maximizing dimming while preserving image quality, for each of SPBSS for image brightness recognition, SPSsat for contrast of saturated region, and SPSoverall for contrast value of an image block, as shown in (6). For this purpose, the simulation results are described based on the result images that vary in only one characteristic among SPBSS, SPSsat, and SPSoverall with fixed values for the others.
First, to make only the SPBSS in (6) vary, Figure 6a varied the pixel value in a bright image, whereas Figure 6c did so in a dark image. To make the SPSoverall and SPSsat fixed, the pixel values vary within the same contrast range. To make SPBSS vary, which depends on brightness, the same excessive dimming was applied to the two images, and the results are shown in Figure 6b,d, respectively.
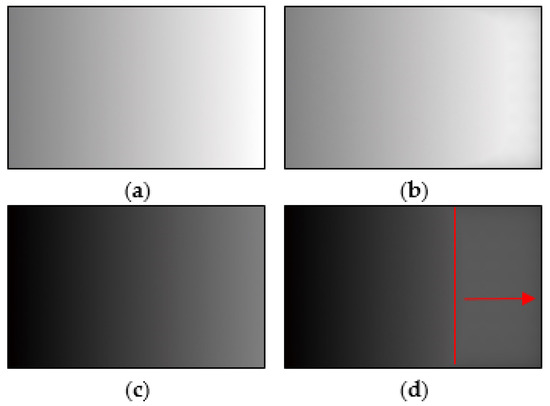
Figure 6.
High Saturated Pixel Brightness Sensitivity Slope (SPBSS) vs. Low SPBSS. (a) High SPBSS original image; (b) High SPBSS image after excessive dimming; (c) Low SPBSS original image; (d) Low SPBSS image after excessive dimming.
As shown in the region indicated by the arrow, the pixel saturation by excessive dimming for low SPBSS shown in Figure 6d is larger than the saturation for high SPBSS shown in Figure 6b. Therefore, the smaller the brightness sensitivity slope value is, the less image quality deterioration humans perceive due to the excessive dimming.
In Figure 7, only the SPSoverall of was varied. To make the SPSoverall vary, Figure 7a increased the image slope (contrast) by repeating the dark and bright regions with relatively small pixel distance or interval, whereas Figure 7c repeated with a large distance to reduce the image slope (contrast). To make SPBSS fixed, the maximum brightness and the number of pixels that are saturated during excessive dimming were held to be equal. The results of each of these two images with the same excessive dimming are shown in Figure 7b,d.
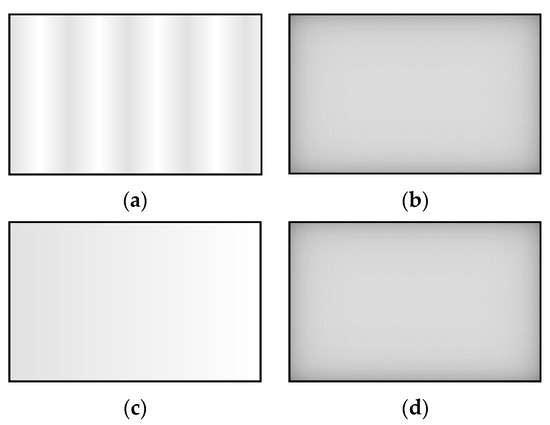
Figure 7.
High saturated pixel slope (SPS)overall vs. Low SPSoverall. (a) High SPSoverall original image; (b) High SPSoverall image after excessive dimming; (c) Low SPSoverall original image; (d) Low SPSoverall image after excessive dimming.
For Figure 7c, where SPSoverall is low, Figure 7d after the excessive dimming has zero contrast. This is because the contrast value is small before the dimming so perceived contrast deterioration is small and the contrast value is so low that the contrast difference cannot be noticed easily as well. However, it can be confirmed that Figure 7a with high SPSoverall shows easily noticeable difference compared to Figure 7b, the image after the excessive dimming. Thus, as shown in (4), the smaller the SPSoverall, the more excessive dimming is possible.
Figure 8 only varied SPSsat in (6). In order to make the SPSsat different with different image slope of the saturated pixel region, an excessive dimming was performed to ensure that saturation occurs starting from the same pixel value for the two images, where the two images have different image slopes within the same saturated pixel region. Figure 8a has two different pixel values alternatively with a smaller interval for high image slope value, while pixel values of Figure 8c varied slowly with a larger interval between the same two pixel-values of Figure 8a for low image slope. The results of the same excessive dimming applied to each image are shown in Figure 8b,d, respectively.
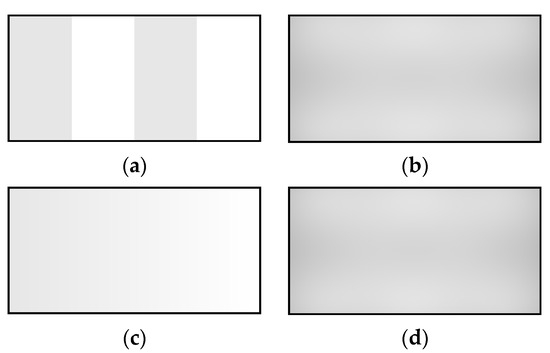
Figure 8.
High SPSsat vs. Low SPSsat. (a) High SPSsat original image; (b) High SPSsat image after excessive dimming; (c) Low SPSsat original image; (d) Low SPSsat image after excessive dimming.
Since both images belong to the saturated pixel region, the dimming results look the same. When compared with the original image, Figure 8b shows a large difference from Figure 8a because no apparent pattern is visible. On the contrary, the difference between Figure 8d,c is relatively small. Therefore, the higher the SPSsat, the greater the difference in image quality due to excessive dimming, so the lower the SPSsat, the more excessive dimming possible, as shown in (5).
It can be confirmed that SPBSS, SPSoverall, and SPSsat can affect optimal excessive dimming, and compared to SPSoverall and SPSsat shown in Figure 7 and Figure 8, image quality change was found to be relatively robust to SPBSS. Therefore, for the same , the parameter of SPBSS is smaller than those of SPSoverall and SPSsat in (6)–(8).
4.2. Real Image Samples
Figure 9 shows the results of presented excessive dimming methodologies using SPBSS, SPSoverall, and SPSsat of (6) with actual images rather than regularly patterned ones presented before. As discussed previously, smaller image block sizes can improve the excessive dimming with increased amount of hardware and processing time. In Figure 9a, the image frame is divided into six large inhomogeneous blocks that can be easily implemented with low display manufacturing cost. The excessive dimming is applied by twenty pixels for each block to show the validities of (6)–(8) with real photo images.
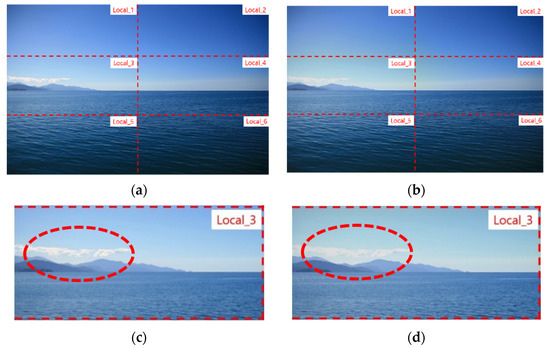
Figure 9.
Real image simulation results. (a) Original image; (b) Excessively dimmed image; (c) Original “Local_3” block; (d) Excessively dimmed “Local_3” block.
Comparing the original image of Figure 9a to the result of Figure 9b, after applying the local excessive dimming, we can see several characteristics of our proposed method. The block Local_1 has a high SPBSS, and low SPSoverall and SPSsat, and excessive dimming occurs at bright areas, where contrast of the block and of saturated pixel region is low. Therefore, all the three characteristics show that more excessive dimming is possible. The excessive dimming results for the block Local_1 does not show much difference between the original block and the excessively dimmed one as expected. Local_2 is the case where SPBSS is lower than Local_1. Even though SPBSS is lower than Local_1, there is still no difference between the original and excessively dimmed one.
Figure 9c is an enlarged image of the Local_3 block. Local_3, which has high SPBSS, may enable more excessive dimming, but with high SPSoverall and SPSsat less excessive dimming is allowed. Although with the same excessive dimming as other blocks, there is noticeable image quality deterioration in the block, especially in the cloud area as shown in a dotted ellipse in Figure 9d.
When evaluating each local block of the original image based on mathematical quality measures, PSNR, it shows that a difference of 29.15 dB for Local_1, 35.37 dB for Local_2, and 31.69 dB for Local_3, indicating the difference between PSNR and the perceived image quality degradation by humans. In the case of SSIM, which is known to show a high correlation to the quality perceived by humans, the differences are 0.9814, 0.9970, and 0.9742 for the blocks Local_1, Local_2, and Local_3, respectively, so SSIM is similar to the results perceived by human eyes as expected.
4.3. Image Results
Figure 10 shows power consumption (the left side axis) and various image quality measures (the right-side axis) of applying the several excessive local dimming including the presented one with various dimming ratios. In Figure 10, the power consumption is shown as a bar graph with the left vertical axis being the measure, where the quantity is shown as normalized based on the 100% brightness of the backlight. The figure shows that the image quality measures do not differ significantly compared to the reduction in power consumption.
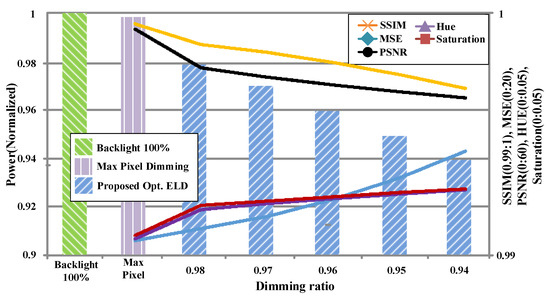
Figure 10.
Image quality and power consumption with respect to dimming ratio.
Experimental results using actual images are presented in Figure 11 and Figure 12 to confirm whether the proposed method of excessive dimming can be applied to both local dimming and RGB dimming.
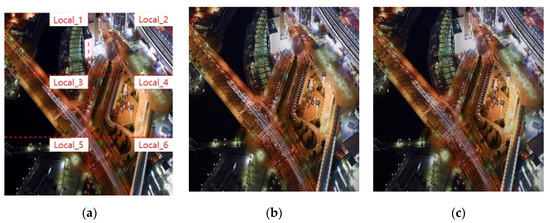
Figure 11.
Local dimming simulation result. (a) Original image; (b) Conventional local dimming; (c) Proposed local dimming.
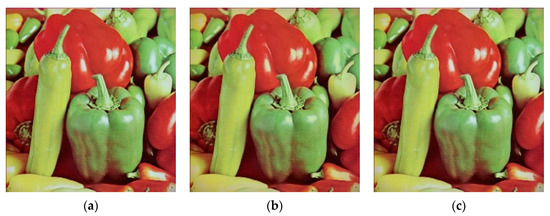
Figure 12.
Red, green, blue (RGB) liquid crystal displays (LED) dimming simulation result. (a) Original image; (b) Conventional RGB dimming; (c) Proposed RGB dimming.
For the case of excessive local dimming shown in Figure 11 with the block size of 512 × 256, compared to the existing method of relatively strict pixel count 95% dimming, the excessive dimming method proposed in this paper shows that an average of 11.9% more excessive dimming is possible, which reduces power consumption more. The eye test results show that the image quality degradation is unnoticeable. To measure perceptual image quality, twelve people of eight males and four females measured MOS scores to give ratings from 1 to 10, where high scores represent better image quality. For the blocks of Local 1, Local 3, and Local 5 with large SPBSS due to their darkness, relatively more dimming is possible, while the blocks Local 2, Local 4, and Local 6 have large SPSoverall and SPSsat, so there is a limit on the allowable excessive dimming. Local 3 and Local 5 have relatively few pixels in the pixel saturation region, so more dimming is possible. Furthermore, SSIM values of Figure 11b,c are 0.9591 and 0.9550, respectively, so we can see that the difference is small. Even though more optimal excessive dimming can be realized with smaller block sizes, a large block size of 512 × 256 is used for the feasibility of commercial applications by sacrificing the homogeneity.
Figure 12 shows the results of the excessive RGB global dimming, which separately adjusts the RGB values of backlight. Figure 12a–c respectively represent the original image, image with the existing dimming method, and the result of applying more excessive dimming of the proposed method. Figure 12c shows no significant noticeable degradation in the image quality.
The blue component of Figure 12 has high max. pixel value, but most blue pixel has low values, so SPBSS is high and SPSoverall and SPSsat are low. Only a small amount of excessive dimming is possible if max. pixel method is applied, but according to the proposed method, there is very little difference in human perception even if more dimming is performed. This can be confirmed by Figure 12c. SSIM values are 0.9970 and 0.9794 for Figure 12b,c, respectively, indicating a small difference between the two.
Based on human visual system for brightness and contrast, the excessive dimming can be further maximized without deteriorating the image qualities perceived by humans instead of being measured by conventional image quality indexes that are calculated numerically. Using more than hundreds of images in LIVE [23,24,25] and True color Kodak Images databases [26], the amount of excessive dimming can be optimized by more than 10% on the average. The performance can be further optimized with the tunable parameters for various application areas considering power requirements, hardware amounts, processing complexities, required image quality, display panel sizes, and cost. The results can also be applied to video applications, a series of image frames, if the image frame quality degradation can be well controlled.
5. Conclusions
Methods were proposed to maximize backlight dimming and minimize power consumption while preserving human perceived image quality. According to the characteristics of the saturated region that has significant effect on the image quality, more dimming is possible while preserving human perceived image quality. Excessive dimming is possible for the following cases with less power consumption. If pixel values of the saturated region are high, brightness sensitivity slope drops as given by the brightness sensitivity curve. If contrast is low, perceived contrast difference is low as given by the contrast response function. If the slope of the pixel values belonging to the saturation area is low, contrast difference can be less noticeable enabling more excessive dimming.
Through mathematical modeling, the proposed method can be applied to real display panels considering panel characteristics. By using patterned and natural images, we confirmed the proposed method works well through SSIM and MOS which are suitable for perceived image quality evaluations. The proposed method can be easily extended to the cases of local dimming and RGB dimming, where dimming is applied to each local block and to each R, G, and B backlights individually. Future work includes the excessive dimming with more human visual system theories, the investigation of additional image characteristics and various application areas such as digital signage.
Author Contributions
Conceptualization, J.Y.; methodology, J.Y.; software, J.Y. and S.Y.; validation, J.Y., S.Y., and H.S.; formal analysis, J.Y. and H.S.; investigation, J.Y.; resources, S.Y.; data curation, S.Y.; writing—original draft preparation, S.Y., J.Y., and H.S.; writing—review and editing, J.Y. and H.S.; visualization, J.Y.; supervision, J.Y. and H.S.; project administration, J.Y.; funding acquisition, H.S. All authors have read and agreed to the published version of the manuscript.
Funding
This research was funded by Korea Electric Power Corporation, grant number R18XA02, and by the National Research Foundation of Korea (NRF) funded by the Ministry of Science, ICT & Future Planning, grant number 2017R1C1B5015901. The APC was funded by Korea Electric Power Corporation.
Conflicts of Interest
The authors declare no conflict of interest.
References
- Coe-Sullivan, S.; Liu, W.; Allen, P.; Steckel, J.S. Quantum Dots for LED Downconversion in Display Applications. ECS J. Solid State Sci. Technol. 2013, 2, R3026–R3030. [Google Scholar] [CrossRef]
- Luo, Z.; Chen, Y.; Wu, S.T. Wide color gamut LCD with a quantum dot backlight. Opt. Express 2013, 21, 26269–26284. [Google Scholar] [CrossRef] [PubMed]
- Duan, L.; Debattista, K.; Lei, Z.; Chalmers, A. Subjective and Objective Evaluation of Local Dimming Algorithms for HDR Images. IEEE Access 2020, 8, 51692–51702. [Google Scholar] [CrossRef]
- Tan, G.; Huang, Y.; Li, M.C.; Lee, S.L.; Wu, S.T. High dynamic range liquid crystal displays with a mini-LED backlight. Opt. Express 2018, 26, 16572–16584. [Google Scholar] [CrossRef] [PubMed]
- Huang, Y.; Hsiang, E.L.; Deng, M.Y.; Wu, S.T. Mini-LED, Micro-LED and OLED displays: Present status and future perspectives. Light Sci. Appl. 2020, 9, 1–16. [Google Scholar] [CrossRef] [PubMed]
- Nam, H. A color compensation algorithm to avoid color distortion in active dimming liquid crystal displays. IEEE Trans. Consum. Electron. 2010, 56, 2569–2576. [Google Scholar] [CrossRef]
- Kerofsky, L.; Daly, S. Brightness preservation for LCD backlight dimming. J. Soc. Inf. Disp. 2006, 14, 1111–1118. [Google Scholar] [CrossRef]
- Swinkels, S.; Muijs, R.; Langendijk, E.; Vossen, F. Effect of Backlight Segmentation on Perceived Image Quality for HDR Displays; IDW: San Diego, CA, USA, 2006. [Google Scholar]
- Chen, H.; Sung, J.; Ha, T.; Park, Y. Locally pixel-compensated backlight dimming for improving static contrast on LED backlit LCDs. In SID Symposium Digest of Technical Papers; Blackwell Publishing Ltd.: Oxford, UK, 2007; pp. 1339–1342. [Google Scholar]
- Chen, H.; Sung, J.; Ha, T.; Park, Y.; Hong, C. Backlight local dimming algorithm for high contrast LCD-TV. In Proceedings of the ASID, New Delhi, India, 8–12 October 2006; pp. 168–171. [Google Scholar]
- Lai, C.; Tsai, C. Backlight power reduction and image contrast enhancement using adaptive dimming for global backlight applications. IEEE Trans. Consum. Electron. 2008, 54, 669–674. [Google Scholar] [CrossRef]
- Rundo, L.; Tangherloni, A.; Cazzaniga, P.; Nobile, M.S.; Russo, G.; Gilardi, M.C.; Vitabile, S.; Mauri, G.; Besozzi, D.; Militello, C. A novel framework for MR image segmentation and quantification by using MedGA. Comput. Methods Programs Biomed. 2019, 176, 159–172. [Google Scholar] [CrossRef] [PubMed]
- Acharya, U.K.; Kumar, S. Particle swarm optimized texture based histogram equalization (PSOTHE) for MRI brain image enhancement. Optik 2020, 224, 165760. [Google Scholar] [CrossRef]
- Chen, S.; Tsai, H.; Lin, T. Block-based content adaptive backlight controller VLSI design for local dimming LCDs. In Proceedings of the 23rd International Workshop on Active-Matrix Flatpanel Displays and Devices (AM-FPD), Kyoto, Japan, 6–8 July 2016; pp. 63–66. [Google Scholar]
- Chen, S. A novel adaptive local dimming backlight control chip design based on Gaussian distribution for liquid crystal displays. J. Disp. Technol. 2016, 12, 1494–1505. [Google Scholar] [CrossRef]
- Mantel, C.; Bech, S.; Korhonen, J.; Forchhammer, S.; Pedersen, J.M. Modeling the subjective quality of highly contrasted videos displayed on LCD with local backlight dimming. IEEE Trans. Image Proc. 2014, 24, 573–582. [Google Scholar] [CrossRef] [PubMed]
- Purves, D.; Cabeza, R.; Huettel, S.A.; LaBar, K.S.; Platt, M.L.; Woldorff, M.G.; Brannon, E.M. Cognitive Neuroscience; Sinauer Associates, Inc.: Sunderland, UK, 2008. [Google Scholar]
- Kim, Y.; Luo, M.R.; Rhodes, P.; Cheung, V.; Westland, S.; Lee, S.; Kwak, Y.; Park, D.; Kim, C. Measurement of perceived brightness and contrast sensitivity for outdoor condition. In Proceedings of the 26th Session of the Commission International de L’Eclairage, Beijing, China, 5–11 July 2007; pp. 1–4. [Google Scholar]
- Davson, H. Physiology of the Eye, 5th ed.; Macmillan International Higher Education: London, UK, 1990. [Google Scholar]
- Albrecht, D.G.; Hamilton, D.B. Striate cortex of monkey and cat: Contrast response function. J. Neurophysiol. 1982, 48, 217–237. [Google Scholar] [CrossRef] [PubMed]
- Cha, S.; Choi, T.; Lee, H.; Sull, S. An optimized backlight local dimming algorithm for edge-lit LED backlight LCDs. J. Disp. Technol. 2015, 11, 378–385. [Google Scholar] [CrossRef]
- Okumura, J.; Kozawa, Y.; Umeda, Y.; Habuchi, H. Hybrid PWM/DPAM dimming control for digital color shift keying using RGB-LED array. IEEE J. Sel. Areas Commun. 2017, 36, 45–52. [Google Scholar] [CrossRef]
- Wang, Z.; Bovik, A.C.; Sheikh, H.R.; Simoncelli, E.P. Image quality assessment: From error visibility to structural similarity. IEEE Trans. Image Process. 2004, 13, 600–612. [Google Scholar] [CrossRef] [PubMed]
- Sheikh, H.R.; Sabir, M.F.; Bovik, A.C. A statistical evaluation of recent full reference image quality assessment algorithms. IEEE Trans. Image Process. 2006, 15, 3440–3451. [Google Scholar] [CrossRef] [PubMed]
- Sheikh, H.R.; Wang, Z.; Cormack, L.; Bovik, A.C. LIVE Image Quality Assessment Database Release 2. Available online: http://live.ece.utexas.edu/research/quality (accessed on 7 January 2021).
- Kodak Lossless True Color Image Suite. Available online: http://r0k.us/graphics/kodak/ (accessed on 7 January 2021).
Publisher’s Note: MDPI stays neutral with regard to jurisdictional claims in published maps and institutional affiliations. |
© 2021 by the authors. Licensee MDPI, Basel, Switzerland. This article is an open access article distributed under the terms and conditions of the Creative Commons Attribution (CC BY) license (http://creativecommons.org/licenses/by/4.0/).