Abstract
Rolling contact fatigue (RCF) is a common cause of rail failure due to repeated stresses at the wheel-rail contact. This phenomenon is a real problem that greatly affects the safety of train operation. Preventive and corrective maintenance tasks have a big impact on the Life Cycle Cost (LCC) of railway assets, and therefore cutting-edge strategies based on predictive functionalities are needed to reduce it. A methodology based on physical models is proposed to predict the degradation of railway tracks due to RCF. This work merges a crack initiation and a crack growth model along with a fully nonlinear multibody model. From a multibody assessment of the vehicle-track interaction, an energy dissipation method is used to identify points where cracks are expected to appear. At these points, crack propagation is calculated considering the contact conditions as a function of crack depth. The proposed methodology has been validated with field measurements, conducted using Eddy Currents provided by the infrastructure manager Network Rail. Validation results show that RCF behavior can be predicted for track sections with different characteristics without the necessity of previous on-track measurements.
1. Introduction
In recent years, the use of railway vehicles has increased in aid of the environment and human mobility with less energy consumption than conventional transportation methods. However, this change has led to faster degradation of the infrastructure. The current liberalization processes of the sector, along with the aging of assets that form the infrastructure, evidence the need to pay attention to the health status of the system.
Trains traveling on the track system is the main responsible for infrastructure degradation. This depends on the design characteristics of vehicles and tracks, as well as on the running operation conditions and the degradation state of the track system and vehicle components. Track geometry and rail profiles change over time modifying track quality [1] and therefore the dynamic behavior of vehicles.
To ensure good dynamic behavior, which is very important for the comfort conditions of passengers and has a great impact on their safety, some knowledge about the state of the track system is required to fulfill the required standards. Both manual and vehicle-borne measurement systems are used to measure the track geometry and rail profiles and infrastructure maintenance procedures are carried out to recover track characteristics. Infrastructure managers must ensure that the track system always meets the required specifications to guarantee the safe passage of trains and service availability. Procedures that infrastructure managers apply can be preventive, corrective, or predictive but they are generally based on their own experience. Since all these procedures have a high impact on the LCC [2] of the overall railway system, newer approaches are needed to improve the maintenance operations carried out.
On the one hand, periodic measurements could potentially allow data analysis to facilitate predictive maintenance procedures. However, these techniques require a wide amount of historical measurements, which are not usually available. Vehicle components degradation is considered a continuum phenomenon within a line but the infrastructure, which is subjected to different kinds of vehicles and running conditions on the same point, needs a different approach. Local studies and measurements campaigns are necessary for infrastructure. On the other hand, vehicle dynamics simulations are a widely used tool for assessing train-track interaction. Generally, they are used to ensure that train design will comply with the applicable standards before on-track tests [3]. The use of track measurements as inputs for physical models are a good option to predict degradation when there is a lack of historical data or the running conditions can be changed in the future.
Railway operation imposes cyclic loading on wheel-rail contact, leading to a mechanism of degradation known as RCF [4]. At each load cycle, plastic deformation develops in an incremental manner. Therefore, the surface of the rails is subjected to the apparition of cracks. Furthermore, these multiple surface-breaking cracks are associated with vehicle dynamic behavior, which imposes multiaxial stresses [5,6]. RCF cracks can develop on either high or low rails at curves and, in some cases, at straight track sections. Infrastructure maintenance managers categorize these cracks according to their severity, which is determined from their surface length [7]. The combination of severity and track category determines the nature and frequency of future inspections, from monthly to yearly. For the assessment of cracks with severe surface lengths, ultrasonic measurements are required to determine their depth. These measurements determine if future corrective maintenance actions such as grinding or rail replacement are needed.
Rail wear has a great influence on the study of cracks due to RCF and must be taken into consideration. The wear degradation mechanism modifies the profile of both wheels and rails, altering the dynamic behavior of vehicles, which can result in higher or lower stresses in the wheel-rail contact. Wear influences RCF as a competitive degradation mechanism [8] that decreases the crack propagation rate, even to the point that it might avoid crack initiation. Brouzoulis [9] studied the impact of wear on eliminating the cracks. This degradation mechanism is usually studied using Archard’s wear model [10,11]. The volume of material worn
is proportional to the sliding distance and normal force and inversely proportional to the material hardness . The Wear Coefficient represents the proportionality using contact pressure and sliding velocity. This parameter is determined through laboratory experiments [12,13].
Different approaches were developed to predict the onset and evolution of RCF cracks using physical models. The focus of some studies was on crack initiation, i.e., to predict if cracks will appear or not. One of them was presented by Burstow [14,15] to predict crack initiation. The model combines the effects of both wear and RCF degradation mechanisms through energy dissipation modeling in the wheel-rail contact. Other research employed the stress index (SI) along shakedown diagrams to predict RCF risk, like the work developed by Ekberg et al. [16]. Johnson [17] developed a widely used shakedown diagram to detect the chance of apparition of RCF based on von Mises yield criterion. The disadvantage of energy dissipation models is that they cannot predict the characteristics of expected cracks. Once cracking takes place, crack propagation models, as the one developed by Dirks et al. [18], could be used to predict both length and depth of the cracks. This empirical model needs measurements of previously existing cracks to calibrate two unknown material parameters. Nevertheless, existing fracture mechanics models might be used to calculate cracks size. Brouzoulis et al. [19] performed numerical simulations of crack growth in rails, without considering the influence of inelastic material behavior (Canadinc et al. [20]). Jun et al. [21] carried out the calculation of the minimum crack size for growth under rolling contact between wheel and rail, based on a previous work of Fletcher et al. [22]. Other works, such as the one developed by Markine et al. [23], deal with the track properties to combat RCF. A detailed study of stress intensity factors (SIF) allows considering the effects of the pressurization of lubricating fluid [24] and the angle of surface cracks [25]. Different methodologies assessing RCF were developed considering wear mechanism. The work by Six et al. [26] is a useful tool for vehicle design. Butini et al. [27] proposed a methodology based on twin-disk wear test and empirical calculations. Methodologies focusing on the railway track characteristics that can avoid previous on-track measurements are necessary for predictive maintenance and track design tasks.
The main motivation of this paper is the development of a methodology to predict the occurrence and evolution of rail RCF cracks. This methodology allows comparing different track configurations taking into account the running performance of the vehicles, assessed by Multibody Simulations (MBS). The developed methodology calculates when cracks will eventually start, using Burstows’s crack initiation model. Once the initiation of a given crack has been predicted, a minimum crack length is assigned and a crack growth model, chosen from the bibliography, is used to calculate crack evolution. Since track quality influences RCF risk [28,29], this methodology could also be used to predict other degradation mechanisms (such as ballast settlement [30] and rail wearing). The use of different degradation modules enhances the results provided by MBS, which allows with a more representative (and accurate) assessment of the degradation of the whole infrastructure system. This methodology has been validated with Eddy Current measurements in a real scenario showing very reasonable results.
This paper is organized as follows. The step-by-step explanation of the whole methodology is given in Section 2 with the help of a flowchart diagram. A real case study is presented in Section 3 to validate the capabilities of the proposed methodology. Finally, Section 4 provides some discussion and concluding remarks.
2. Description of the Methodology
This section proposes a methodology for the prediction of cracks due to RCF. This methodology is based on the integration of three types of models: Multibody modeling (Section 2.2), RCF crack initiation (Section 2.3) and RCF crack propagation (Section 2.4). The methodology is implemented in Matlab®, where calls to several processes of the MBS software and the mathematical computing of the physical models are carried out. The flowchart of Figure 1 shows the methodology process, divided into five main sections explained in the subsections below.
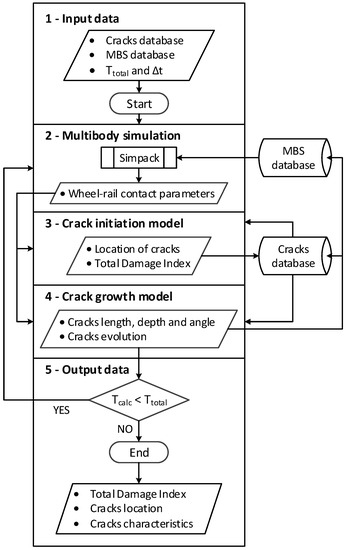
Figure 1.
Flowchart of the proposed methodology.
MBS software is generally used to analyze the comfort and safety of railway vehicles [3]. As the proposed methodology is based on physical degradation modeling, MBS software is a suitable tool to assess the vehicle-track interaction. MBS software generates a relevant set of wheel-to-rail contact characteristics that are useful for the application of fracture mechanics methods [31]. With MBS, the operation conditions of the trains can be modeled for specific characteristics of the track system, e.g., track quality and rail profiles. The outputs obtained from MBS will be the inputs for the other two models, i.e., crack initiation and growth respectively. The merging of these two models along with MBS is the key benefit brought by the proposed methodology, leveraging accurate predictions of the degradation of railway infrastructure assets.
2.1. Input Data
Before the execution of any prediction, some input data are required. If the prediction is not going to start for new or ground rails, the last measured or calculated RCF status of rails is taken as input. Regarding the MBS model, the required parameters to configure the databases for a vehicle, track and their interaction are also needed. These parameters are:
- Vehicle load condition.
- Profile and degradation level of rails.
- The number of vehicles per day and the number of bogies of a unit.
- Track quality, i.e., irregularities.
- Vehicle speed and traction/braking effort.
- Wheel/rail friction coefficient.
The characteristics of MBS models are associated with different files (irregularities, rail profiles, etc.), which can be updated at the start of the process from databases. If the prediction of cracks due to RCF runs in parallel with other degradation modules, such as track quality or rail wear, these files would be created during the calculation. These changes are necessary to consider the aging of the track system, which modifies the necessary inputs for crack models.
In addition, two time-variables have to be defined. These are the total prediction time and the prediction time-step that will be used in small increments to update the parameters for a new simulation. The value of should be defined carefully without compromising the computational cost as the results in could vary. If neither track irregularities nor rail profiles are updated, and can take the same value as MBS results will not change.
2.2. Multibody Simulations
As the process starts, an MBS is carried out with a fully non-linear model. The employed multibody package is Simpack [32], a widely used MBS software in railway dynamics simulations. It calculates all the contact patches between wheel and rail interaction. Therefore, the developed methodology allows calculating rail RCF at more than one point of each rail cross-section for the same circulation.
Different kinds of vehicles running on railway tracks can be modeled with MBS software. In addition to the vehicle, the track system is also modeled with MBS software. Measurement vehicles obtain wide information about the status of the track, providing a set of parameters/values related to each measured local point along the track, with linear step increments of a few centimeters. All these data can be divided into two main groups: those providing information about track geometry and those that correspond to track irregularities.
Once the vehicle and the track section are modeled, the wheel-rail contact becomes of great importance. To guarantee the accuracy of the results, the real wheel and rail profiles are introduced into the model, what is achieved by means of specific format files that contain the shape of these profiles using different coordinate points. To solve the contact problem in normal and tangential directions, based on the nonlinear Hertzian and Kalker’s theories respectively, FASTSIM algorithm [33] is used. This algorithm is the numerical implementation of Kalker’s simplified theory [34] which is commonly used for wheel-rail wear calculations [35]. For each wheel-rail contact, FASTSIM is evaluated with constant normal forces which nature is influenced by wheel and rail profiles. It is a key point that the selected MBS software is capable of taking into account all the possible contact patches between wheel and rail. Creepages are obtained as well; creepage is a non-dimensional parameter defined as the relative velocity between wheel and rail normalized by the rolling velocity.
The definition of the operation conditions is also important to obtain better results. The friction coefficient plays an important role in the vehicle-track interaction [36]. If either rail or flange lubrication is used, the multibody model can be adapted to change the friction value for different positions of the contact along the track. The way the speed is modeled is also important since the trains stop at stations and must adapt to speed commands and limits. The speed profile of the trains, along with the vertical track profile and load condition, impose a variable torque on the wheelsets for traction and braking operations.
When the simulation process has finished, some post-processing of the results (e.g., load and creepage values among others) is necessary. Then, the desired parameters are organized in a structured way, regarding the type of the result, wheelset, trackside, and/or the number of contact patches. These parameters will be the inputs for the rail RCF module (and eventually other degradation modules) and are left constant within each time step (). The capabilities of the described MBS has proven suitable to provide the inputs that are necessary for the different crack prediction models.
2.3. Crack Initiation Model
In this work, an energy dissipation method was selected to predict the eventual initiation of cracks. This kind of method is very useful and fast to calculate where the cracks are more probable to appear. However, this analysis does not provide any information about the characteristics of the predicted cracks. To take advantage of the ease and low time-consumption of the energy dissipation method, the crack characteristics will be predicted only when and where a crack is expected to appear. The crack growth model (see Section 2.4) implemented within the proposed methodology assesses the characteristics of the crack.
The Damage Index Function developed by Burstow [14] was selected as the energy dissipation method to apply. This validated assessment, on Network Rail tracks, makes use of the wear number , which is the product of shear forces (tangential to the head of rails) and creepages (). The wear number is directly linked to shear force coefficient μ. The Damage Index is calculated as
where are the coordinates of any point of the rail, and the damage is calculated considering m vehicles of n different types with wheelsets on each vehicle. The parameter describes a function with elliptic shape over the contact patch, with its maximum damage ( value) at the centroid.
The Damage Index Function (Figure 2) shows the influence of different ranges of on the crack initiation behaviour with four different zones:
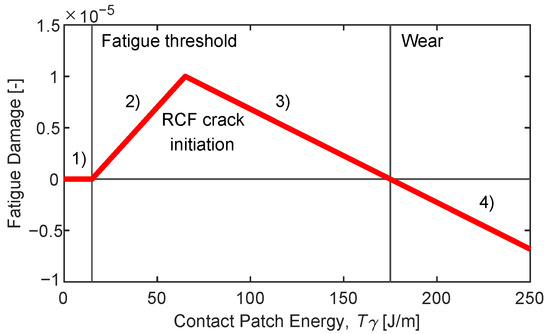
Figure 2.
Rail rolling contact fatigue damage function for normal grade rails. Values are taken from [14].
- For low values of , the rail surface is not affected because there is not enough work to cause incremental plastic straining of the material.
- Afterwards, the risk of RCF cracks starts to increase linearly with energy dissipation.
- Then this risk decreases when wear becomes the dominant form of surface damage.
- Finally, high values of wear number prevent crack initiation. This occurs because the effect of wear damage is higher than the propagation of a theoretical crack, so this crack will never appear.
According to the Damage Index Function, each contact patch on the rail accumulates some damage. Once the accumulated is higher than one, for an analysed point of the rail, a crack will appear in the rail; however, the damage function is not able to quantify the length, depth and even the propagation angle of these cracks. Thanks to the output parameters from MBS software, the wear number associated with the different contact patches of the calculation will be known, as well as the semi-axis of the contact ellipses. Therefore, the associated with each wheel-rail contact can be easily added to discretized sections (in both lateral and longitudinal directions) of the rails. If the total is higher than one in any of these sections, and a crack is expected to appear, the crack growth model will be applied (see Section 2.4).
Even if the model is generic for any point of the rail section, there are two variables of influence. One of them is that value is affected by steering forces in a curve negotiation, where the contact point moves to the inner face of the high rail. Furthermore, the material properties defined by Young’s modulus and Poisson’s ratio are being considered for the calculation of contact patches.
It is important to bear in mind that the damage index function is specific for the sites studied in Burstow’s report [14]. To assess different track sections, some modifications are required, as applied by [37,38,39]. This can be done recalculating the turning points of the damage function using the equation
where is the wear number value at the turning point or zero damage crossing point of the damage function, is the yield strength, is the ultimate tensile strength of the material, is the assumed contact area and is the creepage at the turning points.
After the MBS, the RCF module evaluates the apparition of cracks. The wear number allows calculating the of particular points of the rails. The RCF module calculates separately both left and right rails. The assessment is performed for each rail cross-section where the MBS gives an output, at each contact point taking part in the wheel-rail interaction. These cross-sections are divided into smaller sections of around 5 mm, setting up a matrix where the rows are the different positions along the track and the columns the divisions of the cross-sections. To store data in the different cells, an elliptical distribution is assumed for each parameter analyzed. This is done under the assumption that the spin effect is negligible regarding the slip-adhesion ratio at each side of the contact patch. Although the interpenetration between wheel and rail could lead to another contact distribution [40], the elliptic contact assumption is coherent with the calculation of contact patches by MBS. Avoiding the recalculation of the contact patch is essential to guarantee the computational cost-effectiveness of the proposed methodology. A weighting function is proposed by
which is calculated for the analyzed contact point at each cross-section (Figure 3). The parameters and define the width of the contact patches and their lateral position at centre, respectively. The value at each cell reads
where is the discretization of the analysed cells, is the number of contact points on each cross-section i and is the number of discrete points at the analyzed cells. The calculated at each is then added to a previous matrix at a calculated time . When any value of matrix is higher than one (Figure 4) the crack growth is studied. The value of each matrix cell is calculated as
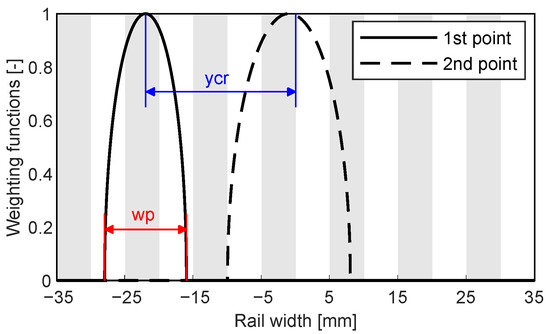
Figure 3.
DI distribution for each division of the rail cross-section. (ycr: lateral position of the contact patch center; wp: width of the contact patch).
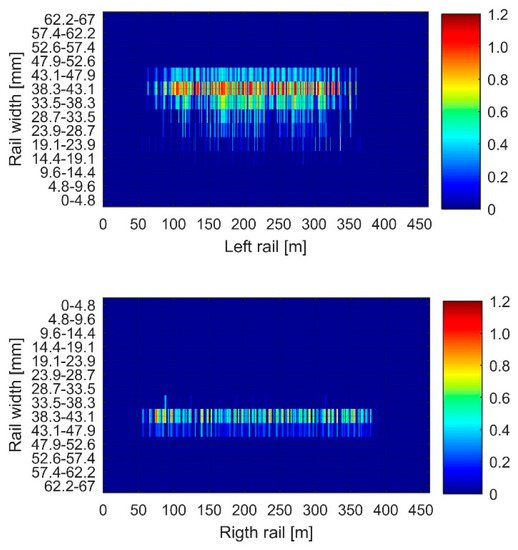
Figure 4.
Location of Total DI for both left and right rails.
2.4. Crack Growth Model
The crack growth model allows predicting the future characteristics of an already existent crack under some conditions. The developed methodology is based on the work of the Korea Railroad Research Institute (KRRI) [21] to calculate the minimum crack size for growth under rolling contact between wheel and rail. Owing to the crack truncation rate, a minimum crack size is needed to allow propagation. KRRI model considers physically small cracks that eventually become long cracks. The purpose of their work is not the investigation of the growth of microstructurally or mechanically small cracks. According to KRRI work, our methodology uses a minimum crack size value derived from the traction coefficient and creepages in the wheel-rail contact point. Then, for an existing new crack, whose length has already been predicted, the crack growth rate will be a function of the crack depth. This dependence will be again related to the traction coefficient and creepages in the wheel-rail contact point.
This work from KRRI employs Fletcher and Kapoor’s “2.5D” fatigue crack growth model [41], which performs calculations with the SIF procedure [42]. With the use of Green’s functions, it is possible to determine the crack propagation as a function of the crack depth for a known traction coefficient and creepages. In addition, this model takes into account the wear rate using the popular Archard’s model. Therefore, the calculated crack will be the net crack (Figure 5) considering
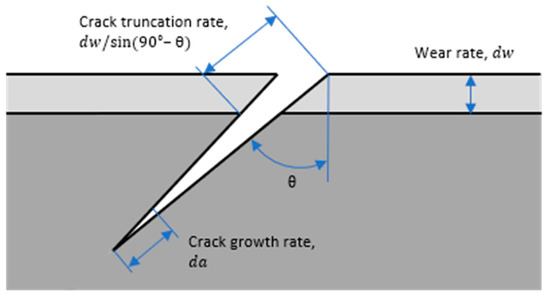
Figure 5.
Net Crack considering crack growth and rail wear. Adapted from [21].
Cracks are initiated while Burstow’s energy model accumulates , which consider wear and crack propagation as well. Once is equal to one, the minimum crack size determined is long enough for the plastic zone surrounding the crack tip to reach an almost steady state in terms of shape, although the magnitude of plastic strain increases with the number of cycles. Thus, restrictions regarding plastically deformed material can be avoided [43]. For the rail points where the accumulated is higher than one, the crack growth and evolution are analyzed. With the aim of improving the computational cost of the methodology a database is implemented which stores the minimum crack lengths and the coefficients of fourth-degree polynomials for different values of creepages γ and traction coefficients , as shown by the examples in Figure 6 and Table 1. These coefficients allow calculating the net crack growth rate as a function of the crack depth :
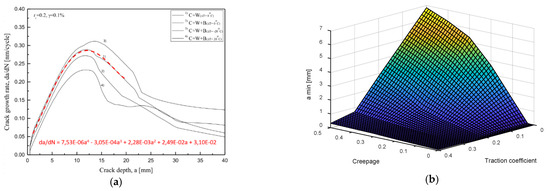
Figure 6.
Database values from [21] results: (a) Crack growth fourth-degree polynomial considering contact stress and wear (tc = 0.2 and γ = 0.1%); (b) Minimum crack length for different creepages and traction coefficients.

Table 1.
Example of crack growth database.
Although KRRI work is based on Green’s functions used also in the 2.5D model to enable rapid calculation, the use of this kind of database allows introducing future crack growth calculations by FEM for ad hoc solutions. When cracks are explicitly modeled by FEM, crack growth calculations are very time-consuming because these models make use of rigorous fracture mechanics concepts.
Regarding the propagation angle, there is not a simple relationship. Near the contact surface, the angle is heavily dependent on plastic damage, which depends on the material response to applied surface tractions. Afterwards, crack tip growth direction and angle influences the propagation angle. As a first approximation, the propagation angle is calculated by means of the normal and shear forces. Then, the characteristics of the predicted crack are saved according to its location on the rails. In the next calculations, if the is higher than one, the methodology verifies the existence of a previous crack to apply the crack growth model.
2.5. Output Results
Finally, while does not reach the loop returns to a new MBS (Section 2.2). Parameters such as irregularities, rail profiles or running conditions could take different values changing the obtained results on the vehicle-track interaction. The next crack initiation and growth calculations will be fed by the last MBS outputs and the updated rails RCF status database. Once is reached, the depth, evolution and shape of cracks are assessed per number of vehicles (Figure 7). Please note that the MBS databases, such as irregularities files and/or rail profiles files, are updated when the RCF module co-works with other degradation modules. Hence, operation and/or track conditions can be changed each for the overall time analysed.
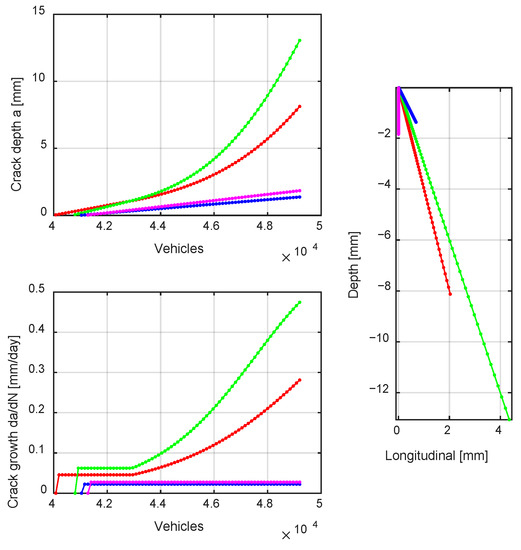
Figure 7.
Length, evolution and shape of different predicted cracks.
3. Experimental Validation
This section describes the validation of the proposed methodology with field measurements in real scenarios. The MBS software Simpack is used to model a representative railcar of one complete rail unit. The track sections are introduced in the multibody model with their corresponding track geometry and measured track irregularities. In addition, the state of the rails is known regarding the depth of the RCF cracks for two different dates.
Innotrack’s report [44] considered that cracks grow at a constant rate in contrast to the actual non-linearity of crack growth. However, it is problematic to consider a linear crack growth when making comparisons between only two dates. Figure 8 shows an example of this issue with a hypothetical propagated crack (in blue dotted line) which has different linear growth rates (black lines) throughout its propagation. Since cracks are detected for a certain number of million gross tons (MTn) from the last grinding, inspections carried out previously (Date 1) cannot measure any crack. If a later second inspection detects a crack (Date 2), a distorted crack growth rate is obtained from Date 1. Besides that for the same number of MTn, cracks of different depths will eventually appear due to the traction coefficients and creepages.
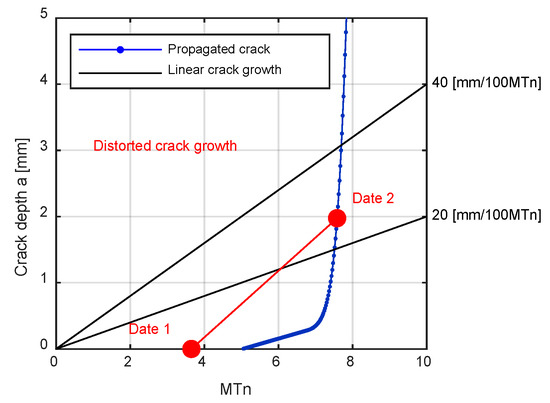
Figure 8.
Crack prediction and associated crack growth rates for different moments.
The comparison between measurements and prediction results is assessed regarding both the location and growth of the cracks. Location of cracks is distinguished by straight lines, clothoids and circular curves. The crack growth is evaluated quantifying the cracks between certain depth levels. It is important to bear in mind that the target of this experimental validation is not to predict exactly the location and size of each single crack. This is because for example k’ parameter of Archard’s wear model is that employed in KRRI work. The results help to qualitatively understand the chance of RCF problems on the studied sections of rails, based on cracks depth, density, and their relative locations.
3.1. Case Studies
The case study was carried out on a mainline, near London, managed by Network Rail. According to their maintenance operations strategy, and in order to quantify the depth of RCF cracks, Eddy Current measurements [45] were carried out every 26 weeks. In this type of inspection, an AC current is conducted through a coil, which produces a magnetic field around it. When the coil is placed near a conducting material, such as a rail, it induces eddy currents on the surface of the material. If a flaw, such as an RCF crack, disturbs the eddy currents, the magnetic coupling with the material is altered and the signal can be read by measuring the change in impedance across the coil.
Most of the trains running through this line are passenger vehicles. The vehicle considered in the validation case studies is an Electric Multiple Unit (EMU) with no separate locomotive. The computational vehicle model is composed of one carbody, two bogies and four wheelsets each one having six degrees of freedom (DOF). Additionally, the relationship and link between solids are made by means of suspension elements and/or kinematical restrictions, which represent the real arrangement and characteristics of components in the real vehicle.
The methodology has been applied in two different sections of the railway line. Figure 9 shows the track geometry of these two curved sections, whose location is close to one of those used in Burstow’s study. Thus, the implemented damage function is valid for this experimental validation. For other locations, the methodology is valid updating the damage function. The characteristics of these sections are suitable to show the influence of the curve radii on the appearance of RCF cracks. This statement is based on recommendations in the Innotrack report [44] regarding the use of standard grade rails, for which the curve radii threshold for RCF is between 700 m and 1000 m on lightly loaded tracks (<10 MTn/year). The loading condition has been set to cover the daily average load. A constant friction coefficient of 0.5 is used in the wheel-rail contact to replicate the dry conditions [46], i.e., without flange lubrication. Traction has been neglected for simplicity, as the train travels at constant speed. The detailed information about the case study parameters is listed in Table 2.
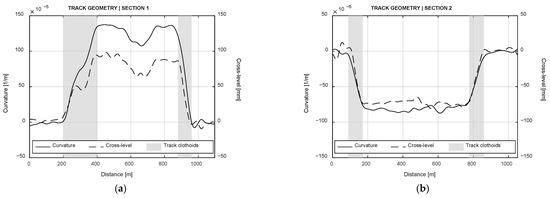
Figure 9.
Track geometry of the considered sections: (a) Section 1; (b) Section 2.
Table 2.
Parameters of the case studies.
Two Eddy Current measurements are available, which were taken 220 days one after the other. Within this period of time, an estimated traveled load of 4.752 MTn is considered for these sections. This value is calculated from daily traffic and load per axle detailed in Table 2. The inspection system provides data of rail sections every yard (0.914 m). Crack depth is measured at ten points on each section (see Figure 10) and the maximum value is taken as a reference for our assessment.
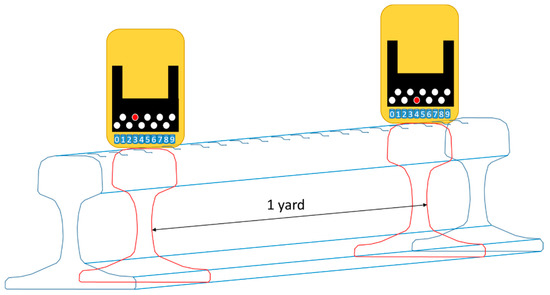
Figure 10.
Sketch of Eddy Current measurement system on a rail.
The difference in crack depth is calculated between these two measurements. The analyzed cracks are for the high rail, the trackside where rail cracks are predominant due to the direction of steering forces. Commonly high rail is used referring to outer rail of a curve and low rail for the inner rail. At curves, the superelevation introduced to reduce the non-compensated acceleration makes this high difference. The dataset provided by the infrastructure manager has decimal values that have been grouped in blocks of 0.5 mm. Figure 11 shows the number of cracks as a function of their depth. Three different values are provided for each group depending on the type of curvature, i.e., circular curve, entry clothoid and exit clothoid. The methodology is implemented in Matlab®, where calls to several processes of the MBS software and the mathematical computing of the physical models are carried out. The key conclusions are the following:
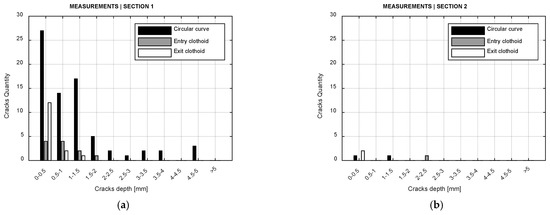
Figure 11.
Number of cracks measured as a function of their depth, grouped by curvature type: (a) Section 1; (b) Section 2.
- No cracks appear at any straight lines for both sections.
- Section 1 shows a spread distribution of different depths at the circular curve with less effect at clothoids.
- Measurements for Section 2 are rather punctual without a clear pattern.
3.2. Results
The predicted RCF behavior, using the methodology described in this paper, is similar to the measurements for both assessed case studies. Figure 12 shows a qualitative comparison between measured and predicted locations of cracks in Sections 1a and 2b, respectively. The three main conclusions are also:
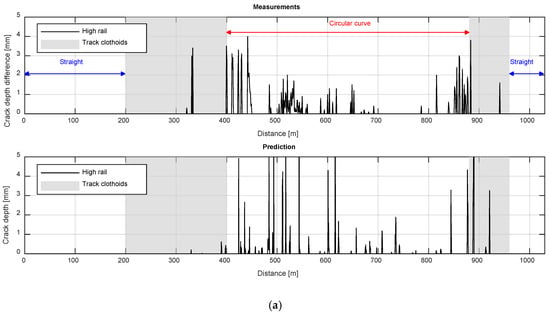
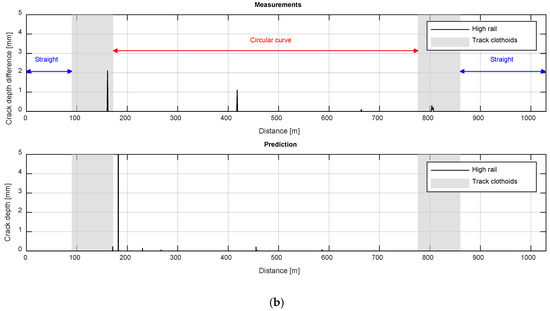
Figure 12.
Location comparison between predicted and measured cracks for 4.752 MTn: (a) Section 1; (b) Section 2.
- No cracks have been predicted for any straight track.
- Different crack depths at the whole circular curve and some cracks at clothoids are predicted for Section 1
- Punctual cracks are predicted for Section 2
The comparison between the predicted and measured values shows when a high density of cracks or no cracks are expected. According to Innotrack report [44], the curve radii threshold for RCF is between 700 m and 1000 m. On the one hand, Section 1 is within this threshold (curve radio of 720 m) and has a lot of cracks on its circular curve. Between the distance of 400 m and 700 m, long cracks appear and shorter cracks between the distance of 700 m and 850 m. On the other hand, Section 2 with a curve radius out of the threshold (1100 m) has very few cracks to consider an RCF behavior. For both Sections 1 and 2, no cracks appear at straight tracks.
For further validation, the trend-lines of measurements and predictions have been compared for circular curves of both sections and the entry clothoid in Section 1. The number of cracks has been normalized (crack quantity per depth has been divided by a track section of 100 m), to compare each curvature type independently of its length. As crack depth assessments are around every meter, much more cracks are taking place in rails. However, this quantification is enough in terms of comparison. Figure 13 shows that predictions replicate the behavior change of different sections in the same order of magnitude. According to the results of the calculation, it can be seen that for initial cracks the values are similar. Specifically, the relative error at small circular curve (Section 1) is 4.1% and the relative error at clothoid is 18.5%; the cracks at large circular curve are far too punctual to obtain a relative error.
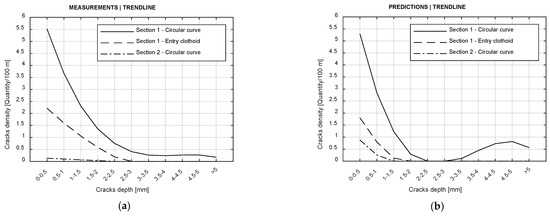
Figure 13.
Comparison of the trend-lines between measurements and predictions for three different sections. Assessment with one measured cross-section per yard: (a) Measurements; (b) Predictions.
4. Discussion and Conclusions
The proposed methodology for the prediction of RCF behavior was validated in real case studies thanks to the selection of the appropriate track section characteristics. The qualitative comparison of the predicted results with the experimental measurements shows a good relationship since for the first section a high density of cracks is obtained at similar locations, while for the second section only isolated cracks appear. Nevertheless, further consideration of the results is necessary.
- In the first section under analysis, the predictions show clearly the same RCF pattern that is experimentally observed in the real track. The methodology assumes the existence of RCF problems at specific locations. The predicted results at straight lines and circular curves show a good relationship with measurements. On the other hand, although similar conclusions might be obtained for clothoids, relationship is not so accurate. Consequently, these transitions must be treated carefully, because the vehicle dynamic behavior is subjected to changes between different track sections.
- In the second track section, only isolated cracks without a clear pattern are measured. The prediction of isolated cracks may be due to numerical effects owing to the MBS irregularities file. In this section, no RCF problems are predicted, since calculated cracks are few and very isolated. Nevertheless, the appearance of isolated cracks could be a sign of a potential breakage of the rail if preventive maintenance actions are not carried out on time.
- Predictions are good for small depth values because the initiation and minimum crack size are well controlled. Therefore, the scheduling of grinding maintenance task can be improved to avoid the propagation of cracks that could lead to rail failure.
- The difference in some crack growths could be due to different factors. First, a lack of information regarding the degradation state of the rails in the first measurement date. A second reason behind the difference for deeper cracks while the trend remains similar could be a lack of data to characterize the coefficients of the fourth-degree polynomial. Finally, the employed damage function was developed for normal grade rails but the material grade of installed rails could have small differences.
- and have been considered equal. Smaller values of with an updating of track irregularities or rail profiles may vary results in .
- The methodology was implemented using models available in the literature. The database for crack propagation, i.e., values and coefficients of fourth-degree can be updated by XFEM calculations [47]. This kind of numerical solution is suitable as has been proven by Bergara et al. [48].
In this article, cracks on railway track systems are predicted using a methodology by means of MBS. Different engineering methods are coupled to obtain a global model. The comparison of predictions with experimental measurements proves that the proposed methodology is a promising strategy to predict RCF behavior:
- The location of predicted cracks and their growth allow predicting RCF behavior. The track sections can then be sorted against the chance of failure, reducing the LCC with the adequate scheduling of the consequent maintenance programs. The high reliability in the prediction of the initiation of cracks makes possible a reduction of maintenance costs.
- The track quality and the evolution of rail wear can be considered along with the assessment of cracks. In the same way, this methodology can be used to support the decision of changes in running conditions and the design of track sections.
Author Contributions
Conceptualization, B.R.-A. and J.N.; methodology, B.R.-A.; validation, B.R.-A. and A.S.E.; investigation, B.R.-A. and A.S.E.; writing—original draft preparation, B.R.-A.; writing—review and editing, B.R.-A. and U.A.; supervision, J.N. and J.M.M.-E.; funding acquisition, U.A. All authors have read and agreed to the published version of the manuscript.
Funding
This research was supported by the European Union’s Horizon 2020 research and innovation programme under grant agreements No. 636032 (Roll2Rail) and No. 776402 (SIA).
Institutional Review Board Statement
Not applicable
Informed Consent Statement
Not applicable
Data Availability Statement
Data is contained within the article
Acknowledgments
The authors gratefully acknowledge Network Rail for providing the experimental data used in this work.
Conflicts of Interest
The authors declare no conflict of interest.
Nomenclature
| volume of worn material | |
| wear coefficient | |
| normal force | |
| sliding distance | |
| material hardness | |
| total prediction time | |
| prediction time step | |
| damage index | |
| longitudinal coordinate of any point of the rail | |
| lateral coordinate of any point of the rail | |
| types of vehicles | |
| vehicles of the same type | |
| wheelsets on each vehicle | |
| elliptic function over the contact patch | |
| maximum damage on as a function of and | |
| shear force coefficient | |
| wear number | |
| creepages | |
| net crack growth rate | |
| wear number value at turning points | |
| yield strength | |
| ultimate tensile strength | |
| contact area | |
| creepage at turning points | |
| cross-sections with wheel-rail contact along the analyzed track | |
| discretization of the cross-sections to store different parameters | |
| weighting function for contact point | |
| contact point | |
| lateral position of the contact patch center | |
| width of the contact patch | |
| damage index of the analyzed cell | |
| damage index for contact point | |
| weighting function for contact point at location of | |
| discretization of the analyzed cells | |
| number of discrete points of the analyzed cells | |
| number of contact points on each cross-section i | |
| total damage index matrix | |
| calculated time | |
| crack growth rate | |
| inclined angle from normal to rail surface to the crack face | |
| wear rate | |
| traction coefficients | |
| crack depth | |
| polynomial coefficients, |
References
- BSI. EN 13848-1:2019 Railway Applications—Track—Track Geometry Quality. Characterization of Track Geometry; BSI: London, UK, 2019. [Google Scholar]
- Office of Rail and Road. UK Rail Industry Financial Information; ORR: London, UK, 2017; pp. 1–58. [Google Scholar]
- BSI. EN14363 Railway Applications—Testing and Simulation for the Acceptance of Running Characteristics of Railway Vehicles—Running Behaviour and Stationary Tests; BSI: London, UK, 2016. [Google Scholar]
- Magel, E.E. Rolling Contact Fatigue: A Comprehensive Review; FRA: Washington, DC, USA, 2011; p. 118. [Google Scholar] [CrossRef]
- Reis, L.; Li, B.; De Freitas, M. A multiaxial fatigue approach to Rolling Contact Fatigue in railways. Int. J. Fatigue 2014, 67, 191–202. [Google Scholar] [CrossRef]
- Lu, C.; Melendez, J.; Martínez-Esnaola, J.M. A universally applicable multiaxial fatigue criterion in 2D cyclic loading. Int. J. Fatigue 2018. [Google Scholar] [CrossRef]
- Network Rail. NR/L2/TRK/001/MOD06 Issue 7—Inspection and Maintenance of Permanent Way: Visual Inspection, Ultrasonic and Eddy Current Testing of Rails; NR: London, UK, 2017. [Google Scholar]
- Donzella, G.; Faccoli, M.; Ghidini, A.; Mazzù, A.; Roberti, R. The competitive role of wear and RCF in a rail steel. Eng. Fract. Mech. 2005, 72, 287–308. [Google Scholar] [CrossRef]
- Brouzoulis, J. Wear impact on rolling contact fatigue crack growth in rails. Wear 2014, 314, 13–19. [Google Scholar] [CrossRef]
- Archard, J.F. Contact and rubbing of flat surfaces. J. Appl. Phys. 1953, 24, 981–988. [Google Scholar] [CrossRef]
- Archard, J.F.; Hirst, W. The Wear of Metals under Unlubricated Conditions. Proc. R Soc. Math. Phys. Eng. Sci. 1956, 236, 397–410. [Google Scholar] [CrossRef]
- Jendel, T. Prediction of wheel profile wear—Comparisons with field measurements. Wear 2002, 253, 89–99. [Google Scholar] [CrossRef]
- Lewis, R.; Olofsson, U. Mapping rail wear regimes and transitions. Wear 2004. [Google Scholar] [CrossRef]
- Burstow, M.C. Whole Life Model Application and Development for RSSB—Continued Development of an RCF Damage Parameter; T115 Report; RSSB: London, UK, 2004. [Google Scholar]
- Evans, J.R.; Burstow, M.C. Vehicle/track interaction and rolling contact fatigue in rails in the UK. Veh. Syst. Dyn. 2006, 44, 708–717. [Google Scholar] [CrossRef]
- Ekberg, A.; Akesson, B.; Kabo, E. Wheel/rail rolling contact fatigue—Probe, predict, prevent. Wear 2014, 314, 2–12. [Google Scholar] [CrossRef]
- Johnson, K.L. The strength of surfaces in rolling contact. Proc. Inst. Mech. Eng. Part C J. Mech. Eng. Sci. 1989. [Google Scholar] [CrossRef]
- Dirks, B.; Enblom, R.; Ekberg, A.; Berg, M. The development of a crack propagation model for railway wheels and rails. Fatigue Fract. Eng. Mater. Struct. 2015, 38, 1478–1491. [Google Scholar] [CrossRef]
- Brouzoulis, J.; Ekh, M. Crack propagation in rails under rolling contact fatigue loading conditions based on material forces. Int. J. Fatigue 2012, 45, 98–105. [Google Scholar] [CrossRef]
- Canadinc, D.; Sehitoglu, H.; Verzal, K. Analysis of surface crack growth under rolling contact fatigue. Int. J. Fatigue 2008, 30, 1678–1689. [Google Scholar] [CrossRef][Green Version]
- Jun, H.K.; Lee, D.H.; Kim, D.S. Calculation of minimum crack size for growth under rolling contact between wheel and rail. Wear 2015, 344–345, 46–57. [Google Scholar] [CrossRef]
- Fletcher, D.I.; Smith, L.; Kapoor, A. Rail rolling contact fatigue dependence on friction, predicted using fracture mechanics with a three-dimensional boundary element model. Eng. Fract. Mech. 2009, 76, 2612–2625. [Google Scholar] [CrossRef]
- Markine, V.L.; Steenbergen, M.J.M.M.; Shevtsov, I.Y. Combatting RCF on switch points by tuning elastic track properties. Wear 2011, 271, 158–167. [Google Scholar] [CrossRef]
- Beghini, M.; Santus, C. An application of the weight function technique to inclined surface cracks under rolling contact fatigue, assessment and parametric analysis. Eng. Fract. Mech. 2013, 98, 153–168. [Google Scholar] [CrossRef]
- Datsyshyn, O.P.; Marchenko, H.P.; Glazov, A.Y. On the special angle of surface cracks propagation in the railway rail heads. Eng. Fract. Mech. 2019, 206, 452–462. [Google Scholar] [CrossRef]
- Six, K.; Mihalj, T.; Trummer, G.; Marte, C.; Krishna, V.V.; Hossein-Nia, S.; Stichel, S. Assessment of running gear performance in relation to rolling contact fatigue of wheels and rails based on stochastic simulations. Proc. Inst. Mech. Eng. Part F J. Rail Rapid Transit 2020, 234, 405–416. [Google Scholar] [CrossRef]
- Butini, E.; Marini, L.; Meacci, M.; Meli, E.; Rindi, A.; Zhao, X.J.; Wang, W.J. An innovative model for the prediction of wheel—Rail wear and rolling contact fatigue. Wear 2019, 436–437, 203025. [Google Scholar] [CrossRef]
- Karttunen, K.; Kabo, E.; Ekberg, A. The influence of track geometry irregularities on rolling contact fatigue. Wear 2014, 314, 78–86. [Google Scholar] [CrossRef]
- Burstow, M.C. Improving Track Geometry Alignment to Reduce Rolling Contact Fatigue (RCF); NR: London, UK, 2011. [Google Scholar]
- Rodríguez-Arana, B.; Blanco, B.; Alvarado, U. Predicting the vertical track quality evolution by multibody simulations considering the ballast settlement. In Proceedings of the 4th International Conference on Railway Technology: Research, Development and Maintenance, Barcelona, Spain, 3–7 September 2018. [Google Scholar]
- Plu, J.; Bondeux, S.; Boulanger, D.; Heyder, R. Application of fracture mechanics methods to rail design and maintenance. Eng. Fract. Mech. 2009, 76, 2602–2611. [Google Scholar] [CrossRef]
- Release, S.; Systemes, D.; Corp, S. Simpack Documentation; Dassault Systémes: Vélizy-Villacoublay, France, 2018. [Google Scholar]
- Kalker, J.J. A Fast Algorithm for the Simplified Theory of Rolling Contact. Veh. Syst. Dyn. 1982. [Google Scholar] [CrossRef]
- Kalker, J.J. Simplified Theory of Rolling Contact; Springer: Amsterdam, The Netherlands, 1973. [Google Scholar]
- Chudzikiewicz, A.; Kalker, J.J. Wheel-rail wear calculations with the FASTSIM routine. Arch. Transp. 1989, 1, 9–27. [Google Scholar]
- Six, K.; Meierhofer, A.; Müller, G.; Dietmaier, P. Physical processes in wheel-rail contact and its implications on vehicle-track interaction. Veh. Syst. Dyn. 2015, 53, 635–650. [Google Scholar] [CrossRef]
- Hossein Nia, S.; Jönsson, P.A.; Stichel, S. Wheel damage on the Swedish iron ore line investigated via multibody simulation. Proc. Inst. Mech. Eng. Part F J. Rail Rapid Transit 2014, 228, 652–662. [Google Scholar] [CrossRef]
- Hossein-Nia, S.; Sichani, M.S.; Stichel, S.; Casanueva, C. Wheel life prediction model–an alternative to the FASTSIM algorithm for RCF. Veh. Syst. Dyn. 2018, 56, 1051–1071. [Google Scholar] [CrossRef]
- Spangenberg, U.; Fröhling, R.D.; Els, P.S. Influence of wheel and rail profile shape on the initiation of rolling contact fatigue cracks at high axle loads. Veh. Syst. Dyn. 2016, 54, 638–652. [Google Scholar] [CrossRef]
- Meymand, S.Z.; Keylin, A.; Ahmadian, M. A survey of wheel-rail contact models for rail vehicles. Veh. Syst. Dyn. 2016, 54, 386–428. [Google Scholar] [CrossRef]
- Fletcher, D.I.; Kapoor, A. Rapid method of stress intensity factor calculation for semi-elliptical surface breaking cracks under three-dimensional contact loading. Proc. Inst. Mech. Eng. Part F J. Rail Rapid Transit 2006, 220, 219–234. [Google Scholar] [CrossRef]
- Fletcher, D.I.; Beynon, J.H. A simple method of stress intensity factor calculation for inclined surface-breaking cracks with crack faceunder contact loading. Proc. Inst. Mech. Eng. Part J J. Eng. Tribol. 1999, 213, 299–304. [Google Scholar] [CrossRef]
- Daves, W.; Kráčalík, M.; Scheriau, S. Analysis of crack growth under rolling-sliding contact. Int. J. Fatigue 2019, 121, 63–72. [Google Scholar] [CrossRef]
- Pointner, P.; Joerg, A.; Jaiswal, J. Definitive Guidelines on the Use of Different Rail Grades; Innotrack: London, UK, 2009; p. 45. [Google Scholar]
- Thomas, H.M.; Dey, A.; Heyder, R. Eddy current test method for early detection of rolling contact fatigue (RCF) in rails. Insight Non-Destruct. Test. Cond. Monit. 2010. [Google Scholar] [CrossRef]
- Olofsson, U.; Telliskivi, T. Wear, plastic deformation and friction of two rail steels—A full-scale test and a laboratory study. Wear 2003, 254, 80–93. [Google Scholar] [CrossRef]
- Mai, S.H.; Gravouil, A.; Nguyen-Tajan, M.L.; Trollé, B. Numerical simulation of rolling contact fatigue crack growth in rails with the rail bending and the frictional contact. Eng. Fract. Mech. 2017, 174, 196–206. [Google Scholar] [CrossRef]
- Bergara, A.; Dorado, J.I.; Martin-Meizoso, A.; Martínez-Esnaola, J.M. Fatigue crack propagation in complex stress fields: Experiments and numerical simulations using the Extended Finite Element Method (XFEM). Int. J. Fatigue 2017, 103, 112–121. [Google Scholar] [CrossRef]


Publisher’s Note: MDPI stays neutral with regard to jurisdictional claims in published maps and institutional affiliations. |
© 2021 by the authors. Licensee MDPI, Basel, Switzerland. This article is an open access article distributed under the terms and conditions of the Creative Commons Attribution (CC BY) license (http://creativecommons.org/licenses/by/4.0/).