Article

Comparison of the Observation Errors of Augmented and Spatial Reality Systems

1
Department of Orthodontics, School of Dentistry, Kanagawa Dental University, Yokosuka 238-8580, Japan
2
Department of Liberal Arts Education, School of Dentistry, Kanagawa Dental University, Yokosuka 238-8580, Japan
*
Author to whom correspondence should be addressed.
Appl. Sci. 2021, 11(24), 12076; https://doi.org/10.3390/app112412076
Submission received: 30 October 2021 / Revised: 29 November 2021 / Accepted: 15 December 2021 / Published: 18 December 2021
(This article belongs to the Collection Virtual and Augmented Reality Systems)

Abstract

:

Featured Application

The spatial reality display has been shown to be useful when used within 1.0 m.

Abstract

Using 3D technologies such as virtual reality (VR) and augmented reality (AR), has intensified nowadays. The mainstream AR devices in use today are head-mounted displays (HMDs), which, due to specification limitations, may not perform to their full potential within a distance of 1.0 m. The spatial reality display (SRD) is another system that facilitates stereoscopic vision by the naked eye. The recommended working distance is 30.0~75.0 cm. It is crucial to evaluate the observation accuracy within 1.0 m for each device in the medical context. Here, 3D-CG models were created from dental models, and the observation errors of 3D-CG models displayed within 1.0 m by HMD and SRD were verified. The measurement error results showed that the HMD model yielded more significant results than the control model (Model) under some conditions, while the SRD model had the same measurement accuracy as the Model. The measured errors were 0.29~1.92 mm for HMD and 0.02~0.59 mm for SRD. The visual analog scale scores for distinctness were significantly higher for SRD than for HMD. Three-dimensionality did not show any relationship with measurement error. In conclusion, there is a specification limitation for using HMDs within 1.0 m, as shown by the measured values. In the future, it will be essential to consider the characteristics of each device in selecting the use of AR devices. Here, we evaluated the accuracies of 3D-CG models displayed in space using two different systems of AR devices.

1. Introduction

The use of 3D technologies such as virtual reality (VR) and augmented reality (AR) has improved in recent years [1,2]. Technological advances have made it possible to capture the unseen [3,4,5]. These advances in technology allow visual aids through visualization to traditional blind tasks that rely on sensory approaches derived from clinical experience [6,7]. In the dental field, its use for surgical guidance, navigation, and clinical education is being considered [2,8,9].
AR devices allow users to see 3D-CG models displayed in real space in three dimensions and manipulate them freely. Evaluation of the accuracy of the displayed 3D-CG model is essential for clinical applications. For example, in dental care, high accuracy is required to take into account the sensitive sensation in the mouth [10]. Currently, mainstream AR devices are head-mounted display (HMD) types. A previous study evaluated the AR technology in HMDs [7].
However, challenges with this technology have also been reported [11]. For example, several HMDs require the adjustment of the interpupillary distance (IPD) of the observer, which is processed for stereoscopic viewing. The IPD is different for each individual, and it needs to be readjusted for each person when several people use the same device, which is often time-consuming and labor-intensive. In addition, there seems to be an overlap of visual information. This occurs because the 3D-CG model overlaps a few centimeters away from the left and right eyeballs when observing the actual object.
Several HMDs used in research are not manufactured for medical use. A typical example is the HoloLens2 (Microsoft, Redmond, WA, USA), but the manufacturer recommends placing the 3D-CG model at least 1.0 m away [12]. In actual clinical practice, the distance between the surgeon and the surgical field is shorter than 1.0 m. The accuracy of 3D-CG models when the HMD is used within 1.0 m is valuable information.
As a new AR device that differs from conventional HMDs, a 3D display that enables stereoscopic viewing with the naked eye has been developed [13]. A spatial reality display (SRD) (Sony, ELF-SR1, Tokyo, Japan, 2020) has an automatic IPD measurement functionality. The display recognizes the pupil of one person in front of it with the camera and provides stereopsis for the naked eye. Unlike HMDs, SRD Shows a 3D-CG model in front of the device. Figure 1 shows the positional relationships between the eyeball, the 3D-CG model, the AR device during the measurement, and objects (e.g., calipers).
The manufacturer’s recommended working distance for SRD is 30.0~75.0 cm. SRD has the potential to solve the challenges presented by HMD. In addition, the emergence of new system devices creates the possibility of using AR technology differently than before. By clarifying the impact of system differences on the accuracy of the displayed 3D-CG model, we can consider the criteria for selecting an AR device that meets our objectives. No studies have discussed the accuracy of 3D-CG models observed with AR devices within close range, which are required in clinical dentistry [14]. Although SRDs are beginning to be used in medical and dental education, their accuracies have not been compared with that of HMD [15]. Although SRD is beginning to be used in medical and dental education, its accuracy has not been verified [16]. In this experiment, four conditions were used for measurement: horizontal distance (horizontal) and depth and two postures, which were the sitting posture (SP) and the standing posture (StP).
This study aimed to use two different AR device systems to evaluate the accuracy of the visibility of the 3D-CG models displayed stereoscopically in space.

2. Materials and Methods

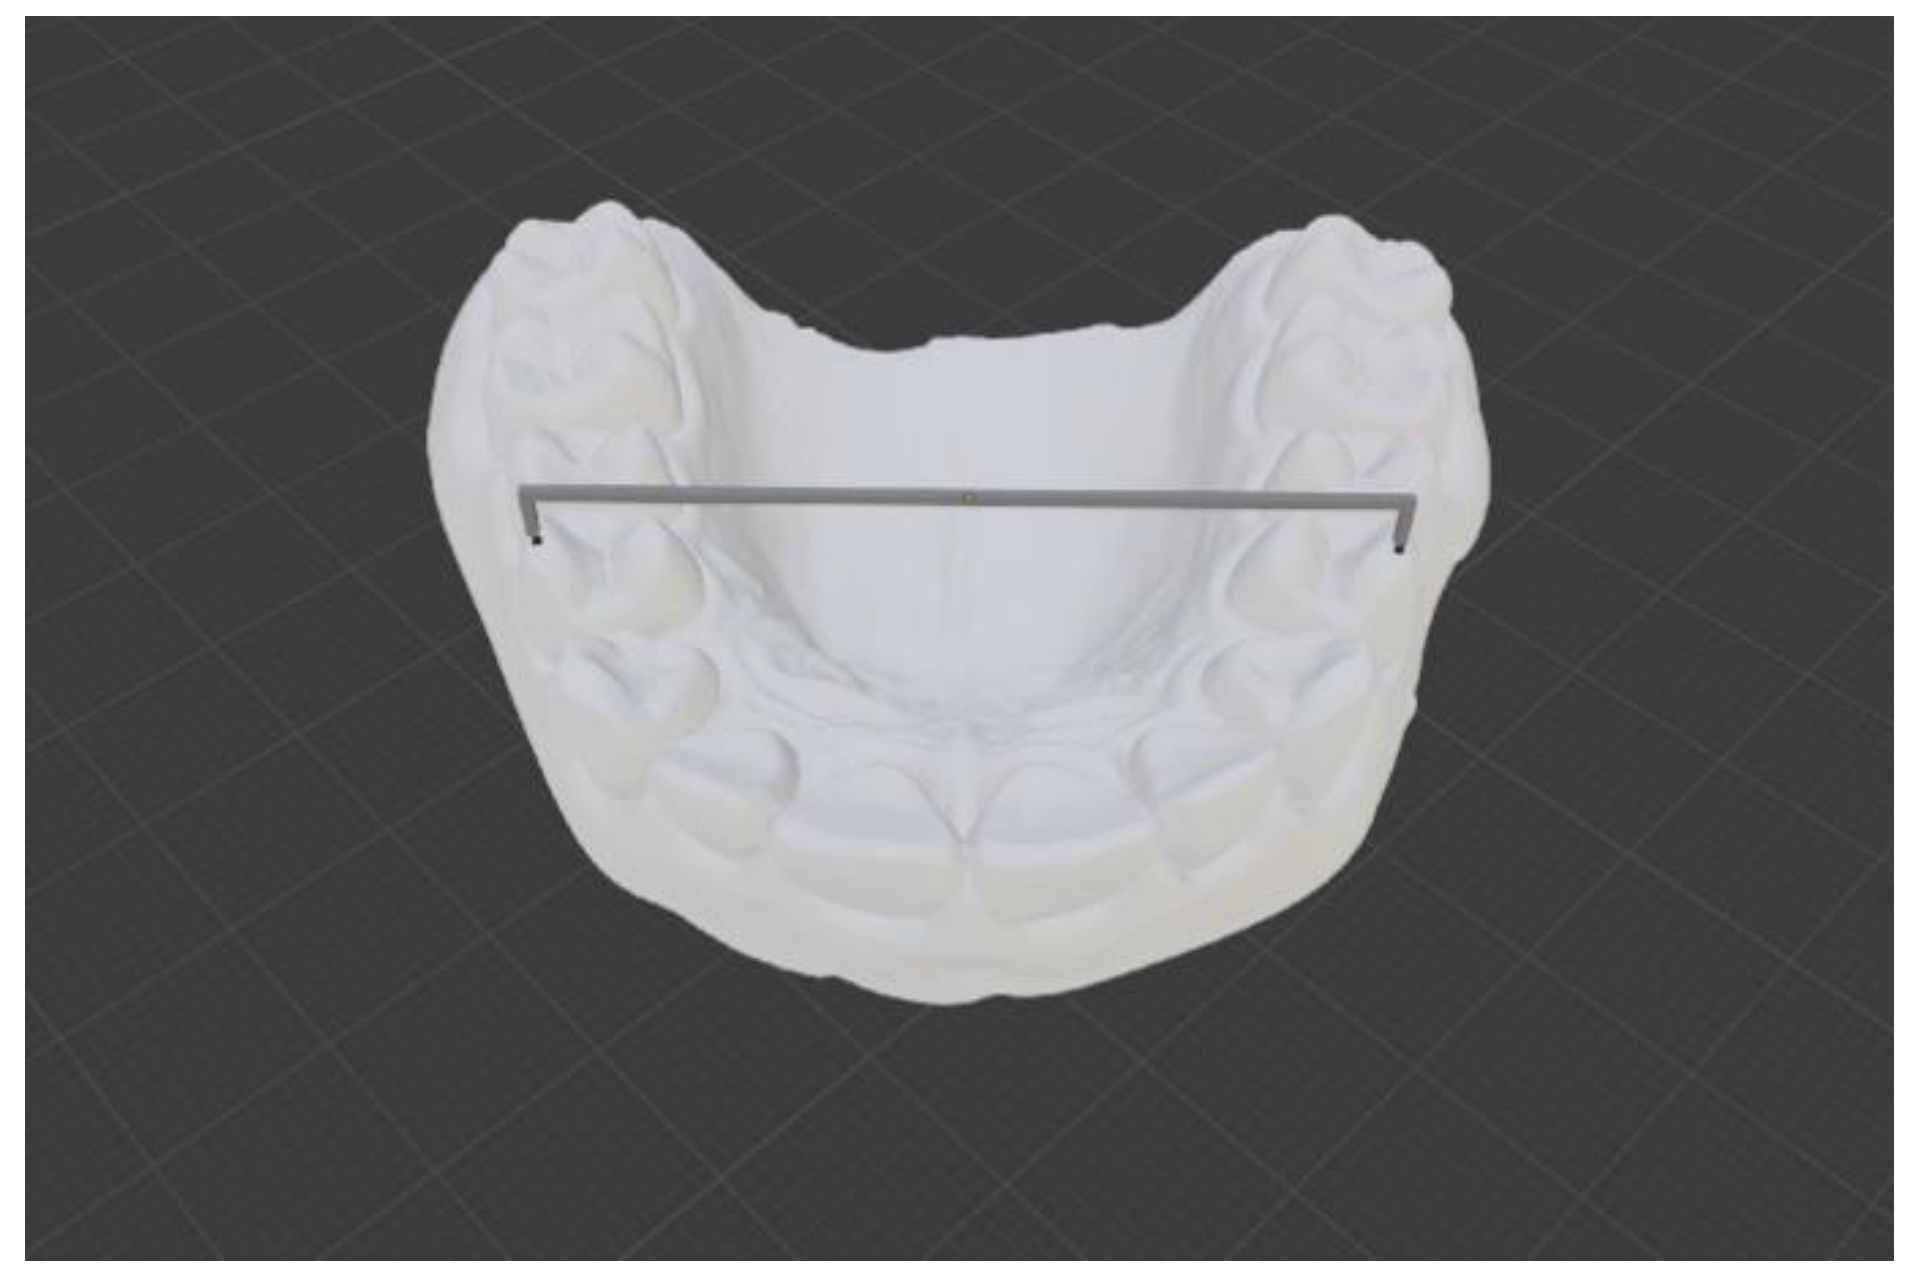
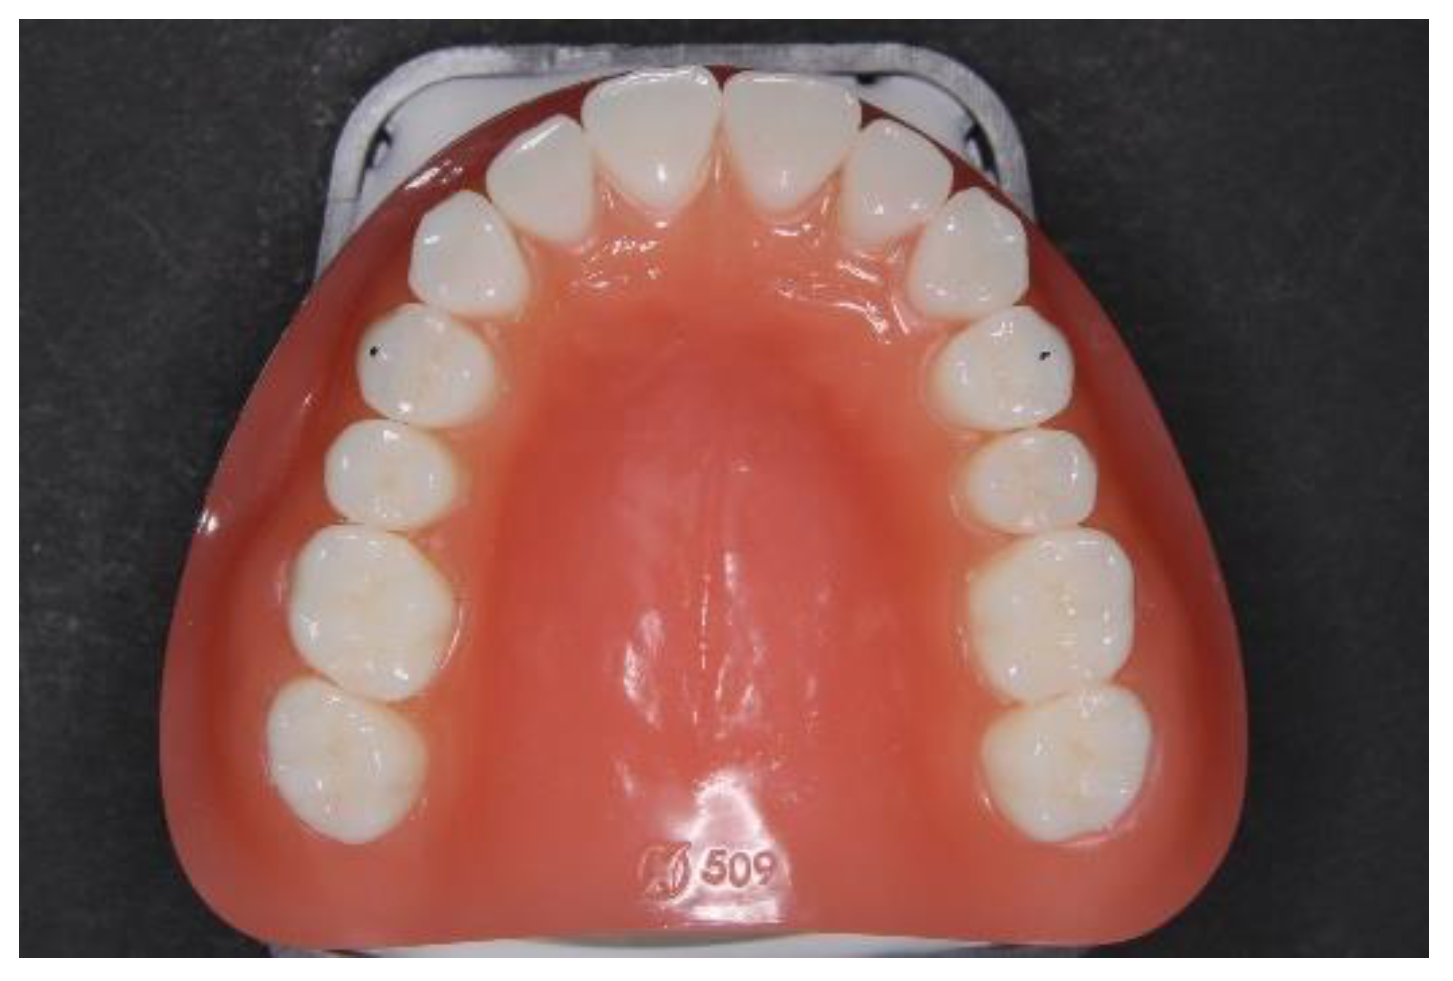
2.1. Measurement Model

This study used a typodont maxillary dental model (NISSIN, D13-509, Tokyo, Japan) as a control model (Model). The models were scanned using intraoral scanners (iTero element2, Align Technology, San José, CA, USA) to create 3D-CG models. The scan data was exported as STL data and converted to OBJ data in a blender (Blender Foundation, Amsterdam, The Netherlands). Figure 2 shows the Model used, and Figure 3 shows the digital model created.
For the HMD used in the experiment, we selected the HoloLens2 (Microsoft, Redmond, WA, USA), which is used in several AR types of research [17]. For the SRD, we used ELF-SR1 (SONY). We created an application to output OBJ data created using Unity (2019.4.14) on the HMD and SRD. Figure 4 shows the 3D-CG model displayed on the HMD, and Figure 5 shows the 3D-CG model displayed on the SRD.

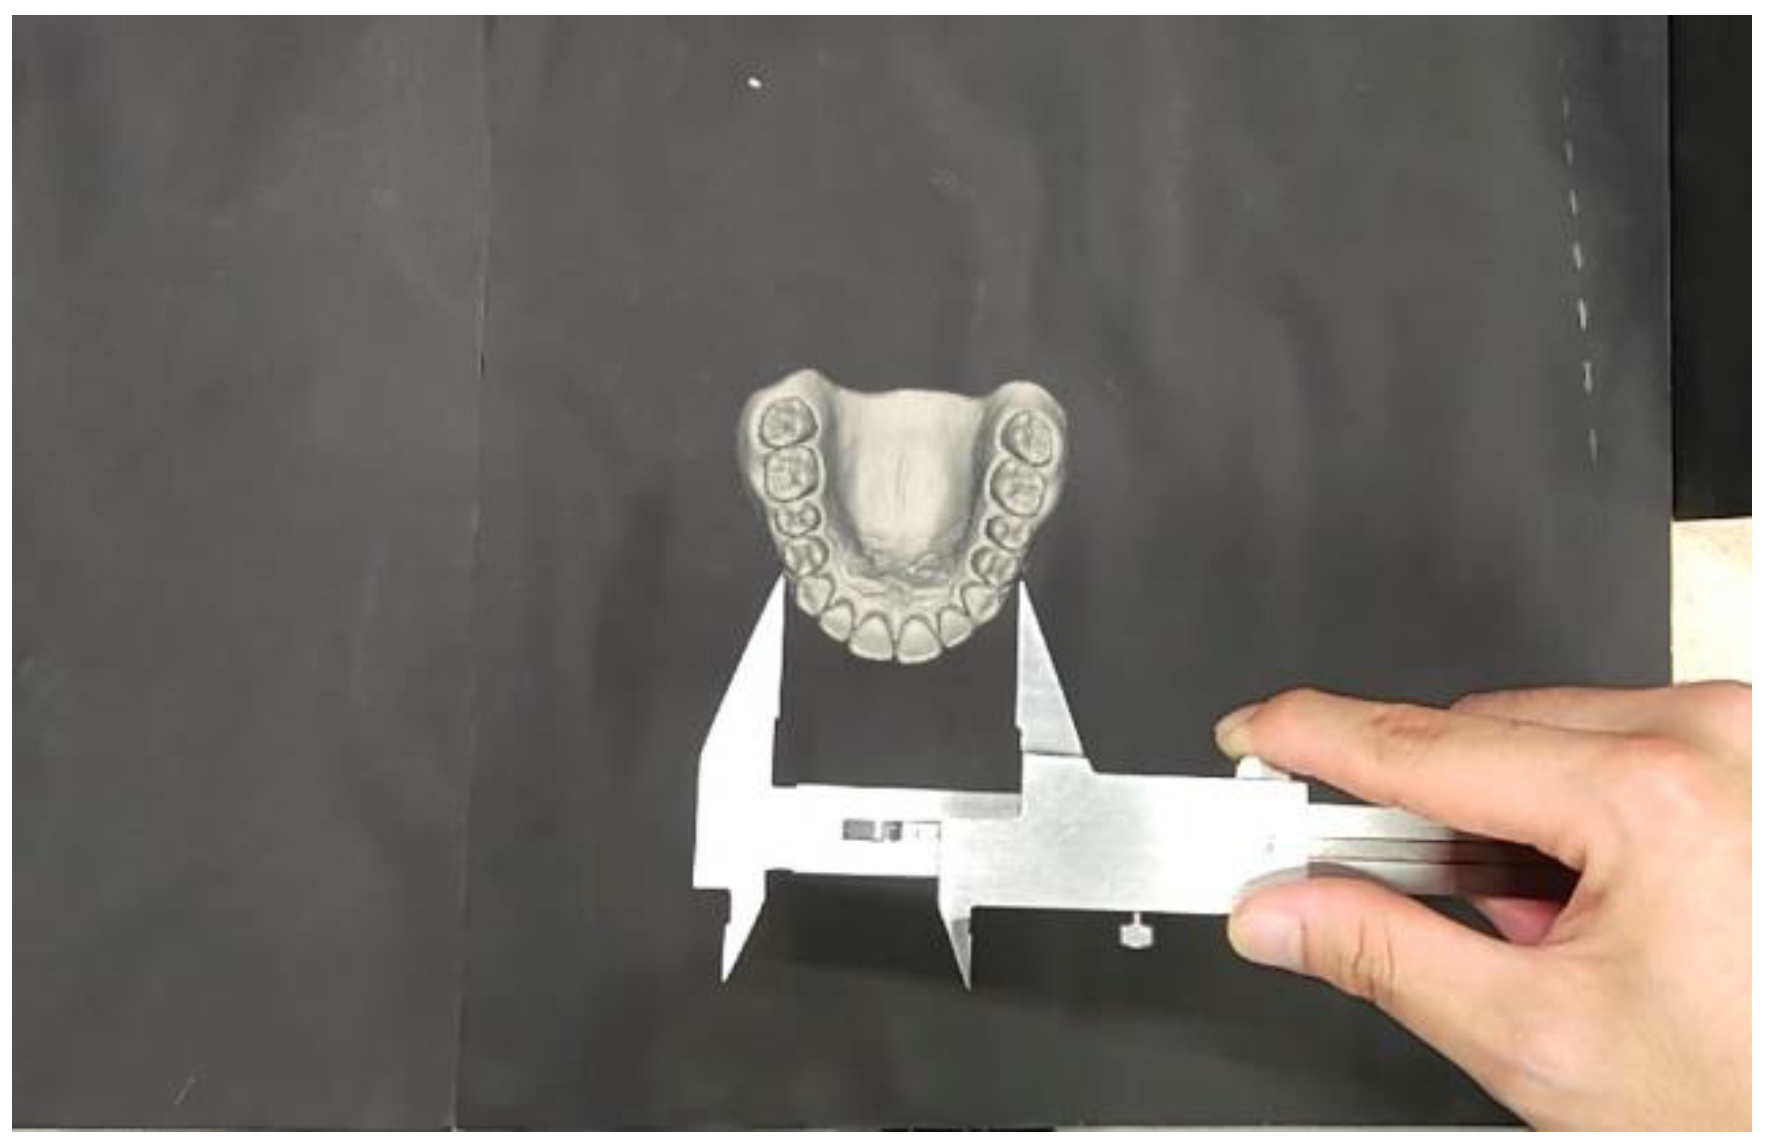
2.2. Measurement Method

The experiment was conducted by 14 dentists from the Department of Orthodontics, Kanagawa Dental University Hospital, who had sufficient diagnostic experience with orthodontic treatment. All participants had normal or corrected-to-normal vision and little experience with using the AR devices.
The dental arch width diameter, which is one of the model measurement items in orthodontic clinical practice, was selected as the measurement item. The dental arch width diameter is the distance between the buccal cusps of the left and right first premolars. In clinical practice, it is measured using calipers. Figure 6 shows the orientation of the horizontal model and measurement area, and Figure 7 shows the direction of the depth model and the measurement area.
Figure 8 shows the position of the measurement target and the person taking the measurement in the SP, and Figure 9 shows the position of the measurement target and the person taking the measurement in the StP.
Initially, the participant measured the dental arch width diameter of the Model three times. A digital caliper (SHINWA, 19975, Niigata, Japan) with a self-tolerance error of less than 0.03 mm was used for the measurements. The display of the caliper was hidden from the participant to avoid bias. The same caliper was used for all measurements. All sizes were made to the nearest 0.01 mm.
Next, the participant measured the IPD with the HMD and adjusted the device according to the manufacturer’s instructions. IPD measurements and calibration were performed automatically using a built-in camera. After changing the interfocal distance, the visibility of the displayed 3D-CG model was verified for the absence of issues. The dental arch width diameter of the 3D-CG model was then performed three times with the HMD.
Then, the participant measured the dental arch width diameter of the 3D-CG model three times with the SRD.
Finally, the participant evaluated the distinctness and three-dimensionality of each AR device using the visual analog scale (VAS); VAS scores ranged from 0% to 100% (100% = equivalent to the Model). Three-dimensionality is defined as the degree to which the participant perceived three-dimensional depth without any inconvenience.
Distinctness is defined as the degree of accuracy with which the participant could see the 3D-CG model compared to the Model.
Two weeks later, the Model, HMD, and SRD were measured at SP + horizontal to verify accuracy.
Figure 10 shows the 3D-CG model for the HMD measurement, and Figure 11 shows the 3D-CG model for the SRD measurement.
Photographs were created using a capture function and a camera. The participant can evaluate in three dimensions by the parallax obtained from the left and right views. The started photo will be different from the actual visual information.

2.3. Statistical Analysis
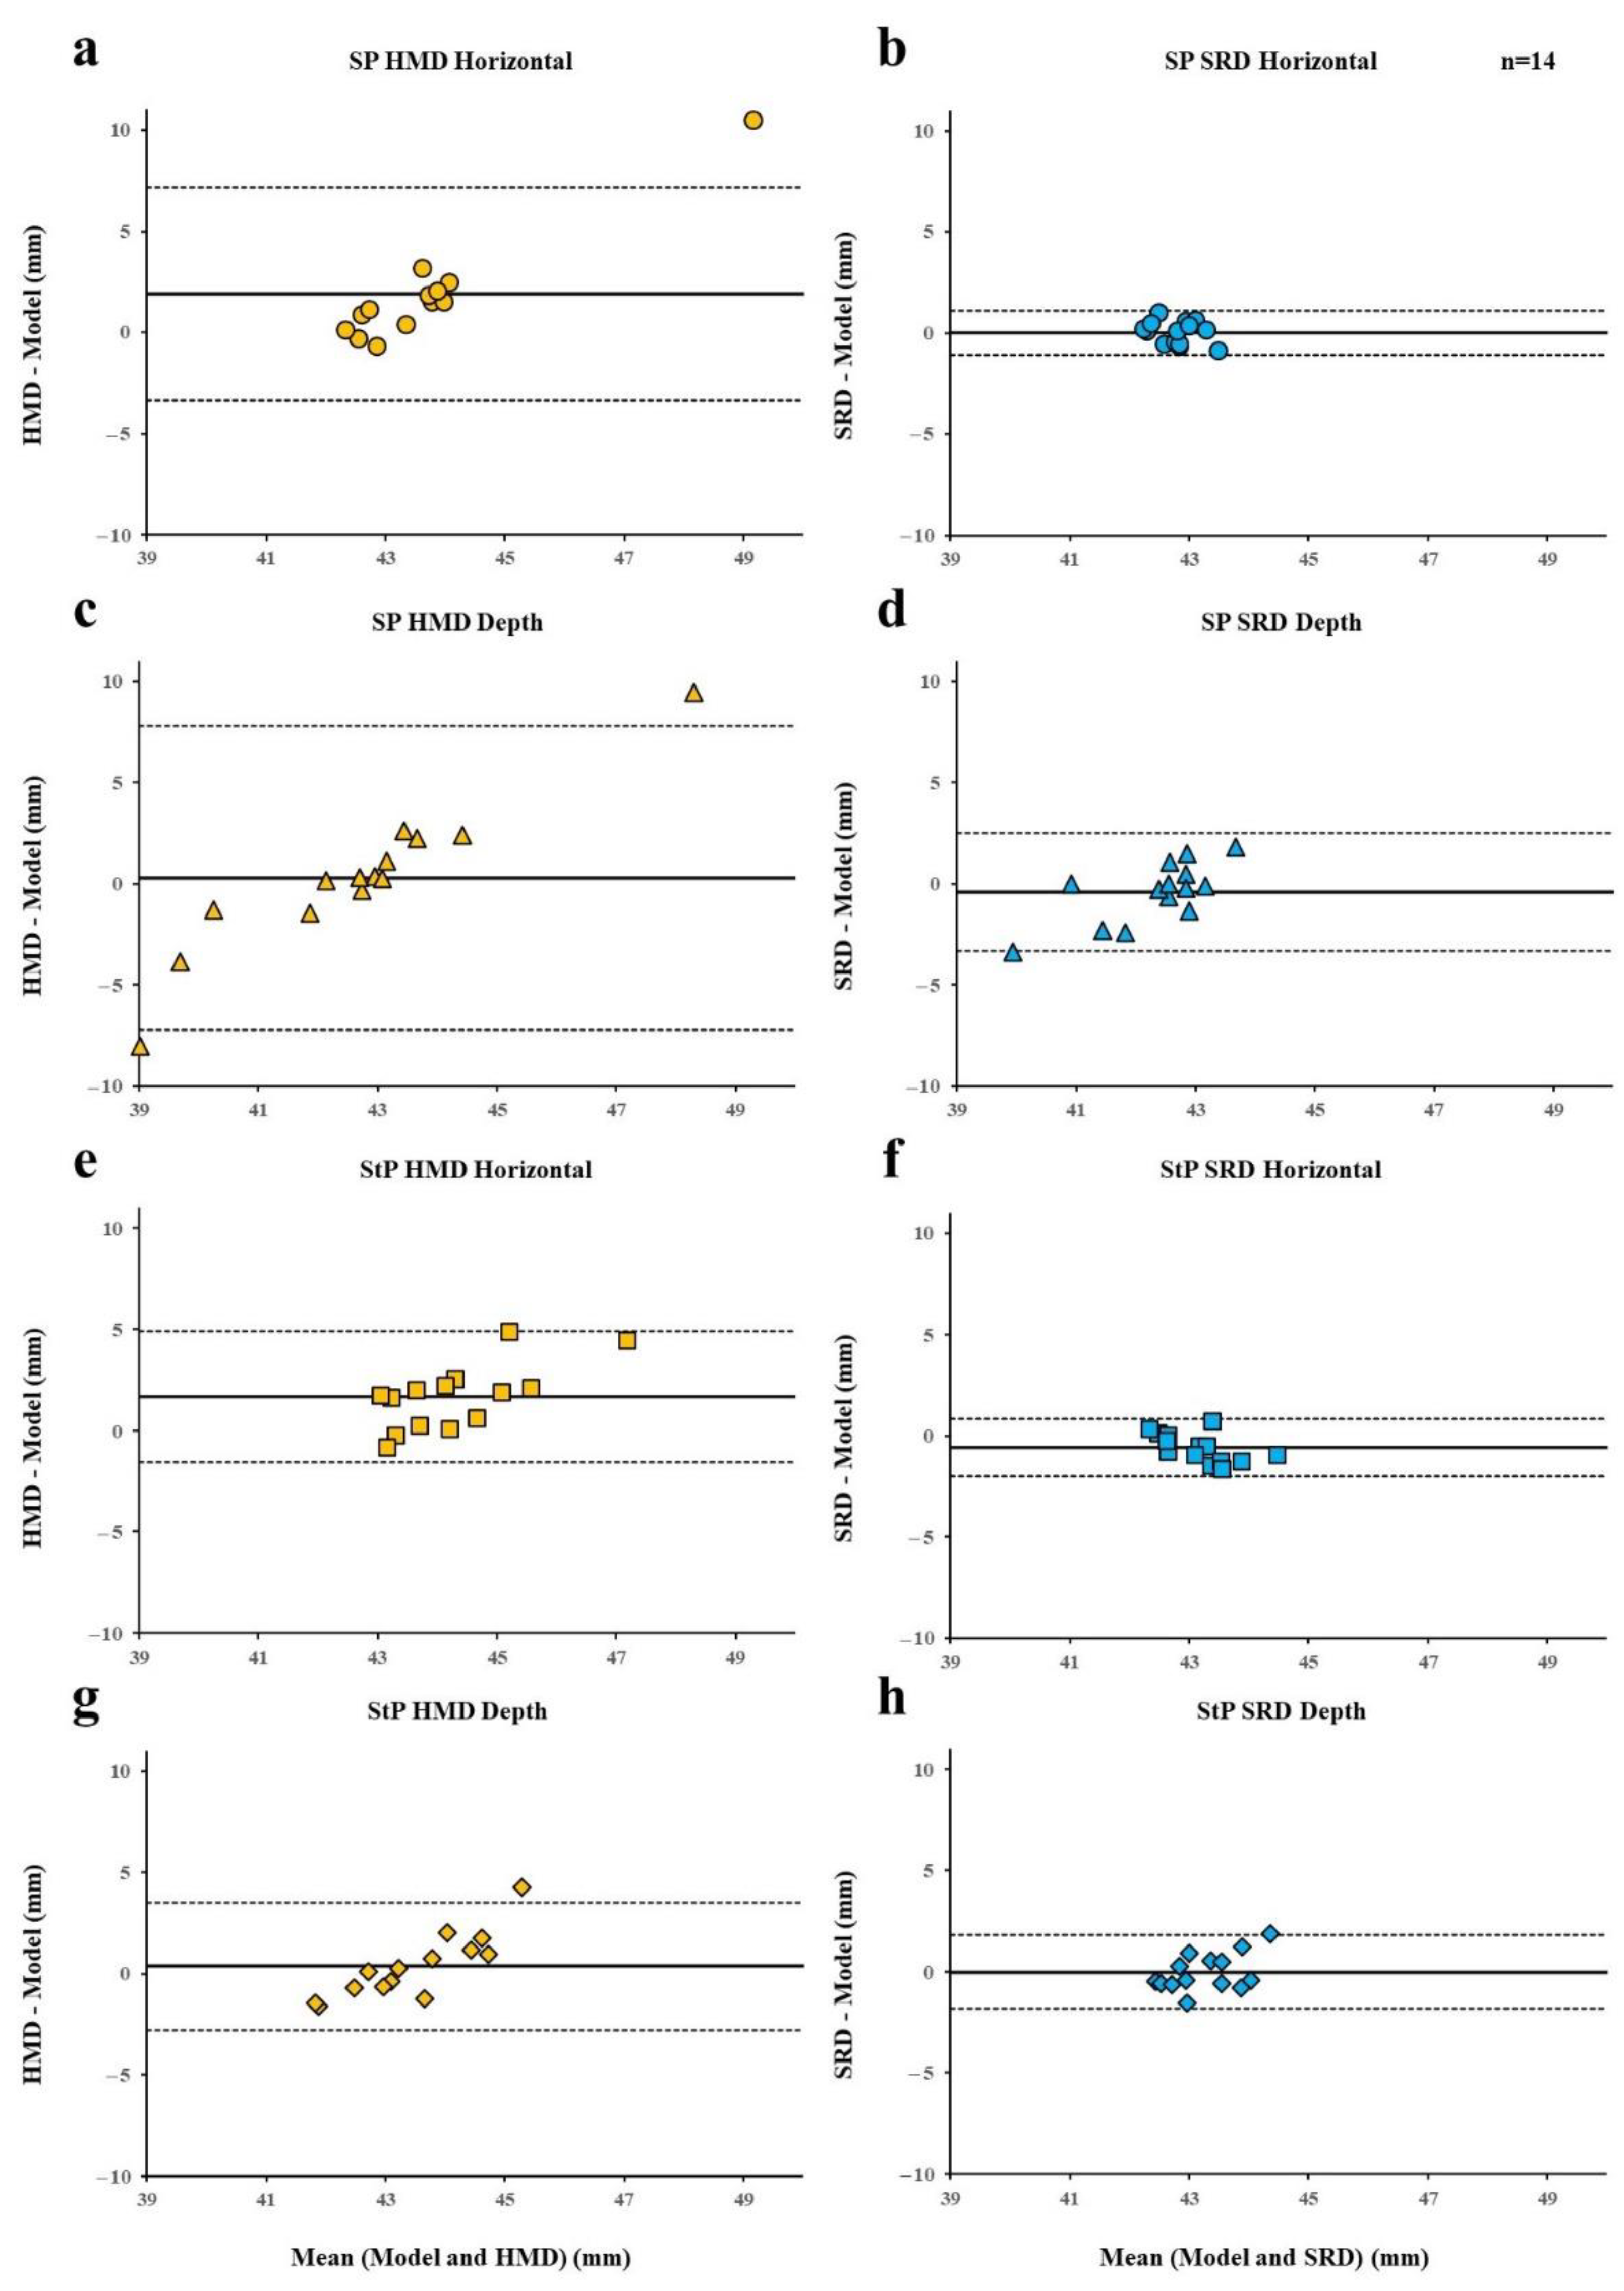
Statistical processing was performed using the SPSS statistical package version 25 SPSS (IBM, Chicago, IL, USA).
The intra-class correlation (ICC) was used to validate the reliability of the raters based on the horizontal Model measurements of the first and second SPs. Plots of the limits of agreement were created and compared using Bland–Altman analysis. The Wilcoxon signed-rank test was used to analyze the HMD, SRD, and Model values. Model measurements were used instead of ground-truth. The reason for this is that there may be individual differences in the selection of measurement points due to occlusal morphology when measuring the dental arch width diameter. Statistical significance was set at p < 0.01 based on the number of tests required. Bland–Altman analysis was used to compare the deviations of the HMD and SRD measurements from the Model values for the same participants. Pearson’s correlation coefficients were used to examine the relationship between distinctness, three-dimensionality VAS scores, and measurement accuracy.

3. Results

3.1. Measurement Value

The person taking the measurement verified that there was no problem with the visibility of the 3D-CG model.
Comparing the measured values for the four parameters of the direction and posture, SP + horizontal (Model, 42.77 ± 0.38; HMD, 44.70 ± 0.78; T = 6 p = 0.0035) and StP + horizontal (Model, 43.46 ± 0.33; HMD, 45. 16 ± 0.61; T = 5 p = 0.0028) showed significantly higher values.
On the other hand, the difference between the SRD and Model values ranged from 0.02 ± 0.32 mm to 0.59 ± 0.37 mm, and there was no significant difference between the SRD and Model values for any of the items.
HMD showed significantly larger values than SRD for SP + horizontal (HMD, 44.70 ± 0.78; SRD, 42.80 ± 0.32; T = 7 p = 0.0042) and StP + horizontal (HMD, 45.16 ± 0.61; SRD, 42.87 ± 0.37; T = 0, p = 0.00098). Table 1 shows the measured values.

3.2. Consistency

The results of the horizontal measurements in the SP, which were re-measured after 2 weeks, confirmed no reliability issues (ICC > 0.78). From the Bland–Altman analysis, 14 out of 14 raters obtained results within the confidence interval for the Model, 12 out of 14 for HMD, and 13 out of 14 for SRD. Table 2 shows the results of the ICC. Figure 12 shows the results of the Bland–Altman analysis.

3.3. Reproducibility

Bland–Altman analysis was used to evaluate the differences between the measurements of the AR device and the control model. Horizontal and SRD measurements in the StP for the HMD were consistent with the Model values for all the items. Figure 13 and Figure 14 show the Bland–Altman analyses.

3.4. Visibility

The mean VAS scores for distinctness (HMD: 57.5 ± 17.2, SRD: 88.7 ± 7.3, T = 0 p = 0.00015) showed significant differences. The person taking the measurement pointed out that the overlap between the caliper and 3D-CG model resulted in a challenge with measurements with the HMD.
The means of the three-dimensionality scores were 72.4 ± 14.6 for HMD and 83.6 ± 14.6 for SRD, which were not significantly different.
Figure 15 shows the VAS score of distinctness and three-dimensionality.
There was no correlation between distinctness and three-dimensionality related to the measurement error of the Model values. However, SRD distinctness and three-dimensionality showed a very high positive correlation (distinctness, 88.7 ± 7.27; third-dimension, 83.6 ± 14.6; r = 0.93 p = 0.00). The results show a highly positive correlation. Table 3 shows the correlations between measurement error, distinctness, and three-dimensionality.

4. Discussion

In this experiment, two different AR device systems, HMD and SRD, were used to evaluate the visibility of 3D-CG models displayed stereoscopically in space. The Bland–Altman analysis suggested good agreements between the Model, HMD, and SRD measurements. The SRD and HMD measurements showed a minor variance. This experiment showed significant differences in the horizontal measurements in the SP and StP for the HMDs. The clinical accuracy of HMD for up to 5.0 mm has been previously reported [16,18].
The SRD showed no significant difference across all the measurements; the range of the differences from the Model measurement was −0.58~0.02 mm. The VAS scores showed significant differences in the distinctness of HMDs and SRDs. It has been reported that 3D objects displayed on HMDs can overlap with the actual surgical field and block the view [4]. It is thought that the overlap between the caliper tip and the object caused a variation in the measurements. However, the measured values did not show any correlations between the distinctness and the three dimensions. Problems with convergence distance and focal length have been reported when using HMDs [19], and HMDs at distances closer than 1.0 m can cause visual strain. The positional relationship between the eye, the AR monitor, and the object at a close range has also been reported to cause convergence and adjustment conflicts [20].
In this experiment, the object-head position was set at approximately 30.0 cm for SP and 70.0 cm for StP. The suboptimal distance of the HMD may have influenced the large measurement values. The recommended working distance was used for the SRD.
SRD may reduce the effects of congestion and adjustment conflicts that occur with traditional HMDs.

5. Conclusions

In this experiment, we evaluated the visibility of the 3D-CG model within 1.0 m for the HMD and SRD. The measured error ranged from 0.29 to 1.92 mm for HMD and 0.02 to 0.59 mm for SRD. There is a specification limitation for using a HMD within 1.0 m, as shown by the measured values. The recommended distance for SRD is 35.0 to 70.0 cm, which is different from that of conventional HMD for stereoscopic viewing. The accuracy of the SRD is comparable to that of the Model values. The accuracy of SRD was comparable to that of the Model. It is crucial to consider the characteristics of each device when selecting AR devices for use in the future. For example, SRD has shown certain advantages in dentistry, which requires close range and high accuracy. In this study, we evaluated the accuracy of 3D-CG models displayed stereoscopically in space using two different AR device systems. We hope that the results of this research will contribute to the selection of the right device for the right job.

Author Contributions

Conceptualization, M.A.,T.I. and S.K.; methodology, M.A., T.I. and S.K.; software, M.A. and T.I.; validation, M.A., T.I., S.K. and T.Y.; formal analysis, M.A., T.I. and S.K.; investigation, M.A., T.I. and S.K.; resources, T.I., S.K., and T.Y.; data curation, M.A., T.I. and S.K.; writing—original draft preparation, M.A. and S.K.; writing—review and editing, M.A., T.I., S.K. and T.Y.; visualization, M.A., T.I. and S.K.; supervision, T.I., S.K. and T.Y.; project administration, T.I. and T.Y.; funding acquisition, T.I., S.K. and T.Y. All authors have read and agreed to the published version of the manuscript.

Funding

This research received no external funding.

Institutional Review Board Statement

Not applicable.

Informed Consent Statement

Not applicable.

Data Availability Statement

The data presented in this study are available from the corresponding author upon request.

Acknowledgments

We appreciate the public availability of the technical information about the spatial reality display ELF-SR1 on the Sony Group Corporation website and thank Takumi Imai in the Department of Medical Statistics, Graduate School of Medicine and Faculty of Medicine, Osaka City University, for the statistics, valuable advice, and comments on this treatment.

Conflicts of Interest

The authors declare no conflict of interest.

References

  1. Yeung, A.W.K.; Tosevska, A.; Klager, E.; Eibensteiner, F.; Laxar, D.; Stoyanov, J.; Glisic, M.; Zeiner, S.; Kulnik, S.T.; Crutzen, R.; et al. Virtual and Augmented Reality Applications in Medicine: Analysis of the Scientific Literature. J. Med. Internet Res. 2021, 23, e25499. [Google Scholar] [CrossRef] [PubMed]
  2. Sutherland, J.; Belec, J.; Sheikh, A.; Chepelev, L.; Althobaity, W.; Chow, B.; Mitsouras, D.; Christensen, A.; Rybicki, F.J.; La Russa, D. Applying Modern Virtual and Augmented Reality Technologies to Medical Images and Models. J. Digit. Imaging 2019, 32, 38–53. [Google Scholar] [CrossRef]
  3. Mitsuno, D.; Ueda, K.; Itamiya, T.; Nuri, T.; Otsuki, Y. Intraoperative Evaluation of Body Surface Improvement by an Augmented Reality System That a Clinician Can Modify. Plast. Reconstr. Surg. Glob. Open 2017, 5, e1432. [Google Scholar] [CrossRef] [PubMed]
  4. Carl, B.; Bopp, M.; Saß, B.; Pojskic, M.; Voellger, B.; Nimsky, C. Spine Surgery Supported by Augmented Reality. Glob. Spine J. 2020, 10, 41S–55S. [Google Scholar] [CrossRef] [PubMed]
  5. Zhao, J.; Xu, X.; Jiang, H.; Ding, Y. The effectiveness of virtual reality-based technology on anatomy teaching: A meta-analysis of randomized controlled studies. BMC Med. Educ. 2020, 20, 127. [Google Scholar] [CrossRef] [PubMed]
  6. Dennler, C.; Bauer, D.E.; Scheibler, A.-G.; Spirig, J.; Götschi, T.; Fürnstahl, P.; Farshad, M. Augmented reality in the operating room: A clinical feasibility study. BMC Musculoskelet. Disord. 2021, 22, 451. [Google Scholar] [CrossRef] [PubMed]
  7. Al Janabi, H.F.; Aydin, A.; Palaneer, S.; Macchione, N.; Al-Jabir, A.; Khan, M.S.; Dasgupta, P.; Ahmed, K. Effectiveness of the HoloLens mixed-reality headset in minimally invasive surgery: A simulation-based feasibility study. Surg. Endosc. 2020, 34, 1143–1149. [Google Scholar] [CrossRef] [PubMed] [Green Version]
  8. Sytek, L.; Inglehart, M.R.; Ramaswamy, V.; Aronovich, S.; Edwards, S.; Kim-Berman, H. Comparisons of orthodontic residents’ performance and attitudes using 2D, 3D, and virtual reality surgical simulation methods. J. Dent. Educ. 2021, 85, 1415–1426. [Google Scholar] [CrossRef] [PubMed]
  9. Zitzmann, N.U.; Matthisson, L.; Ohla, H.; Joda, T. Digital Undergraduate Education in Dentistry: A Systematic Review. Int. J. Environ. Res. Public Health 2020, 17, 3269. [Google Scholar] [CrossRef] [PubMed]
  10. Rasmussen, T.; Penfield, W. Further studies of the sensory and motor cerebral cortex of man. Fed. Proc. 1947, 6, 452–460. [Google Scholar] [PubMed]
  11. Wang, Y.; Zhai, G.; Chen, S.; Min, X.; Gao, Z.; Song, X. Assessment of eye fatigue caused by head-mounted displays using eye-tracking. Biomed. Eng. Online 2019, 18, 111. [Google Scholar] [CrossRef] [PubMed] [Green Version]
  12. Condino, S.; Turini, G.; Parchi, P.D.; Viglialoro, R.M.; Piolanti, N.; Gesi, M.; Ferrari, M.; Ferrari, V. How to Build a Patient-Specific Hybrid Simulator for Orthopaedic Open Surgery: Benefits and Limits of Mixed-Reality Using the Microsoft HoloLens. J. Health Eng. 2018, 2018, 5435097. [Google Scholar] [CrossRef] [PubMed]
  13. Eye-Sensing Light Field Display. Available online: https://www.sony.com/en/SonyInfo/technology/stories/LFD/ (accessed on 25 May 2021).
  14. Chang, F.; Laguna, B.; Uribe, J.; Vu, L.; Zapala, M.A.; Devincent, C.; Courtier, J. Evaluating the Performance of Augmented Reality in Displaying Magnetic Resonance Imaging–Derived Three-Dimensional Holographic Models. J. Med. Imaging Radiat. Sci. 2020, 51, 95–102. [Google Scholar] [CrossRef] [PubMed]
  15. Itamiya, T.; To, M.; Oguchi, T.; Fuchida, S.; Matsuo, M.; Hasegawa, I.; Kawana, H.; Kimoto, K. A Novel Anatomy Education Method Using a Spatial Reality Display Capable of Stereoscopic Imaging with the Naked Eye. Appl. Sci. 2021, 11, 7323. [Google Scholar] [CrossRef]
  16. Jiang, T.; Yu, D.; Wang, Y.; Zan, T.; Wang, S.; Li, Q. HoloLens-Based Vascular Localization System: Precision Evaluation Study With a Three-Dimensional Printed Model. J. Med. Internet Res. 2020, 22, e16852. [Google Scholar] [CrossRef] [PubMed]
  17. Park, S.; Bokijonov, S.; Choi, Y. Review of Microsoft HoloLens Applications over the Past Five Years. Appl. Sci. 2021, 11, 7259. [Google Scholar] [CrossRef]
  18. Schneider, M.; Kunz, C.; Pal’A, A.; Wirtz, C.R.; Mathis-Ullrich, F.; Hlaváč, M. Augmented reality–assisted ventriculostomy. Neurosurg. Focus 2021, 50, E16. [Google Scholar] [CrossRef] [PubMed]
  19. Pladere, T.; Luguzis, A.; Zabels, R.; Smukulis, R.; Barkovska, V.; Krauze, L.; Konosonoka, V.; Svede, A.; Krumina, G. When virtual and real worlds coexist: Visualization and visual system affect spatial performance in augmented reality. J. Vis. 2021, 21, 17. [Google Scholar] [CrossRef] [PubMed]
  20. Singh, G.; Ellis, S.R.; Ii, J.E.S. The Effect of Focal Distance, Age, and Brightness on Near-Field Augmented Reality Depth Matching. IEEE Trans. Vis. Comput. Graph. 2020, 26, 1385–1398. [Google Scholar] [CrossRef] [PubMed] [Green Version]
Figure 1. The positional relationship between the eyes, 3D-CG model, an augmented reality (AR) device, and objects (e.g., calipers). In the head-mounted display (HMD), the yellow area is in front of the 3D-CG model, and overlapping objects (e.g., calipers) are displayed. For the spatial reality display (SRD), the blue area is behind the 3D-CG model, and it is displayed without overlapping the object (e.g., calipers).
Applsci 11 12076 g001
Figure 2. Standard model with a mark on the measurement cusp.
Applsci 11 12076 g002
Figure 3. Digital model with a mark on the measurement cusp.
Applsci 11 12076 g003
Figure 4. 3D-CG model displayed on HMD.
Applsci 11 12076 g004
Figure 5. 3D-CG model displayed on SRD.
Applsci 11 12076 g005
Figure 6. Measurement in the horizontal direction.
Applsci 11 12076 g006
Figure 7. Measurement in the direction of the depth.
Applsci 11 12076 g007
Figure 8. The positional relationship between the person taking the measurement and the measured object at SP.
Applsci 11 12076 g008
Figure 9. The positional relationship between the person taking the measurement and the measured object in the StP.
Applsci 11 12076 g009
Figure 10. 3D-CG model at the time of measurement by HMD.
Applsci 11 12076 g010
Figure 11. 3D-CG model at the time of measurement by SRD.
Applsci 11 12076 g011
Figure 12. Bland–Altman analysis of first and second measurements. Scatter plots of Bland–Altman limits for SP + Model + Horizontal (a). Bland–Altman plot of SP + Model + Horizontal measurements (b). Scatter plots of Bland–Altman limits for SP + HMD + Horizontal (c). Bland–Altman plot of SP + HMD + Horizontal measurements (d). Scatter plots of Bland–Altman limits for SP + SRD + Horizontal (e). Bland–Altman plot of SP + SRD + Horizontal measurements (f).
Applsci 11 12076 g012
Figure 13. Scatter plot of the Bland–Altman match limits for the measurements by condition. SP + HMD + Horizontal (a). SP + SRD + Horizontal (b). SP + HMD + Depth (c). SP + SRD + Depth (d). StP + HMD + Horizontal (e). StP + SRD + Horizontal (f). StP + HMD + Depth (g) and StP + SRD + Depth (h).
Applsci 11 12076 g013
Figure 14. Bland–Altman analysis of the measurements by condition. SP + HMD + Horizontal measurements (a). SP + SRD + Horizontal measurements (b). SP + HMD + Depth measurements (c). SP + SRD + Depth measurements (d). StP + HMD + Horizontal measurements (e). StP + SRD + Horizontal measurements (f). StP + HMD + Depth measurements (g) and StP + SRD + Depth measurements (h).
Applsci 11 12076 g014
Figure 15. Three-dimensionality and distinctness of HMD and SRD compared with those of the Model.
Applsci 11 12076 g015
Table 1. Aggregation of measurement results.
PostureDirectionMeanSD
ModelSPHorizontal42.770.38
Depth42.520.40
StPHorizontal43.460.33
Depth43.290.37
HMDSPHorizontal *,†44.700.78
Depth42.821.55
StPHorizontal ‡,§45.160.61
Depth43.661.00
SRDSPHorizontal42.800.32
Depth42.110.77
StPHorizontal42.870.37
Depth43.270.63
Model, control model; HMD, head-mounted display; SRD, spatial reality display; SP, sitting posture; StP, standing posture; SD, standard deviation. Wilcoxon signed-rank test (α = 0.01). *: HMD + SP + Horizontal vs. Model + SP + Horizontal (T = 6 p = 0.0035). : HMD + SP + Horizontal vs. SRD + SP + Horizontal (T = 5 p = 0.0028). : HMD + StP + Horizontal vs. Model + StP + Horizontal (T = 7 p = 0.0042). §: HMD + StP + Horizontal vs. SRD + StP + Horizontal (T = 0 p = 0.00098).
Table 2. Intra-rater reliability of 14 raters.
Intra-Rater Reliability
ICC95% Confidence Intervalp
SP + HorizontalModel0.790.55 to 0.920.00 *
HMD0.790.56 to 0.920.00 *
SRD0.780.54 to 0.920.00 *
ICC, intra-class correlation. * p-value < 0.01.
Table 3. Measurement error and correlation coefficients of distinctness and three-dimensionality.
DistinctnessThree-Dimensionality
rp Valuerp Value
HMDSPHorizontal0.4840.0790.2320.426
Depth0.1980.4980.0260.931
StPHorizontal0.0370.9000.0170.954
Depth0.1850.5270.1220.678
SRDSPHorizontal0.1280.6630.0980.738
Depth0.2850.3230.2300.429
StPHorizontal0.1370.6420.1190.685
Depth0.0370.9000.0430.885
HMD Three-dimensionality0.4130.142
SRD Three-dimensionality *0.9270.000
Pearson’s correlation coefficients (α = 0.01). * SRD + distinctness vs. SRD + three-dimensionality (p = 0.000).
Publisher’s Note: MDPI stays neutral with regard to jurisdictional claims in published maps and institutional affiliations.

