1. Introduction
As the heart has a central role in human health, assessing its condition is a prime concern for healthcare professionals. The easiest way to do this non-invasively is by using a stethoscope to listen to the heartbeat on the chest. Sounds convey useful information about the functioning of the heart, allowing cardiologists to identify abnormalities. Recordings of heart sounds are referred to as phonocardiograms (PCGs). Generally, each beat consists of two sounds, S1 and S2, and various algorithms have been developed to analyze them.
Another non-invasive method is measuring the electrical activity of the heart, resulting in an electrocardiogram (ECG). In this technique, electrodes are placed around the chest and other anatomically specified parts of the body. To obtain a complete view of ECG signals, medical standard ECG measurements use 12 leads. Other applications, such as wearable ECG straps, make do with fewer electrodes, commonly three. ECG signals allow the study of heart rate variability (HRV), which represents variation in inter-beat intervals. HRV analysis has a wide application range, not only in the medical field, but also in engineering, including affective computing.
Cardiac activities cause corresponding mechanical movements and vibrations in skin. Usually, such movements are easy to sense above arteries in the neck, wrist, and chest. Pioneered by Baevski, accelerometer-based chest vibration measurement is known as seismocardiography (SCG) [
1]. Similar to PCG, a typical accelerometer signal includes S1 and S2 waves of each cardiac cycle. In this study, we use S1′ and S2′ to indicate waves in the SCG signal to avoid confusion with S1 and S2 in the PCG signal.
Accelerometers provide simple and affordable instrumentation, but the user must deal with several challenges; for example, if subjects move during measurements, the accelerometer will capture these motions. Since the accelerometer is very sensitive, even small environmental vibration may induce noise [
2]. Other challenges include respiration and coughing.
Measuring adults in the clinical setting is not very difficult, because the patient can be instructed to stay still during the measurement. With infants and small children, however, this may prove more of a challenge. Another demanding task is measuring subjects during normal daily activities, such as walking and running, because motion artefact corrupts the signals.
Considering several important fiducial points, such as aortic valve opening (AO) and closure (AC), SCG holds great potential for clinical applications, including the assessment of myocardial contractility. It provides a non-invasive estimate of hemodynamic parameters [
3] and left ventricular performance in patients with cardiac disease via systolic time intervals [
1] as well as a non-invasive monitoring of stroke volume and cardiac time intervals [
4]. Moreover, SCG can be used to estimate pre-ejection period (PEP) [
5]. Examples such as these provide evidence that the method offers great promise. In addition, it complements ECG by providing information about the mechanical behavior of the heart [
6].
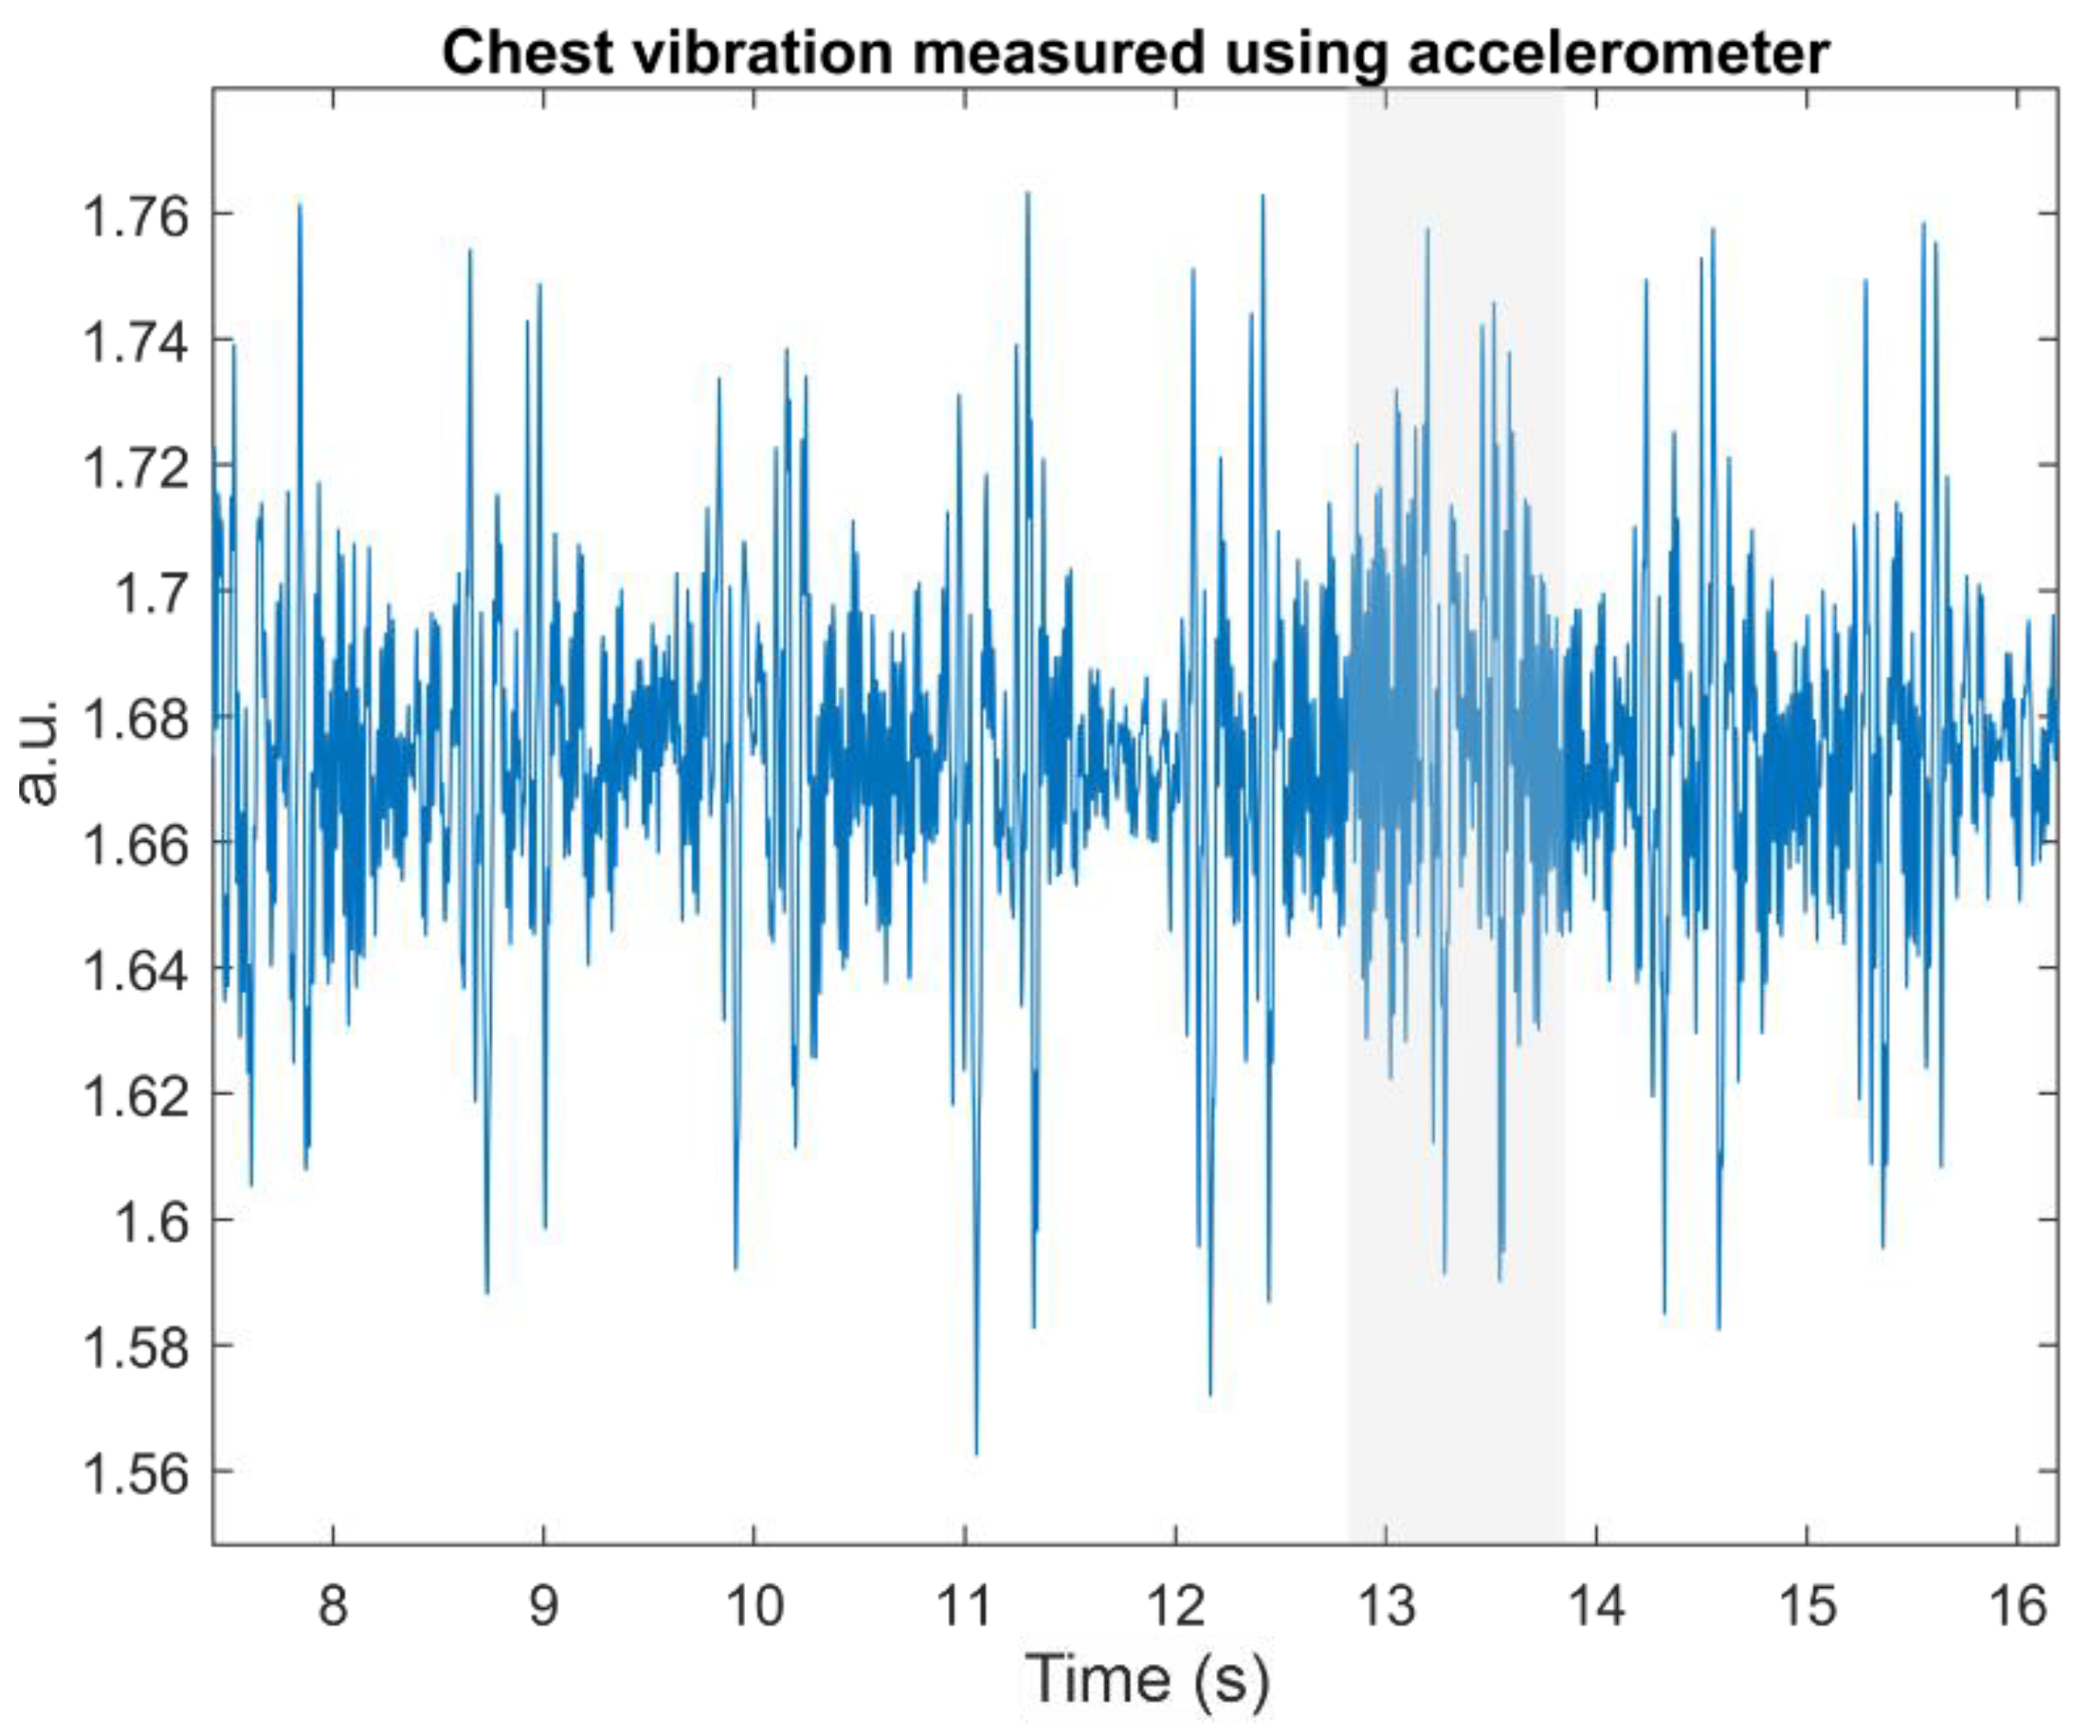
Figure 1 shows a typical SCG signal measured from the chest; corresponding signals can also be harvested with an accelerometer above the carotid artery. Chuo et al. labeled S1′ and S2′ as the systolic and diastolic phase [
7], respectively, while AO and AC represent the peak of the systolic and diastolic phase.
In
Figure 1, we can clearly see that, although the S1′ and S2′ waves around the 13th second are corrupted (see the shaded area in
Figure 1), both waves are still visible. Analogous to S1 and S2, S1′ tends to exhibit a larger amplitude than S2′.
Figure 1 also shows that a series of S1′ followed by S2′ builds the whole cardiac activity signal. The distance between S1′ and S2′ within the same cardiac cycle is shorter than that of S2′ from the current beat and S1′ from the next beat. We can use these facts to get individual pairs of S1′ and S2′. This can be easily done with a low heart rate.
A series of AO timings can be used to calculate heart rate. Furthermore, researchers also use AO to estimate blood pressure based on pulse transit time (PTT) between biosignals, such as ECG, and accelerometer data from, for example, the carotid artery on the neck [
8]. Thus, AO detection is of high interest and requires robust algorithms to handle noisy signals resulting from motions and vibrations caused by factors other than cardiac activity.
A list of weaknesses of SCG, compiled by Zanetti and Tavakolian, includes complex waveforms that are difficult to interpret [
1]. SCG signals also vary by age, sex, heart condition and body position [
5,
9]. However, these facts open various opportunities to develop new signal processing algorithms and improve sensor and instrumentation technology.
Researchers around the globe have been working to find good methods to detect AO automatically. The easiest way to detect AO is using ECG, especially R-peak, as a guideline. Khosrow-Khavar et al. evaluated four different methods, namely, cardiac sound characteristic waveform (CSCW), Shannon, absolute and Hilbert, to get the envelope of SCG signals by utilizing their high-frequency (>20 Hz) and low-frequency (<30 Hz) parts [
10]. Mafi, in turn, used modified signal energy thresholding, empirical mode decomposition (EMD) and empirical wavelet transform to detect AO [
11]. Shafiq et al. measured SCG from adults in a supine position without any tasks and aimed to detect peaks in the systolic phase [
12].
The main problem with the abovementioned methods is that they rely on the availability of ECG signals. However, ECG sensor instrumentation is more demanding than that of SCG. It usually uses several electrodes placed on the subject’s body with good skin–electrode contact. If the main goal is to measure HRV or heartrate (HR), then accelerometers provide easy instrumentation at an affordable price. This calls for methods to detect various important peaks in SCG in the absence of ECG.
Attempting to exclude ECG signals from AO detection, researchers have used cardiac cycle envelope (CCE) detection estimated from SCG as a guide [
13,
14,
15,
16] in combination with signals measured by a 3D gyroscope [
17], a machine learning algorithm [
18], a match-filter [
8] and simple moving average (SMA) [
19]. Although the results are promising, the proposed algorithms suffer from various parameter settings and only work well for good SCG signals, characterized by low noise, clear separation between adjacent cardiac beats and higher peak in the systolic than in the diastolic phase. In addition, most of these algorithms were evaluated against SCG signals measured from mainly healthy adults in a supine position, thereby limiting their applicability. Some algorithms were also too complex and might not be suitable for real-time analysis.
In this paper, we proposed and evaluated two methods to detect AO from only SCG signals for real-time application. The methods relied on the discrete wavelet transform (DWT) either to guide SCG segmentation for each cardiac cycle, prior to AO detection, or to find AO detection directly without segmentation. SCG signals were measured from both children/infants and adults at resting state by using an accelerometer placed on the chest. In addition to a normal resting situation, the developed algorithms were tested using various breathing tasks (adults only).
2. Materials and Methods
2.1. Data Acquisition
In the data acquisition, two types of accelerometers were used. In the first data acquisition, measured by Seppälä [
20], accelerometer model LIS344ALH (high performance 3-axis ±2/±6 g ultra-compact linear accelerometer from STMicroelectronics) was placed on the chest of test subjects (
n = 7, 32 ± 25 months) to measure chest vibrations, while they were sleeping (see
Figure 2, sampled at 5 kHz). A consent letter was signed by the parents, giving permission to use their children’s data. Strong, skin-friendly tape was used to secure the sensor in its position during the measurement. In addition, the sensor cable was secured with tape to minimize noise. As the measurements did not include ECG to exactly mark the peak of S1′, this was done by human visual inspection.
In the second data acquisition, we used a single-axis opto-mechanical accelerometer, which is designed to be used in magnetoencephalography (MEG) and in magnetic resonance imaging (MRI), described in [
21,
22]. In addition, ECG was measured using 3 electrodes. Data was recorded from a group of university students (
n = 9, 28 ± 5 years old) and a consent letter was signed by each subject, giving permission to use their data. This group was asked to perform certain tasks during the measurements, i.e., Sitting, Breath Hold, Valsalva, and Deep Breathing. In addition to these tasks, the subjects were recorded at rest in a supine position. For both children/infants and adults, the accelerometer was placed on the lowest part of the sternum bone [
11].
We were interested in evaluating the performance of the proposed algorithms during different breathing tasks, designed to induce motion artefacts due to chest movement.
Sitting: subjects sat on a chair with no back support for two minutes. This position forces them to stabilize themselves and may induce motion artefacts.
Breath Hold: subjects held their breath for 32 s and breathed normally for 88 s. This series of breathing patterns was repeated three times.
Valsalva: subjects blew into a breathing tube for 30 s followed by a 30 s rest. The procedure was repeated three times.
Deep Breathing: subjects inhaled for five seconds and exhaled for five seconds. This task was repeated six times.
2.2. Signal Enhancement
We can easily segment PCG signals based on the cardiac cycle, because the distance between S2 of the n-th beat and S1 of the (n + 1)-th beat is clear. SCG signals, however, may be another matter, when the amplitudes of S1′ and S2′ are close to each other and a high HR makes the S1′ of the next beat move closer to the S2′ of the current one. For this reason, signal enhancement is essential.
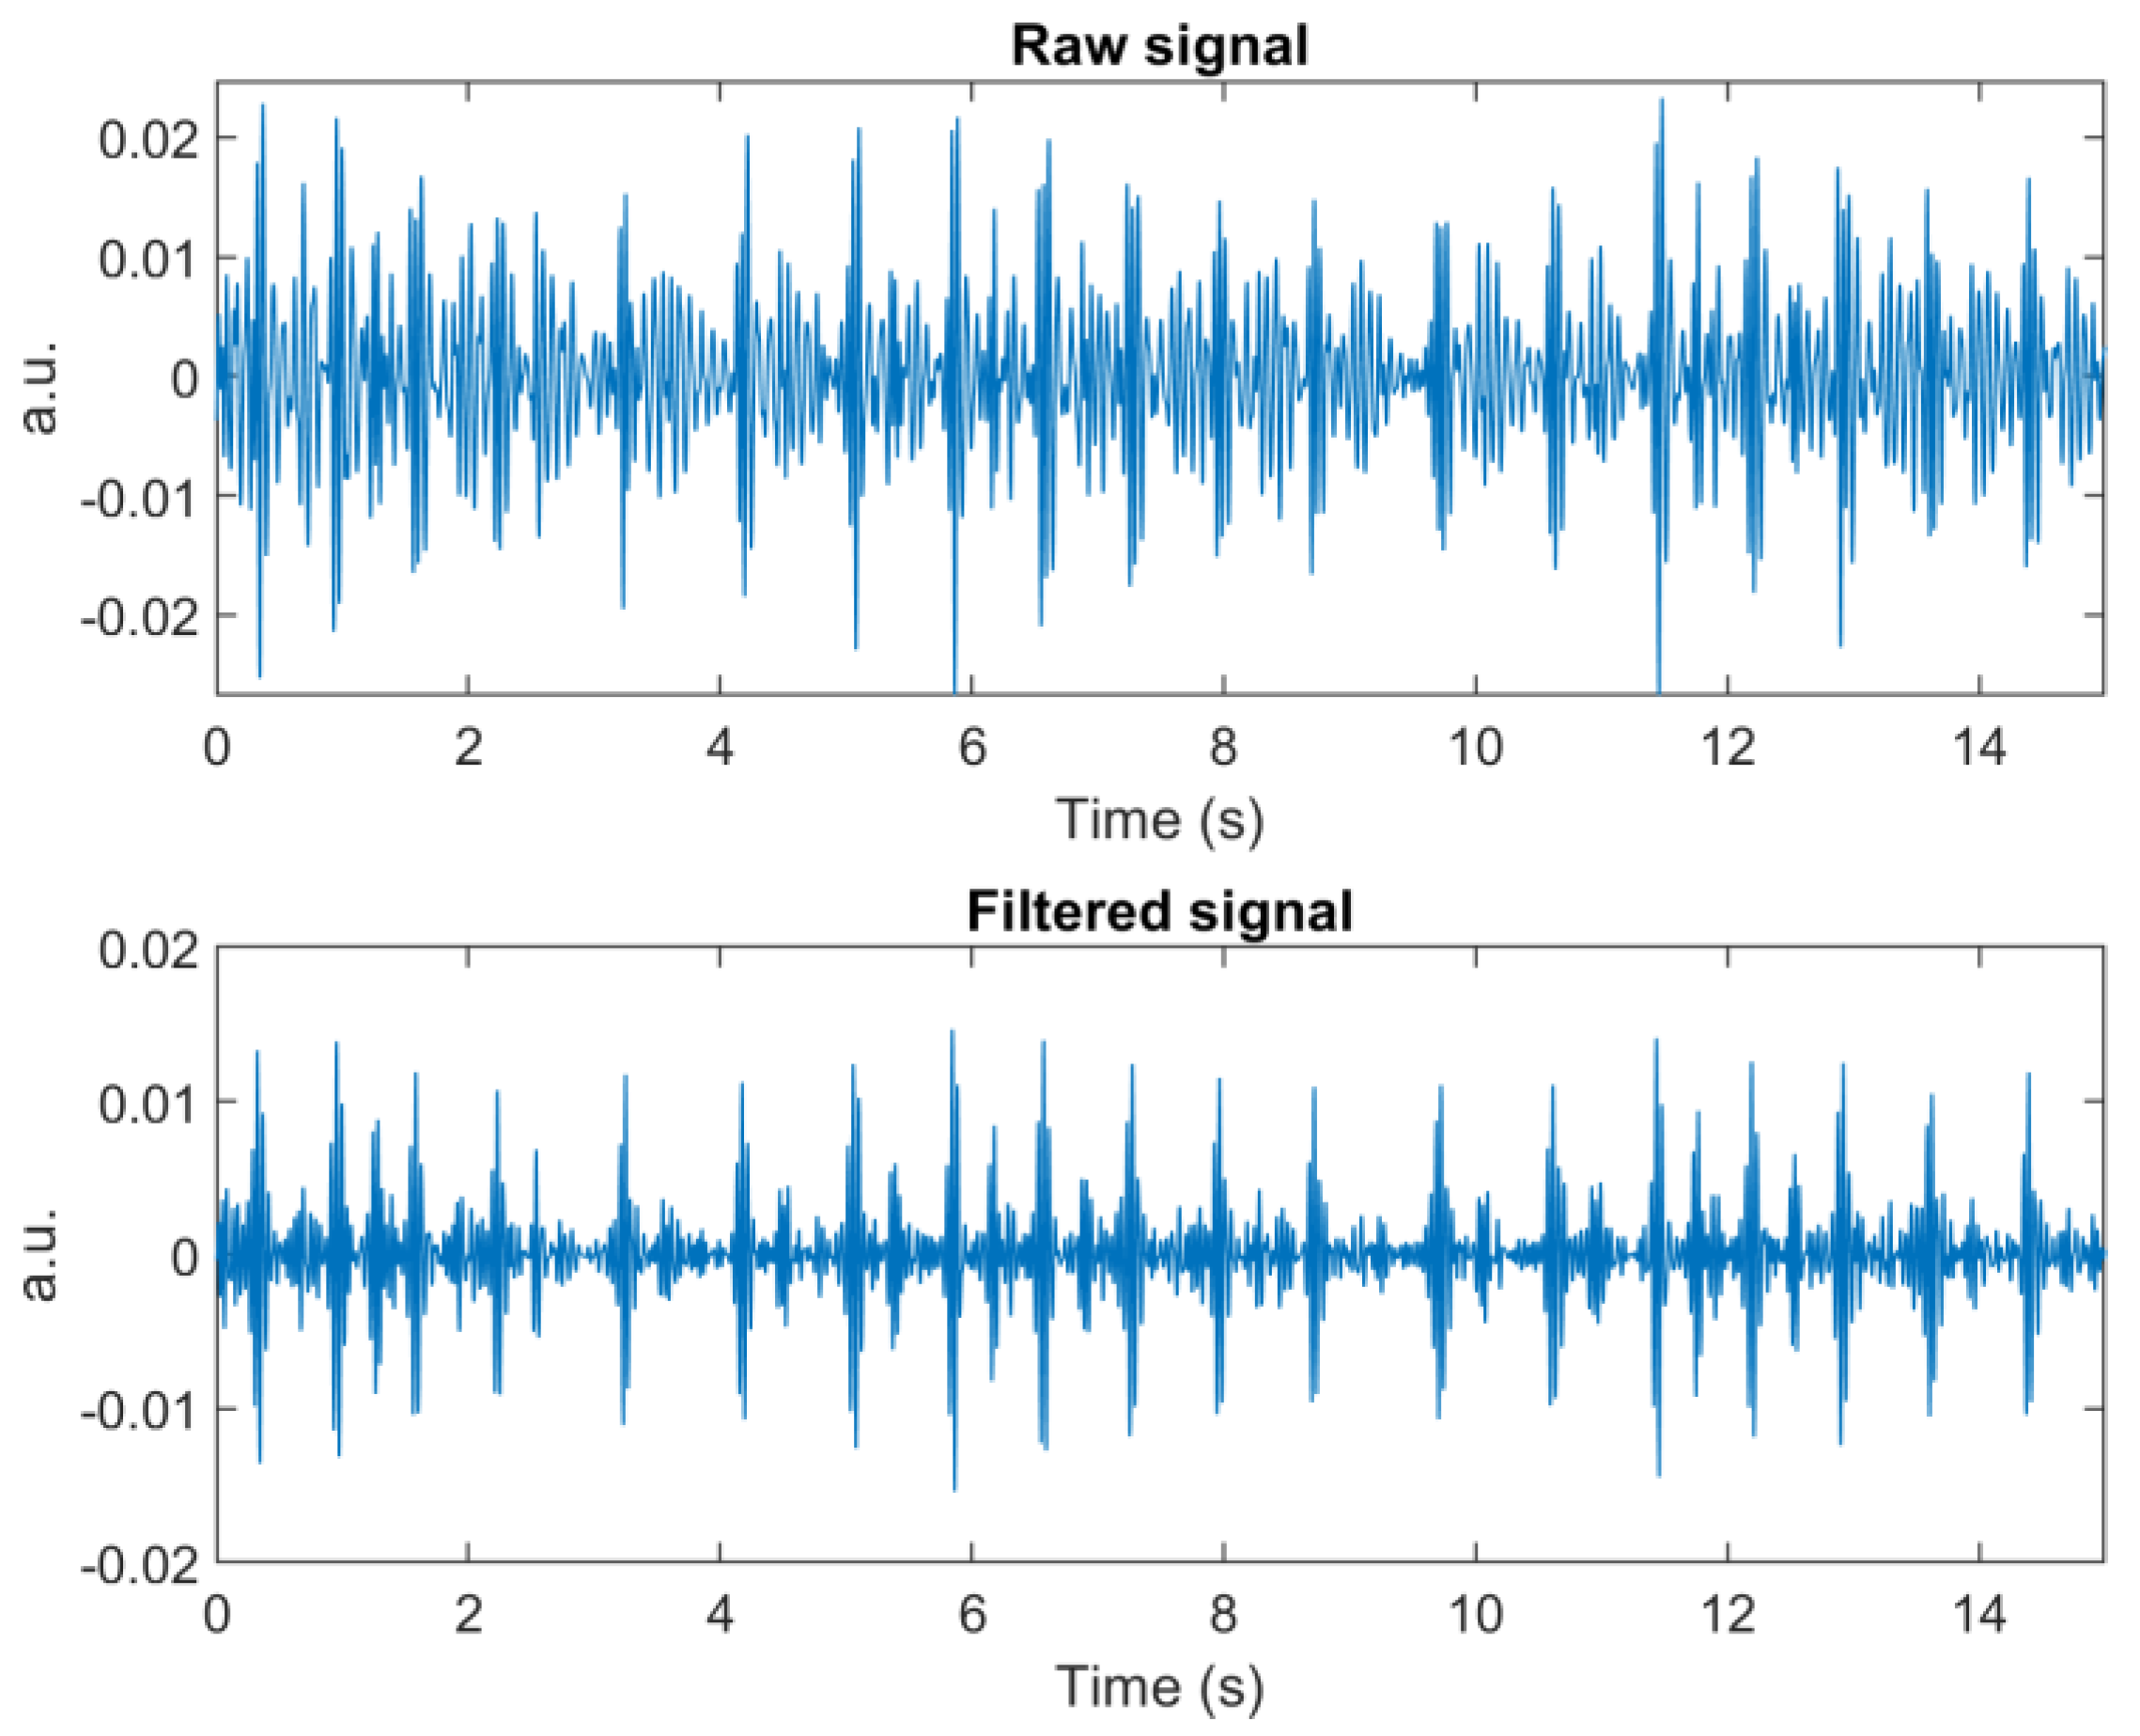
We used an empirical mode decomposition (EMD)-based method for signal enhancement [
23]. Unfortunately, this method was not suitable for real-time application, although it resulted in good, enhanced signals with clear separation for each cardiac cycle. For this reason, we left out this method and used a 5th-order Butterworth bandpass filter at 20–50 Hz to remove high frequency noise, possible baseline wandering, and other low frequency oscillations.
Figure 3 compares raw and enhanced signals using the two methods.
2.3. Method #1: Slice and Detect
Slice and Detect mimics the Zienkiewicz method [
8] by segmenting signals based on the cardiac cycle, and then finding the peak of S1′ for each segment based on a specific window search area. This study proposes another method to replace the template filter method, based on utilising DWT for signal decomposition to guide the segmentation process. Algorithm 1 shows the pseudocode of
Slice and Detect.
| Algorithm 1 Slice and Detect. |
Input: enhanced signal s_enh, level.
Output: positive integer peak_location.- 1.
for all level do - 2.
[app_coef, det_coef] = DWT(s_enh, level(i)). - 3.
s_reconst_1 ← reconstruct signal using the latest detail, det_coef(last). - 4.
corr_coef(i) = corr(s_reconst_1, s_enh). - 5.
chosen_level = max(corr_coef) // chosen_level holds index with the highest value in corr_coeff - 6.
chosen_level ← chosen_level–1. - 7.
s_reconst_2 ← reconstruct from approximation at chosen_level. - 8.
lo_env ← lower envelope of s_reconst_2. - 9.
start_point ← peak locations from lo_env. - 10.
search_window ← 60% of mean distance of peak locations. - 11.
for all start_point (except the last one) do - 12.
if start_point (1) > search_window. - 13.
s_slice ← slice s_enh from the beginning to start_point(1). - 14.
elseif peak_loc(last-1) > search_window - 15.
s_slice ← slice s_enh from start_point(last-1) to the end. - 16.
else - 17.
s_slice ← slice s_enh from start_point(j) to start_point(j + 1). - 18.
peak_loc(j) ← peak location of s_slice.
|
Appropriate mother wavelets are selected based on their similarity to the shape of S1′ and S2′ [
24,
25]. Potential candidates include narrow symmetric wavelets, such as Symlets, Coiflets, Biorthogonal, Reverse biorthogonal, and Fejer–Korovkin wavelets in addition to wide asymmetric ones, such as Daubechies wavelets.
Another critical factor in wavelet decomposition is the number of the decomposition level. We do not want to lose all oscillations, because they are necessary for detecting the peak of S1′. For this reason, we calculate the correlation of the latest Detail, for example, D8 from the eight-decomposition level and the input signal (lines 1 to 4 in Algorithm 1). The level with the highest correlation minus one is selected for that segment (lines 5 to 6 in Algorithm 1).
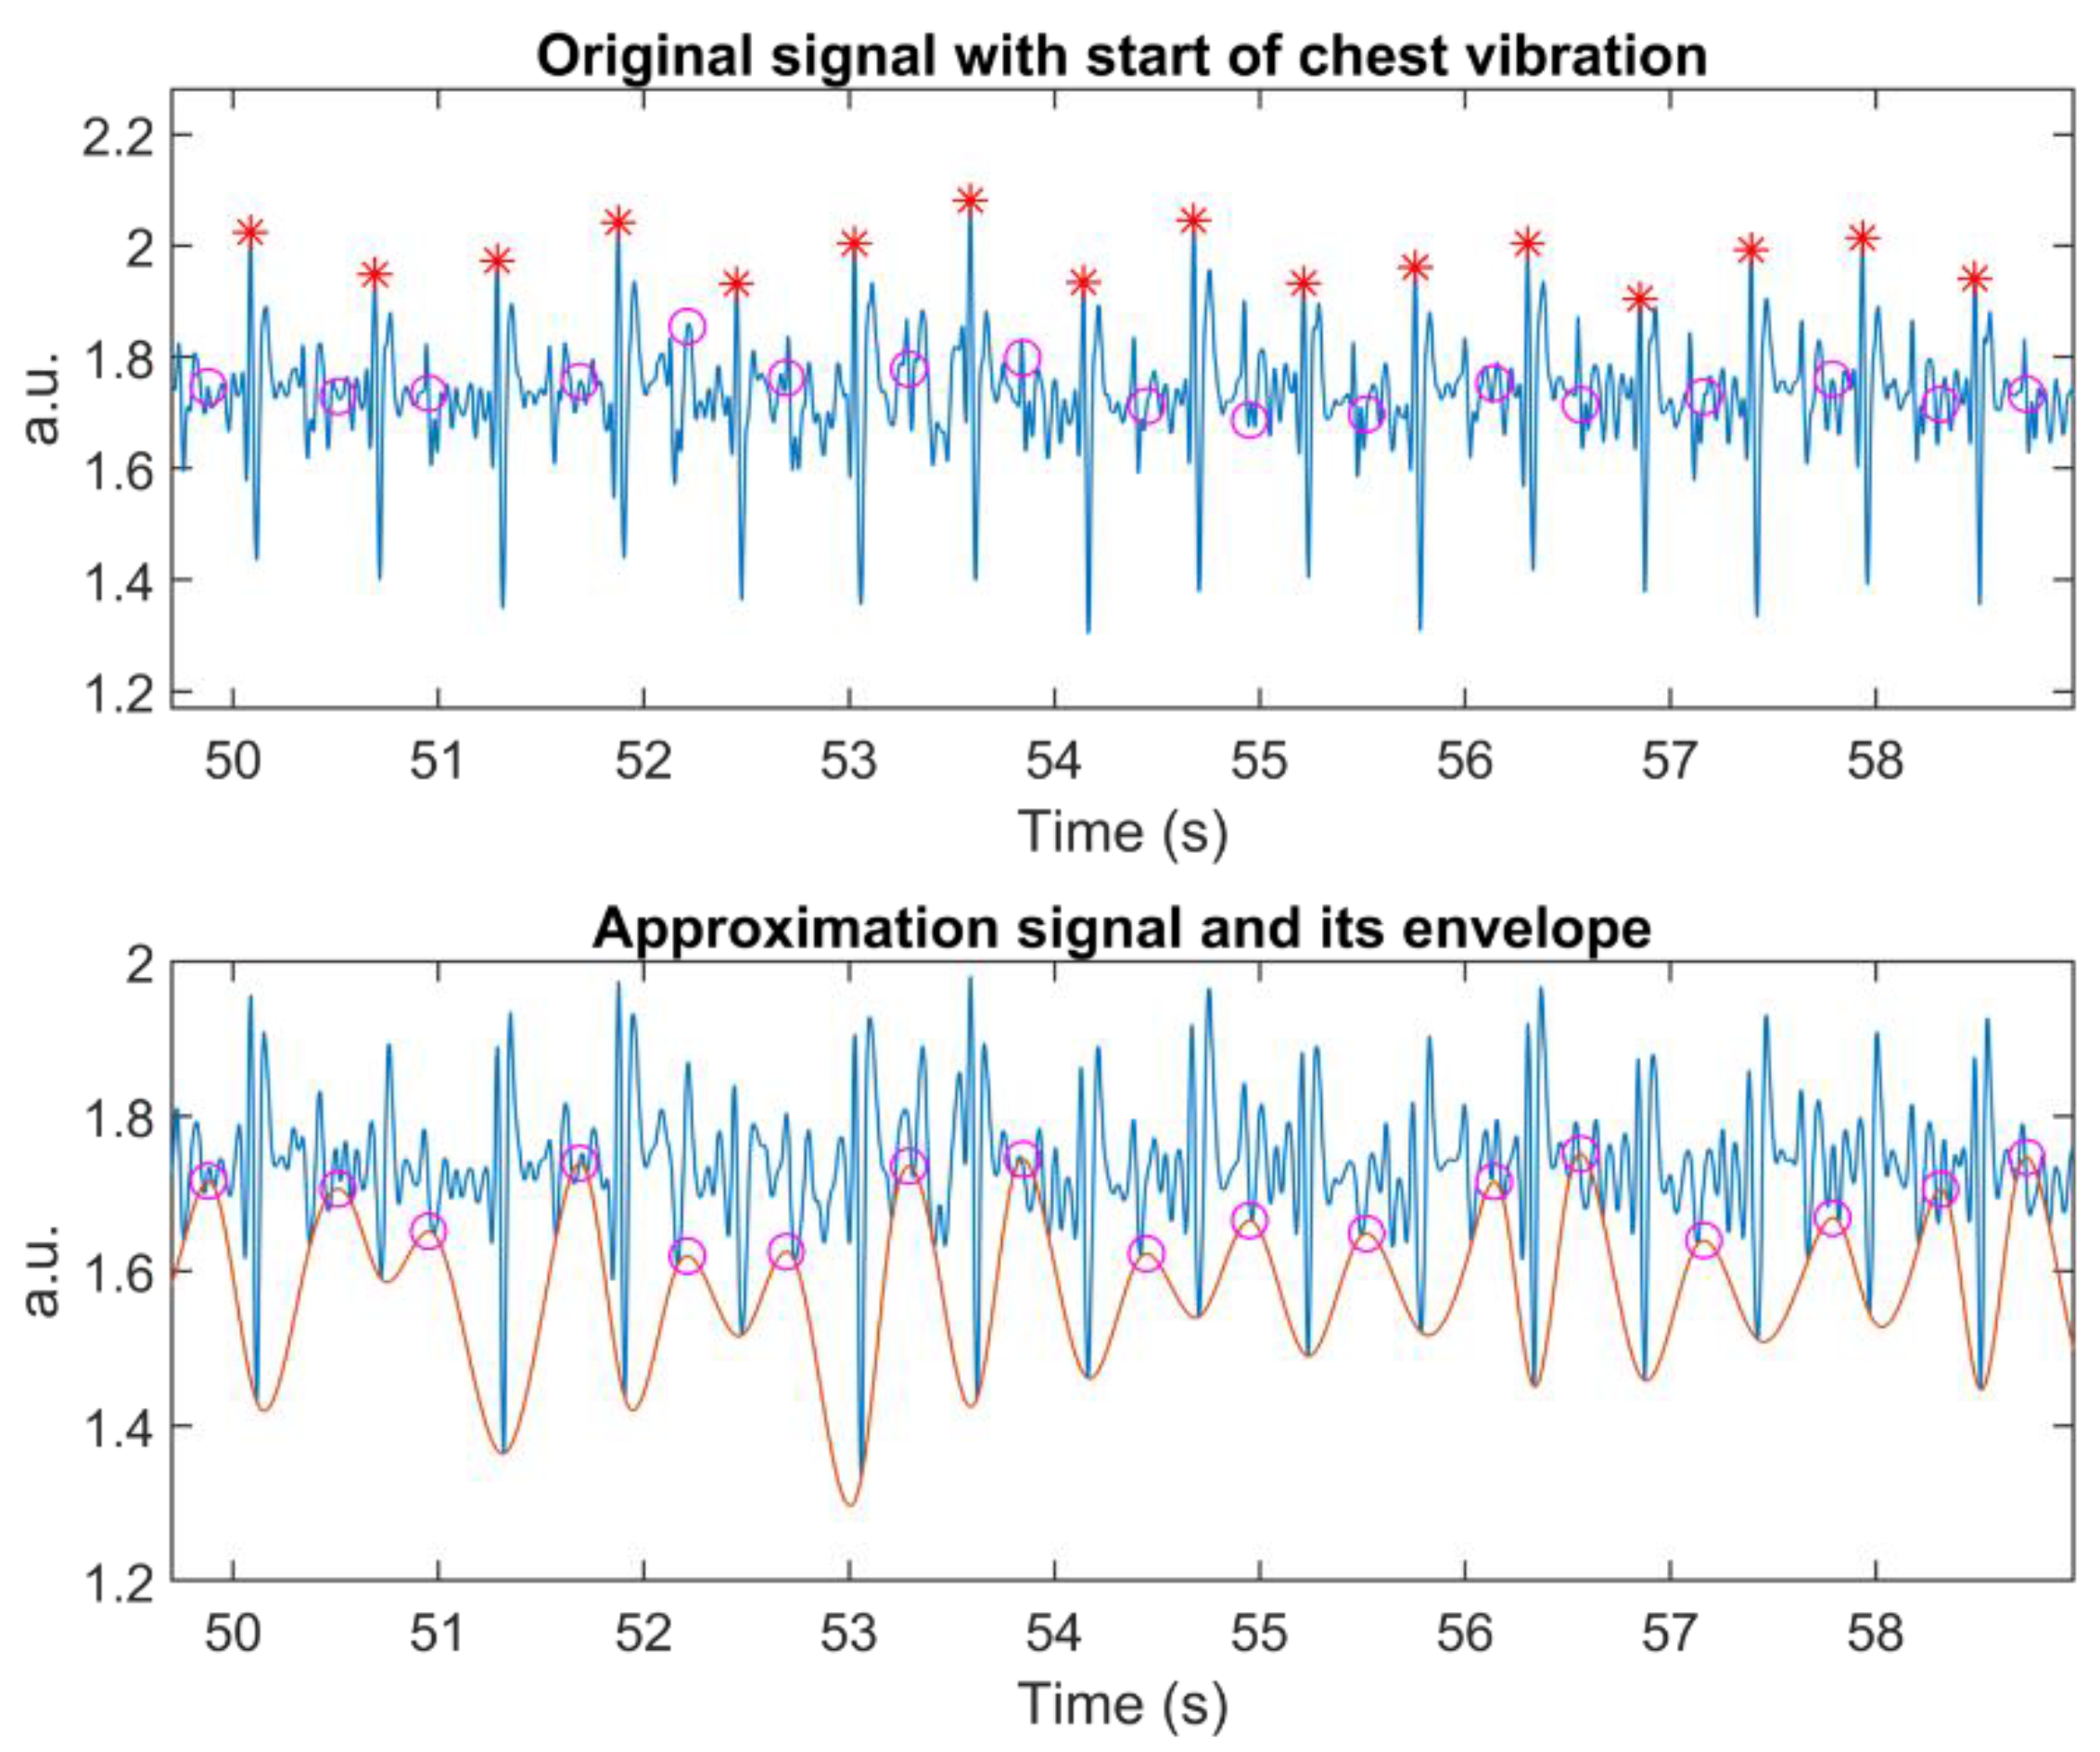
Next, the lower envelope of the Approximation signal of the selected level is calculated, along with its peaks. These peaks indicate the locations for slicing the recorded signal into individual chest vibrations (lines 7 to 9 in Algorithm 1). Hence, they represent the start of the S1′ wave.
The search window was defined as 60% of the mean of the distance between two adjacent starts of individual chest vibrations (line 10 in Algorithm 1). The main idea is to include the whole S1′ wave. Hence, we applied an adjustable search window to accommodate heart rate variation. AO detection utilises an enhanced signal, instead of the original one.
Vibration on the edge needs special attention since the algorithm processes signals segment-by-segment to enable a real-time application. It is possible to have one chest vibration at the beginning of the signal, before the first detected starting point. To solve this process, the algorithm searches for the peak of a chest vibration, when the distance of the first starting point from the beginning of the segmented signal is greater than the search window (lines 12 to 13 in Algorithm 1).
Searching for the peak of the last chest vibration may generate an error if the search window is beyond the length of the current segment. To counter that, we calculate the mean of the distance between the starting point and its corresponding peak. When the last starting point is located further than the edge of the segment, the algorithm will search for a peak (lines 14 to 15 in Algorithm 1).
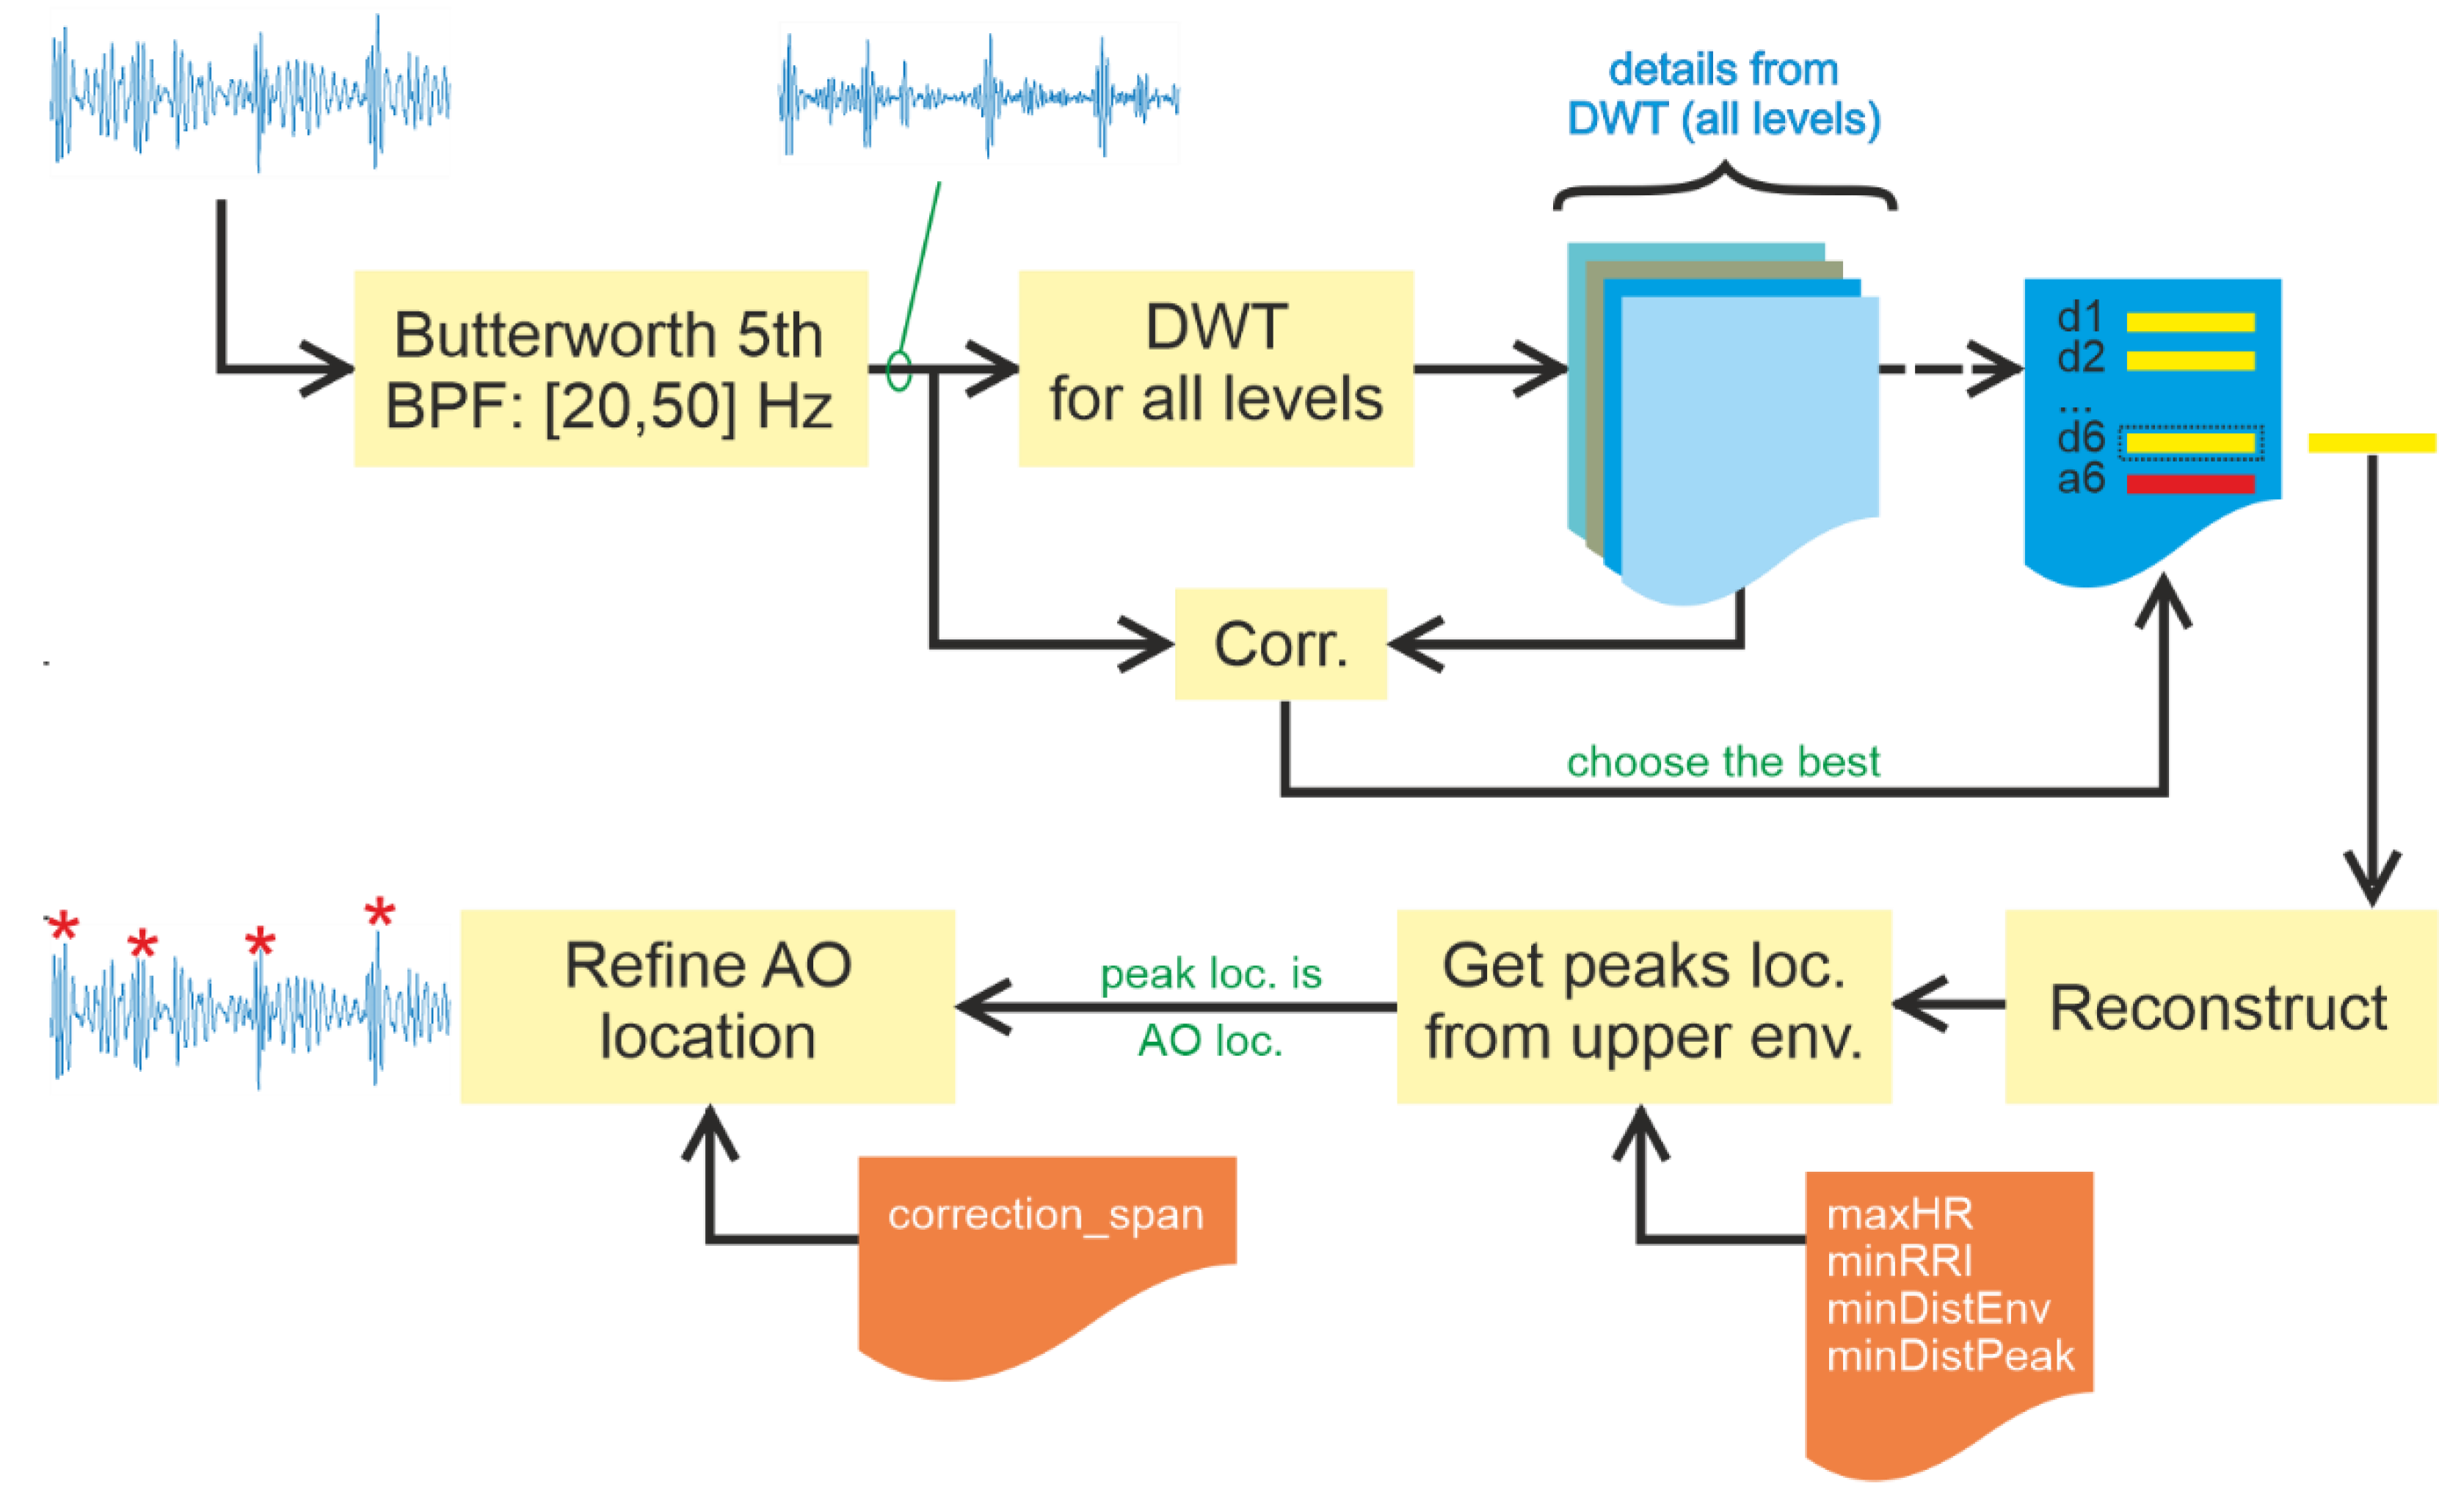
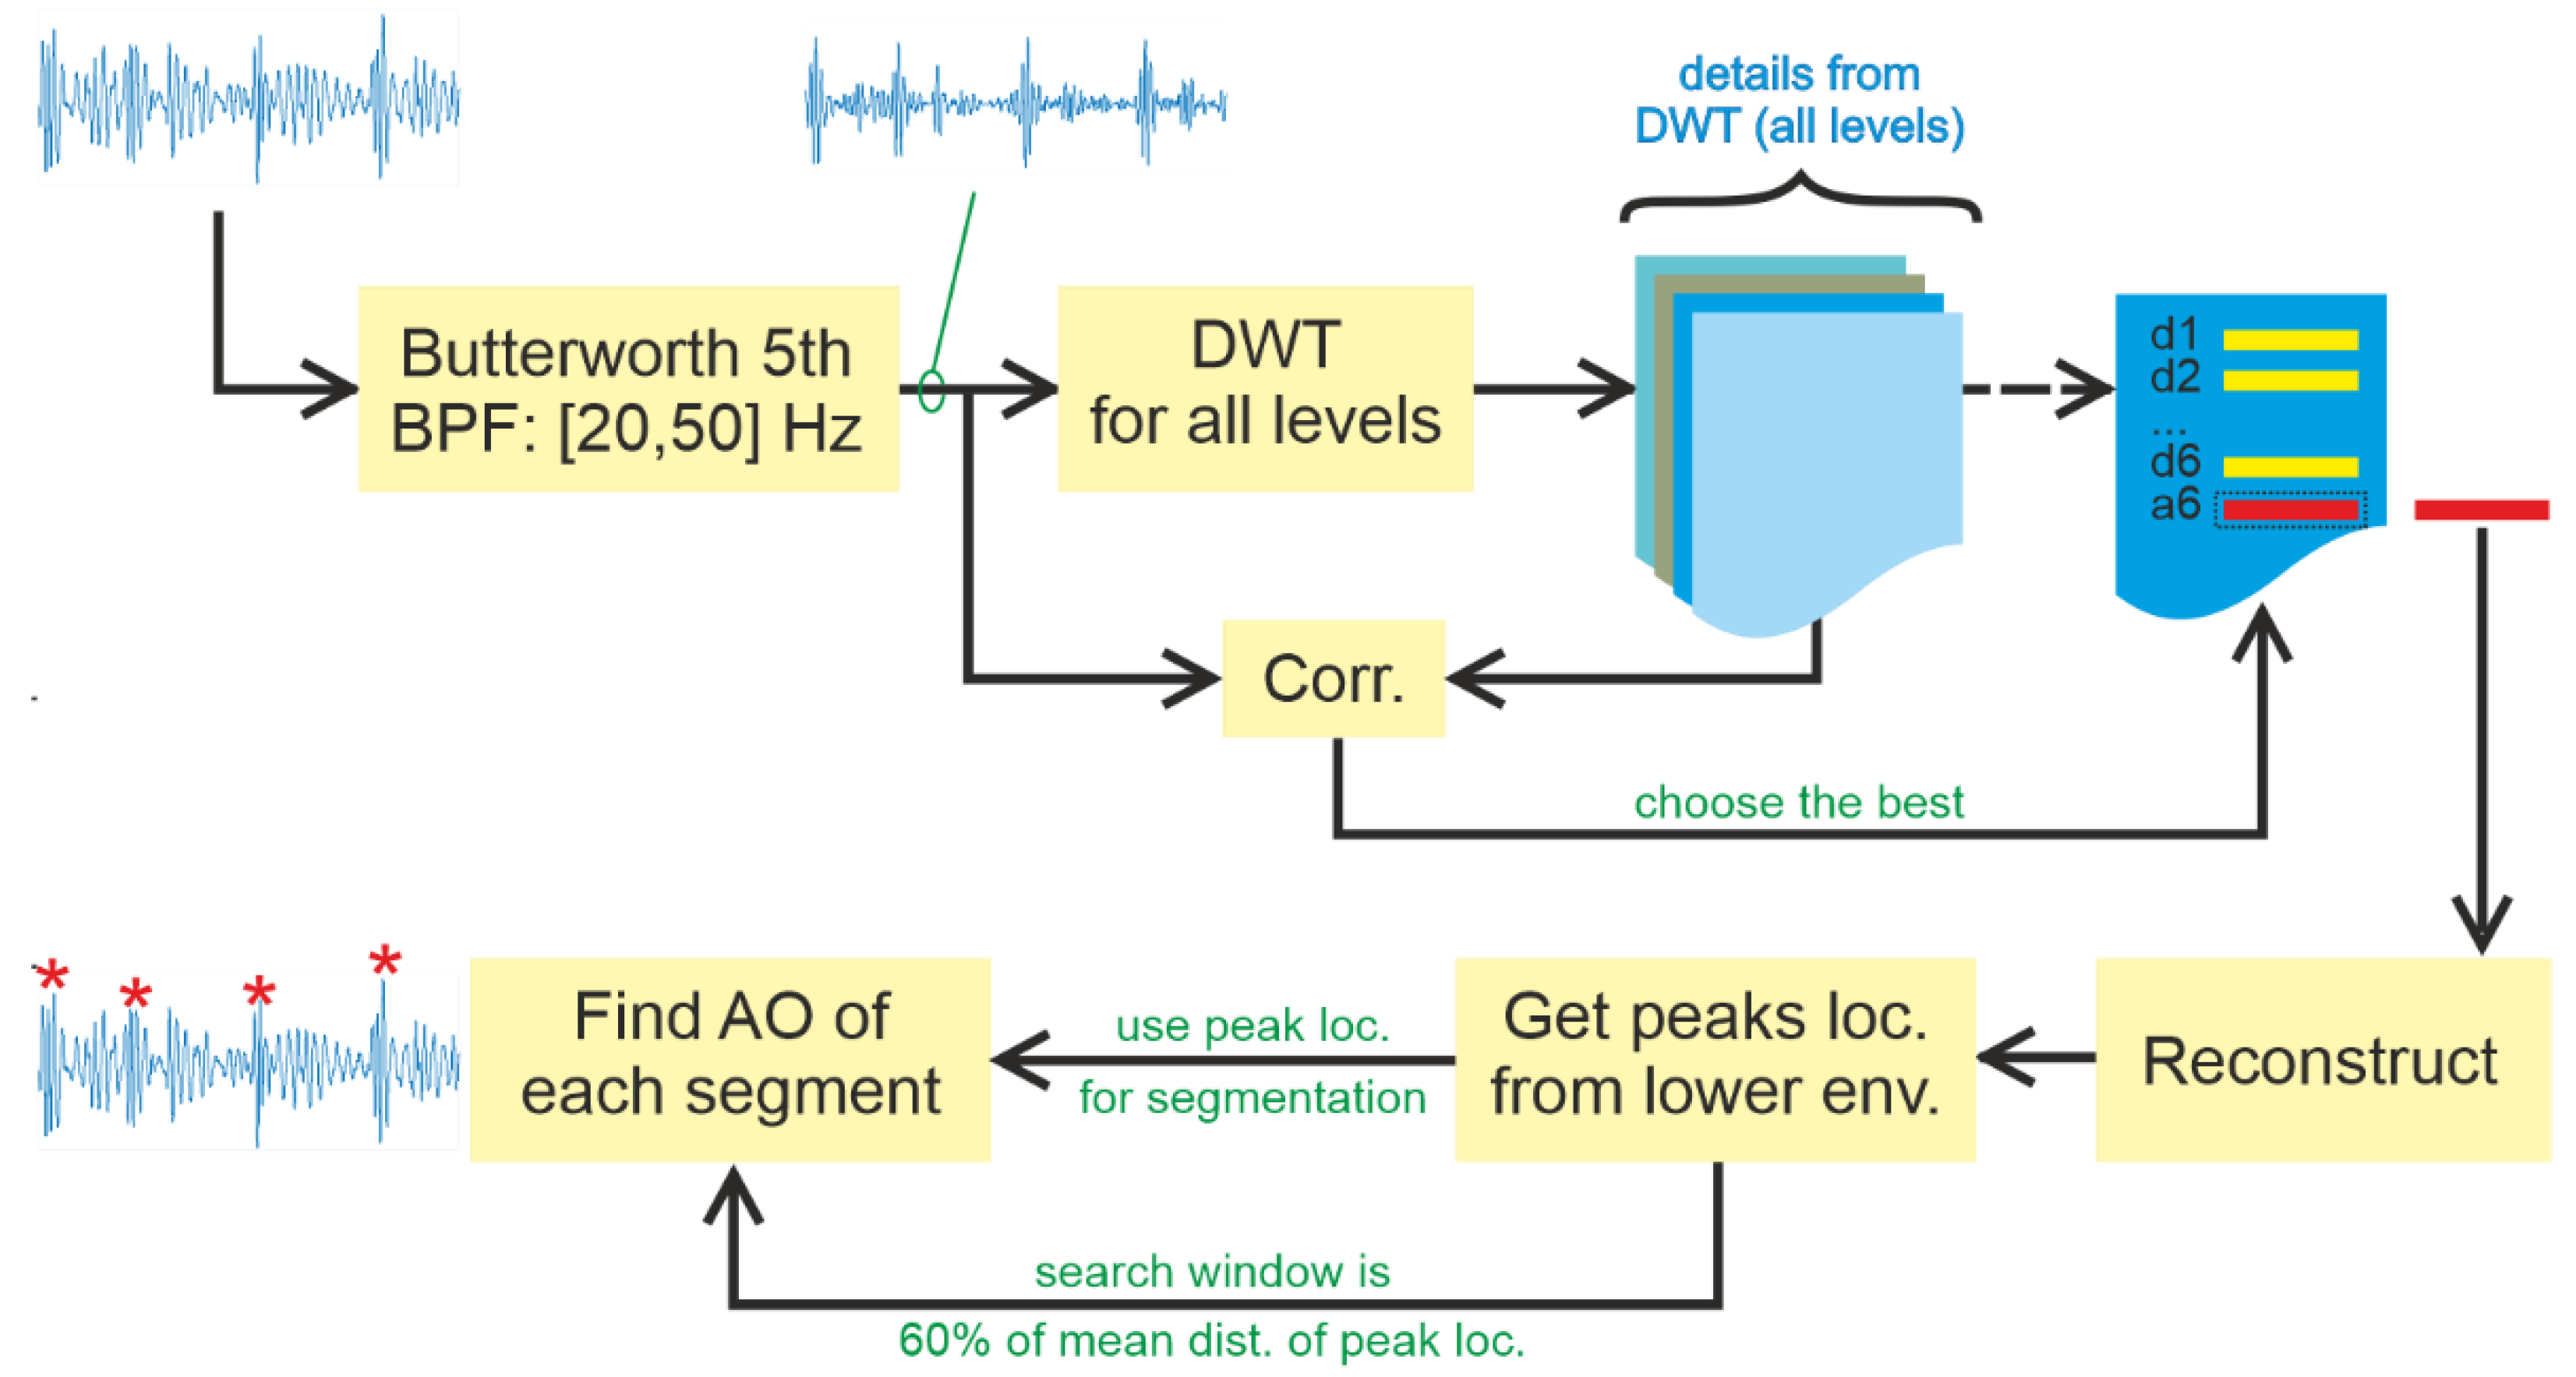
Figure 4 presents Algorithm #1, including signal enhancement, in a block diagram.
2.4. Method #2: Detect
Detect finds peaks without signal segmentation. As a result, it must adopt a different approach to the task. This study proposes using maximum heart rate based on the age of the subject. To estimate maximum heart rate, researchers have introduced various models. A popular one is that of Steven Creeks [
26] (see (1)). Among others, it has been utilised by Lauhkonen et al. in a study involving 166 children [
27]. Wu et al. studied a bone marrow collection from 30 male subjects (40–65 years, BMI less than 35 kg/m
2, type 2 diabetes) and 30 controls [
28]. Sporis et al. evaluated various models on more than 500 military personnel and found that Creek’s model provided a good correlation with the maximum heart rate, maxHR, obtained in a graded exercise test [
29];
where age is expressed in years.
Maximum HR results in minimal RR intervals (
minRRI), which can be used to correct errors. Wrongly detected peaks may arise from various sources, such as noise and oscillation characteristics around target peaks. Three measures were derived from
minRRI: minimum peak distance for envelope finding (
minDistEnv), minimum peak distance for peak detection (
minDistPeak) and span (
correctionSpan) to the right and left for peak correction (lines 1 to 5 in Algorithm 2). They were empirically derived from experiments.
| Algorithm 2 Detect. |
Input: enhanced signal s_enh, positive integer age.
Output: positive integer true_peak_loc.- 1:
maxHR ← get maximum HR using age based on (5). - 2:
minRRI ← from maxHR. - 3:
minDistEnv ← calculate minimum distance peak for envelope calculation, 25% of minRRI. - 4:
minDistPeak ← calculate minimum distance for peak detection, 125% of minRRI. - 5:
correction_span ← calculate distance to left and right for peak correction, 90% of minRRI. - 6:
for all level do - 7:
[app_coef, det_coef] = DWT(s_enh, level(i)). - 8:
s_reconst_1 ← reconstruct signal from the latest detail. - 9:
corr_coef(i) = corr(s_reconst_1, s_enh). - 10:
chosen_level = max(corr_coef(k)) // chosen_level holds index with the highest value in corr_coeff - 11:
s_reconst_2 ← reconstruct the latest Detail from chosen_level - 12:
up_env ← upper envelope from s_reconst_2 based on minDistEnv - 13:
peak_loc ← peak location from up_env based on minDistPeak - 14:
for all peak_loc do - 15:
true_peak_loc ← find the largest amplitude from peak_loc–correctionSpan to peak_loc + correctionSpan.
|
Detect starts with the application of DWT to the signal, be it whole or segmented, at a specific level, as in Slice and Detect (lines 6 to 11 in Algorithm 2). An upper envelope of the latest Detail from the selected level is generated based on its peaks, which are separated by at least minDistEnv (line 12 in Algorithm 2).
This envelope is then searched for its peaks. The distance between adjacent peaks must be at least
minDistPeak (line 13 in Algorithm 2). These peaks point to systolic peak candidates of the original signal. Since getting the true systolic peaks cannot be guaranteed, they should be verified by finding the largest amplitude around the detected location. The width of the search area is limited by
correctionSpan (lines 14 to 15 in Algorithm 2).
Figure 5 presents Algorithm #2, including signal enhancement, in a block diagram.
2.5. Analysis Method
We used the R-peaks of the ECG signal as the ground truth to evaluate our proposed algorithms. However, signals from Group #1 have no ECG signals. For this reason, manual annotation was used to provide ground truth for this group. In some cases, it was challenging to find the correct AO peaks, because infants and children have a higher heartrate than adults and systolic peaks were not always higher than diastolic ones. Segments containing these problems were discarded from analysis.
In the SCG from children/infants, we only measured accelerations perpendicular to the chest, which was sufficient for the analysis model. During peak detection, it is common to either miss or detect additional peaks. As these two errors are different, they will be handled separately. A missing peak is one that fails to be detected, whereas an additional peak is a fake peak found by the algorithm. To mark these errors, we evaluated the results manually. All computations were done using Matlab 2019b on a desktop computer with Intel(R) Core(TM) i7-8700 CPU @ 3.20 GHz, 16 GB RAM. For wavelet decomposition, we employed wavelet package decomposition 1D only.
4. Discussions
Khosrow-Khavar et al. acknowledged that SCG signal suffers from its complexity [
15]. Cardiac beat induces vibration to the skin and the accelerometer measures not only the pure skin vibration, but also its harmonics. The harmonic signals depend on the hardness of the tissue under the sensor. Hard tissue induces a lower damping factor than soft tissue.
In the absence of this damping factor, vibrations can be very noisy. However, if the damping factor is too high, the amplitudes of S1′ and S2′ are not clearly visible. As a countermeasure, a soft material can be inserted between the sensor and skin, providing a mechanical coupling [
30]. Exploring these effects falls outside of the scope of this study, so future work will be needed to evaluate the proposed algorithms in this respect.
We also emphasize that accelerometer placement matters, as confirmed by Ashouri and Inan [
5] and Chuo et al. [
7]. We placed the accelerometer on the chest, typically above the sternum. However, in the case of Group #1, the sensor was attached after the subjects fell asleep, and some sleeping body positions made placement in the planned position impossible. In Group #2, the accelerometer could be placed on the target area, but, as the subjects were all adults, signal quality was affected by differences in chest area, caused by varying muscle thicknesses and fat deposition, for example.
Another problem was the accelerometer cable, especially in Group #1. Children moved freely in their sleep and cable movements or bending sometimes affected signal quality.
Many researchers have presented useful algorithms for detecting peaks from the systolic and diastolic phases. The proposed algorithms rely on two assumptions based on PCG, (1) the peak of S1 is always larger than that of S2, and (2) there is an appropriate distance between S2 of the current cardiac cycle and S1 of the next one. However, the first assumption did not always hold for SCG, as shown by the results from Group #1. The main drawback is these solutions often include ECG [
10,
11,
12], which is not always available.
With the absence of an ECG signal to guide the determination of real peaks, performance evaluation in Group #1 was quite challenging. With three out of seven subjects in Group #1, the amplitude of S2′ was not always smaller than that of S1′. Consequently, the peak position could not be determined.
Moreover, children and babies have a higher HR than adults, making the distance between S2′ of the current cardiac cycle and S1′ of the next one even smaller. For this reason, no results were available for data analysis from three of the subjects in Group #1.
The two assumptions discussed above were utilised in the algorithms presented here. Slice and Detect uses them to determine the start of each cardiac cycle, based on the peak of the lower envelope of Approximation signals. With an absolute AC larger than the absolute AO, the shape of the envelope changed accordingly. Consequently, the algorithm missed the true starting point of the cardiac cycle. Further, this error propagated to the peak detection results.
The other algorithm used the assumptions to find prominent peaks in the envelope of signal reconstruction that leads to AO. Both algorithms work well when the absolute AC is less than the absolute AO within the same cardiac beat. Another important condition is that S1′ and S2′ must be sufficiently sharp. If these conditions are not fulfilled, the envelope and peak detection fail to produce optimal results.
In a resting state, both algorithms provided a low error rate for both groups. In this state, disturbance was almost non-existent, except for children and babies moving in their sleep. As a result, signal quality was good, and the low error rate makes sense.
For errors produced by the algorithms, additional peak error was always lower than missing peak error, except for Breath Hold and Valsalva for
Detect in Group #2. Both tasks force the subjects to compress their lungs, which may affect chest vibration characteristics. Interestingly,
Slice and Detect showed a very low error rate in this situation. Perhaps DWT provided sufficient signal enhancement to provide a good separation between adjacent chest vibrations.
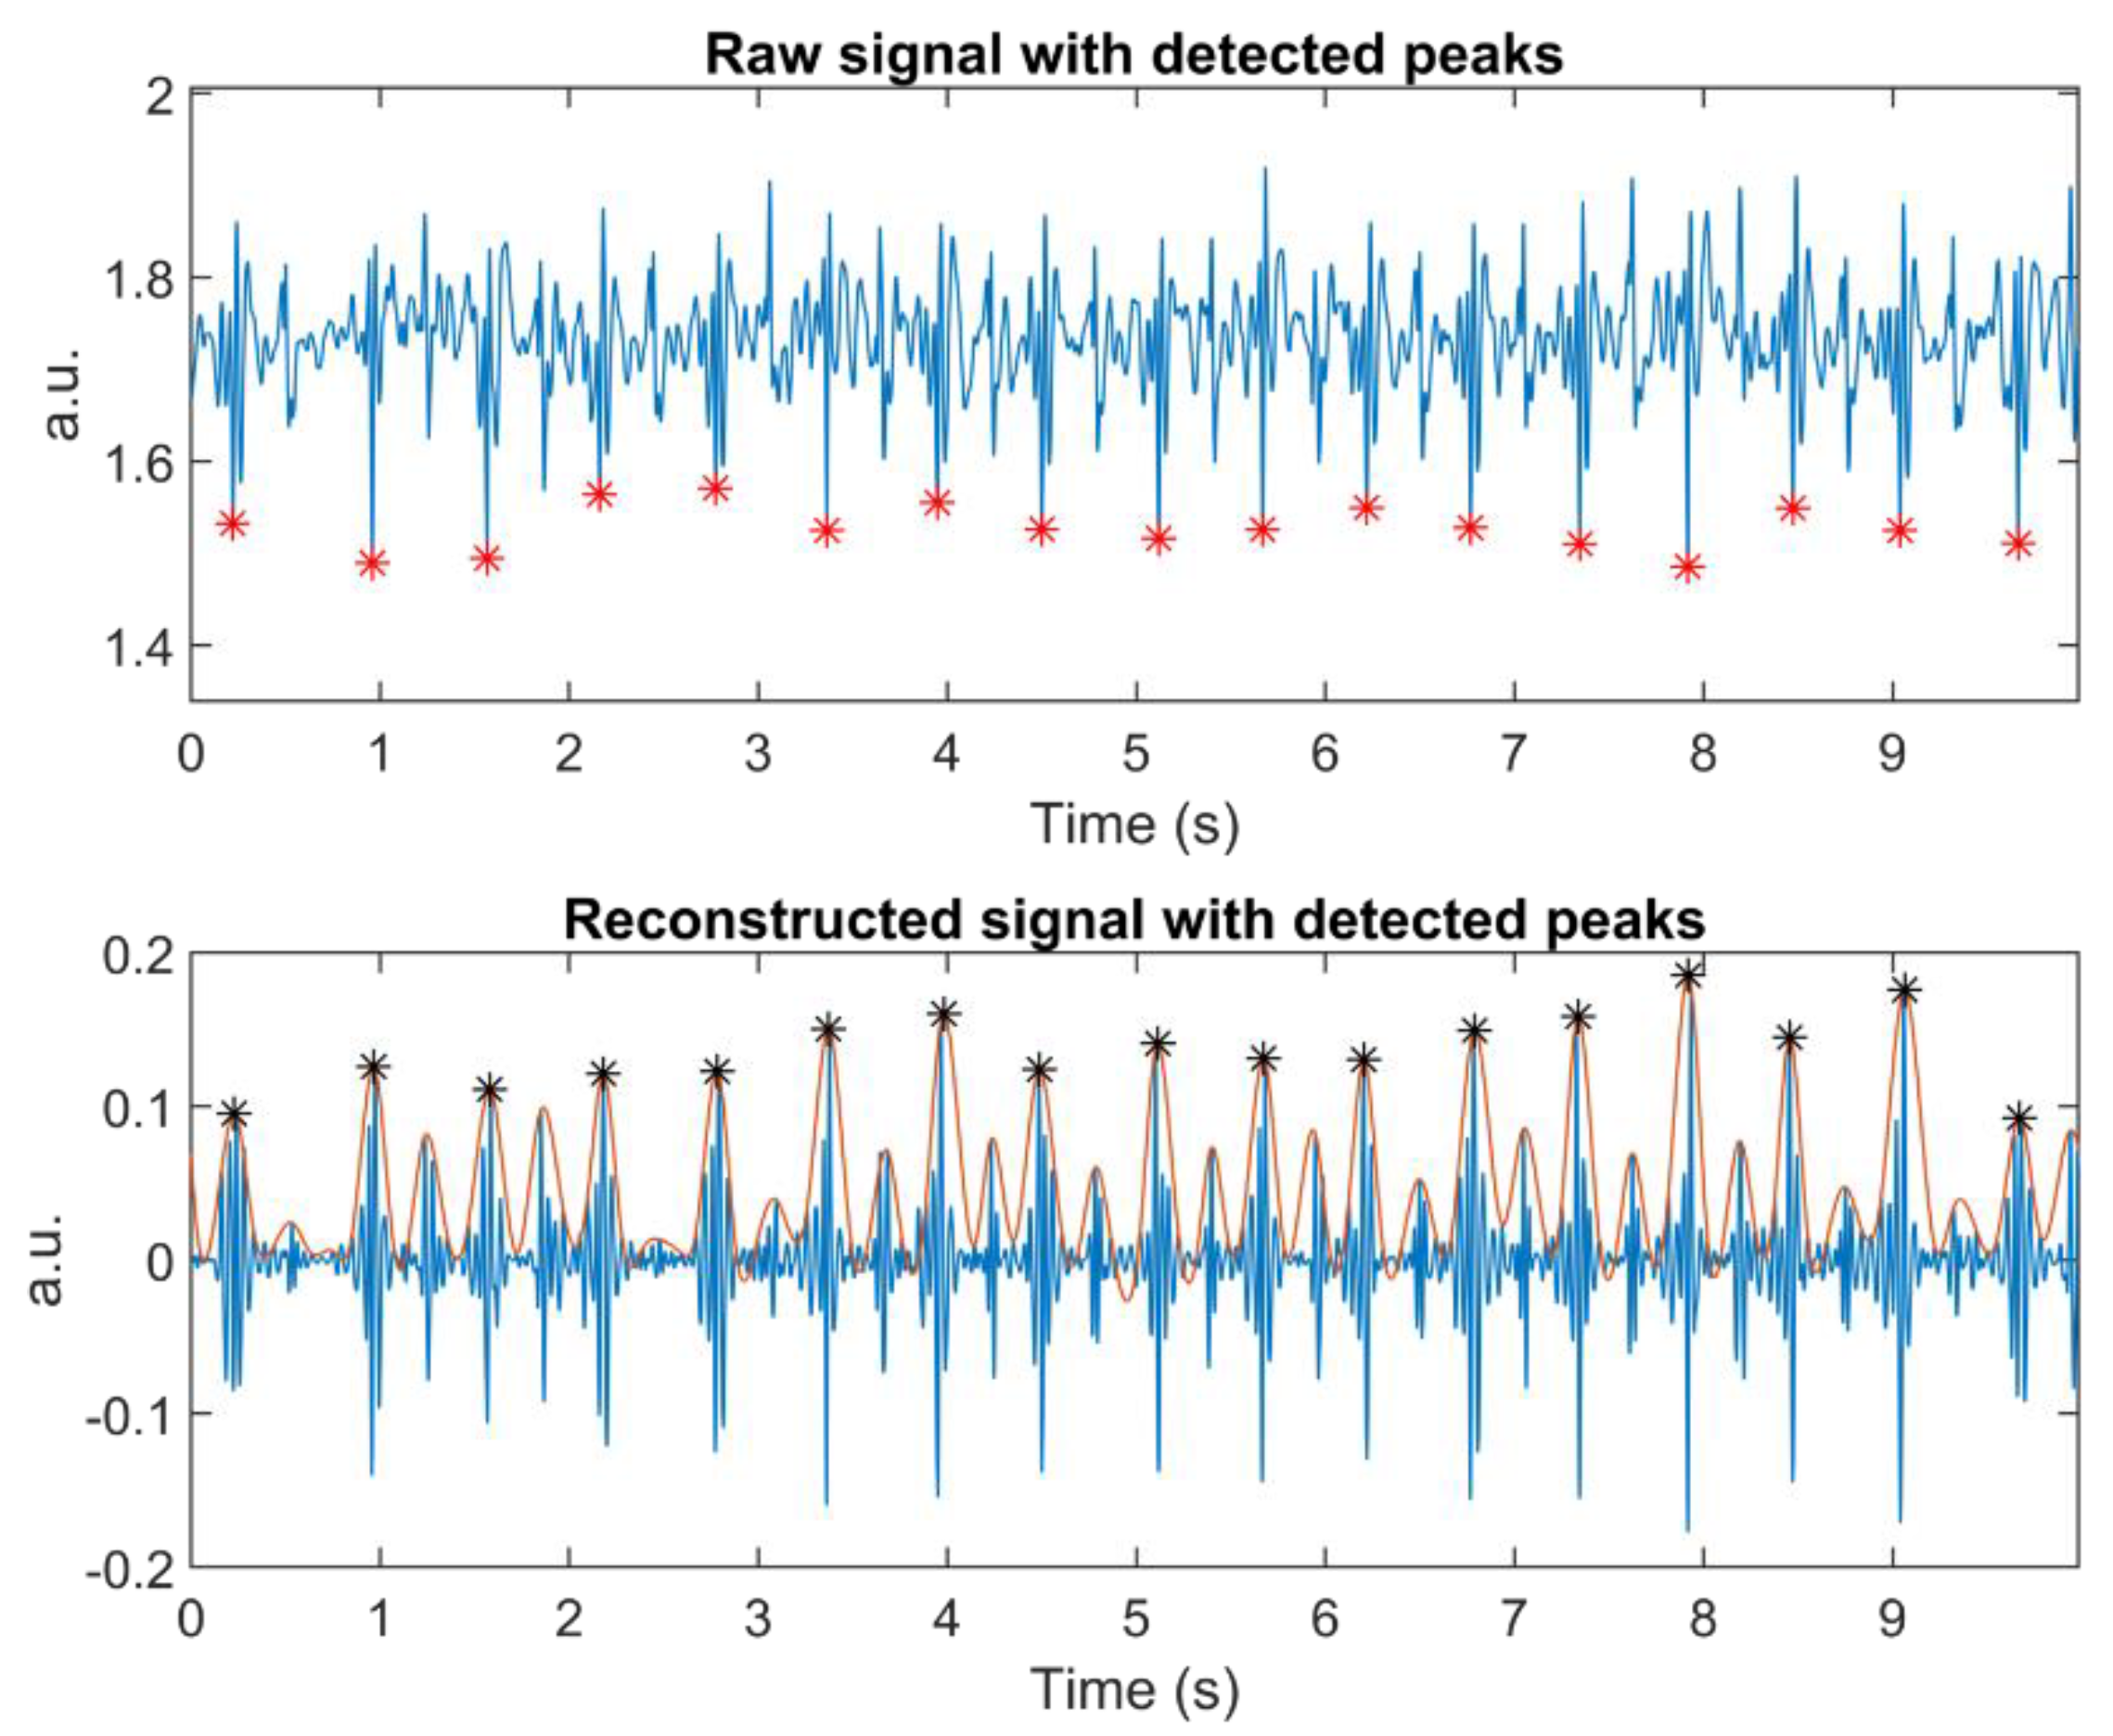
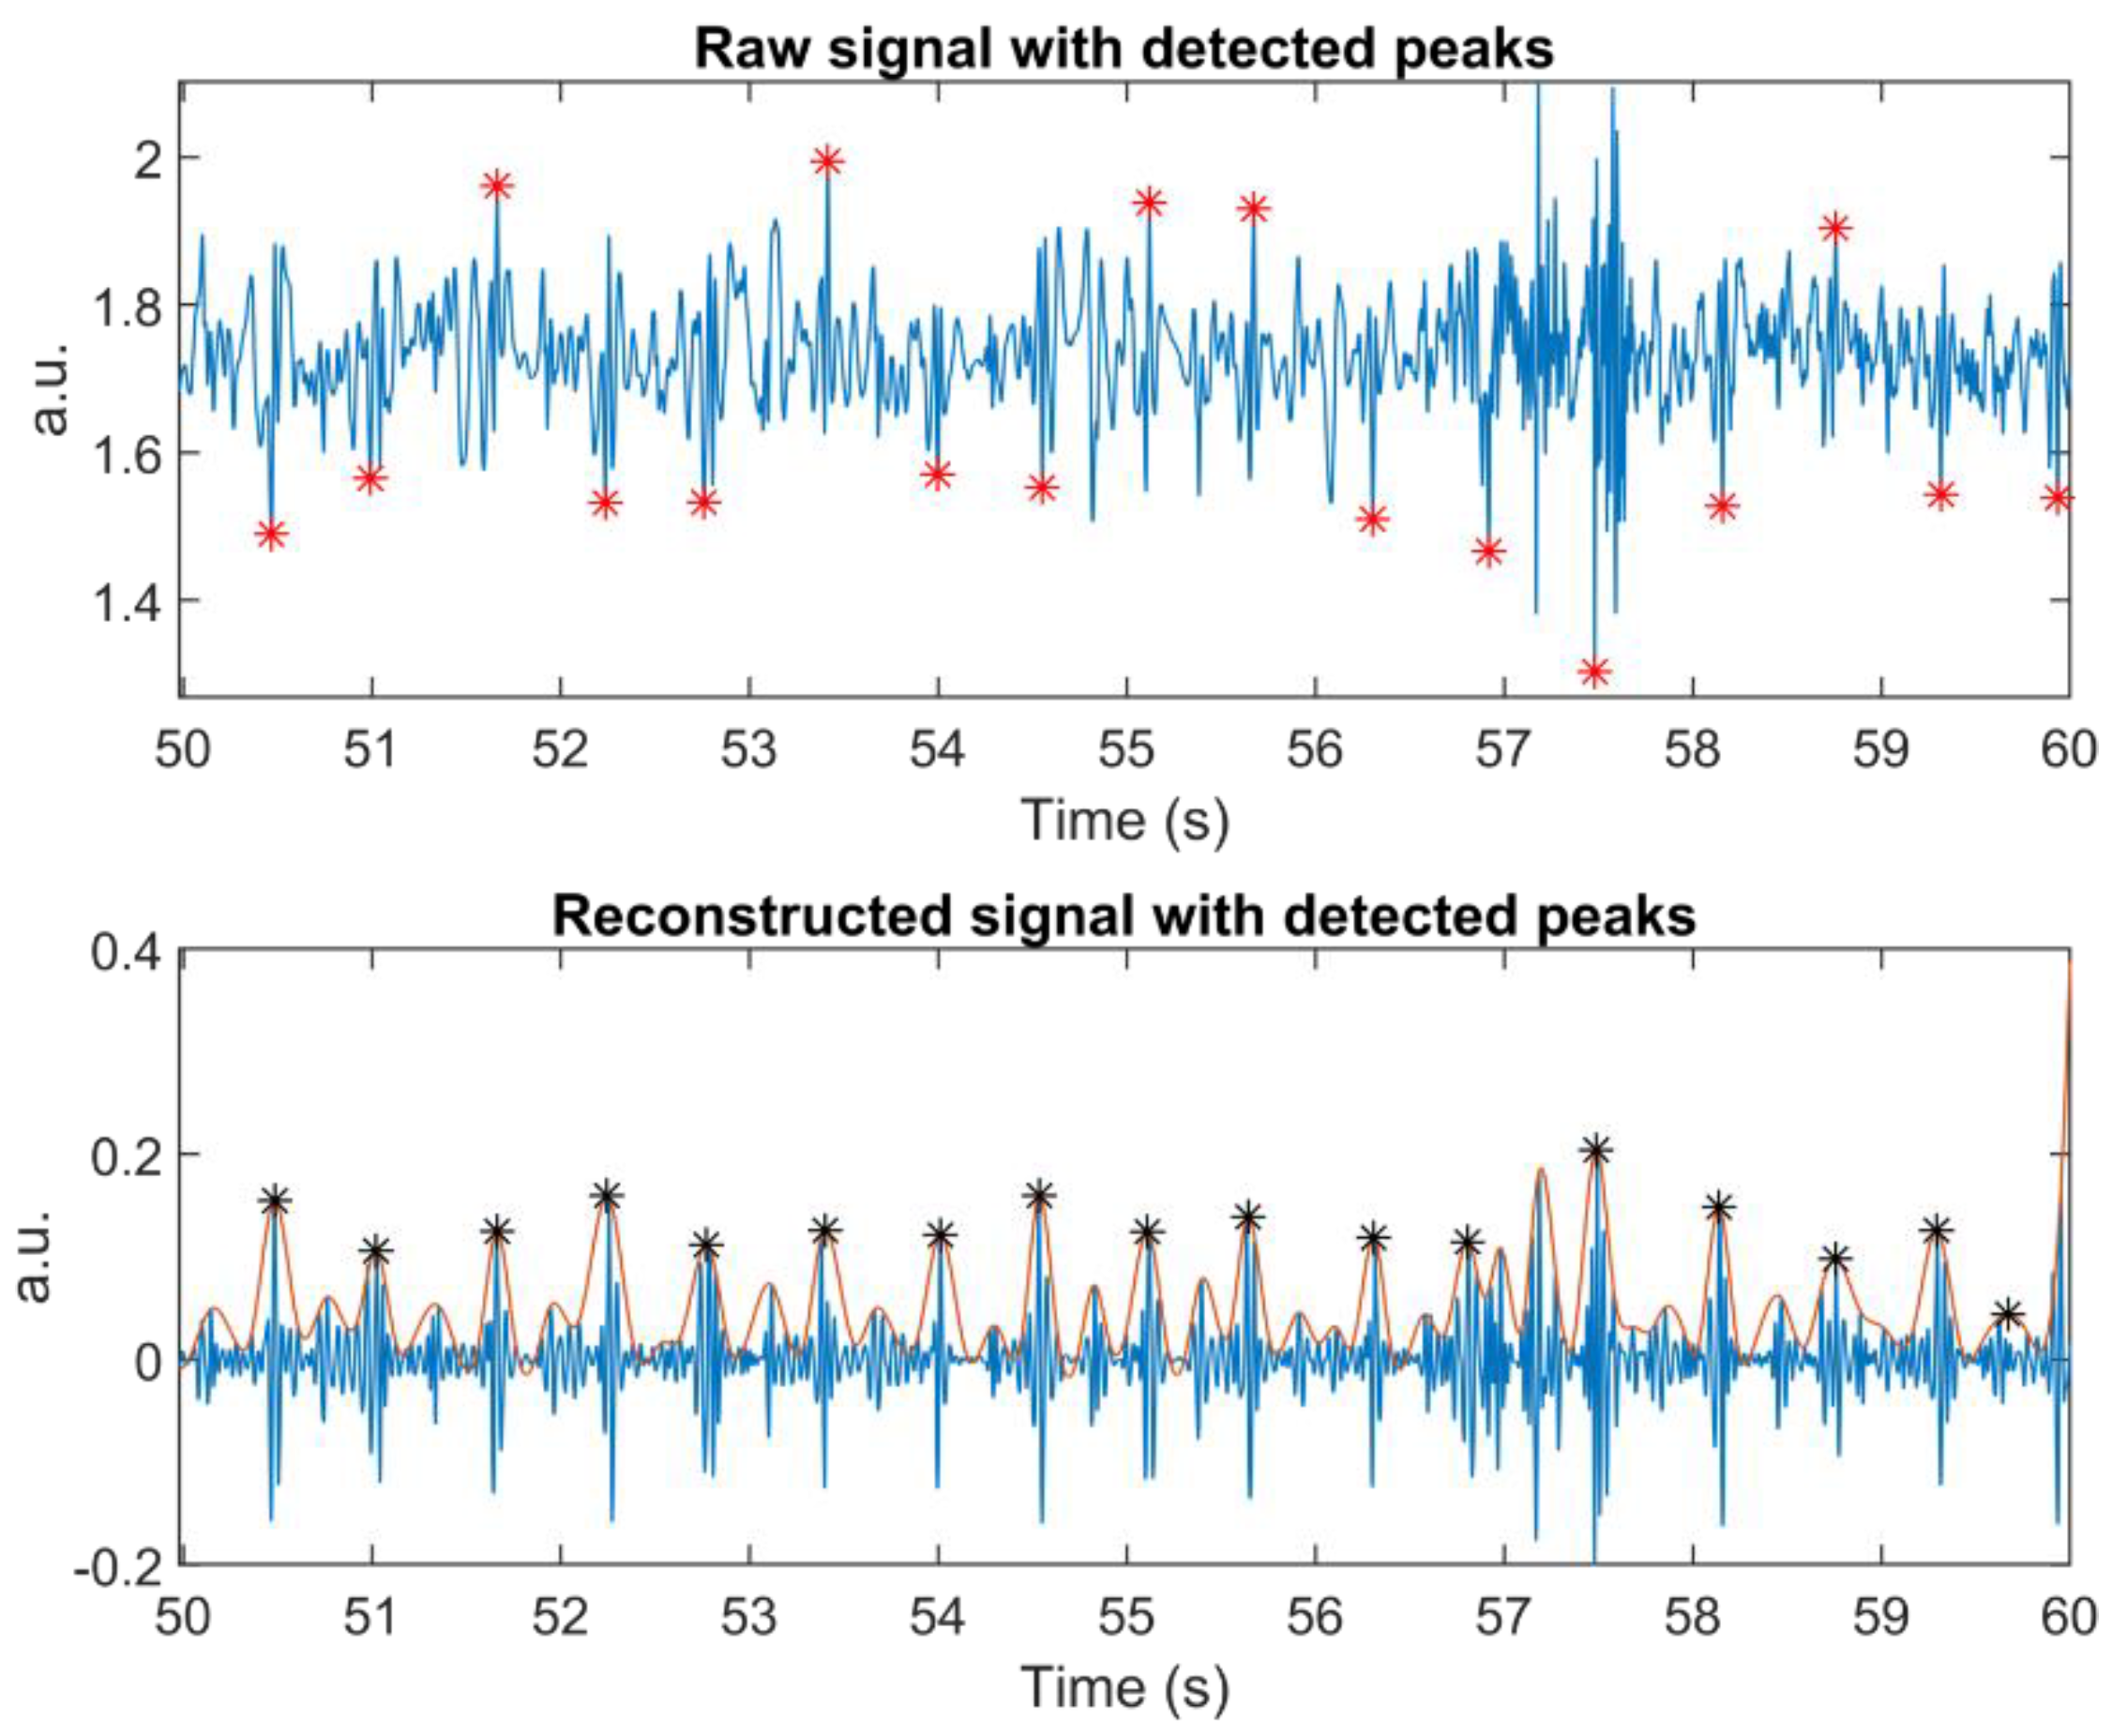
Detect, on the other hand, enabled heartbeat detection from a very noisy signal (see
Figure 9).
In a resting state, Detect delivered fewer additional peaks in both groups. The most probable reason is that, in this state, signals were not disturbed by the various breathing tasks the subjects undertook. These tasks affect chest movement, inducing motion artefacts. As hypothesized above, DWT may provide a form of signal enhancement that offers a good separation between adjacent chest vibrations.
For Group #1, Detect outperformed the other one in terms of average error rate detection. However, with only four subjects, it is difficult to draw meaningful conclusions from this table. That said, Detect showed promise, especially for monitoring children and babies.
During the Valsalva manoeuvre, both algorithms struggled to detect correct peak locations, when the heartbeat increased or dropped quickly. SCG signals were quite noisy during this task, mostly due to body movements. It would be impossible even for a human to pinpoint AO correctly without recourse to R-peaks.
Wavelet transform decomposes signals based on chosen mother wavelets and can be used to find parts of a signal that are similar in shape to the mother wavelet. Hence, it is a means of signal enhancement that can find buried information in a noisy signal. However, this ability failed to produce good results in Group #2 during breathing tasks.
Using an envelope to find peak candidates in Detect came with a specific drawback: at the beginning of some segments, it failed to detect a prominent peak. If signal quality is good and the measurement is sufficiently long to produce signals with many prominent peaks, this problem can be neglected. However, for a short-time signal with poor quality, this is an important issue. Therefore, methods without envelope detection should be used or a robust parameter should be provided for peak detection, which is a subject for future work.
Choosing a decomposition level based on the correlation between the last detail reconstruction and the original signal proved successful. The nature of signal oscillation cannot be generalised, so each segment may require a different decomposition level. Our experiments showed that this level varies from five to eight.
Performance measurements in the adult dataset were easier, due to the availability of ECG, especially for signals with artefacts. The correct peak location always comes slightly after the R-peak of each heartbeat. Researchers define this time difference as pulse transit time (PTT), and it can be used, for example, for continuous estimation of blood pressure fluctuations [
8] and the study of cerebral autoregulation [
31].
Our data sets used two different accelerometers, ordinary MEMS for children/infants and opto-mechanical accelerometers for adults. Comparing their performances is only possible from the resting state of these two groups. However, nothing can be concluded thus far, because signals from adults are more controllable than those from children/infants. Consequently, another study must be conducted to make a more meaningful conclusion.


