Article

Healthy Knee Kinematic Phenotypes Identification Based on a Clustering Data Analysis

1
LICEF Institue, TELUQ University, Montreal, QC H2S 3L4, Canada
2
Laboratoire de Recherche en Imagerie et Orthopédie (LIO), CRCHUM, Montreal, QC H2X 0A9, Canada
3
Jones College Preparation, Chicago, IL 60605, USA
4
EMOVI Inc., Montreal, QC H7P 0H7, Canada
5
Département de Génie des Systèmes, École de Technologie Supérieure, Montreal, QC H3C 1K3, Canada
6
Department of Surgery, Université de Montréal, Hôpital Maisonneuve Rosemont, Montreal, QC H1T 2M4, Canada
*
Author to whom correspondence should be addressed.
Appl. Sci. 2021, 11(24), 12054; https://doi.org/10.3390/app112412054
Submission received: 26 October 2021 / Revised: 26 November 2021 / Accepted: 29 November 2021 / Published: 17 December 2021
(This article belongs to the Special Issue Biomechanical and Biomedical Factors of Knee Osteoarthritis)

Abstract

:
The purpose of this study is to identify healthy phenotypes in knee kinematics based on clustering data analysis. Our analysis uses the 3D knee kinematics curves, namely, flexion/extension, abduction/adduction, and tibial internal/external rotation, measured via a KneeKG™ system during a gait task. We investigated two data representation approaches that are based on the joint analysis of the three dimensions. The first is a global approach that is considered a concatenation of the kinematic data without any dimensionality reduction. The second is a local approach that is considered a set of 69 biomechanical parameters of interest extracted from the 3D kinematic curves. The data representations are followed by a clustering process, based on the BIRCH (balanced iterative reducing and clustering using hierarchies) discriminant model, to separate 3D knee kinematics into homogeneous groups or clusters. Phenotypes were obtained by averaging those groups. We validated the clusters using inter-cluster correlation and statistical hypothesis tests. The simulation results showed that the global approach is more efficient, and it allows the identification of three descriptive 3D kinematic phenotypes within a healthy knee population.

1. Introduction

Establishing the phenotypes of healthy or asymptomatic gait from biomechanical data, such as kinematic, kinetic, and electromyographic measurements, is of primary importance. It provides a better understanding of the potential variability in a healthy individual’s locomotion function and more personalized approach when designing treatment plans [1]. More importantly, identifying healthy phenotypes sets targets in treatment planning and evaluation of therapeutic efficiency [2].
However, the characterization of asymptomatic gait phenotypes representing clearly distinct gait categories is difficult for two reasons. First, the biomechanical data are given in the form of a vector of measurements of high dimension for each subject, causing a dimensionally cursed phenomenon [3,4]. Second, there is significant variability in the biomechanical data, even in healthy asymptomatic population gait. This high variability might be caused by the difference in the data collection methodology (motion capture systems, walking speed, data processing, etc.) [5].
Previous studies have shown the presence of several different patterns in the asymptomatic gait data [6]. Indeed, the presence of multiple phenotypes in knee kinematic patterns was first demonstrated by experiments using intra-cortical pins to measure movements [7]. While prior works have also identified differences in male and female gait patterns [2,8,9], other studies used 3D kinematic and kinetic to identify how age, sex, and body mass index (BMI) can influence normal gait [10]. However, both the high variability and high dimensionality of biomechanical data have forced many studies to limit their analyses to using simple descriptions, e.g., the mean or the local extrema. Indeed there have been various biomechanical patterns describing normal three-dimensional (3D) kinematic patterns of the knee (flexion/extension, abduction/adduction, and tibial internal/external rotation) during functional activities such as level walking [7,11,12,13,14,15,16,17]—where a single normal pattern with bands of deviation is used as a reference to identify abnormalities in a patient’s pattern [18].
Most previous studies have focused on assessing pathological rather than healthy asymptomatic kinematics [12]. Pattern recognition and machine learning techniques are typically used to characterize gait patterns. Various clustering techniques have been applied such as hierarchical clustering [19,20,21], c-means [22,23,24,25], artificial neural networks [26], and fuzzy clustering [27]. Hierarchical clustering was used to distinguish five gait patterns in young subjects using 3D peak muscle powers [19,20]. Hierarchical c-means clustering algorithms were employed to derive gait patterns [22], to classify kinematic data of patients following a stroke [23], and to identify gait pattern deviations in children with cerebral palsy [21,24,25]. In this same pathological population, fuzzy clustering was applied to normal and pathological subjects [27]. Similarly, artificial neural networks were used to distinguish between asymptomatic and osteoarthritis gaits [26].
Previous studies used only a small set of descriptors such as the mean of the measured data or local information to identify patterns in the data. The use of a small set of descriptors seriously limits the analysis and interpretation of the data due to the complexity of the kinematic data [28]. Therefore, the objective of this study is to identify healthy gait phenotypes using a clustering model that deals with high dimensional data analysis, i.e., the BIRCH (balanced iterative reducing and clustering using hierarchies) model. We investigated two data representation approaches based on a joint analysis of the three dimensions. The first, named global approach, considered the raw data without any dimensionality reduction. The second is a local approach, which is considered a large set of biomechanical parameters of interest extracted on the 3D kinematic patterns. The objectives are: (1) to identify the phenotype using an important cohort of healthy participants, (2) to explore a clustering approach using 3D knee kinematics data representations that consider the three planes of motion together, and (3) to compare global and local representations.

2. Materials and Methods

The methodology used is described in the block diagram presented in Figure 1 and involves the following steps: (1) kinematics data collection, (2) kinematics data standardization, (3) kinematics representation, (4) clustering for phenotypes identification, and (5) cluster validation.

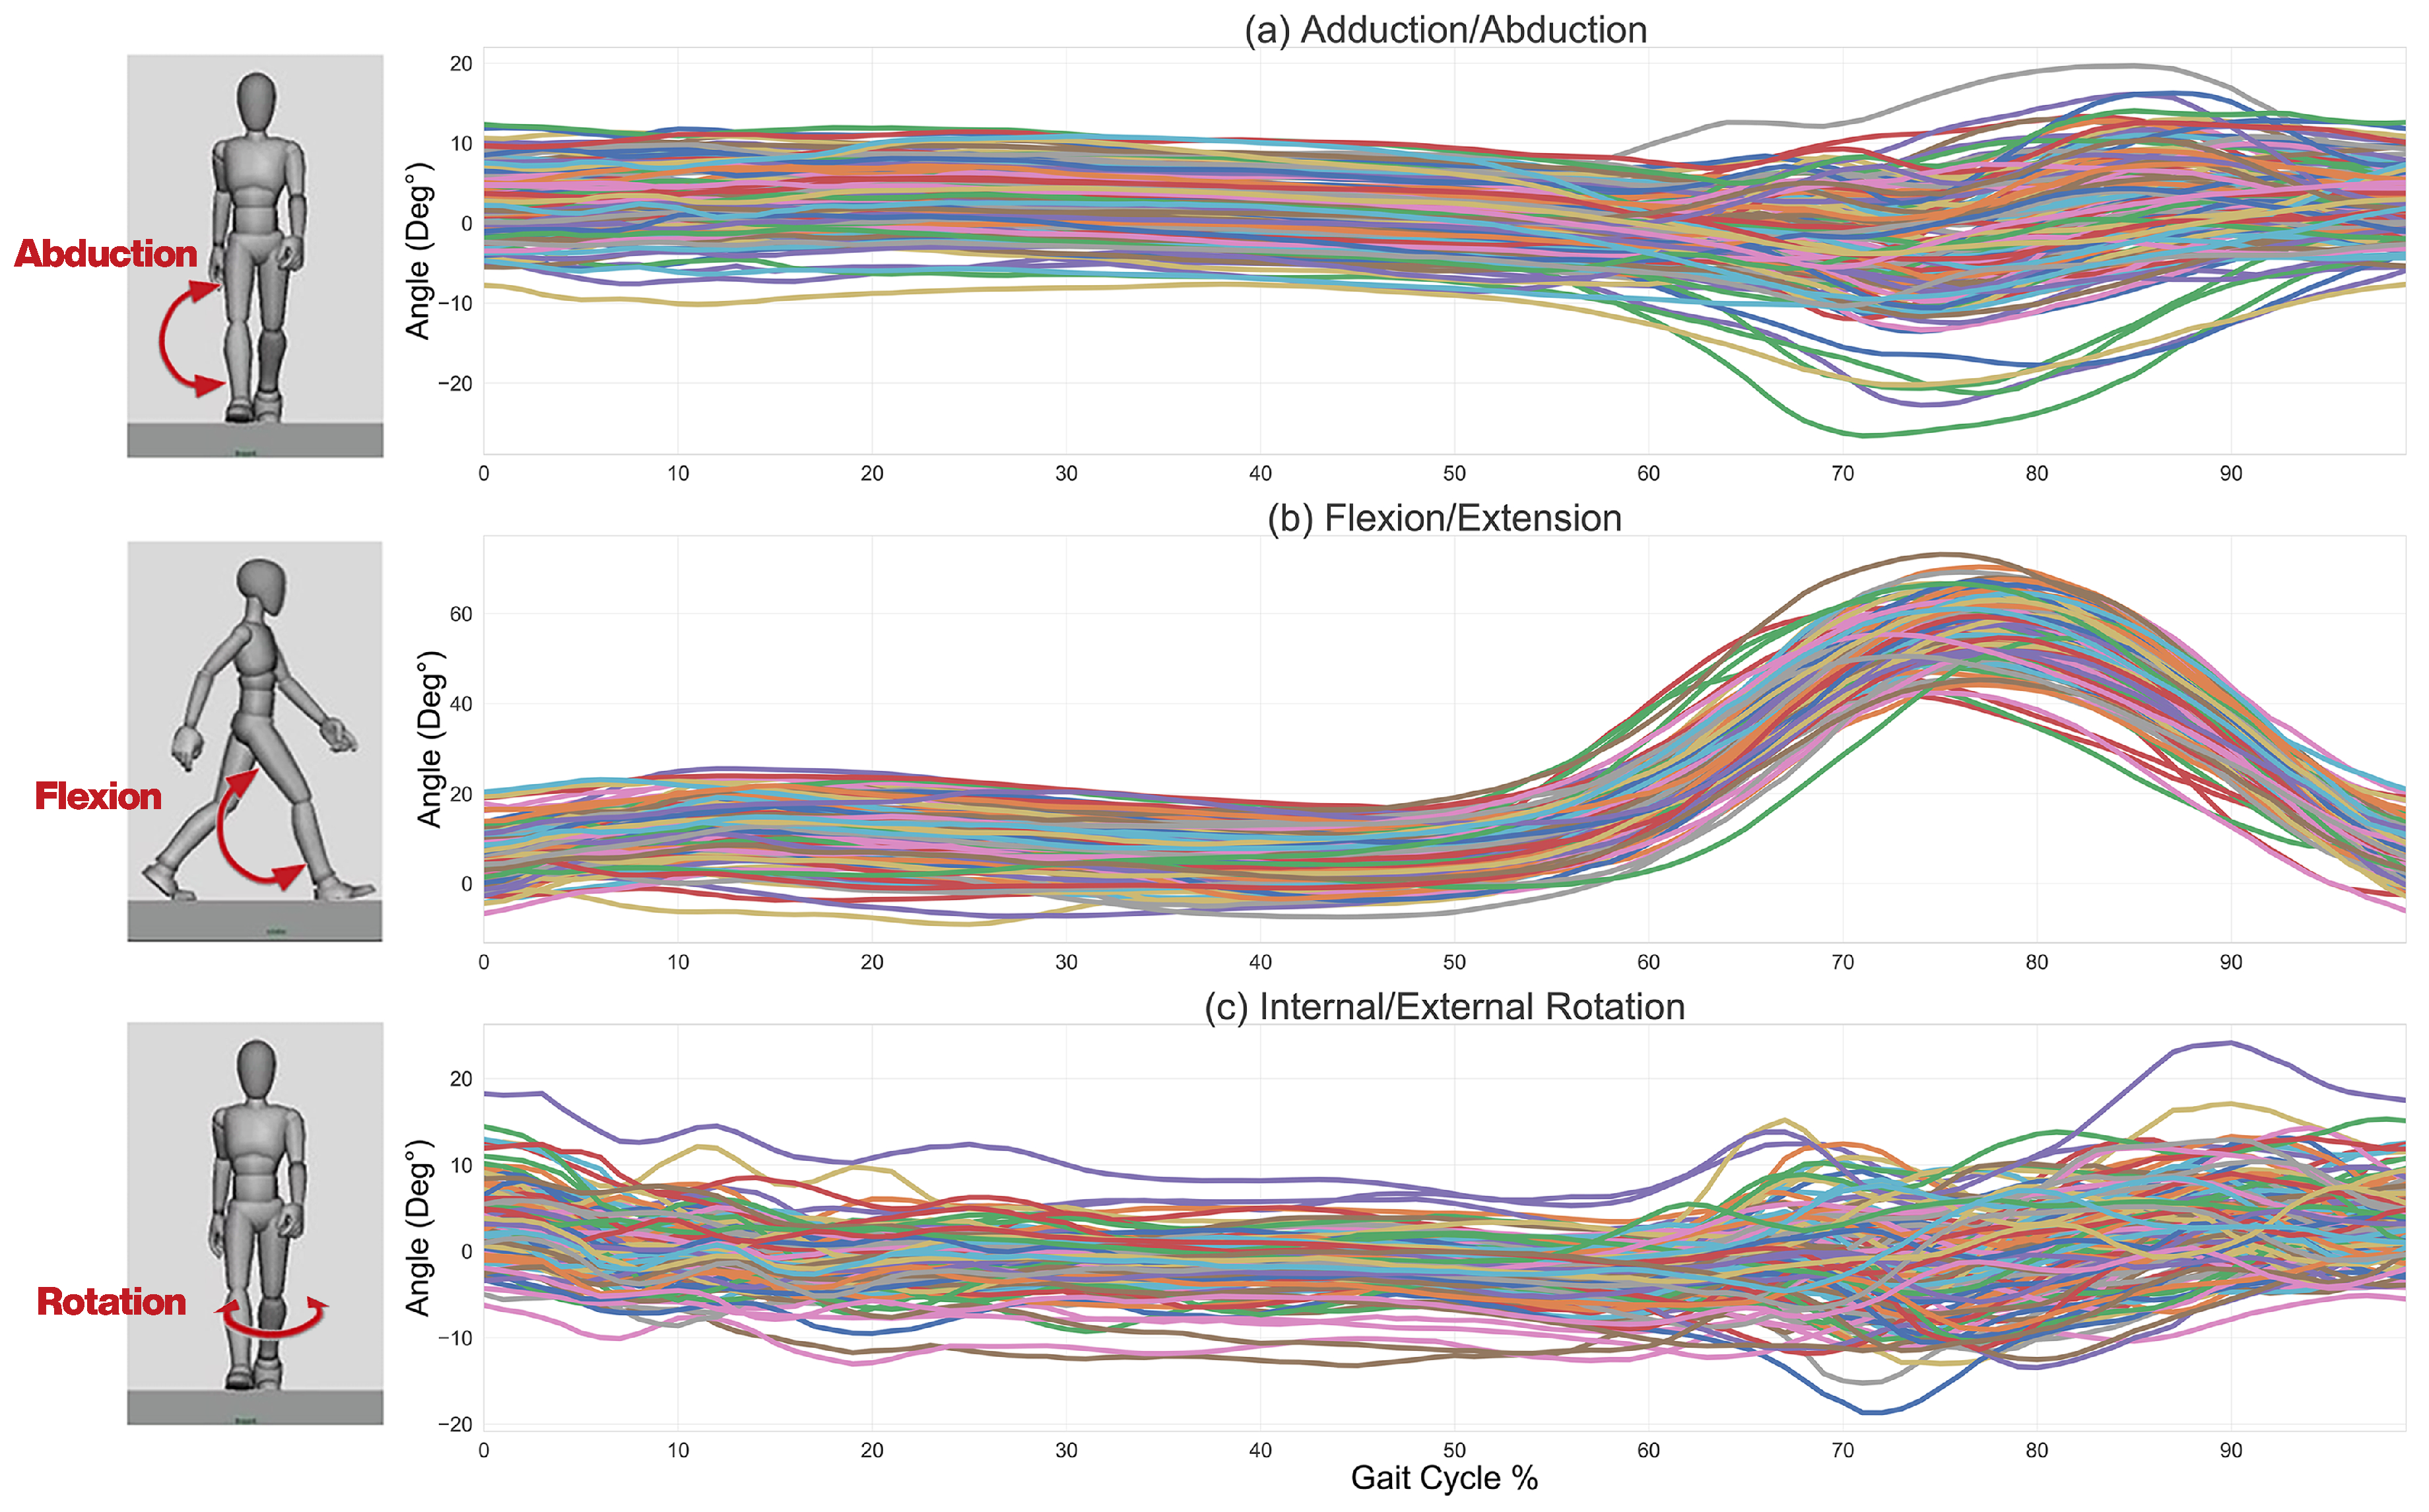
2.1. Kinematic Data Collection

Three-dimensional (3D) knee kinematics data (flexion/extension, abduction/adduction and internal/external rotation), from the sagittal, frontal, and transverse planes, respectively, were recorded while each participant walked on a treadmill at a self-selected, comfortable speed (Figure 2). The KneeKG™ system (Emovi Inc., Canada), which utilizes a knee marker attachment system designed to reduce skin-motion artifacts [29], was installed on participants’ knees to record 3D kinematics during gait trials. A number of representative trials, generally 15, were averaged to obtain a mean pattern per plane of movement per participant. This was followed by interpolation and resampling from 1 % to 100 % of the gait cycle (GC), therefore giving 100 measurement points per plane of movement for each participant.
The 3D kinematic data collection was performed on 75 participants (34 men and 41 women). All the participants had data recorded for both of their knees, meaning there were 150 total data sets. Volunteers were excluded if they had any lower limb pathology, musculoskeletal disorder, or previous lower limb surgery. Ethical approvals were obtained from the ethics committee of the Hôpital Maisonneuve-Rosemont (reference: 11098). All subjects provided informed consent before participation.

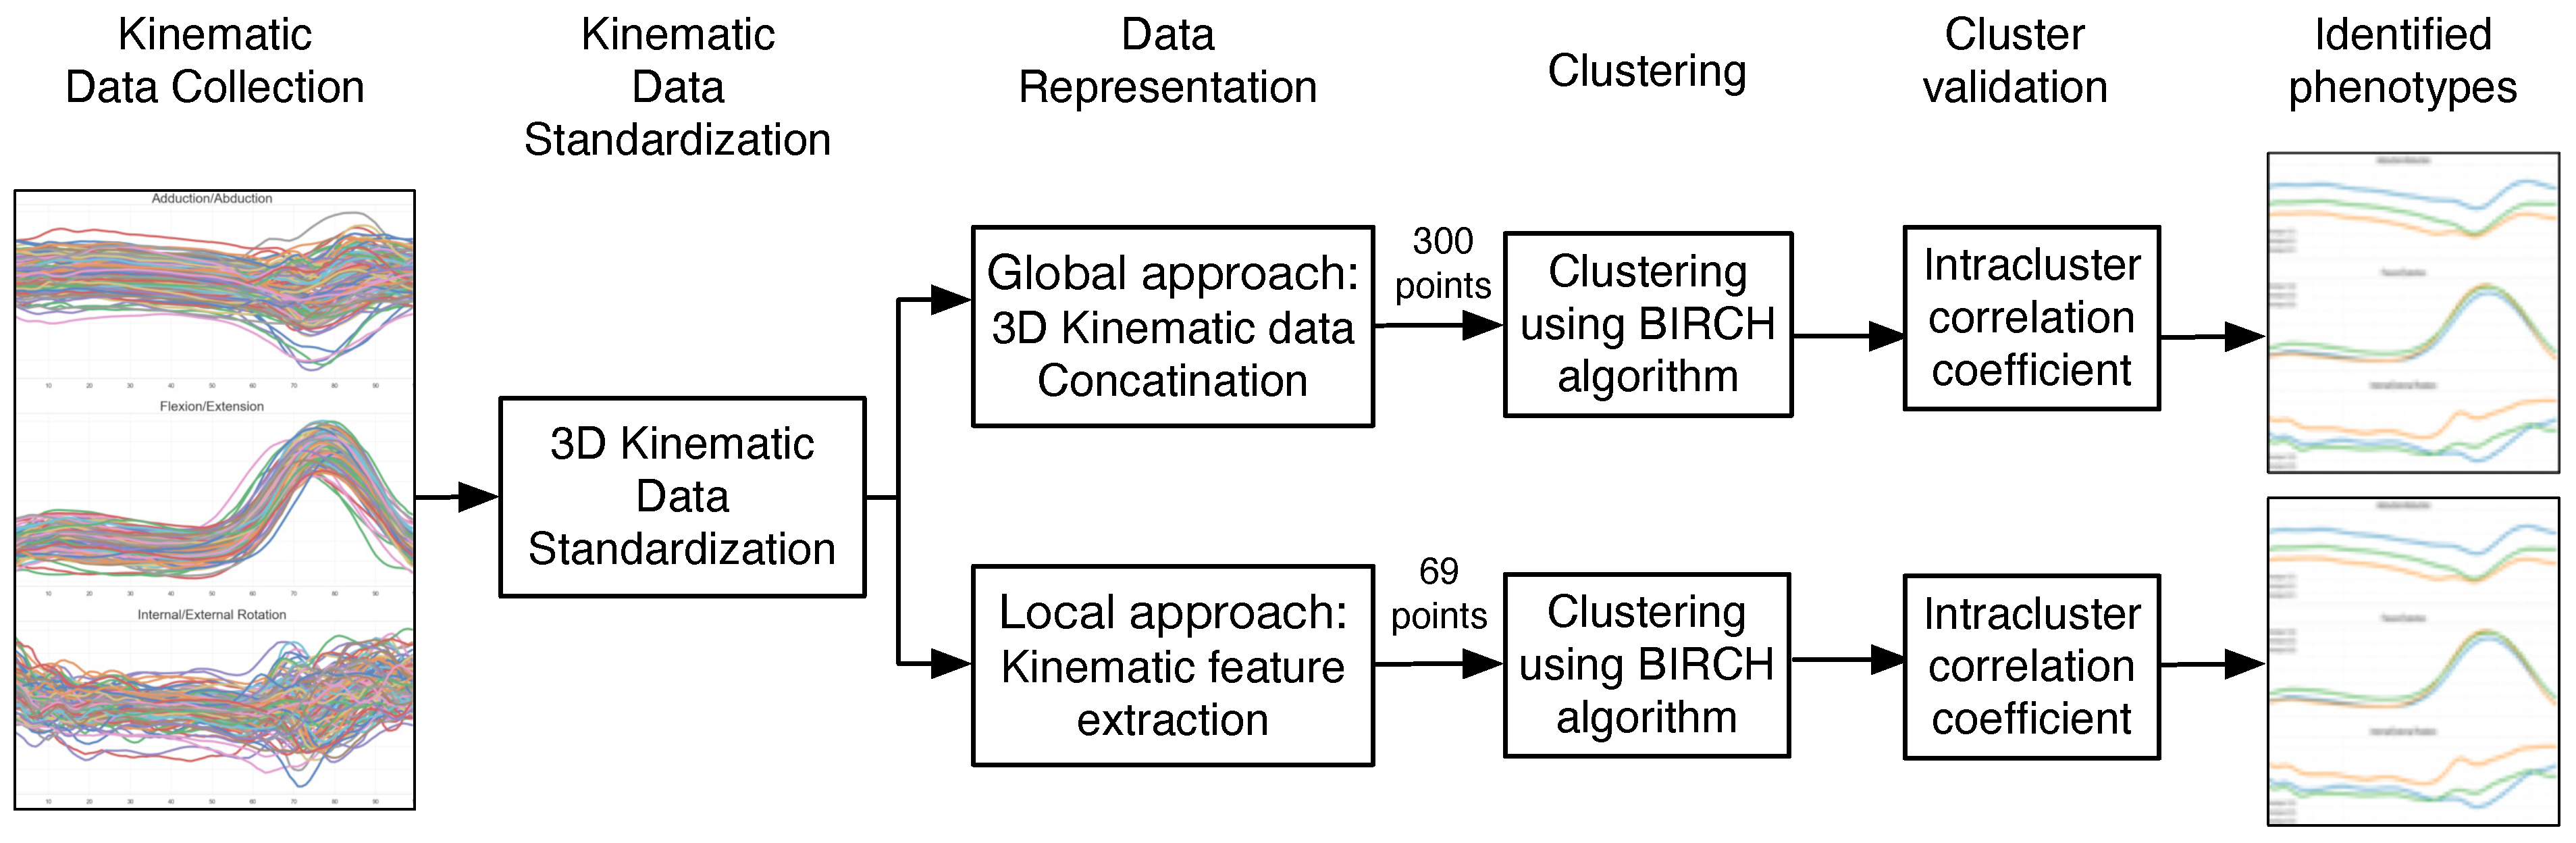
2.2. Kinematic Data Standardization

Kinematics data describe the knee movement in 3 dimensions. As the movement amplitude is different according to the movement plane (sagittal, frontal, and transverse), the obtained data are heterogeneous (i.e., range at different scales). A standardization was performed to take this aspect into account. Standardization is a scaling technique where the values are centered around the mean with a unit standard deviation (SD).

2.3. Kinematic Data Representation

In this study, we investigated two approaches for kinematic data computation: global and local representations.
In the global approach, the kinematics data from the three movement planes (sagittal, frontal, and transverse) were concatenated in order to form, for each participant, single vector data. Considering that each movement plane is characterized by 100 points, the concatenation leads to a resulting vector of 300 dimensions. This approach has the advantage of dealing with the entire curve without any loss of information.
The local approach consists of the extraction of a set of biomechanical parameters of interest from the 3D kinematic curves. We extracted 69 parameters distributed over the three planes: 30 from the frontal plane (abduction/adduction curve), 17 from the sagittal plane (flexion/extension curve) and 22 from the transverse (internal/external rotation). These parameters were based on an exhaustive literature review [30,31,32] and on variables routinely assessed in clinical biomechanical studies of knee osteoarthritis populations, such as maximums, minimums, varus and valgus thrust, angles at initial contact, mean values, and range of motion (ROM) throughout GCs or GC sub-phases (loading, stance, swing, etc.) [33,34].

2.4. Clustering for Phenotype Identification

The purpose of clustering is to extract meaningful patterns by separating the 3D kinematic data into homogeneous groups. The mean patterns, obtained by averaging the kinematic curves within each homogeneous group, form the knee kinematic phenotypes.

2.4.1. Clustering Model

In this study, we use a hierarchical clustering algorithm named balanced iterative reducing and clustering using hierarchies (BIRCH) [35] (Table 1). In its first stage, BIRCH clusters numeric data by merging hierarchical clustering (i.e., global clustering). Then, at later stages, it uses other existing clustering techniques (i.e., cluster refinement). BIRCH uses the clustering feature (CF) concept to describe a cluster. It represents the cluster hierarchy as a CF tree.
The main advantage of BIRCH is its ability to incrementally and dynamically cluster incoming, multi-dimensional data in an attempt to produce the best quality clustering. This is suitable for kinematic data and offers the opportunity to perform clustering without reducing the dimensionality of the data. Moreover, BIRCH can find high-quality clustering with only a single scan of a dataset and can efficiently handle noise caused by the kinematic data variability [28].

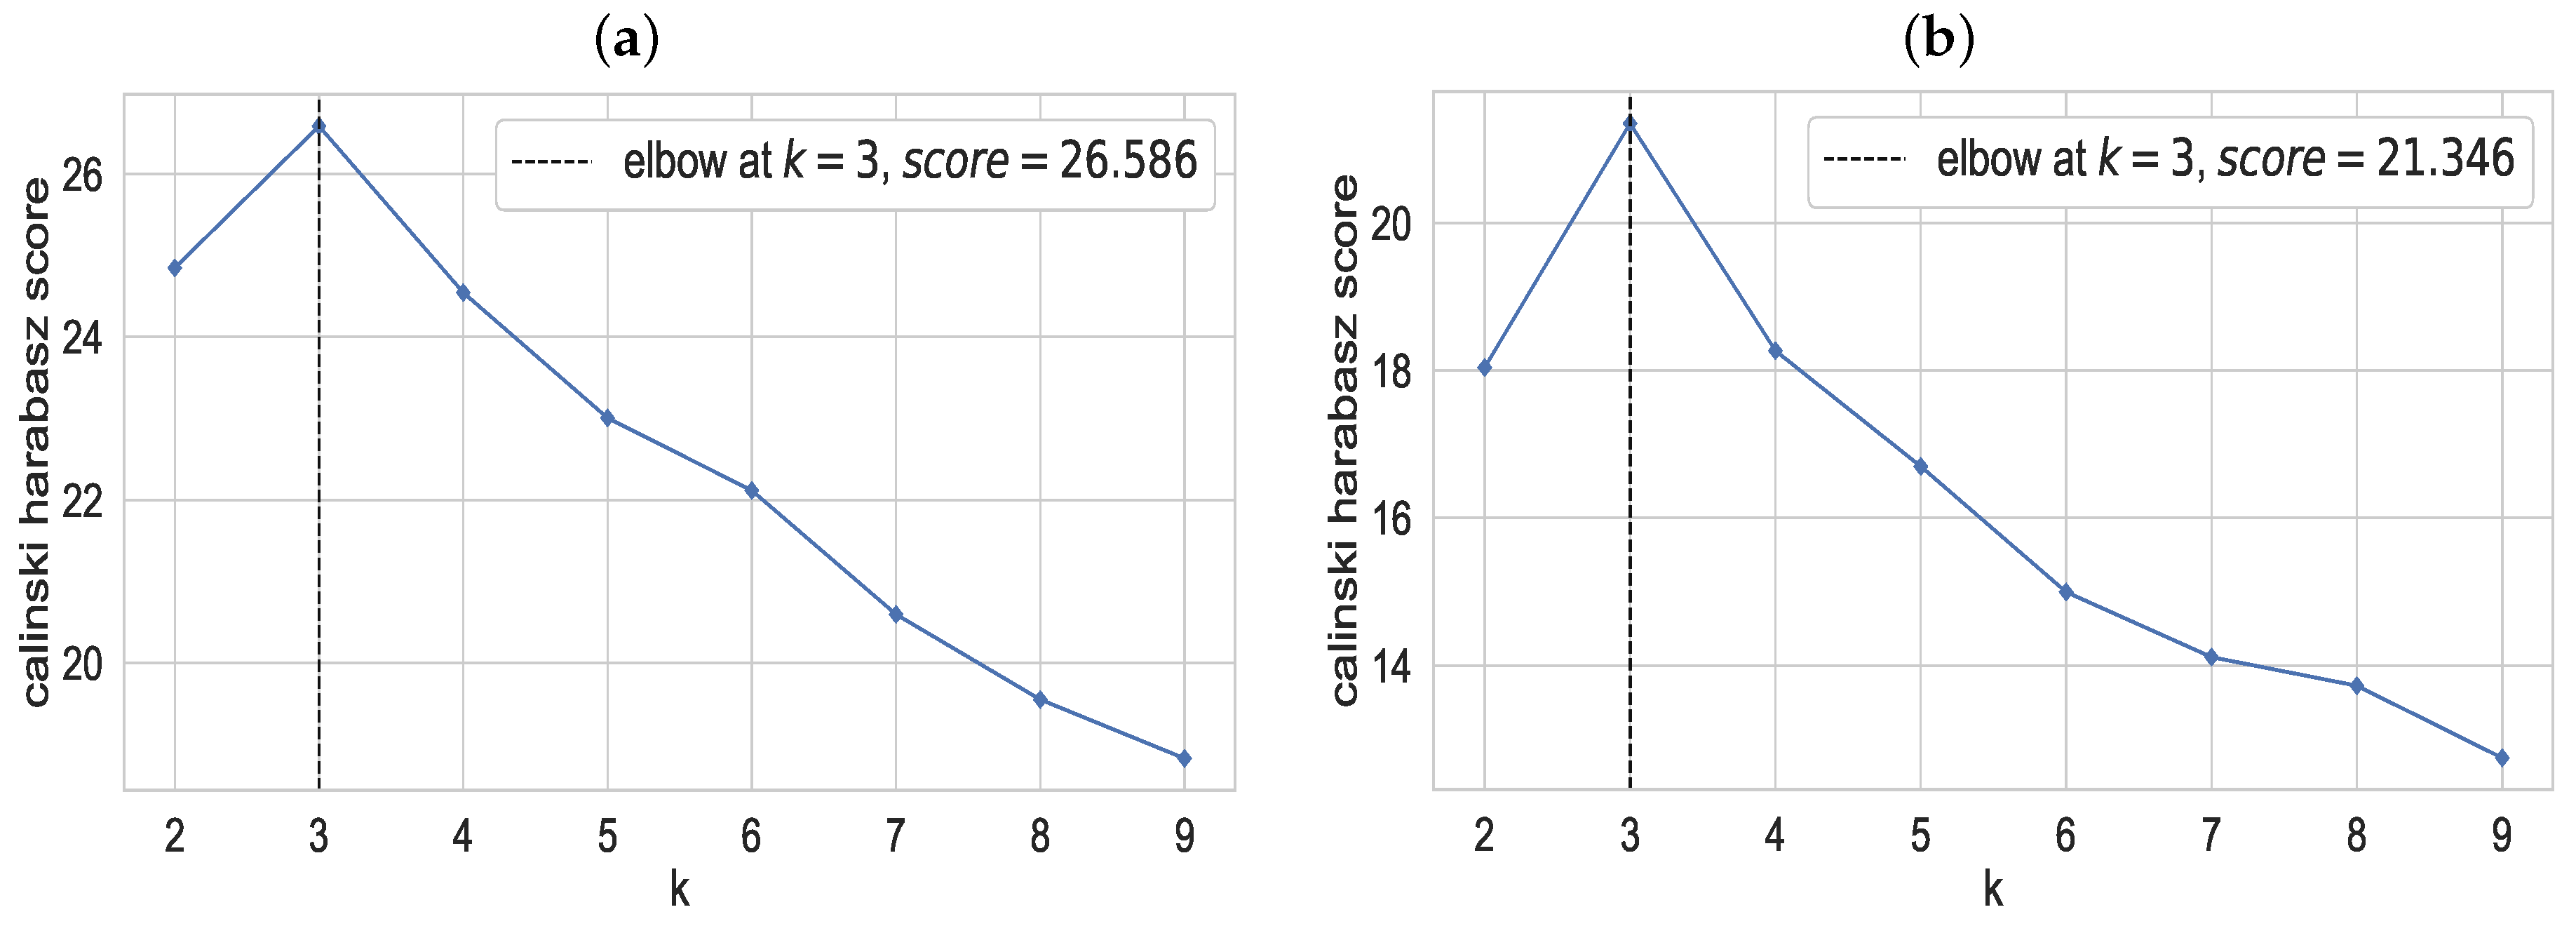
2.4.2. Optimum Number of Clusters

The optimum number of clusters is determined by the Calinski–Harabaz index (CH-index), which is a function of both the within-cluster-sum-of-squares ( S S w ) and the between-cluster-sum-of-squares ( S S b ) [36]. S S w measures the compactness of the cluster, while the S S b measures the separation between clusters.
A higher value of the CH-index means the clusters are dense and well separated. Although there is no “acceptable” cut-off value, we need to choose the number of clusters that gives the highest value of CH-indices.

2.4.3. Cluster Evaluation

The clustering model has been evaluated using the intra-class correlation coefficient (ICC), which informs how similar elements in the same cluster are. It provides a measure of homogeneity within the clusters. The ICC is conventionally calculated using the variance within clusters and the variance between clusters according to the following Equation (1):
I C C = σ b 2 σ b 2 + σ w 2
where σ b is the between-cluster variance and σ w is the within-cluster variance.
The values of ICC range from 0 to 1. From (1), as the within-cluster variance ( σ w 2 ) moves toward 0, ICC becomes closer to 1. A very small value for ICC implies that the within-cluster variance is much greater than the between-cluster variance, and an ICC of 0 shows that there is no correlation of responses within a cluster.

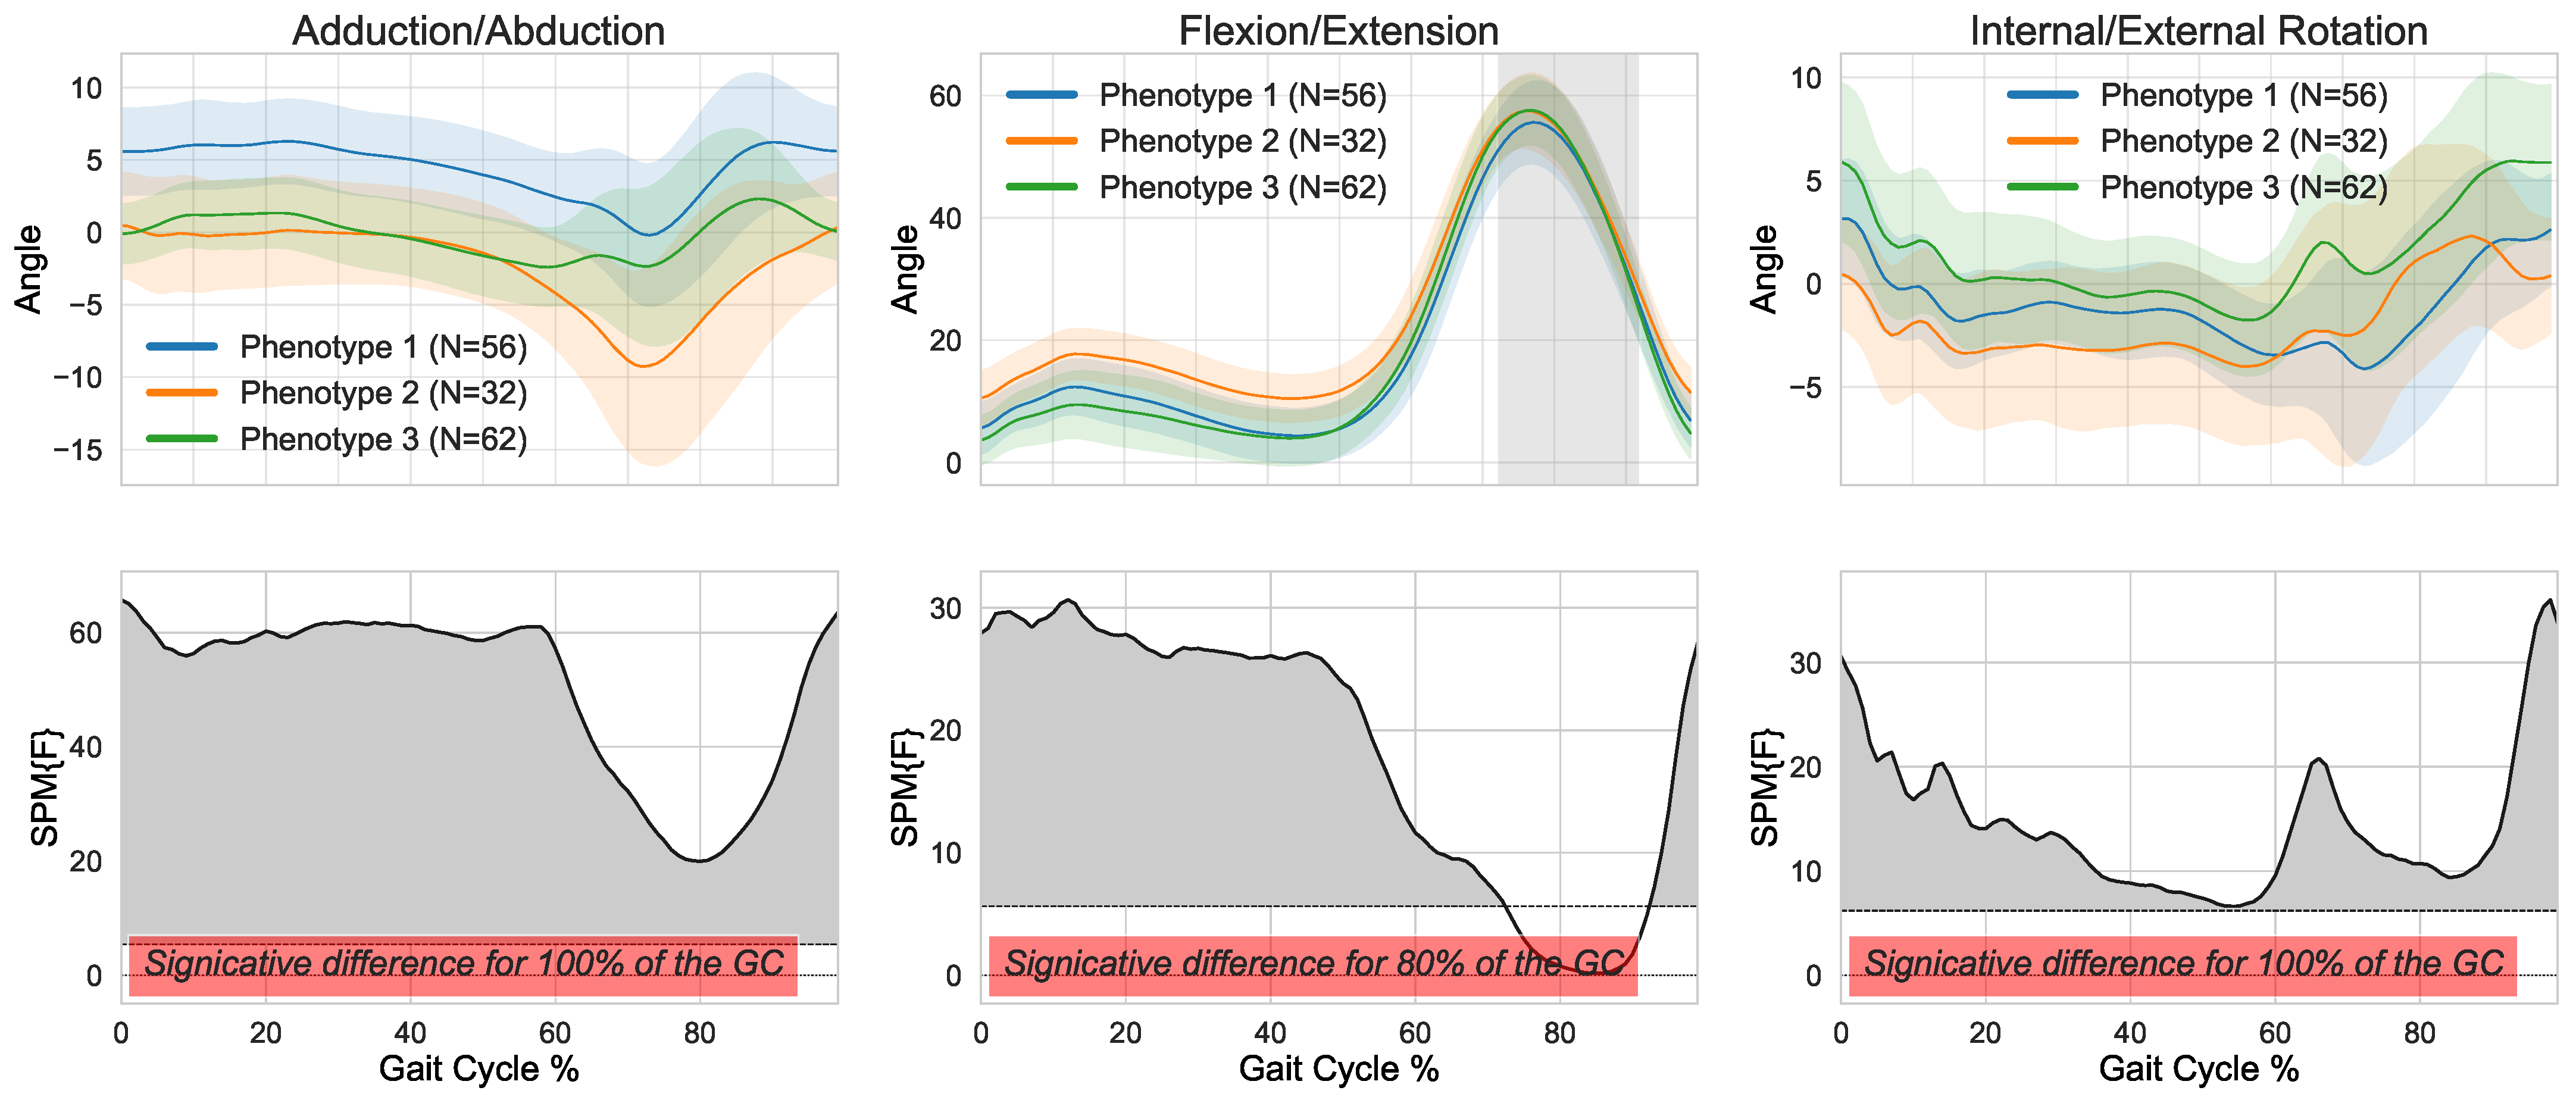
2.5. Statistical Analysis: Hypothesis Testing and Phenotype Interpretation

The statistical analysis aims to compare the identified phenotypes in order to assess differences between them. We used the 1D statistical parametric mapping (SPM), which is increasingly used for continuum data (e.g., kinematic data) by the biomechanics research community to assess the overall difference on each plane through a complete GC [37]. Chi-square and ANOVA tests were used to assess between-cluster differences in the demographic characteristics of the participants (i.e., sex, age, BMI).

3. Results

The experiments were implemented in Python 3.7 (ww.python.org accessed on 26 October 2021) using standard scientific and visualization packages: sklearn 0.24.2, matplotlib 0.99. The simulations were performed under the open source web application Jupyter Notebook.
Following 3D kinematic data standardization, we performed global and local data representations to generate, for each participant, input vectors of dimensions 300 and 69, respectively.
The optimum number of clusters was determined using the CH-index. Figure 3a,b plots the CH-index as a function of the number of clusters for the global and local representations, respectively. For both representations, the highest value of CH-indices is obtained with k = 3 clusters, indicating that the optimum number of clusters is three. For the rest of the paper, we will only consider three clusters.
The identified phenotypes are described in Figure 4 and Figure 5 based on global and local kinematic data representations, respectively (Line 1 of each figure). The three phenotypes are obtained by averaging the 3D kinematic curves within each homogeneous group identified by BIRCH clustering. In the following, the words ’phenotypes’ and ’clusters’ could be interchanged, but in fact, the phenotype is determined by averaging the curves identified in each cluster. The second line figures are related to 1D-SPM statistical analysis, which shows a statistical difference of the identified phenotypes in the three planes except for the flexion–extension when using a local representation (a statistical difference for 80% of the gait cycle). These results suggest a higher efficiency of the global representation, which will be retained for the following analysis.
We validated the obtained clusters using the intra-cluster correlation coefficient (ICC). Table 2 summarizes the ICC for the global representation. These values range from 0.27 to 0.76, showing a correlation between the different knee kinematic curves within the clusters.
The differences on the participants’ demographic characteristics between the clusters obtained with the global approach are shown in Table 3. There were significantly more men in Cluster 1 (60% of men and 40% of women) compared to Clusters 2 (30% of men and 70% of women) and 3 (42% of men and 58% of women, p < 0.01 and p = 0.03, respectively). Based on an ANOVA test, participants from Cluster 2 had a significantly higher BMI than participants from Cluster 1 (25.61 vs 23.68 kg/m2, p < 0.01). There was no differences in terms of age between the three clusters (p = 0.60).

4. Discussion

The SPM analysis showed that the global approach was more efficient than the local approach to identify distinct clusters (Figure 4). Indeed, there was an overall statistical difference in all three planes (throughout 100% of the gait cycle). The statistical difference between clusters was limited to 80% of the gait cycle in the frontal plane based on the local representation method (Figure 5). Notably, the optimum number of clusters determined by the CH-index was similar using both approaches. It is interesting to highlight that the mean ICC in the sagittal plane was lower than the two other planes and that this was true for the majority of the clusters. This result was predictable, as the bundle of curves is narrower for the sagittal plane (Figure 2b) than for the two other planes (Figure 2a,c). This makes the partition of the data into three groups more difficult and hence the obtained phenotypes more similar.
The global approach further led to a separation of the 3D kinematic data into homogeneous groups and meaningful phenotypes. Based on the I C C values, the kinematical similarity between members of the same cluster was maximized in the frontal plane (i.e., varus–valgus alignment).
Although the local approach gathers a representative list of parameters of interest, it performs less well than the global approach. Indeed, the latter keeps all the kinematic curves and thus naturally includes the totality of the information. The use of the global representation that assumes high-dimensional data vectors (a vector of 300 dimensions corresponding to the concatenation of the 3 planes of kinematic data) is made possible by the utilization of the BIRCH algorithm. It is especially suitable for clustering very large datasets [35] and the first clustering algorithm to be proposed that handles noise effectively [38]. These strengths made it very suitable for kinematic data analysis as it can handle high dimensional data compared to other clustering algorithms. This is due to the fact that when dimensionality increases, only a small number of dimensions are relevant for certain clusters. Thus, data in irrelevant dimensions may act as noise and mask the formation of the real clusters, which can be avoided with the BIRCH algorithm.
The three clusters allow the occurrence of three specific phenotypes of knee kinematics. The first phenotype (Cluster 1, c.f. blue curve of Figure 4) describes participants walking with a predominant dynamic varus alignment (i.e., adduction) through the entire GC, starting with a mean varus angle at heel strike greater than 5°. In the transversal plane, these participants accentuate their internal tibia rotation during the first half of their swing phase. Participants from Cluster 2 (c.f. orange curve) show a predominant dynamic valgus alignment, especially during stance and swing phases of their GC, and an external tibia rotation throughout their GC. Finally, participants from Cluster 3 (c.f. green curve) had the most neutral alignment in the frontal and transverse plane. They also show greater flexion contracture (i.e., flexum) at heel strike and throughout the stance phase.
The cluster with a majority of men (i.e., Cluster 1) showed greater varus alignment compared to the other clusters. Alternatively, Cluster 2 was composed mainly of women (more than 2 out of 3 participants) and showed a greater dynamic valgus alignment. These results are similar to what was shown in a previous study in which men were typically more varus aligned and women more neutral or valgus aligned on radiographs [39].
Results from this study are an important step in better understanding 3D knee kinematics in a healthy asymptomatic population. When investigating the impact of an injury or developing treatment plans to restore knee function, it is crucial to first understand the “normal” state. Phenotyping has shown to be valuable in precision medicine. Indeed, it can be used to define groups of patients that are more prone to develop chronic conditions or that may respond better to specific treatments. Therefore, the method proposed in this paper could be applied to different populations to help in the assessment of knee conditions and to monitor and personalize treatment pathways.

5. Conclusions

A global approach considering kinematic data from all planes of movement together allowed a more efficient identification of three distinct phenotypes than a local approach in a healthy knee population. The three identified 3D kinematic phenotypes may allow us to better understand the “normal” knee movement during gait and refine the target for the treatment of mechanical knee disorders. Further research is needed to better characterize these phenotypes and quantify differences in additional participants’ characteristics.

Author Contributions

Conceptualization, R.S., N.M. and Y.O.; methodology, R.S., N.M. and Y.O.; software, R.S., N.M. and Y.O.; validation, N.H., A.F., A.C. and P.-A.V.; formal analysis, N.M. and Y.O.; investigation, N.M. and Y.O.; resources, N.M., N.H. and P.-A.V.; data curation, Y.O. and A.C.; writing—original draft preparation, N.M. and R.S.; writing—review and editing, R.S., N.M., A.C., A.F., N.H. and P.-A.V.; supervision, N.M., N.H. and P.-A.V.; project administration, N.M., N.H. and P.-A.V.; funding acquisition, N.M. All authors have read and agreed to the published version of the manuscript.

Funding

This research was supported by the Natural Sciences and Engineering Research Council Grant, Industrial Research and Development Internship Program (RGPIN-2015-03853) and the Canada Research Chair on Biomedical Data Mining (950-231214).

Institutional Review Board Statement

Ethical approvals were obtained from the ethics committee of the Hopital Maisonneuve-Rosemont (reference: 11098).

Informed Consent Statement

All subjects provided informed consent before participation.

Data Availability Statement

The data presented in this study should be available on request from the corresponding author. The data are not publicly available due to ethical restrictions.

Acknowledgments

The authors would like to thank Julien Clément and Panagiota Toliopoulos for the data collection and data management.

Conflicts of Interest

The authors declare no conflict of interest.

References

  1. Phinyomark, A.; Osis, S.; Hettinga, B.A.; Ferber, R. Kinematic gait patterns in healthy runners: A hierarchical cluster analysis. J. Biomech. 2015, 48, 3897–3904. [Google Scholar] [CrossRef] [PubMed]
  2. Clément, J.; Toliopoulos, P.; Hagemeister, N.; Desmeules, F.; Fuentes, A.; Vendittoli, P.A. Healthy 3D knee kinematics during gait: Differences between women and men, and correlation with X-ray alignment. Gait Posture 2018, 64, 198–204. [Google Scholar] [CrossRef]
  3. Duda, R.O.; Hart, P.E.; Stork, D.G. Pattern Classification; Wiley-Interscience Publication: New York, NY, USA, 2000. [Google Scholar]
  4. Phinyomark, A.; Petri, G.; Ibáñez-Marcelo, E.; Osis, S.T.; Ferber, R. Analysis of big data in gait biomechanics: Current trends and future directions. J. Med. Biol. Eng. 2018, 38, 244–260. [Google Scholar] [CrossRef] [PubMed] [Green Version]
  5. Chau, T.; Young, S.; Redekop, S. Managing variability in the summary and comparison of gait data. J. Neuroeng. Rehabil. 2005, 22, 22–42. [Google Scholar] [CrossRef] [Green Version]
  6. Winter, D. Kinematic and kinetic patterns in human gait: Variability and compensating effects. Hum. Mov. Sci. 1984, 3, 51–76. [Google Scholar] [CrossRef]
  7. Lafortune, M.A.; Cavanagh, P.; Sommer, H.J.; Kalenak, A. Three-dimensional kinematics of the human knee during walking. J. Biomech. 1992, 25, 347–357. [Google Scholar] [CrossRef]
  8. Toliopoulos, P. Knee Gait Kinematics: Describing a Normal Cohort; Montreal University: Montreal, QC, Canada, 2018. [Google Scholar]
  9. Han, S.; Cheng, G.; Xu, P. Three-dimensional lower extremity kinematics of Chinese during activities of daily living. J. Back Musculoskelet. Rehabil. 2015, 28, 327–334. [Google Scholar] [CrossRef]
  10. Chehab, E.; Andriacchi, T.; Favre, J. Speed, age, sex, and body mass index provide a rigorous basis for comparing the kinematic and kinetic profiles of the lower extremity during walking. J. Biomech. 2017, 58, 11–20. [Google Scholar] [CrossRef] [PubMed]
  11. Li, J.; Wyss, U.; Costigan, P.; Deluzio, K. An integrated procedure to assess knee-joint kinematics and kinetics during gait using an optoelectric system and standardized X-rays. J. Biomed. Eng. 1993, 15, 392–400. [Google Scholar] [CrossRef]
  12. Chao, E.; Laughman, R.; Schneider, E.; Stauffer, R. Normative data of knee joint motion and ground reaction forces in adult level walking. J. Biomech. 1983, 16, 219–233. [Google Scholar] [CrossRef]
  13. Benedetti, M.; Catani, F.; Leardini, A.; Pignotti, E.; Giannini, S. Data management in gait analysis for clinical applications. Clin. Biomech. 1998, 13, 204–215. [Google Scholar] [CrossRef]
  14. Shiavi, R.; Limbird, T.; Frazer, M.; Stivers, K.; Strauss, A.; Abramovitz, J. Helical motion analysis of the knee II. Kinematics of uninjured and injured knees during walking and pivoting. J. Biomech. 1987, 20, 653–665. [Google Scholar] [CrossRef]
  15. Frigo, C.; Rabuffetti, M.; Kerrigan, D.; Deming, L.; Pedotti, A. Functionally oriented and clinically feasible quantitative gait analysis method. Med. Biol. Eng. Comput. 1998, 36, 179–185. [Google Scholar] [CrossRef] [PubMed]
  16. Isacson, J.; Gransberg, L.; Knutsson, E. Three-dimensional electrogoniometric gait recording. J. Biomech. 1986, 19, 627–635. [Google Scholar] [CrossRef]
  17. Kadaba, M.; Ramakrishnan, H.; Wootten, M.; Gainey, J.; Gorton, G.; Cochran, G. Repeatability of kinematic, kinetic, and electromyographic data in normal adult gait. J. Orthop. Res. 1989, 7, 849–860. [Google Scholar] [CrossRef] [PubMed]
  18. Benoit, D.; Ramsey, D.; Lamontagne, M.; Xu, L.; Wretenberg, P.; Renstrom, P. In vivo knee kinematics during gait reveals new rotation profiles and smaller translations. Clin. Orthop. Relat. Res. 2007, 454, 81–88. [Google Scholar] [CrossRef]
  19. Watelain, E.; Barbier, F.; Allard, P.; Thévenon, A.; Angué, J. Gait pattern classification of elderly healthy men on the basis of biomechanical data. Arch. Phys. Med. Rehabil. 2000, 81, 579–586. [Google Scholar] [CrossRef]
  20. Vardaxis, V.; Allard, P.; Lachance, R.; Duhaime, M. Classification of able-bodied gait using 3-D muscle powers. Hum. Mov. Sci. 1998, 17, 121–136. [Google Scholar] [CrossRef]
  21. Toro, B.; Nester, C.; Farren, P. Cluster analysis for the extraction of sagittal gait patterns in children with cerebral palsy. Gait Posture 2007, 25, 157–165. [Google Scholar] [CrossRef]
  22. Xu, G.; Zhang, Y.; Begg, R. Mining Gait Pattern for Clinical Locomotion Diagnosis Based on Clustering Techniques. In Advanced Data Mining and Applications; Springer: Berlin/Heidelberg, Germany, 2006; pp. 296–307. [Google Scholar]
  23. Mulroy, S.; Gronley, J.; Weiss, W.; Newsam, C.; Perry, J. Use of cluster analysis for gait pattern classification of patients in the early and late recovery phases following stroke. Gait Posture 2003, 18, 114–125. [Google Scholar] [CrossRef]
  24. O’Byrne, J.; Jenkinson, A.; O’Brien, T. Quantitative analysis and classification of gait patterns in cerebral palsy using a three-dimensional motion analyzer. J. Child Neurol. 1998, 13, 101–108. [Google Scholar] [CrossRef]
  25. Kienast, G.; Bachmann, D.; Steinwender, G.; Zwick, E.; Saraph, V. Determination of gait patterns in children with cerebral palsy using cluster analysis. Gait Posture 1999, 57. [Google Scholar] [CrossRef]
  26. Zeng, W.; Ma, L.; Yuan, C.; Liu, F.; Wang, Q.; Wang, Y.; Zhang, Y. Classification of asymptomatic and osteoarthritic knee gait patterns using gait analysis via deterministic learning. Artif. Intell. Rev. 2019, 52, 449–467. [Google Scholar] [CrossRef]
  27. O’Malley, M.; Abel, M.; Damiano, D.; Vaughan, C. Fuzzy clustering of children with cerebral palsy based on temporal-distance gait parameters. IEEE Trans. Rehabil. Eng. 1997, 5, 300–309. [Google Scholar] [CrossRef]
  28. Mezghani, N.; Mechmeche, I.; Mitiche, A.; Ouakrim, Y.; de Guise, J.A. An analysis of 3D knee kinematic data complexity in knee osteoarthritis and asymptomatic controls. PLoS ONE 2018, 13, e0202348. [Google Scholar] [CrossRef] [PubMed] [Green Version]
  29. Lustig, S.; Magnussen, R.; Cheze, L.; Neyret, P. The KneeKG system: A review of the literature. Knee Surg. Sports Traumatol. Arthrosc. 2011, 20, 633–638. [Google Scholar] [CrossRef] [PubMed] [Green Version]
  30. Abid, M.; Mezghani, N.; Mitiche, A. Knee Joint Biomechanical Gait Data Classification for Knee Pathology Assessment: A Literature Review. Appl. Bionics Biomech. 2019, 2019, 7472039. [Google Scholar] [CrossRef] [Green Version]
  31. Chang, A.H.; Chmiel, J.S.; Moisio, K.C.; Almagor, O.; Zhang, Y.; Cahue, S.; Sharma, L. Varus thrust and knee frontal plane dynamic motion in persons with knee osteoarthritis. Osteoarthr. Cartil. 2013, 21, 1668–1673. [Google Scholar] [CrossRef] [Green Version]
  32. Sharma, L.; Song, J.; Felson, D.T.; Cahue, S.; Shamiyeh, E.; Dunlop, D.D. The role of knee alignment in disease progression and functional decline in knee osteoarthritis. JAMA 2013. [Google Scholar] [CrossRef] [PubMed] [Green Version]
  33. Deluzio, K.J.; Wyss, U.P.; Costigan, P.A.; Sorbie, C.S. Principal component models of knee kinematics and kinetics: Normal vs. pathological gait patterns. J. Hum. Mov. Sci. 1997, 16, 201–217. [Google Scholar] [CrossRef]
  34. Shabani, B.; Bytyqi, D.; Lustig, S.; Cheze, L.; Bytyqi, C.; Neyret, P. Gait changes of the ACL-deficient knee 3D kinematic assessment. Knee Surg. Sports Traumatol. Arthrosc. 2014, 23, 3259–3265. [Google Scholar] [CrossRef] [PubMed]
  35. Zhang, T.; Ramakrishnan, R.; Livny, M. BIRCH: A New Data Clustering Algorithm and its Applications. Data Min. Knowl. Discov. 1997, 1, 141–182. [Google Scholar] [CrossRef]
  36. Caliński, T.; Harabasz, J. A Dendrite Method for Cluster Analysis. Commun. Stat.-Theory Methods 1974, 3, 1–27. [Google Scholar] [CrossRef]
  37. Riley, P.O.; Paolini, G.; Della Croce, U.; Paylo, K.W.; Kerrigan, D.C. A kinematic and kinetic comparison of overground and treadmill walking in healthy subjects. Gait Posture 2019, 26, 9–18. [Google Scholar] [CrossRef] [PubMed]
  38. Shetty, N.; Shirwaikar, R. A Comparative Study: BIRCH and CLIQUE. Int. J. Eng. Res. Technol. 2013, 2, 2019–2023. [Google Scholar]
  39. Bellemans, J.; Colyn, W.; Vandenneucker, H.; Victor, J. The Chitranjan Ranawat award: Is neutral mechanical alignment normal for all patients? The concept of constitutional varus. Clin. Orthop. Relat. Res. 2012, 470, 45–53. [Google Scholar] [CrossRef] [PubMed] [Green Version]
Figure 1. Block diagram of the adopted methodology.
Applsci 11 12054 g001
Figure 2. Knee kinematic data describe variations of knee movement in 3 dimensions during a gait cycle (1% being the initial contact and 100% is the end of a gait cycle). The 3 dimensions are (a) abduction/adduction in the frontal plane, (b) flexion/extension in the sagittal plane, and (c) internal/external rotation in the transverse plane.
Applsci 11 12054 g002
Figure 3. The curves of the CH-index according to the number of clusters for (a) global representation and (b) local representation.
Applsci 11 12054 g003
Figure 4. The three identified phenotypes based on global representation (Line 1) and the corresponding SPM{t} with a significance threshold α = 0.05 (Line 2). The gray area indicates the percentage of the gait cycle for which the three phenotypes are different.
Applsci 11 12054 g004
Figure 5. The three identified phenotypes based on local representation (Line 1) and the corresponding SPM{t} with a significance threshold α = 0.05 (Line 2). The gray area indicates the percentage of the gait cycle for which the three phenotypes are different.
Applsci 11 12054 g005
Table 1. Balanced iterative reducing and clustering using hierarchies (BIRCH) algorithm.
Phase 1: Build the CF Tree. Load the data into the memory by building a cluster-feature tree (CF tree, defined below). Optionally, condense this initial CF tree into a smaller CF.
Phase 2: Global clustering. Apply an existing clustering algorithm on the leaves of the CF tree. Optionally, refine these clusters.
Table 2. Intracluster correlation coefficient (ICC) using the global representation.
ClustersFrontal
(Adduction/Abduction)
Sagittal
(Flexion/Extension)
Transverse
(Int./External Rotation)
Cluster 10.740.540.39
Cluster 20.510.270.60
Cluster 30.760.340.60
Table 3. Between-cluster differences on the demographic characteristics of the participants (units ± SD).
CharacteristicsAll ParticipantsCluster 1Cluster 2Cluster 3
Number of knees150483072
Age (years) 33.11 ± 10.14 32.89 ± 9.69 31.62 ± 8.52 33.85 ± 11.04
Height (m) 1.69 ± 0.11 1.71 ± 0.12 1.68 ± 0.11 1.69 ± 0.10
Weight (kg) 70.75 ± 16.12 69.57 ± 14.68 72.56 ± 15.91 70.79 ± 17.23
BMI (kg/m2) * 24.42 ± 4.07 23.68 ± 3.43 25.61 ± 4.0 24.42 ± 4.41
Ratio Men/Women * 68 / 82 29 / 19 9 / 21 30 / 42
* Significant statistical difference, p < 0.05.
Publisher’s Note: MDPI stays neutral with regard to jurisdictional claims in published maps and institutional affiliations.

