Article

Detection of Foreign Materials on Broiler Breast Meat Using a Fusion of Visible Near-Infrared and Short-Wave Infrared Hyperspectral Imaging

U.S. National Poultry Research Center, Agricultural Research Service (ARS), United States Department of Agriculture (USDA), 950 College Station Rd., Athens, GA 30605, USA
*
Author to whom correspondence should be addressed.
Appl. Sci. 2021, 11(24), 11987; https://doi.org/10.3390/app112411987
Submission received: 22 October 2021 / Revised: 4 December 2021 / Accepted: 14 December 2021 / Published: 16 December 2021

Abstract

:
Foreign material (FM) found on a poultry product lowers the quality and safety of the product. We developed a fusion method combining two hyperspectral imaging (HSI) modalities in the visible-near infrared (VNIR) range of 400–1000 nm and the short-wave infrared (SWIR) range of 1000–2500 nm for the detection of FMs on the surface of fresh raw broiler breast fillets. Thirty different types of FMs that could be commonly found in poultry processing plants were used as samples and prepared in two different sizes (5 × 5 mm2 and 2 × 2 mm2). The accuracies of the developed Fusion model for detecting 2 × 2 mm2 pieces of polymer, wood, and metal were 95%, 95%, and 81%, respectively, while the detection accuracies of the Fusion model for detecting 5 × 5 mm2 pieces of polymer, wood, and metal were all 100%. The performance of the Fusion model was higher than the VNIR- and SWIR-based detection models by 18% and 5%, respectively, when F1 scores were compared, and by 38% and 5%, when average detection rates were compared. The study results suggested that the fusion of two HSI modalities could detect FMs more effectively than a single HSI modality.

1. Introduction

Foreign material (FM) found in poultry products may pose serious health risks to consumers and trigger massive product recalls and consumer complaints that often result in reputational damage to individual companies and the entire poultry industry [1,2,3,4]. Foreign materials (FMs) such as pieces of plastic, rubber, and fabric from processing equipment and personal protective equipment can be unintentionally added to products during processing and packaging. Therefore, detecting any visible FMs found on the surface of meat prior to the grinding process is highly desirable. With the advancement in sensing and automation technology, the detection of FMs in poultry products has been automated mainly with X-ray machines and metal detectors. Broken bone fragments are often found inside poultry meat products because bones can be naturally broken and thus embedded during automated processing [5]. Sharp metal pieces can be detected inside the meat as well because of their shape and high material density compared to the density of poultry meat [6]. X-ray machines and metal detectors have been popular in the industry because they can effectively detect metal and embedded bone fragments whose densities are much higher than the density of poultry meat. However, their detectability for low-density materials such as plastic and rubber is limited [7].
Many other non-destructive image-based sensing techniques have also been studied to detect FMs in food, including thermal imaging, terahertz spectroscopy, near-infrared spectroscopy, hyperspectral imaging, and machine vision [8]. Thermal imaging is a rapid imaging modality that does not rely on ionizing radiation such as X-rays. However, thermal imaging can be affected by the temperature of the surrounding environment [9]. Terahertz spectroscopy using non-ionizing radiation and low photon energies can detect various materials because the terahertz radiation penetrates the materials but cannot penetrate water whose concentration is high in poultry meat [10]. Hyperspectral imaging (HSI) is a non-destructive spectral imaging technique that combines spectroscopy with imaging. HSI has shown outstanding performance in the quality and safety evaluation of agricultural and food products [11]. HSI produces a vast amount of spatial and spectral information which is carried over across image pixels and wavelengths. HSI is known to be effective for differentiating different types of materials and analyzing spatial distributions of physical and bio-chemical components in materials qualitatively and qualitatively. In the meat industry, many studies used HSI for evaluating quality attributes in various meat types, including beef [12], pork [13], lamb [14], and poultry [15,16,17]. Recently, HSI techniques have been used to detect FMs in various agricultural products. Sugiyama et al. [18] used near-infrared (NIR) spectral imaging and discriminant analysis to detect leaves and stems from frozen blueberries. Zhang et al. [19] used short-wave infrared (SWIR) hyperspectral transmittance imaging to detect stem, bark, leaf, paper, and plastic in cotton. Mo et al. [20] used fluorescence HSI to detect worms on fresh lettuce. Zhang et al. [21] detected microplastics in the intestine tract of fish. Al-Sarayreh et al. [22] used deep learning techniques based on region-proposal networks and 3D convolutional neural networks for FM detection in red meat with HSI. Song et al. [23] detected fishbone in fillets by Raman HSI. Li et al. [24] used visible-near infrared (VNIR) hyperspectral images to detect bark, stone, plastic, clods, and bamboo stalks in dried pickles. Kwak et al. [25] used a multispectral approach to detect foreign objects in dried seaweed.
Data fusion is a process of merging informative data from different sources to provide more accurate and complete explanations about target materials of interest [26]. This is because various data sources typically provide more detailed and potentially complementary information than using individual analytical sources [27]. Low-level (data-level) and mid-level (feature-level) data fusions combine data from different sources. These types of data fusion will provide more complete data and increase the number of variables. Another data fusion approach is high-level (decision-level) data fusion, and it handles each data source separately and fuses the results of corresponding models to provide final decisions to improve the results [28]. Although data fusion has been widely used in remote sensing for quite some time [26], the application of data fusion to research for food safety and quality assessment is relatively recent. Data fusion in the food analysis applications has been applied to measure and evaluate many different quality and safety parameters, including the freshness of pork meat [29,30], the water-holding capacity of chicken breast fillets [31], hazelnut adulteration [32], green tea quality [33], bruising of blueberries [34], and the freshness of tilapia fillets [35]. However, research that uses data fusion of two different hyperspectral imaging systems measuring in the VNIR range of 400–1000 nm and the SWIR range of 1000–2500 nm for the detection of foreign materials (FMs) has not yet been conducted.
Therefore, the purpose of this paper is to demonstrate the potential of using two different HSI systems (VNIR and SWIR) using data fusion for detecting the various types of small sized FMs on the surface of chicken meat and to visualize the detection of FM. The specific objectives of this study were, first, to build and study a spectral library of chicken meat (muscle and fat) and FMs; second, to develop an FM-blob detection method using hyperspectral images; third, to spatially register the VNIR and SWIR images from fillet segmentation masks for blob matching; finally, to apply data fusion for decision making about the presence of FM.

2. Materials and Methods

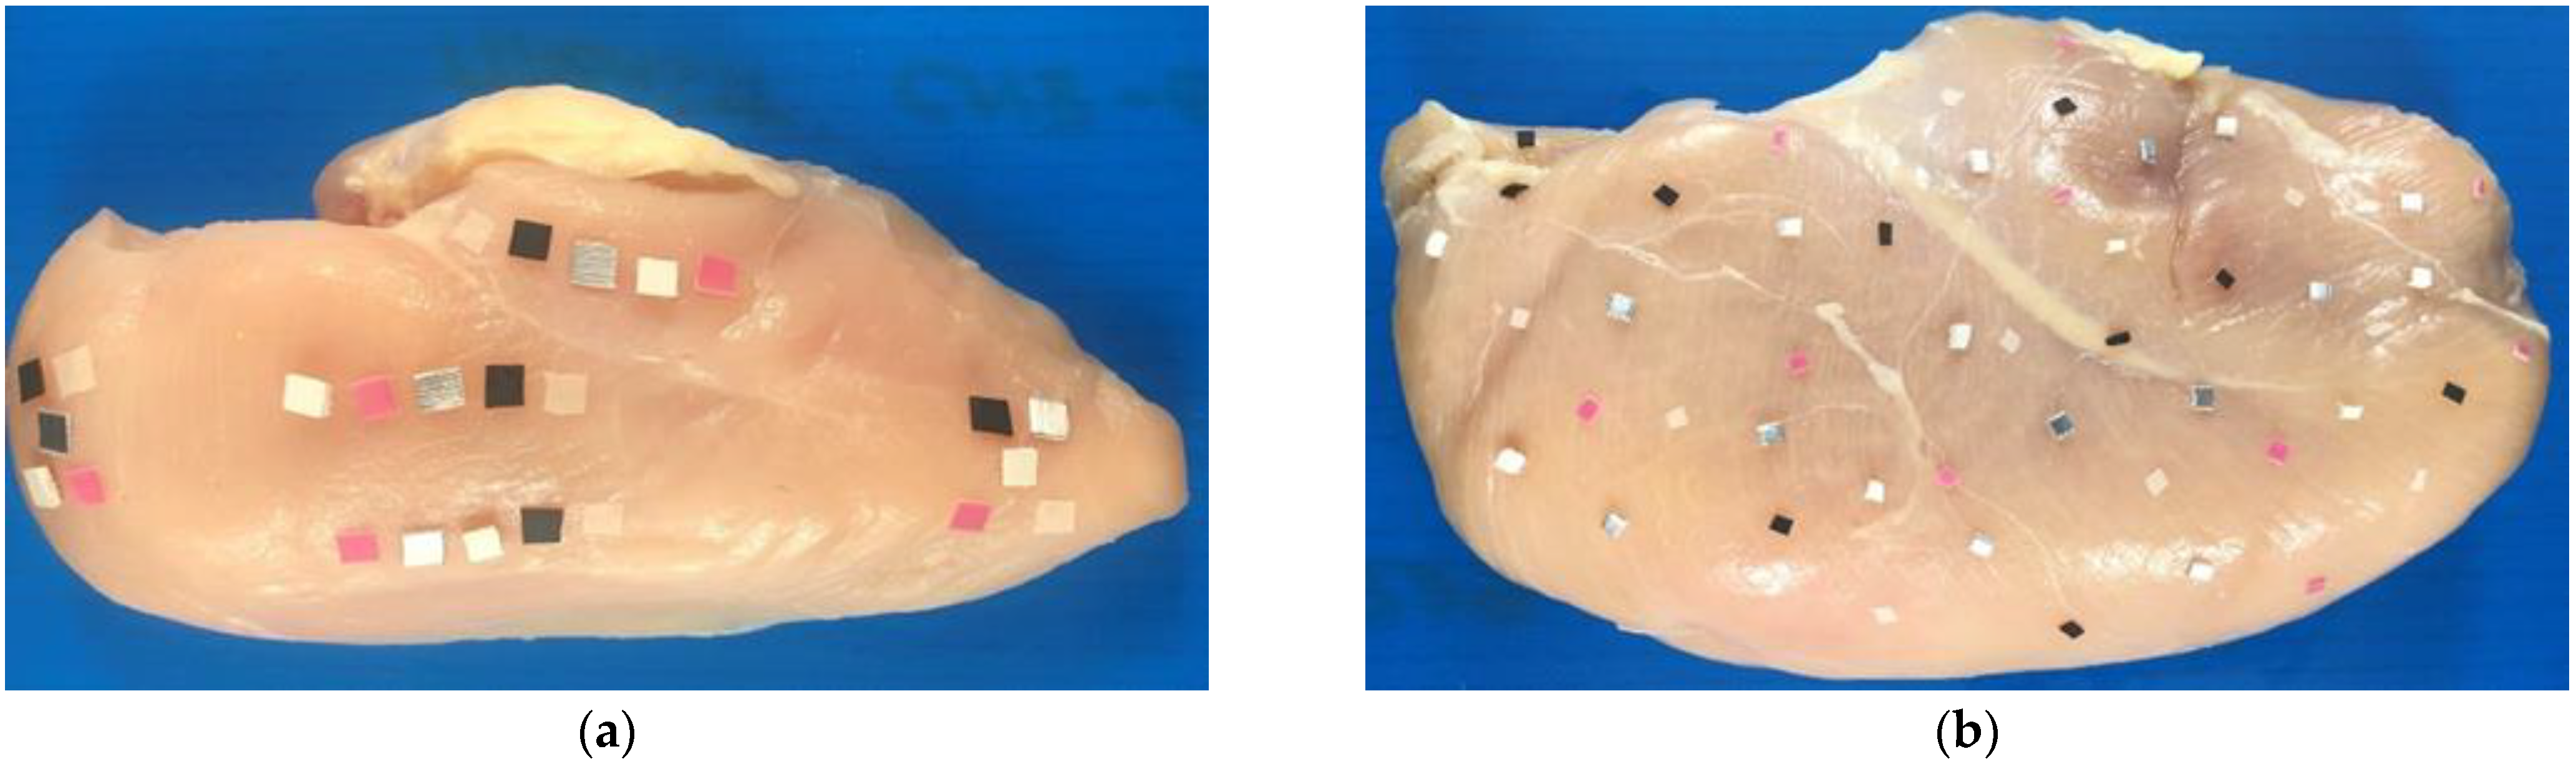
2.1. Chicken and Foreign Material Samples

A total of 12 boneless skinless broiler breast fillets (halved) were purchased from a commercial grocery store in Athens, GA, USA. The fillet samples were never frozen fresh meat and were selected randomly regardless of their macroscopical features. The fillet samples were transported to a laboratory within 20 min and stored in a refrigerator until used on the same day of data collection. A total of 30 different FMs were prepared for the study. The FMs were pieces of polyvinyl chloride (PVC), polyester (PL), polyurethane (PUR), polyethylene (PE), polypropylene (PP), synthetic rubber, natural rubber, dried wood, metal, and glass. The sources of the FMs included conveyor belts, gloves, hairnets, facial masks, regular glass, lab coats, plastics, woods, and metal machine parts. In the case of the conveyor belt, the materials and colors commonly used in the food processing were selected. The other FMs were the materials that could be separated from the safety equipment worn by the workers, and the materials that could be separated from the processing machines. The list and information of the FM samples are described in Table 1. The conveyor belts were purchased from Grainger (W.W. Grainger, Inc. Lake Forest, IL, USA) and the other products were purchased from many different vendors. The details of the vendors are in Table 1.
All FM samples were cut into one of about 50 × 50 mm2 (only for a spectrometer measurement), five of about 5 × 5 mm2 (size of one side: 5.3 ± 0.5 mm), and ten of about 2 × 2 mm2 (size of one side: 2.2 ± 0.4 mm) pieces per sample. The sizes of FM were determined according to FDA size criteria of 7–25 mm in length for a hard or sharp foreign object and USDA size criteria of 2 mm or less in length for a foreign object generally requiring microscopic analysis [36,37]. The cut FM samples were sorted into the six sets shown in Table 1, where each set consisted of 5 different FM samples. All FM samples used in the study are shown in Figure 1. The left-to-right order of the FM samples in each row in Figure 1 was the top-to-bottom order of the FM samples listed in Table 1.

2.2. Data Acquisition Systems and Calibration

The VNIR hyperspectral images were acquired by a push broom line-scan VNIR HSI system in the spectral range of 400–1000 nm with a diffuse reflectance mode. The VNIR HSI system consisted of a spectrograph (ImSpector V10E, Specim, Oulu, Finland), a 12-bit CCD detector (SensiCam QE SVGA, Cooke Corp., Auburn Hills, MI, USA), an objective C-mount lens (Schneider, XENOPLAN, Bad Kreuznach, Germany), a pair of 50-W tungsten-halogen lamps (Photoflex, Watsonville, CA, USA), and a computer to control the camera and acquire images using HyperVisual application software (PhiLumina, Gulfport, MS, USA). The average spectral resolution was 1.27 nm, and the pixel resolution was about 0.37 mm/pixel. The lamps were positioned at about 45° angles at both sides, and the focus was set for the working distance of 350 mm. The camera exposure time was 45 ms. The on-camera binning was set to 2 (spatial) × 2 (spectral). The resulting uncalibrated raw hyperspectral images acquired by the VNIR system had the dimensions of 688 (width) × 500 (lines) × 520 (calibrated wavelengths between 354 nm and 1018 nm).
The SWIR system included a spectrograph (Hyperspec ® SWIR, Headwall Photonics, Fitchburg, MA, USA), a digital camera with a Peltier-cooled 320 × 256 mercury-cadmium-telluride (MCT) detector (MCT-851 XC403, XenICs, Leuven, Belgium), an objective lens with a focal length of 30.7 mm (OLES30, Specim, Oulu, Finland), a motorized linear stage (TLSR300B, Zaber Technologies, Inc., Vancouver, BC, Canada), two MR-16 50-W tungsten halogen lamps with gold-coated reflectors with a 12V DC power supply, a computer, and custom application software. For acquiring SWIR hyperspectral images, the custom software developed in-house was used to control the line scan movement of translation stage and the MCT camera synchronously. The average spectral resolution was 7.4 nm. The pixel resolution was about 0.37 mm/pixel. The resulting uncalibrated raw SWIR hyperspectral image had the dimensions of 320 (width) × 800 (lines) × 256 (calibrated wavelengths from 848 nm to 2802 nm).
Before the experiment, the instrument was commissioned to allow for spectral calibration and the correction of non-uniform, hot and dark pixels of MCT detectors. Light adjustment was made to the height and angle of the two halogen tungsten lamps to provide illumination evenly and minimize the shadow on the side of the samples. Each fillet was placed on the translation stage, conveyed to the field of view of cameras with the adjusted speed, and scanned line by line.
The raw intensity values (uncalibrated digital numbers) of the acquired hyperspectral images were calibrated using an intensity calibration technique. The intensity calibration based on white and dark references was done to all pixels of each raw hyperspectral image to minimize the uneven effects of light energy in different wavelengths and spatial locations. A white reference image was acquired with a diffuse reflectance panel with 99% reflectivity (Spectralon, Labsphere, North Sutton, NH, USA). A dark current image was obtained while blocking the camera lens with a lens cap. In the case of SWIR imaging, an in-field calibration was performed with horizontal stripes of dark (n = ~70 lines) and white (n = ~65 lines) reference images (2D spectral images) on top of each measured image. In other words, the reference images for the calibration of SWIR images were embedded in the images. In the case of VNIR imaging, we collected the separated dark and white reference images (3D data cubes) at the beginning of the experiment each day and the experiment was performed for 5 days. Therefore, we had 5 pairs of reference images for the VNIR images. Calibrated hyperspectral images were calculated by applying the following equation to each pixel (Equation (1)).
Rc = (Rm − D)/(W − D) × 100
where Rc was the calibrated reflectance value (%), Rm was the uncalibrated measured value, D was the dark current value, and W was the white reference value. Due to system noise, only 400–1000 nm (467 bands, resolution of 1.27 nm) was used from the VNIR HSI system and 1005–2503 nm (198 bands, resolution of 7.40 nm) was used from the SWIR HSI system.
A spectrometer system was also used in this study for spectroscopic data analysis and for comparing the spectrometer data with the spectral responses of the hyperspectral images at the VNIR and SWIR ranges. The spectrometer system consisted of a spectrometer (ASD LabSpec 4 Hi-Res Analytical Instrument, Malvern Panalytical, Ltd., Malvern, UK), a contact probe with a 10 mm spot size, and a computer to control and acquire reflectance spectra using Indico® Pro software (Malvern Panalytical, Ltd., Malvern, UK). Before collecting the spectra of the samples, a white reference spectrum and a dark current were collected for the calibration of the measurement. A diffuse reflectance panel with 99% reflectivity (Spectralon, Labsphere, North Sutton, NH, USA) was used to collect the white reference spectrum. The white panel was also used as a background throughout the spectrometer measurements with samples. The surface of the FMs was cleaned before collecting their spectra and the probe was thoroughly cleaned between samples. Each spectrum was an average of 50 scans with 1 nm intervals over the wavelength range of 350–2500 nm.

2.3. Data Acquisition and Data Set for Model Development

The 12 broiler breast fillet samples were split randomly into two fillet sets with six fillets in each set. Each fillet was placed on a sample plate covered with a food-grade conveyor belt piece (blue color). The fillets were used as clean/normal samples first and then contaminated/abnormal samples. The difference between two fillet sets was on the size of FMs when contaminating the fillets: large (5 × 5 mm2) versus small (2 × 2 mm2). Both sides (bone-side and skin-side) of a fillet were imaged without and with FMs using VNIR and SWIR imaging systems, sequentially one by one.
First, both sides of each clean fillet were scanned without FMs. Then, all 12 fillets were contaminated with FMs and scanned again. If a fillet belonged to the fillet set for the large FMs, the fillet was contaminated with 5 × 5 mm2 FM samples, as shown in Figure 1a. Otherwise, the fillet was contaminated with 2 × 2 mm2 FM samples, as shown in Figure 1b. The large FM samples in Figure 1a were placed set by set (Set 1–6) on both sides (one at a time) of a fillet in five different locations, as shown in Figure 2a such that different FM samples were spatially grouped in each location (far left, far right, top, bottom, and middle) without touching each other. The small FM samples in Figure 1b were placed set by set (Set 1–6) on both sides (one at a time) of a fillet randomly without touching each other. Each fillet within the fillet set for the large FMs had 25 FM samples on its surface, whereas each fillet within the fillet set for the small FMs had 50 FM samples on its surface. Note that the FM pieces were firmly pressed down on the fillet surface so that the FMs did not fall off. This sample preparation protocol was designed for a worst-case scenario of the surface FMs because the spectral signals of the meat right beneath the surface FMs could be easily mixed with the reflectance spectra of the pure FMs. The above experimental design resulted in a total of 96 hyperspectral images from two fillet sets × six fillets per fillet set × (clean and contaminated surfaces) × two sides per fillet × (VNIR and SWIR imaging modalities). The 48 hyperspectral images (24 VNIR and 24 SWIR images) obtained from the fillet set for the large FMs were used as a training set for model development and validation to create pure spectral data reliably from the large FM areas. The other 48 hyperspectral images (24 VNIR and 24 SWIR images) obtained from the fillet set for the small FMs were set aside as a separate test set for evaluation of model performance and determination of detection limit. The chicken samples for training and test sets were selected by random sampling whereas the FM samples were selected by stratified sampling. The total number of FMs in each of FM Groups (see Table 1 for the Groups) was 40 (metal), 20 (wood), and 170 (polymer) for the training set, and 80 (metal), 40 (wood), and 340 (polymer) for the test set, respectively.
Spectral data of the fillet and large FM samples for the training set were measured with the spectrometer. Each sample was measured in three different locations within the sample. Muscle tissue surfaces at bone and skin sides and fatty areas were probed with each fillet sample. Thus, we obtained 54 spectra from the six breast fillets (six fillets × (two sides for muscle + skin-side for fat) × three repeats) and 90 spectra from the 30 FM samples (30 large FMs × three repeats).

2.4. Hyperspectral Image Processing

Regions of interest (ROIs) for the model development (ROIs-model) were selected from the bone side contaminated images from the training set. Additional ROIs for the model evaluation were further selected from the skin side contaminated images of training set and both sides of the contaminated images from the test set. For the ROIs-model, both meat groups and FMs were selected, while additional ROIs consisted only of FMs. All ROIs were manually defined and created separately one by one by using the ROI tool in ENVI 4.8 (Exelis Visual Information Solutions, Boulder, CO, USA). The ROIs were created with geometric shapes, such as polygons and rectangles, that varied in size.
All spectral data on each ROI-model were extracted with a custom MATLAB program and averaged into mean spectra. A total of 150 ROIs were selected for the FM group. A total of 40 ROIs were selected for the meat group. The ROIs for the meat group were taken from various locations to cover the variations in spectral responses. Ten ROIs among the 40 meat ROIs were selected from the fatty areas. After these 190 ROIs for each modality were created, the mean spectra from each ROI were obtained. Finally, a spectral matrix of 190 samples × 467 bands was constructed from the VNIR images, and 190 samples × 198 bands were constructed from the SWIR images. The mean spectral data obtained from the ROI analysis were further processed spectrally. We applied several spectral pretreatment techniques to the data. The pretreatment methods were Savitzky–Golay (SG) smoothing (with 4th order polynomial within a moving window of 25 for VNIR and a window of 7 for SWIR), Gap Segment 2nd derivative (Gap and Segment of 7 for VNIR and 3 for SWIR), and standard normal variate (SNV), sequentially. The different moving window size, Gap, and Segment were applied for VNIR and SWIR due to the difference of spectral resolutions (VNIR: 1.27 nm and SWIR: 7.40 nm). This process was performed to remove noise, emphasize the sharp peaks, and correct the scattering effect in spectral data without compromising the integrity and accuracy of the spectral information. The pretreatment methods were applied to both the VNIR and SWIR spectral data, respectively. In the end, the endpoints of the data were excluded (18 data points at both ends of VNIR data, and 7 data points at both ends of SWIR data). All spectral data pretreatment operations were implemented with MATLAB R2020b software (The MathWorks, Inc., Natick, MA, USA).

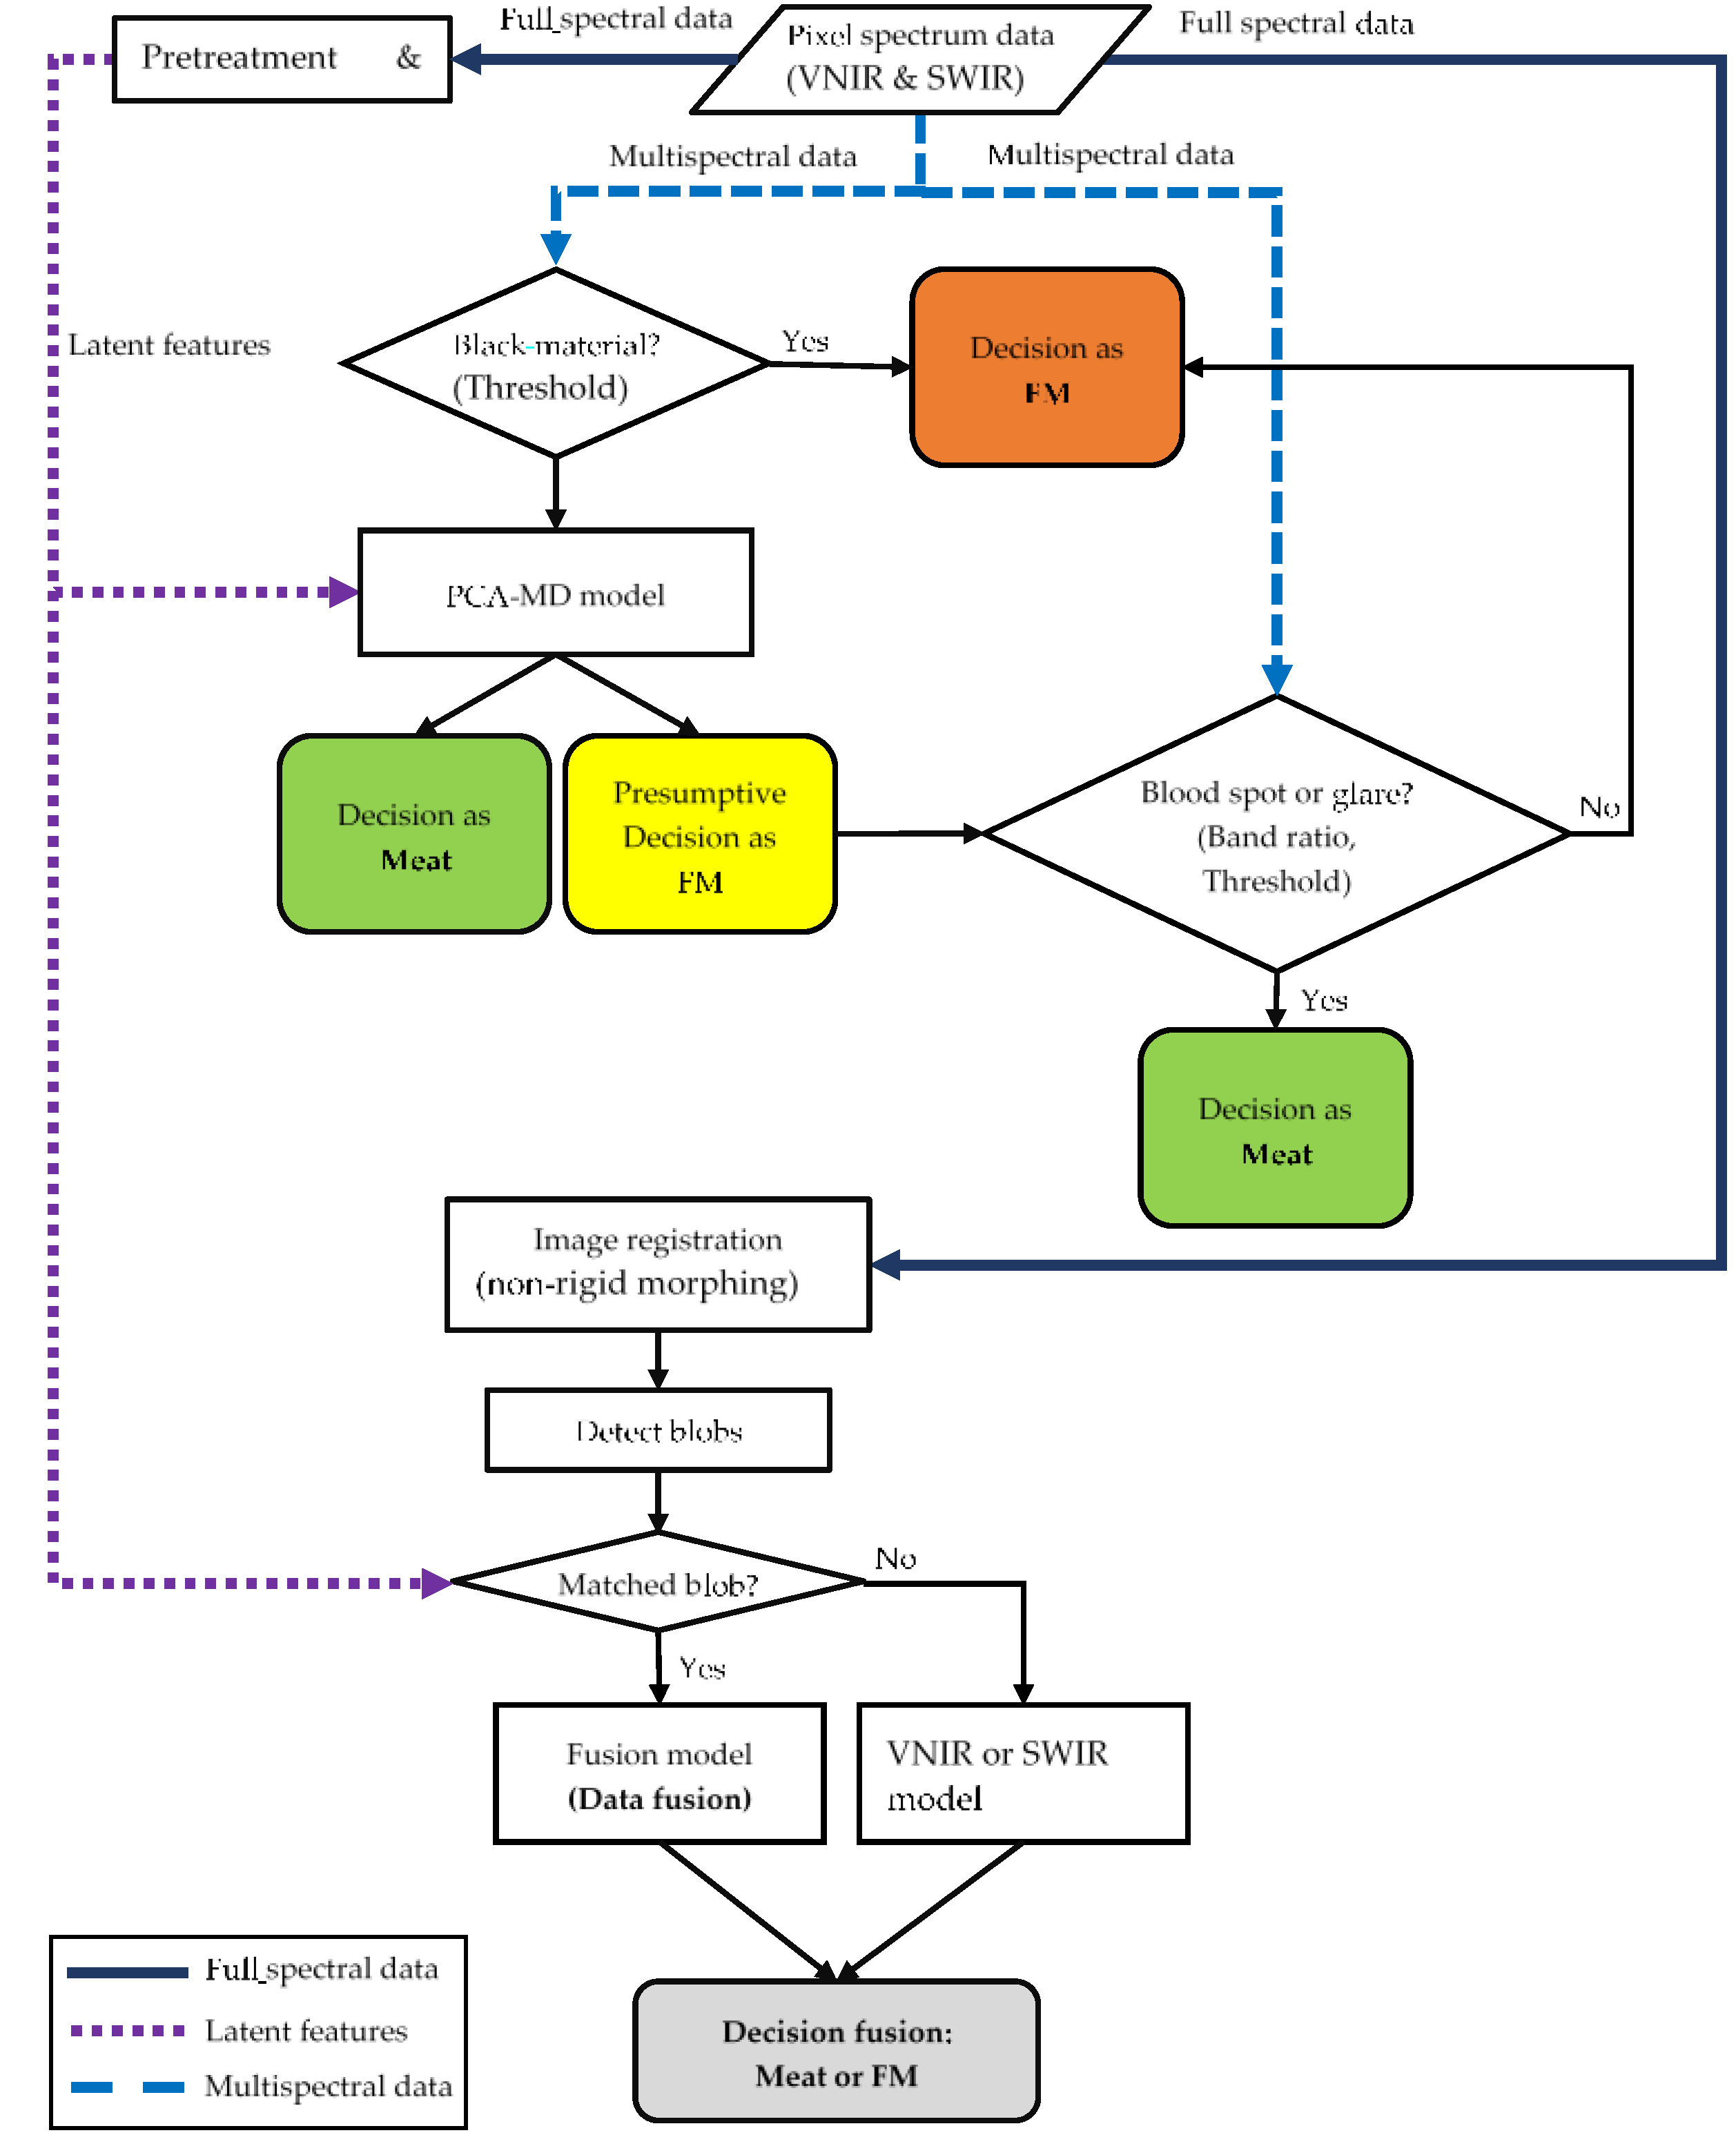
2.5. Developed Algorithm for Foreign Material Detection

The core idea of the developed algorithm, called Fusion model, was based on spectral data fusion and multi-model decision fusion. The Fusion model included two binary classification models, called the VNIR model and the SWIR model, using the VNIR and SWIR spectral data, respectively. Once the VNIR and SWIR models independently predicted presumptive FM pixels and thereafter blobs, we performed spatial matching of the FM blobs between the VNIR and SWIR modalities using a non-rigid image registration algorithm. The spectral data of the geometrically matched blobs were fused into one 400–2500 nm spectrum data, called Fusion data (VNIR + SWIR data fusion). All the matched blobs were classified with a machine learning model for the Fusion model, and the blobs detected only by a single modality were classified with the VNIR and SWIR data-based machine learning models, respectively. Then, the final classification result of the developed Fusion model was obtained through decision fusion at the image level. The overall flow chart is shown in Figure 3.

2.5.1. Pixel-Level Classification

In this study, the pixel-level classification was performed independently with the VNIR and SWIR spectral data as a first step of the data fusion. The pixel-level classification model consisted of four sub-models.
The first sub-model was a principal component analysis (PCA)-based Mahalanobis distance (MD) metric model, called PCA-MD. The dimensionally reduced data using PCA, a powerful tool for informative variable selection [38], was used to calculate the MDs between the meat group and the FMs, where the meat group was the reference. The pretreated spectral matrices in the training set were linearly transformed into a set of linearly uncorrelated variables called principal components (PCs). The score values (latent features) of PC 1–5 from the PCA result of meat ROIs (30 mean spectra of muscle ROI and 10 mean spectra of fat ROI) were used as a reference in each data matrix of the VNIR and SWIR, respectively. Since the PC score values originated from the ROIs of chicken fillets and were used as a reference mean vector, the smaller MD value of each pixel indicated that they were similar to the chicken fillet. Each pixel was classified into meat or FM according to the threshold criterion of the measured MD value in the PCA domain.
The other three sub-models were developed to detect blood spots (blood clots), glare, and black material with multispectral models, respectively. The PLSR analysis and the literature were used to find the key wavebands necessary for each sub-model and each modality. The PLSR was performed to select the most informative wavebands with large regression coefficient values [39]. The wavebands associated with color pigments and hydrogen-bonded compounds (i.e., C–H, O–H, and N–H) were found from previous studies [17,39,40]. The selected key wavebands were highly related to the components related to the color (400–800 nm) and chemical composition (800–2500 nm) of the chicken breast meat. The blood spot may occur due to hemorrhage caused by the rupture of blood vessels or from the leakage of red blood cells from the vessels. Glares were observed due to the excessive reflectance intensity toward the lens that might be generated from the specular reflection of water on the surface of the fillet.
The second sub-model was a blood spot detection model. For this model, we defined several band ratios at 700 nm/415 nm, 650 nm/600 nm, 760 nm/700 nm, and 700 nm/450 nm in the VNIR modality. Thresholding at 450 nm and 560 nm was part of the developed blood spot detection model.
The third sub-model was a glare detection model. For this model, we defined the threshold values higher or close to 100% at 480 nm (100%), 750 nm (97%), 850 nm (105%), 1080 nm (150%), 1414 nm (120%), and 2300 nm (90%) in the VNIR and SWIR ranges to differentiate between glare and some white FMs that generated the high reflection. Additional band ratios and thresholding were applied to develop the glare detection model.
The fourth sub-model was a black material detection model. For this model, we defined the threshold values at 700 nm and 850 nm since the spectra of some dark areas of the chicken fillets were similar to the spectrum of black material except in a few single wavelengths including those two wavebands.
These four sub-models with binary outputs were combined into a pixel-level classification algorithm, as shown in Figure 3. The algorithm is summarized in the following steps:
1. A multi spectrum goes to the black material detector based on multispectral thresholding. If the pixel belongs to a black material, the algorithm stops with the FM output. Otherwise, go to step 2.
2. If the pixel is not a black material, a pre-treated spectrum goes to the PCA-MD model. If the output is meat, the algorithm stops. Otherwise, go to step 3.
3. If the pixel is neither black nor meat, it may belong to FM presumptively. This presumptive classification must be checked with blood spot and glare detection models, independently. If either sub-model classifies meat, the output is meat. Only when both sub-models declare FM, the output becomes FM.

2.5.2. Blob-Level Classification and Data Fusion

Spatially connected FM pixels obtained from the pixel-level classification with the VNIR and SWIR spectral data were treated as FM blobs. For the data fusion, we used a spatial image registration technique in order to find the spatially matched blobs between the VNIR and SWIR images. The image registration was based on a non-rigid image alignment algorithm called diffeomorphic demons such that the region-boundaries of the VNIR and SWIR’s fillet segmentation images were spatially matched. This algorithm estimated the displacement field of the fillet segmentation images and registered a VNIR image and a SWIR image. A fillet segmentation image was obtained by thresholding such that a fillet region became the foreground. The fillet segmentation for the VNIR was based on two band ratios (700 nm/450 nm and 450 nm/560 nm) and thresholding. The SWIR image segmentation was undertaken with thresholding at the 1200 nm waveband. The rotation, scale, and translation were estimated and performed prior to image registration to match the aspect ratios and the centroids of the fillet segmentation images from each system. The registration technique compensated for minor deformations in shape during the transformation process to another system, which increased the registration accuracy. Following this, the estimated displacement field was applied to all the band images in the VNIR range and reconstructed a new VNIR hyperspectral spectral image. Through this image registration, it was easier to find matched blobs between two modalities, although the pixel-level registration suffered from errors due to the non-flat and pliable properties of chicken meat. Once the matched blobs were found, spectra of both modalities were fused. These fused spectral data are called Fusion data (VNIR + SWIR data) and this procedure corresponds to the data-level fusion, which combines the entire data.
All matched blobs were used to classify whether each pair of matched blobs belonged to the chicken fillet or the FM group through the spectral angle mapper (SAM). The reference spectra for the SAM were the muscle and fat spectra in the meat group (Fusion-data SAM model). In developing the SAM model, the reference spectra of muscle and fat were obtained from the average values of 30 muscle spectra and 10 fat spectra obtained from ROIs of the VNIR and SWIR data. The spectral pretreatment was performed to the averaged spectra. The pretreated data were combined into single spectra of muscle and fat representing Fusion data. The SAM model determined a spectral similarity between the blob spectrum in question and the reference spectra (muscle and fat) by calculating a spectral angle between the spectra by treating them as vectors. The blobs detected only by VNIR or SWIR were also classified by the SAM. Finally, when matched blobs were found, the Fusion-data SAM model was used for the classification. When the unmatched blobs were found, the VNIR-data SAM (SAM only in the VNIR range) or SWIR-data SAM model (SAM only in the SWIR range) were used to classify these unmatched blobs. Then, the final Fusion classification result was acquired by fusing the results from all three models (Fusion-data SAM, VNIR-data SAM, and SWIR-data SAM model) by logical operation. If either model classifies FM, the output was FM, and this procedure corresponds to the decision-level fusion, which combines the results of separated models. The classification model development procedure was carried out using MATLAB R2020b software (The MathWorks, Inc., Natick, MA, USA).

2.6. Statistical Analysis

Spearman rank correlation, which provides a measure for the monotonic correlation between the two vectors [41], was applied to identify the reliability of the HSI spectral data compared to the spectrometer reference, and to compare the spectral similarity between the semi-transparent material and chicken fillet. Multiple comparison tests among meat features (muscle and fat) and FMs were performed using one-way analysis of variance (ANOVA) with post-hoc Tukey’s test to determine the statistical significance of differences among the distances of muscle (a normal meat feature), fat (a normal meat feature), and FM spectra with a significance level of 0.05. The statistical distance metric for the Tukey’s test was Mahalanobis distance (MD).

2.7. Performance Evaluation and Comparison

The performance of pixel-level classification of the VNIR and SWIR models was evaluated with an FM-pixel detection rate that was calculated by the ratio of the number of correctly identified ROI pixels versus the number of ground-truth ROI pixels. The FM-pixel detection rate was obtained separately for each FM group (polymer, wood, and metal) because the number of samples in each group was different (17, 2, and 4 samples for polymer, wood, and metal, respectively). The performance of blob-level classification was evaluated with the precision (TP/TP + FP), recall (TP/TP + FN; sensitivity), F1 score (2 × (precision × recall)/(precision + recall)), and Jaccard index (JAC, (TP/TP + FN + FP), also called critical success index or threat score), and an FM-blob detection rate that was (# of correctly classified FM blobs/# of ground-truth blobs in ROIs), where TP (true positive) was the number of blobs that were correctly classified as FM, FP (false positive) was the number of blobs that were mistakenly classified as FM, and FN (false negative) was the number of FMs that were missed from the detection. The FM-blob detection rate was also calculated separately for each FM sample group because the number of samples in each group was different. The performance of the developed algorithm (Fusion model) in detecting FMs was compared with the performance of the VNIR and SWIR models.

3. Results and Discussion

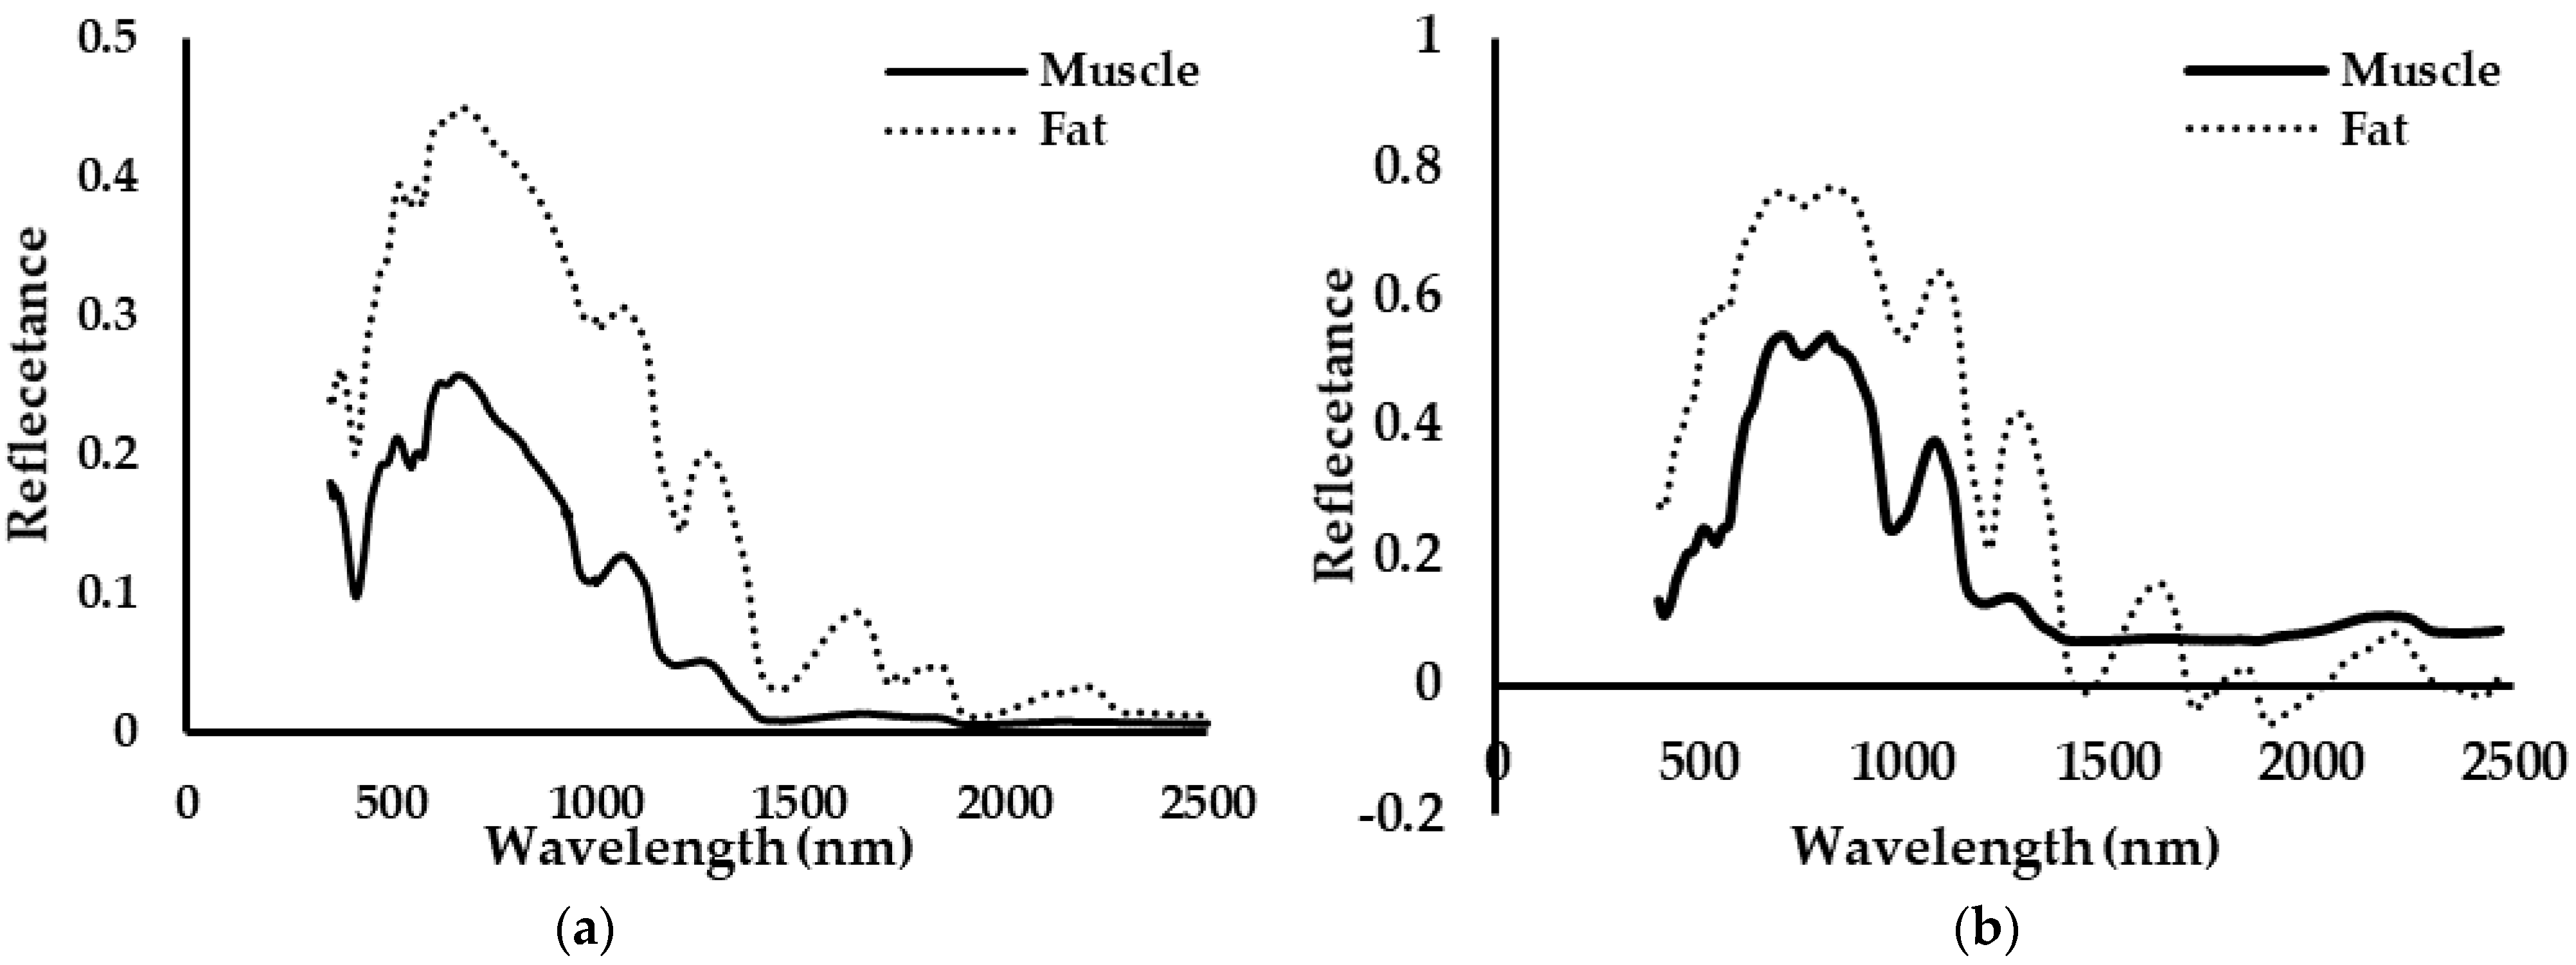
3.1. Spectral Data Analysis: Correlation and Distance

The mean spectra of the muscle and fat observed from the chicken fillet samples were obtained from the spectrometer and HSI measurements. The ROI-based mean spectra of the HSI measurements were compared with the spectrometer measurements in the wavelengths from 400 nm to 2500 nm (Figure 4). The hyperspectral data were obtained separately for both the VNIR and SWIR systems, and the SWIR data were scaled to match the reflectance values of the VNIR data at the meeting point of 1000 nm waveband. Then, the mean spectral data from both HSI modalities were fused into a single spectrum with the 400–2500 nm spectral range. The Spearman’s rank correlation coefficients of the muscle and fat between HSI and the spectrometer were 0.7685 and 0.9443, respectively. Since the correlation coefficients were higher than 0.7 and the overall trend of HSI spectral responses was similar to that of the spectrometer data, we concluded that the HSI data was reliable.
We performed the Tukey’s test to compare the difference between group mean MD values of chicken fillets (muscle and fat) and each FM sample. Tukey’s test results indicated that opaque FMs were significantly different from the meat. However, transparent materials, such as glass and clear plastic film, and semi-transparent materials were not significantly different from the meat. This post-hoc test result with transparent and semi-transparent materials was due to a mixed pixel effect where different materials contribute to a spectral response at a pixel [42]. As mentioned earlier in Section 2.3, we pressed down the FM samples to stick them well on the meat surface. As shown in Figure 5, when the water seeped into a semi-transparent sample, the spectra between the semi-transparent sample and the chicken meat were indistinguishable. Therefore, we concluded that the semi-transparent FM samples pressed down firmly on the fillet could reduce the detection chance of the FMs. However, the best-case scenario of detecting transparent and semi-transparent materials in practice could be when these types of FMs would float on the meat surface with enough air gaps between the background meat and the bottom surface of the FMs. To test this hypothesis, we compared the Spearman’s rank correlation coefficients between means measured on an area of 5 × 5 pixels where a semi-transparent sample was placed firmly on the chicken fillet and on another area of 5 × 5 pixels where the same semi-transparent sample floated slightly with air gaps (Figure 5). The correlation coefficient between the firmly pressed area on the semi-transparent FM and the chicken meat was 0.7242, which was quite high. This meant that their spectra were very similar. On the other hand, the correlation coefficient between the floated area on the same FM and the chicken fillet was 0.5277, which was quite low. Therefore, the experimental conditions we designed were difficult to detect all the semi-transparent FMs spectrally. In addition, researchers [43] have shown in a study on detecting micro-plastics in tea bags that properties of the tea present in a tea bag are dominant in measuring reflected spectra because tea bags are optically semi-transparent in the NIR spectral range. However, because we cannot expect that the FM samples will be presented under an ideal condition (with some air gap) on the chicken fillet, we excluded the transparent (glass and PVC film) and semi-transparent materials (PP hairnet, PE lab coat, white color latex glove, purple color nitrile glove, and PE plastic) when evaluating our models. However, future research is necessary to improve the accuracy of detecting semi-transparent materials. In addition to the transparent and semi-transparent FMs, the black FMs showed very low reflectance in the entire spectral range from 400 nm to 2500 nm, and also their spectral responses were similar to the spectral responses of the dark features and/or areas on the meat surface. This result was also consistent with the finding of a previous study [44] where black plastics were excluded from the study because the black samples were difficult to differentiate from other plastics in the NIR range.

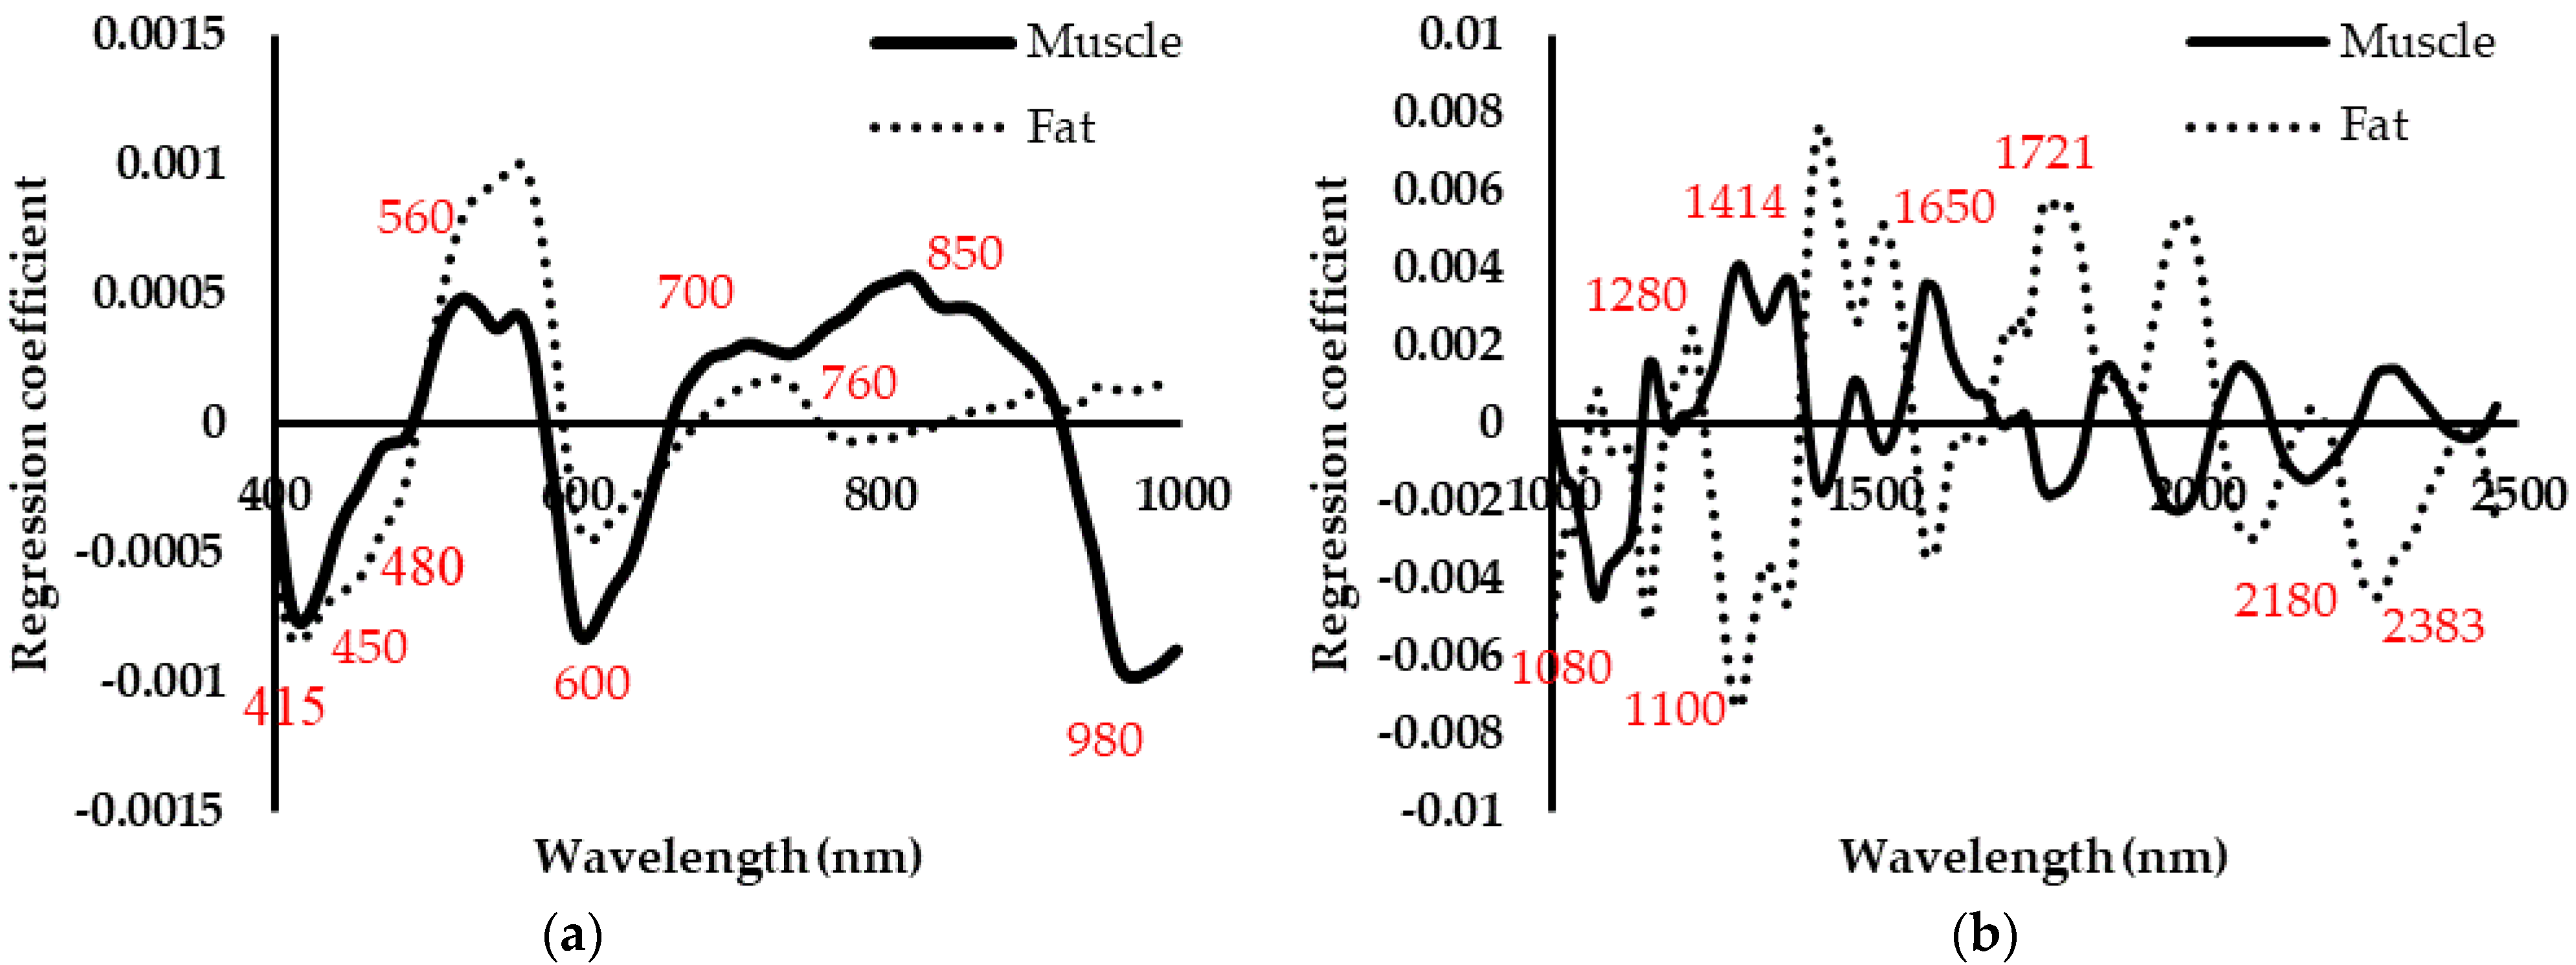
3.2. Key Wavebands Selection

The reflectance in the VNIR provided information about color of chicken meat. In our data, the bands at 450 nm (deoxymyoglobin), 560 nm (oxymyoglobin), and 700 nm (myoglobin, hemoglobin) corresponded to the substances that are responsible for the color of the meat. In addition, C–H, O–H, and N–H stretching observed in the NIR spectra were characteristically attributed to fresh chicken meat’s chemical components such as water, protein, and fat. In the VNIR and SWIR range, the bands at 850 nm, 1080 nm, and 1414 nm were likely related to water present in the meat samples [45]. The 1200 nm, 1280 nm, 1414 nm, 1650 nm, and 1721 nm bands possibly corresponded to the overtones of the C-H stretching modes from the lipid molecules within the meat samples. Furthermore, the band at 2180 nm was likely related to the protein of the meat (N–H second overtone). Therefore, we were able to handle the color and pigments, physical structure, and chemical composition of chicken breast because we obtained both VNIR and SWIR image data [46]. These wavebands were selected as key wavelengths to distinguish between meat and FMs (including background). Furthermore, regression coefficients (RC) for the established PLSR models at the full wavelength of the VNIR and SWIR range were used to identify key wavelengths related to muscle and fat of chicken fillets (Figure 6). The final selected wavebands are 415, 450, 480, 560, 600, 650, 700, 715, 750, 760, 850, and 980 nm in the VNIR range and 1000, 1080, 1101, 1200, 1280, 1414, 1650, 1721, 2180, 2300, and 2383 nm in the SWIR range.

3.3. Performance of Pixel-Level FM Classification

Table 2 shows the pixel-level FM detection rates on training and testing with the VNIR and SWIR models. The pixel-level detection rates on the training set varied between 62–71% (VNIR) and 72–81% (SWIR), while the performance on the test set was significantly decreased down to 10–33% (VNIR) and 38–59% (SWIR), respectively. The decrease was partially due to the mixed pixel effect at the border of the large FMs. The average size of ROIs in the training set was around 180 pixels with a rectangular shape close to square. Therefore, the dimension of one side was around 13–14 pixels. A strip of about two pixels along the boundaries of FM objects had mixed spectra from meat and FM. The average area size of ROIs in the test set was about 40 pixels with a rectangular shape close to square as well. In addition, the dimension of one side was around 6–7 pixels. Our calculation indicated that only around 75% of the pixels from the center could have pure FM spectra in the training set, whereas the expected pure FM pixels in the test set was around 50%. The results implied that the detection limit of a pixel-level spectral detection model was about 1 mm (3–4 pixels in length) and a higher resolution HSI system would be required to detect smaller than 1 mm length samples. In the case of metal, the pixels were sometimes classified as glare in both the VNIR and SWIR models due to the specular reflection from smooth metal surfaces. In the case of wood, small samples with light color similar to meat color were difficult to detect with the VNIR model. Overall, the SWIR model performed better than the VNIR model.

3.4. Performance of Blob-Level Classification

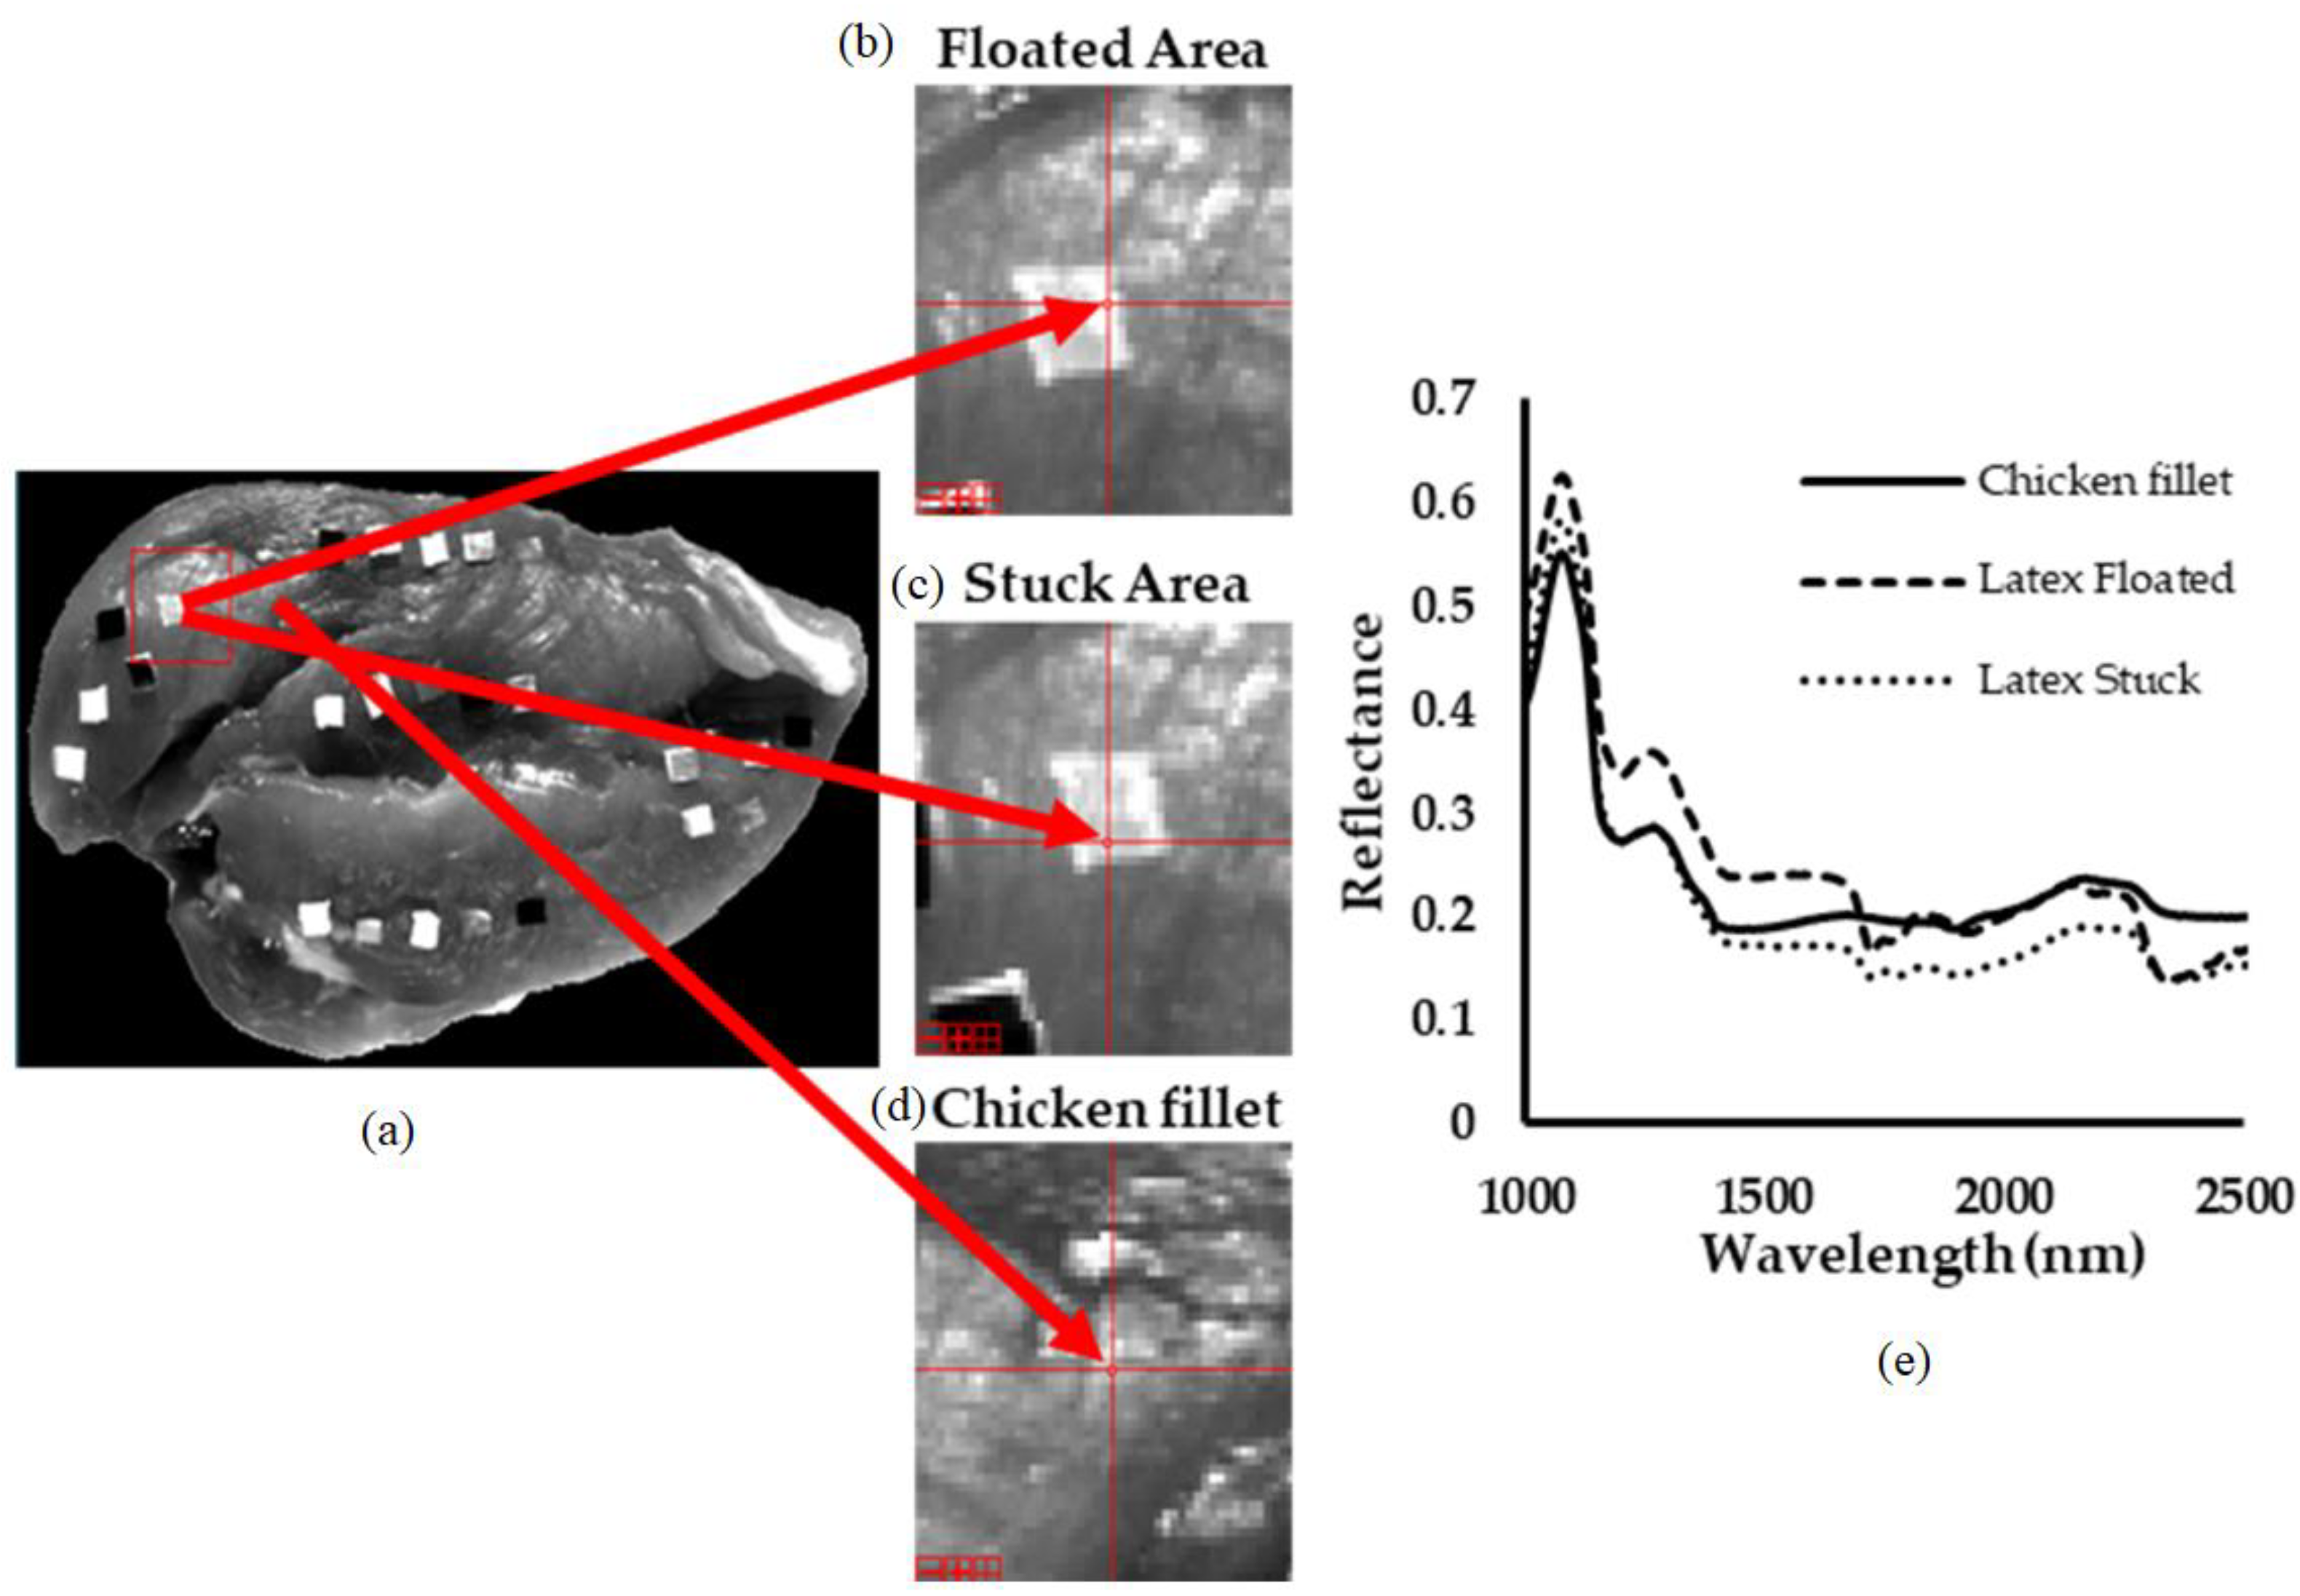
3.4.1. Image Registration

The registration performance using the diffeomorphic demons algorithm showed over 98.6 ± 0.2% of Intersection over Union (IoU), which was the ratio of the area of overlap to the area of union between registered (VNIR) and reference images (SWIR). Note that a pixel-level registration of two chicken fillet images would be very challenging due to the lack of prominent features on the surfaces of meat to match between two HSI modalities. A further study is necessary to investigate an image registration technique for pixel-level alignment of relatively featureless images of chicken breast meat.

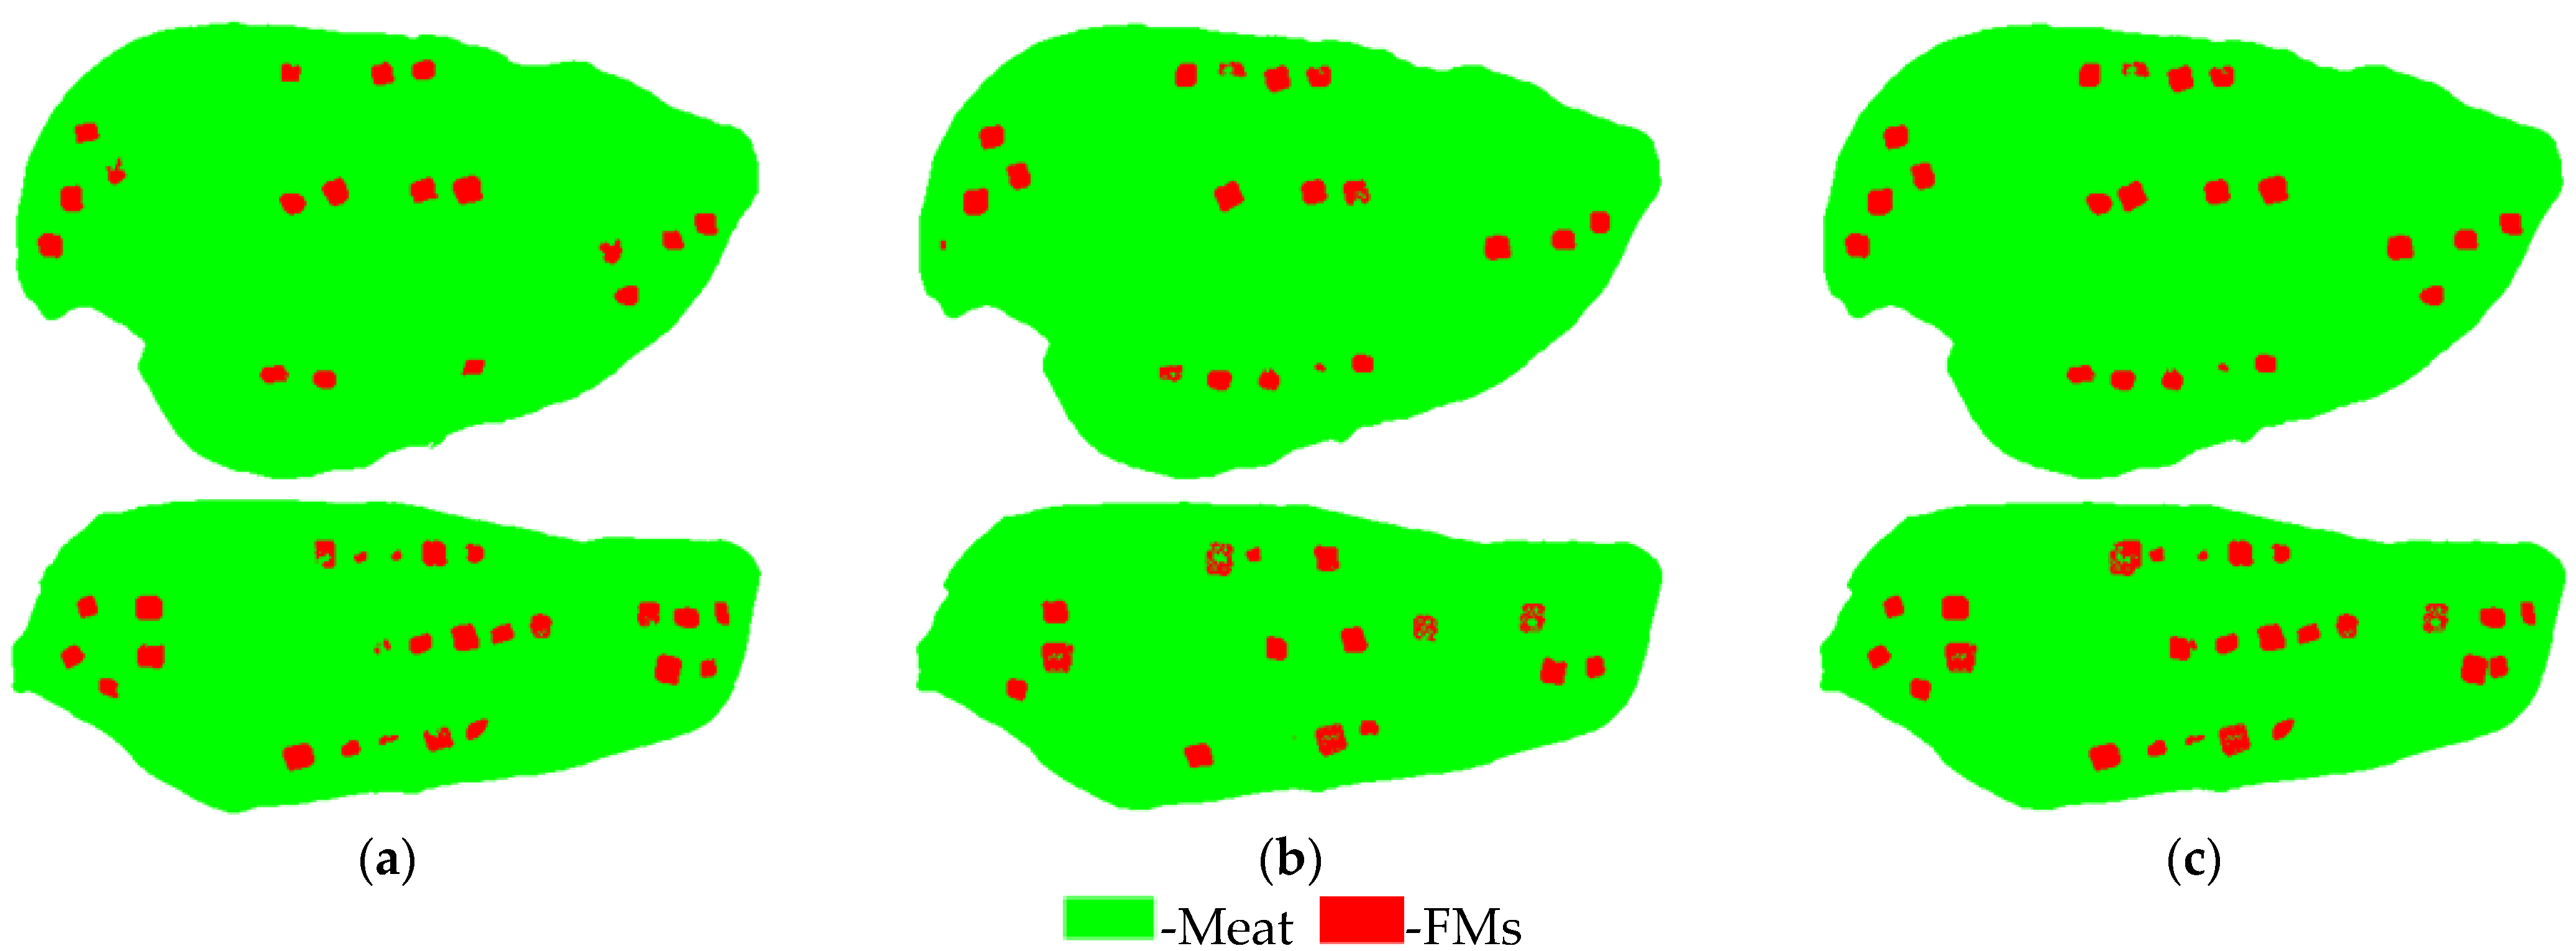
3.4.2. Results on Training Set with Large FMs

Overall, the FM-blob detection performance of the developed Fusion model on the training set with large 5 × 5 mm2 FMs was higher than both the VNIR and SWIR models (Table 3). The detection rates for all three FM groups using the developed Fusion model were 100%, whereas the detection rates of the VNIR and SWIR models were 95–98%, 95–100%, 92% for metal, wood, and opaque polymer, respectively. The higher detection rate of the Fusion model was because the VNIR and SWIR models were complementary to each other in detecting FMs. For example, in the case of the polymer, the VNIR model missed most of the dark green nitrile rubber conveyor belt samples, whereas the SWIR model detected all of these samples. In the opposite case, the SWIR model missed most pieces of white nitrile rubber conveyor belt and black nitrile rubber glove, whereas the VNIR model more accurately detected these samples missed by the SWIR model. The F1 score (96%) and JAC (93%) of the Fusion model were higher than those of the VNIR and SWIR models. The F1 score result suggested that the precision and recall of the Fusion model was better balanced than the VNIR and SWIR models.
The recall (sensitivity) of the Fusion model was 100% which was about 7% higher than the VNIR and SWIR models. The precisions were 98% (VNIR), 94% (SWIR), and 93% (Fusion). Most of the FPs observed from the SWIR model were linked to a connective tissue that showed a spectral pattern similar to white plastic samples. The FPs observed from the Fusion model were carryovers from FPs found by the VNIR and SWIR models. An example of the classification images obtained from the three FM-blob detection models (Fusion, VNIR, and SWIR) on the training set is shown in Figure 7.

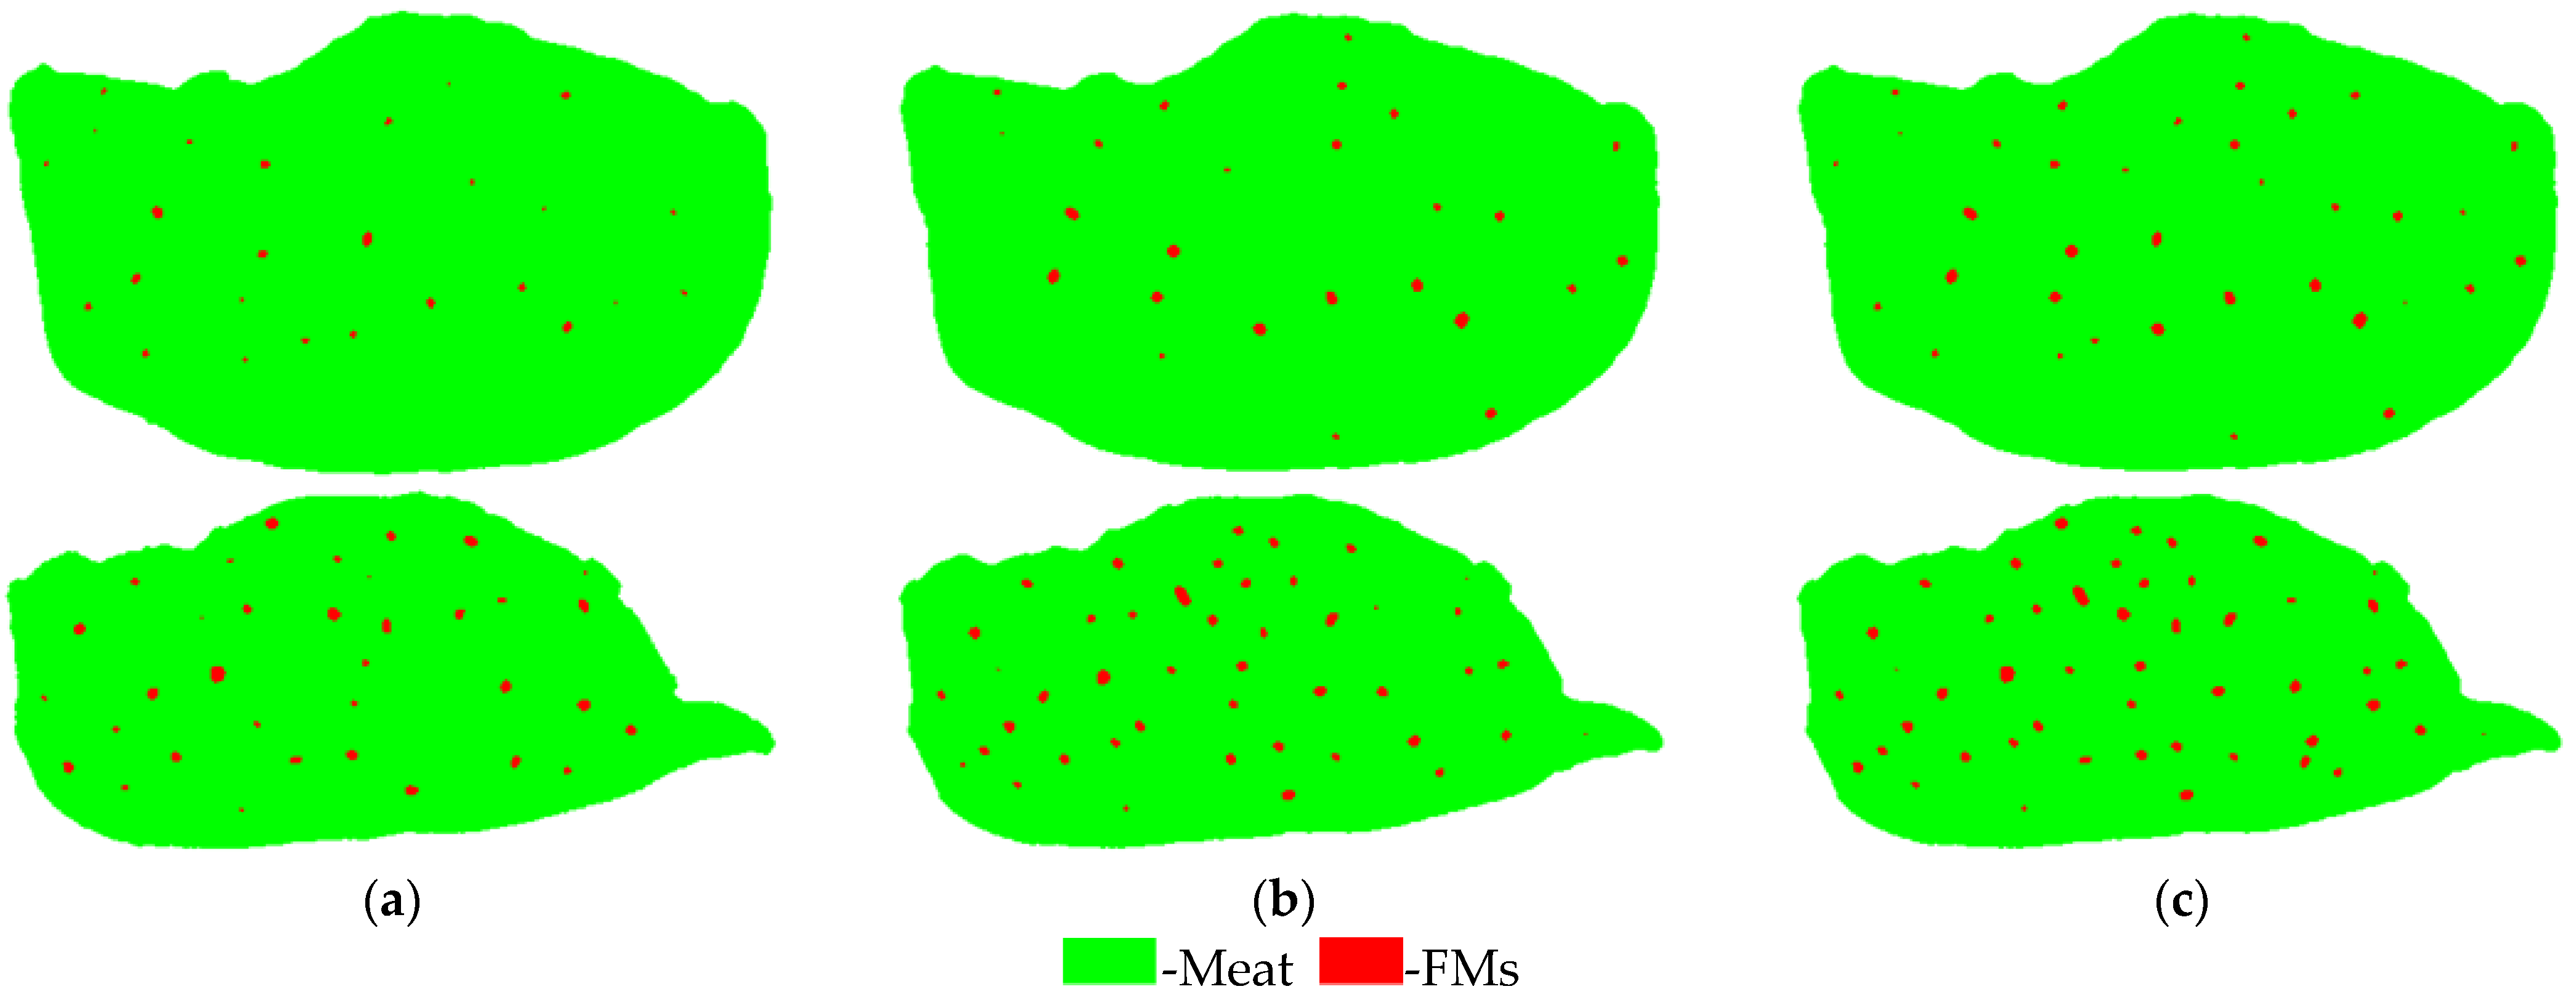
3.4.3. Results on Test Set with Small FMs

The overall performance of the Fusion model on the test set with small 2 × 2 mm2 FMs was better than the performance of the VNIR and SWIR models. The F1-score (94%) and JAC (88%) of the developed Fusion model on the test set was higher compared with both the VNIR (F1 score: 76% and JAC: 62%) and SWIR (F1 score: 89% and JAC: 79%) models (Table 4). The detection rates of the fusion algorithm for each group on the test set were 81% (metal), 95% (wood), and 95% (polymer), respectively, which were better than the VNIR and SWIR models. The average detection rate (90.4%) of the Fusion model for all polymer, wood, and metal samples was higher than the VNIR and SWIR models by 38% and 5%, respectively. In summary, the Fusion model outperformed the VNIR and SWIR models in detecting small FMs in the test set. An example of the classification images obtained from the three FM blob detection models on the test set is shown in Figure 8.

3.4.4. Discussion

In the case of the small size polymers, the Fusion model clearly outperformed the VNIR and SWIR models when the detection rates were compared by 26% and 13%, respectively. The VNIR model performed well when the color of the samples was distinguishable from the chicken fillet but missed white materials which had a similar color to the fat or specular reflection. The SWIR model performed well to detect the samples that had different chemical compositions from the chicken fillet but missed red latex glove and blue facial mask pieces that were spectrally similar to the muscle tissue. However, the Fusion model successfully detected these small FM pieces missed by the VNIR and SWIR models. Hence, these results implied that the fusion of VNIR and SWIR HSI modalities was effective in the detection and classification of polymers.
In the case of the small metal and wood pieces, the detection rates (metal: 81%, wood: 95%) of the Fusion model were much higher than the VNIR model by 37% for metal and 50% for wood, while they were similar in detecting wood (95%) or slightly higher in detecting metal (79%) compared with the SWIR model. The specular reflection on the metal surfaces and the light color of the wood samples were the main cause of the low detection rate of the VNIR and SWIR models. The results suggested that although the detection of an FM object was affected by its semi-transparency or specular reflection at the pixel-level, a portion of the object could be still detected as FM by the Fusion model as long as some part of the object was detected as a blob. In summary, the Fusion model improved the FM-blob detection rate by about 13% for polymer and 2% for metal detection compared with the SWIR model.
Notice that the precisions on the test set were increased compared with the precisions on the training set mainly because the number of TP was increased for the test set, while the number of FP for the test set remained similar to the training set. This result suggested that more test data would increase the precision of the models. Although the precision (95%) of the fusion algorithm was slightly lower than the precisions of the VNIR (98%) and SWIR (96%) models, the recall (93%, sensitivity) of the Fusion model was much higher compared with the VNIR (62%) and SWIR (82%) models. Therefore, the F1 score of the Fusion model was higher than the VNIR (76%) and SWIR (89%) models, which indicated the Fusion model we developed worked efficiently in detecting small size FM samples. In addition, although more FPs were detected in the Fusion model, the JAC (88%) was much higher than the VNIR (62%) and SWIR (79%) models. Therefore, we concluded that the Fusion model outperformed the single modality models.

4. Conclusions

A Fusion model based on data fusion and decision fusion from visible near-infrared (VNIR) and short-wave infrared (SWIR) hyperspectral images was developed for the detection of foreign materials on the surfaces of broiler breast fillets. The study found that the accuracies of detecting 2 × 2 mm2 pieces of polymer, wood, and metal foreign materials with the Fusion model were 95%, 95%, and 81%, respectively. The F1 score and Jaccard index of the Fusion model were increased by more than 5% and 8% in comparison to the VNIR- and SWIR-based foreign material detection models. Transparent and semi-transparent materials were excluded in the model evaluation because of the optical fact that transparent and semi-transparent materials were optically clear or semi-clear without characteristic absorptions in the wavelengths from 400 nm to 2500 nm. In conclusion, the fusion of two hyperspectral imaging modalities provided an effective method to detect a variety of small sized foreign materials on the chicken meat. The developed model will be the baseline for online high-speed hyperspectral imaging applications. Further research through systems engineering and algorithm optimization is needed for commercial poultry processing application.

Author Contributions

Conceptualization, S.C. and S.-C.Y.; data curation, S.C.; methodology, S.C. and S.-C.Y.; software, S.C. and S.-C.Y.; investigation, S.C.; validation, S.C.; formal analysis, S.C.; writing—original draft preparation, S.C.; writing—review and editing, S.-C.Y.; visualization, S.C.; supervision, S.-C.Y.; project administration, S.-C.Y.; funding acquisition, S.-C.Y. All authors have read and agreed to the published version of the manuscript.

Funding

This research was supported in part by an appointment to the Agricultural Research Service (ARS) Research Participation Program administered by the Oak Ridge Institute for Science and Education (ORISE) through an interagency agreement between the U.S. Department of Energy (DOE) and the U.S. Department of Agriculture (USDA). ORISE is managed by ORAU under DOE contract number DE-SC0014664. All opinions expressed in this paper are the author’s and do not necessarily reflect the policies and views of USDA, DOE, or ORAU/ORISE.

Conflicts of Interest

The authors declare no conflict of interest.

References

  1. Thomsen, M.R.; McKenzie, A.M. Market incentives for safe foods: An Examination of shareholder losses from meat and poultry recalls. Am. J. Agric. Econ. 2001, 83, 526–538. [Google Scholar] [CrossRef]
  2. USDA-FSIS. Presence of Foreign Material in Meat or Poultry Products—Revision 3. Available online: http://www.fsis.usda.gov/policy/fsis-directives/7310.5 (accessed on 31 August 2021).
  3. Dogan, H.; Subramanyam, B. Analysis for Extraneous Matter. In Food Analysis; Nielsen, S.S., Ed.; Springer: Cham, Switzerland, 2017; pp. 599–614. [Google Scholar]
  4. Lim, J.; Lee, A.; Kang, J.; Seo, Y.; Kim, B.; Kim, G.; Kim, S.M. Non-destructive detection of bone fragments embedded in meat using hyperspectral reflectance imaging technique. Sensors 2020, 20, 4038. [Google Scholar] [CrossRef] [PubMed]
  5. Barbut, S. Review: Automation and meat quality-global challenges. Meat Sci. 2014, 96, 335–345. [Google Scholar] [CrossRef]
  6. Tao, Y.; Chen, Z.; Jing, H.; Walker, J. Internal Inspection of Deboned Poultry using X-ray Imaging and Adaptive Thresholding. Trans ASAE 2001, 44, 1005–1009. [Google Scholar]
  7. Kwon, J.-S.; Lee, J.-M.; Kim, W.-Y. Real-time Detection of Foreign Objects using X-ray Imaging for Dry Food Manufacturing Line. In Proceedings of the IEEE International Symposium on Consumer Electronics, Vilamoura, Portugal, 1–4 April 2008. [Google Scholar]
  8. Zhu, L.; Spachos, P.; Pensini, E.; Plataniotis, K.N. Deep learning and machine vision for food processing: A survey. Curr. Res. Food Sci. 2021, 4, 233–249. [Google Scholar] [CrossRef] [PubMed]
  9. Jha, S.N.; Narsaiah, K.; Basediya, A.L.; Sharma, R.; Jaiswal, P.; Kumar, R.; Bhardwaj, R. Measurement techniques and application of electrical properties for nondestructive quality evaluation of foods—A Review. J. Food Sci. Technol. 2011, 48, 387–411. [Google Scholar] [CrossRef] [PubMed] [Green Version]
  10. Pallav, P.; Diamond, G.G.; Hutchins, D.A.; Green, R.J.; Gan, T.H. A Near-Infrared (NIR) technique for imaging food materials. J. Food Sci. 2009, 74, E23–E33. [Google Scholar] [CrossRef]
  11. Adebayo, S.E.; Hashim, N.; Abdan, K.; Hanafi, M. Application and potential of backscattering imaging techniques in agricultural and food processing—A Review. J. Food Eng. 2016, 169, 155–164. [Google Scholar] [CrossRef]
  12. ElMasry, G.; Sun, D.-W.; Allen, P. Non-destructive determination of water-holding capacity in fresh beef by using NIR hyperspectral imaging. Food Res. Int. 2011, 44, 2624–2633. [Google Scholar] [CrossRef]
  13. Barbin, D.F.; ElMasry, G.; Sun, D.-W.; Allen, P. Non-destructive determination of chemical composition in intact and minced pork using near-infrared hyperspectral imaging. Food Chem. 2013, 138, 1162–1171. [Google Scholar] [CrossRef]
  14. Kamruzzaman, M.; ElMasry, G.; Sun, D.-W.; Allen, P. Non-destructive assessment of instrumental and sensory tenderness of lamb meat using NIR hyperspectral imaging. Food Chem. 2013, 141, 389–396. [Google Scholar] [CrossRef] [PubMed]
  15. Jiang, H.; Yoon, S.-C.; Zhuang, H.; Wang, W.; Lawrence, K.C.; Yang, Y. Tenderness classification of fresh broiler breast fillets using visible and near-infrared hyperspectral imaging. Meat Sci. 2018, 139, 82–90. [Google Scholar] [CrossRef]
  16. Jiang, H.; Wang, W.; Zhuang, H.; Yoon, S.; Li, Y.; Yang, Y. Visible and near-infrared hyperspectral imaging for cooking loss classification of fresh broiler breast fillets. Appl. Sci. 2018, 8, 256. [Google Scholar] [CrossRef] [Green Version]
  17. Jiang, H.; Yoon, S.-C.; Zhuang, H.; Wang, W.; Li, Y.; Lu, C.; Li, N. Non-destructive assessment of final color and PH attributes of broiler breast fillets Using visible and near-Infrared Hyperspectral imaging: A preliminary study. Infrared Phys. Technol. 2018, 92, 309–317. [Google Scholar] [CrossRef]
  18. Sugiyama, T.; Sugiyama, J.; Tsuta, M.; Fujita, K.; Shibata, M.; Kokawa, M.; Araki, T.; Nabetani, H.; Sagara, Y. NIR Spectral imaging with discriminant analysis for detecting foreign materials among blueberries. J. Food Eng. 2010, 101, 244–252. [Google Scholar] [CrossRef]
  19. Zhang, M.; Li, C.; Yang, F. Classification of foreign matter embedded inside cotton lint using short wave Infrared (SWIR) hyperspectral transmittance imaging. Comput. Electron. Agric. 2017, 139, 75–90. [Google Scholar] [CrossRef]
  20. Mo, C.; Kim, G.; Kim, M.S.; Lim, J.; Cho, H.; Barnaby, J.Y.; Cho, B.-K. Fluorescence hyperspectral imaging technique for foreign substance detection on fresh-cut lettuce. J. Sci. Food Agric. 2017, 97, 3985–3993. [Google Scholar] [CrossRef]
  21. Zhang, Y.; Wang, X.; Shan, J.; Zhao, J.; Zhang, W.; Liu, L.; Wu, F. Hyperspectral imaging based method for rapid detection of microplastics in the intestinal tracts of fish. Environ. Sci. Technol. 2019, 53, 5151–5158. [Google Scholar] [CrossRef]
  22. Al-Sarayreh, M.; Reis, M.M.; Yan, W.Q.; Klette, R. A Sequential CNN Approach for Foreign Object Detection in Hyperspectral Images. In Proceedings of the Computer Analysis of Images and Patterns; Vento, M., Percannella, G., Eds.; Springer International Publishing: Cham, Switzerland, 2019; pp. 271–283. [Google Scholar]
  23. Song, S.; Liu, Z.; Huang, M.; Zhu, Q.; Qin, J.; Kim, M.S. Detection of fish bones in fillets by raman hyperspectral imaging technology. J. Food Eng. 2020, 272, 109808. [Google Scholar] [CrossRef]
  24. Li, M.; Huang, M.; Zhu, Q.; Zhang, M.; Guo, Y.; Qin, J. Pickled and dried mustard foreign matter detection using multispectral imaging system based on single shot method. J. Food Eng. 2020, 285, 110106. [Google Scholar] [CrossRef]
  25. Kwak, D.-H.; Son, G.-J.; Park, M.-K.; Kim, Y.-D. Rapid foreign object detection system on seaweed using VNIR hyperspectral imaging. Sensors 2021, 21, 5279. [Google Scholar] [CrossRef]
  26. Ghamisi, P.; Rasti, B.; Yokoya, N.; Wang, Q.; Hofle, B.; Bruzzone, L.; Bovolo, F.; Chi, M.; Anders, K.; Gloaguen, R.; et al. Multisource and multitemporal data fusion in remote sensing: A Comprehensive Review of the State of the Art. IEEE Geosci. Remote Sens. Mag. 2019, 7, 6–39. [Google Scholar] [CrossRef] [Green Version]
  27. Borràs, E.; Ferré, J.; Boqué, R.; Mestres, M.; Aceña, L.; Busto, O. Data fusion methodologies for food and beverage authentication and quality Assessment—A Review. Anal. Chim. Acta 2015, 891, 1–14. [Google Scholar] [CrossRef] [PubMed]
  28. Bevilacqua, M.; Bro, R.; Marini, F.; Rinnan, Å.; Rasmussen, M.A.; Skov, T. Recent chemometrics advances for foodomics. TrAC Trends Anal. Chem. 2017, 96, 42–51. [Google Scholar] [CrossRef]
  29. Li, H.; Chen, Q.; Zhao, J.; Wu, M. Nondestructive detection of total volatile basic nitrogen (TVB-N) content in pork meat by integrating hyperspectral imaging and colorimetric sensor combined with a nonlinear data fusion. LWT Food Sci. Technol. 2015, 63, 268–274. [Google Scholar] [CrossRef]
  30. Cheng, W.; Sun, D.-W.; Pu, H.; Liu, Y. Integration of spectral and textural data for enhancing hyperspectral prediction of K value in pork meat. LWT Food Sci. Technol. 2016, 72, 322–329. [Google Scholar] [CrossRef]
  31. Yang, Y.; Wang, W.; Zhuang, H.; Yoon, S.-C.; Jiang, H. Fusion of spectra and texture data of hyperspectral imaging for the prediction of the water-holding capacity of fresh chicken breast filets. Appl. Sci. 2018, 8, 640. [Google Scholar] [CrossRef] [Green Version]
  32. Márquez, C.; López, M.I.; Ruisánchez, I.; Callao, M.P. FT-Raman and NIR spectroscopy data fusion strategy for multivariate qualitative analysis of food fraud. Talanta 2016, 161, 80–86. [Google Scholar] [CrossRef]
  33. Li, L.; Xie, S.; Ning, J.; Chen, Q.; Zhang, Z. Evaluating green tea quality based on multisensor data fusion combining hyperspectral imaging and olfactory visualization systems. J. Sci. Food Agric. 2019, 99, 1787–1794. [Google Scholar] [CrossRef]
  34. Fan, S.; Li, C.; Huang, W.; Chen, L. Data fusion of two hyperspectral imaging systems with complementary spectral sensing ranges for blueberry bruising detection. Sensors 2018, 18, 4463. [Google Scholar] [CrossRef] [Green Version]
  35. Yu, H.-D.; Qing, L.-W.; Yan, D.-T.; Xia, G.; Zhang, C.; Yun, Y.-H.; Zhang, W. Hyperspectral imaging in combination with data fusion for rapid evaluation of tilapia fillet freshness. Food Chem. 2021, 348, 129129. [Google Scholar] [CrossRef]
  36. FDA. CPG Sec 555.425 Foods, Adulteration Involving Hard or Sharp Foreign Objects. Available online: https://www.fda.gov/regulatory-information/search-fda-guidance-documents/cpg-sec-555425-foods-adulteration-involving-hard-or-sharp-foreign-objects (accessed on 4 December 2021).
  37. USDA. Foreign Material Manual. Available online: https://www.ams.usda.gov/sites/default/files/media/Foreign_Material_Manual%5B1%5D.pdf (accessed on 4 December 2021).
  38. Qin, J.; Burks, T.F.; Kim, M.S.; Chao, K.; Ritenour, M.A. Citrus canker detection using hyperspectral reflectance imaging and PCA-based image classification method. Sens. Instrum. Food Qual. Saf. 2008, 2, 168–177. [Google Scholar] [CrossRef]
  39. Yang, Y.; Zhuang, H.; Yoon, S.-C.; Wang, W.; Jiang, H.; Jia, B.; Li, C. Quality assessment of intact chicken breast fillets using factor analysis with Vis/NIR spectroscopy. Food Anal. Methods 2018, 11, 1356–1366. [Google Scholar] [CrossRef]
  40. Jiang, H.; Yoon, S.-C.; Zhuang, H.; Wang, W.; Li, Y.; Yang, Y. Integration of spectral and textural features of visible and near-infrared hyperspectral imaging for differentiating between normal and white striping broiler breast meat. Spectrochim. Acta. A. Mol. Biomol. Spectrosc. 2019, 213, 118–126. [Google Scholar] [CrossRef]
  41. Henschel, H.; Andersson, A.T.; Jespers, W.; Mehdi Ghahremanpour, M.; van der Spoel, D. Theoretical infrared spectra: Quantitative Similarity Measures and Force Fields. J. Chem. Theory Comput. 2020, 16, 3307–3315. [Google Scholar] [CrossRef] [PubMed] [Green Version]
  42. Chen, X.; Wang, D.; Chen, J.; Wang, C.; Shen, M. The mixed pixel effect in land surface phenology: A simulation study. Remote Sens. Environ. 2018, 211, 338–344. [Google Scholar] [CrossRef]
  43. Xu, J.-L.; Lin, X.; Hugelier, S.; Herrero-Langreo, A.; Gowen, A.A. Spectral imaging for characterization and detection of plastic substances in branded teabags. J. Hazard. Mater. 2021, 418, 126328. [Google Scholar] [CrossRef] [PubMed]
  44. Rani, M.; Marchesi, C.; Federici, S.; Rovelli, G.; Alessandri, I.; Vassalini, I.; Ducoli, S.; Borgese, L.; Zacco, A.; Bilo, F.; et al. Miniaturized near-infrared (MicroNIR) spectrometer in plastic waste sorting. Materials 2019, 12, 2740. [Google Scholar] [CrossRef] [PubMed] [Green Version]
  45. Bowker, B.; Hawkins, S.; Zhuang, H. Measurement of water-holding capacity in raw and freeze-dried broiler breast meat with visible and near-Infrared spectroscopy. Poult. Sci. 2014, 93, 1834–1841. [Google Scholar] [CrossRef]
  46. Manley, M. Near-Infrared Spectroscopy and Hyperspectral Imaging: Non-destructive analysis of biological materials. Chem. Soc. Rev. 2014, 43, 8200–8214. [Google Scholar] [CrossRef] [PubMed] [Green Version]
Figure 1. Pictures of all FM samples used in this study: (a) 5 × 5 mm2 size and (b) 2 × 2 mm2 size of FMs. The information about the samples in the pictures is in Table 1, while the samples within a set (Set 1–6) were placed from left to right along a row in the pictures, they were listed from top to bottom in the table.
Applsci 11 11987 g001
Figure 2. Chicken breast fillets contaminated (a) with 5 × 5 mm2 pieces of FMs and (b) with 2 × 2 mm2 pieces of FMs.
Applsci 11 11987 g002
Figure 3. Flow chart of the overall classification model.
Applsci 11 11987 g003
Figure 4. Spectral data of muscle and fat. (a) Spectrometer and (b) Hyperspectral image ROI mean spectrum. The scaling caused reflectance values to appear outside of the 0–1 range, which only occurs in this figure and not in the data used in the analysis.
Applsci 11 11987 g004
Figure 5. (a) A SWIR band image of a chicken breast fillet contaminated with a semi-transparent foreign material in a red box and other foreign materials; Enlarged images of a semi-transparent foreign material pointing the floated area (b) and the stuck area (c); Enlarged image of an area pointing to a pixel for the chicken fillet (d); (e) The plot shows the spectral responses of the floated and stuck semi-transparent foreign material and the chicken fillet.
Applsci 11 11987 g005
Figure 6. Selection of key wavelengths for discriminating chicken fillet from other materials. (a) VNIR range muscle and fat and (b) SWIR range muscle and fat related key wave bands.
Applsci 11 11987 g006
Figure 7. Classification images with (a) VNIR model only, (b) SWIR model only (c) developed fusion algorithm on the training set: Fusion + VNIR + SWIR. Green color represents chicken meat and red color represents FMs.
Applsci 11 11987 g007
Figure 8. Classification images with (a) VNIR model only, (b) SWIR model only (c) developed fusion algorithm on the test set: Fusion + VNIR + SWIR. Green color represents chicken meat and red color represents FMs.
Applsci 11 11987 g008
Table 1. List of the FM samples.
Set (n = 30)SampleTypeGroupColorTransparencySourceSurface
Set 1
(n = 5)
Latex gloveNatural rubberPolymerPinkOpaqueHOMSSEMSmooth
Latex gloveNatural rubberPolymerBlackOpaqueThxTomsSmooth
Metal pieceAluminumMetalsilverOpaque 1OMS 5Smooth 13
Latex gloveNatural rubberPolymerWhiteST 2MIH 6Smooth
Conveyor beltSynthetic rubberPolymerWhiteOpaqueGraingerSmooth
Set 2
(n = 5)
Latex gloveNatural rubberPolymerRedOpaqueSYROVIASmooth
PVC glovePVCPolymerBlueOpaqueWLG 7Rough
PVC glovePVCPolymerGreenOpaqueWLG 7Rough
Metal pieceAluminum 3MetalBlackOpaqueOMSSmooth
Conveyor beltPVCPolymerWhiteOpaqueGraingerSmooth
Set 3
(n = 5)
PVC glovePVCPolymerPinkOpaqueLANON 8 Smooth
Nitrile gloveSynthetic rubberPolymerPurpleST 2MED PRIDESmooth
Nitrile gloveSynthetic rubberPolymerBlackOpaqueAMMEXSmooth
Metal pieceStainless 316MetalSilverOpaque 1Rose Metal 9Smooth 14
Conveyor beltPLPolymerWhiteOpaqueGraingerRough
Set 4
(n = 5)
Wood pieceOakWoodBrownOpaqueWW Wood Inc.Bumpy
Plastic boxPEPolymerWhiteST 2RCP 10Smooth
Conveyor beltSynthetic rubberPolymerGreenOpaqueGraingerRough
Conveyor beltPURPolymerBlueOpaqueGraingerSmooth
Conveyor beltPLPolymerWhiteOpaqueGraingerSmooth
Set 5
(n = 5)
HairnetPPPolymerWhiteST2Fisher ScientificSmooth 15
Metal pieceStainless 304MetalSilverOpaque 1Rose Metal 9Smooth 14
Conveyor beltSynthetic rubber 4PolymerWhiteOpaqueGraingerSmooth
GlassBorosilicateGlassClearTransparentWisamicSmooth
Disposable maskPPPolymerBlueOpaqueZSST 11Smooth 15
Set 6
(n = 5)
Plastic filmPVCPolymerClearTransparentBoardwalkSmooth
Wood pieceMapleWoodBrownOpaqueWW Wood Inc.Rough
Disposable maskPPPolymerWhiteOpaqueZSST 11Smooth 15
Plastic lab coatPPPolymerBlueOpaqueKimberly-ClarkSmooth 16
Plastic lab coatPEPolymerWhiteST 2Ansell 12Smooth
1 Opaque (reflective), 2 Semi-transparent, 3 Black color painted aluminum, 4 Butyl (synthetic rubber), 5 Online Metal Supply, 6 Medline Industries Healthcare, 7 Wells Lamont Gloves, 8 LANON Protection Technology Co., Ltd., 9 Rose Metal Products, 10 Rubbermaid Commercial Products, 11 Zhejiang Shunfa Safety Technology Co., LTD, 12 Ansell Edmont Industrial, 13 Brushed, 14 Unpolished, 15 Fiber, and 16 Fiber with hole.
Table 2. Foreign material detection rates (%) based on pixel-level classification.
DataModel MetalWoodPolymer
Training
(5 × 5 mm2)
VNIR62.3% (3725/5979) *63.9% (2296/3592)71.3% (22104/30994)
SWIR71.5% (3361/4702)80.5% (2624/3259)79.5% (20118/25295)
Test
(2 × 2 mm2)
VNIR10% (371/3718)10.2% (159/1552)33.1% (5186/15671)
SWIR37.7% (1119/2966)58.9% (874/1485)50% (6241/12492)
* Numbers in (/) represent (correctly identified pixels/ROI pixels).
Table 3. Performance of three foreign material blob detection models on the training set. DR refers to detection rate.
ModelMetal DRWood DRPolymer DRMean DRFPPrecisionRecallF1 ScoreJAC
VNIR39 1 (97.5%) 219 (95%)157 (92.4%)95.0%597.7%93.5%95.6%91.5%
SWIR38 (95%)20 (100%)157 (92.4%)95.8%1294.3%93.5%94.1%88.8%
Fusion40 (100%)20 (100%)170 (100%)100%1792.7%100%96.4%93.1%
1 Integers in Metal, Wood, and Polymer are the numbers of correctly detected FM blobs. 2 Percentage number in each () represents a detection rate.
Table 4. Performance of three foreign material blob detection models on the test set. DR refers to detection rate.
ModelMetal DRWood DRPolymer DRMean DRFPPrecisionRecallF1 ScoreJAC
VNIR35 1 (43.8%) 218 (45%)234 (68.8%)52.5%698%62.4%76.2%61.6%
SWIR63 (78.8%)38 (95%)277 (81.5%)85.1%1695.9%82.2%88.5%79.4%
Fusion65 (81.3%)38 (95%)323 (95%)90.4%2295.1%92.6%93.8%88.4%
1 Integers in Metal, Wood, and Polymer are the numbers of correctly detected FM blobs. 2 Percentage number in each () represents a detection rate.
Publisher’s Note: MDPI stays neutral with regard to jurisdictional claims in published maps and institutional affiliations.

