Article

Multiple Multi-Scale Neural Networks Knowledge Transfer and Integration for Accurate Pixel-Level Retinal Blood Vessel Segmentation

1
School of Computer Science and Technology, Xi’an University of Posts and Telecommunications, Xi’an 710129, China
2
Shaanxi Key Laboratory of Network Data Analysis and Intelligent Processing, Xi’an 710121, China
3
Xi’an Key Laboratory of Big Data and Intelligent Computing, Xi’an 710121, China
4
Shaanxi Key Lab of Speech & Image Information Processing (SAIIP), School of Computer Science and Engineering, Northwestern Polytechnical University, Xi’an 710129, China
5
National Engineering Laboratory for Integrated Aero-Space-Ground-Ocean Big Data Application Technology, Xi’an 710129, China
*
Author to whom correspondence should be addressed.
Appl. Sci. 2021, 11(24), 11907; https://doi.org/10.3390/app112411907
Submission received: 3 October 2021 / Revised: 12 November 2021 / Accepted: 25 November 2021 / Published: 14 December 2021

Abstract

:
Retinal blood vessel segmentation plays an important role for analysis of retinal diseases, such as diabetic retinopathy and glaucoma. However, retinal blood vessel segmentation remains a challenging task due to the low contrast between some vessels and background, the different presenting conditions caused by uneven illumination and the artificial segmentation results are influenced by human experience, which seriously affects the classification accuracy. To address this problem, we propose a multiple multi-scale neural networks knowledge transfer and integration method in order to accurately segment for retinal blood vessel image. With the integration of multi-scale networks and multi-scale input patches, the blood vessel segmentation performance is obviously improved. In addition, applying knowledge transfer to the network training process, the pre-trained network reduces the number of network training iterations. The experimental results on the DRIVE dataset and the CHASE_DB1 dataset show the effectiveness of the method, whose average accuracy on the two datasets are 96.74% and 97.38%, respectively.

1. Introduction

Retinal blood vessels are the only part of the systemic blood vessels that can be observed in a non-invasive way. The changes of retinal blood vessels, such as the width, angle and branching shape of blood vessels, which can be used as the diagnostic basis for vascular-related diseases [1,2], for example, patients with glaucoma may develop into neurovascular atrophy, micro aneurysms and cotton wool spots [3,4]. Therefore, the segmentation of retinal blood vessels in retinal image is of great significance [5]. However, retinal images are easily affected by different illumination, the same retinal vessel always presents different qualities; the contrast between capillaries and background is small and easily confusing; doctors with different experiences often segment the same retinal vessel into different results and this often takes effort and time. According to above reasons, which lead to the difficulty of retinal blood vessel segmentation, thus, the machine learning-based retinal vessel segmentation methods are urgently needed [6,7].
The machine learning-based retinal vessel segmentation methods can be always divided into deep learning-based methods and non-deep learning-based methods. Among non-deep learning methods, it was the first proposed to use a Gaussian filter to segment the blood vessel image, which used the features of the blood vessel to solve the difficulties for segmentation, e.g., low contrast of the local blood vessel [8]. A B-Combination of Shifted Filter Responses (COSFIRE) filter [9] was proposed with selective response to automatically segment blood vessel trees and this filter achieved good results. Based on the above, the authors presented a segmentation method combining multi-scale matched filtering and double-threshold, which could reduce the influence of background noise [10]. Except for the filter-based method, the authors proposed a segmentation method with iterative adaptive threshold, which iteratively discovered new vascular pixels through global threshold of enhanced images and adaptive threshold of residual images [11]. In [12], the authors presented a K-Nearest Neighbor (KNN)-based approach, which used sequential forward feature selection to distinguish vascular and non-vascular. In [13], a retinal vessel segmentation method based on morphological component analysis (MCA) was proposed to solve the problem of false positive vessels. However, the non-deep learning-based retinal vessel segmentation methods often relied on empirical feature extraction and led to poor segmentation effect. For this reason, deep learning-based methods were proposed to be used for segmentation.
In order to enhance the segmentation effect, more and more deep learning-based methods had been proposed in the field of retinal vascular segmentation. The method used deep neural network to segment retinal blood vessels, which was pre-processed by global contrast normalization, zero phase whitening, geometric transformation and Gamma calibration data, and it had good resistance to central vascular reflex phenomenon and could segment blood vessels well [14]. Guo et al. [15] proposed a Bottom-top short connections deeply supervised network (BTS-DSN) method, which could transmit semantic information and structural information of retinal images through a short connection neural network. In [16], the author proposed a retinal blood vessel segmentation method that combined Convolutional Neural Networks (CNN) quantization and pruning. In [16], quantitative technology was used in the fully connected layer, and the pruning strategy was used in the convolutional layer to form an effective network and improve the accuracy of segmentation. Wu et al. [17] employed SCS-Net (Scale and Context Sensitive Network), which designed an adaptive feature fusion (AFF) module to guide efficient fusion between adjacent hierarchical features to capture more semantic information. The method introduced above was based on the traditional convolutional neural network. The current mainstream was a symmetrical Fully Convolutional Networks (FCN) network for retinal vessel segmentation called U-Net [18], which had achieved good results in the field of retinal vessel segmentation. On the basis of U-Net, Wu et al. [19] proposed a new lightweight retinal vessel segmentation model called Vessel-Net, which added an efficient initial residual convolution block to the structure of U-Net. The model combined the advantages of U-Net and residual module to improve feature representation, which greatly improved the segmentation performance. Mou et al. [20] introduced a new curvilinear structure segmentation network (CS2-Net), which included a self-attention mechanism in the encoder and decoder. The two attention modules were used to enhance inter-class discrimination and inter-class responsiveness. Finally, experiments were carried out on datasets to verify the effectiveness of the method. Kwon et al. [21] proposed an advanced confrontational training method to defend against the interference of unknown confrontational examples. The author used the Fast Gradient Sign Method (FGSM) to generate a fixed range of value of the adversarial example for training. The experiments showed that the U-Net model trained on different adversarial examples was more robust to unknown adversarial examples. Qilong Fu et al. [22] proposed a Multi-Scale Convolutional Neural Network with Attention Mechanisms (MSCNN-AM). The model introduced various separable convolutions with varying dilation rates, which could capture global and multi-scale vessel information better. Meanwhile, in order to reduce false-positive predictions for tiny vessel pixels, the author also adopted attention mechanisms so that the proposed MSCNN-AM could pay more attention to retinal vessel pixels instead of background pixels, and experiments showed that the model achieved good results. In [23], the author proposed a Multiscale Channel Attention Network based on the encoder-decoder architecture for fundus retinal vessel segmentation, which redesigned encoder extracts the multi-scale structure information of retinal vessels by fusing multi-scale features, which weakened the influence of complex morphology on segmentation performance. The results on the DRIVE dataset and the CHASE_DB1 dataset showed that the network could segmented the capillaries in fundus retinal images well. So far, the network evolved from U-Net dominated the field of retinal blood vessel segmentation, but they also had certain limitations. Specifically, U-Net divides the fundus retinal image into image blocks, and then inputs them into the network. It does not carefully extract the features of each pixel, so it loses the detailed features in the retinal blood image.
In order to solve this problem, this paper proposes a multiple multi-scale neural network knowledge transfer and integration method for accurate pixel-level retinal blood vessel segmentation. This method has the following characteristics: (1) it can fuse different retinal features with different sizes and different depth via multiple multi-scale neural networks to obtain better segmented results; (2) using the knowledge transfer avoids excessively long network training; (3) using networks integration to get better segmented results. Combining the above three characteristics, the segmentation effect can be improved effectively.
The remainder of the paper is organized as follows: Section 2 introduces the details of the proposed method; experimental results are reported in Section 3; in Section 4 and Section 5, discussions and conclusions are presented.

2. The Proposed Method

The proposed method includes data pre-processing, multiple multi-scale networks knowledge transfer and integration, neural network training and network testing.

2.1. Data Pre-Processing

For simplicity, we assume that the retinal blood vessel dataset is D , the retinal blood vessel images in the dataset are denoted as d 1 , d 2 ,…, d n , the images of labels in the dataset are denoted as l 1 , l 2 ,…, l n . Taking d n as an example, h and w are the length and width of d n , respectively. Firstly, padding the image d n , the padded image is represented by d n . The length and width of d n are denoted by H and W , respectively. The size of the extracted image block is p × p , the padded retinal image d n is shown in Equation (1).
d n ( H , W ) = d n ( h + p / 2 , w + p / 2 )
Secondly, starting from the first pixel of the retinal blood vessel image, traversing the n-th entire image to obtain m image blocks with the size of p × p , the whole blocks extracted from n-th image are denoted as { x n i } i = 1 m , each block respects the attribute of the center pixel.
Thirdly, getting the label y i n of the corresponding image block x i n from the image d n of labels via traversing, all of the labels in n-th image of labels are denoted as { y n i } i = 1 m . The image block and the corresponding label compose the sample pair, which is denoted as { x n i , y n i } .
Taking the open fundus retinal image dataset DRIVE as an example, there are 40 fundus retinal images in the dataset, 20 images are retinal vessel images and the others are label images.
The whole sample pairs are extracted by the above three steps, which are denoted as { x n i , y n i } i = 1 m , n = 1 N , where, N denotes the number of the retinal vessel images.

2.2. Multiple and Multi-Scales Networks Knowledge Transfer and Integration

2.2.1. Multiple Networks Integration

VGG-16 is a classic network model used for ImageNet dataset classification, which is often applied for transfer learning tasks [24,
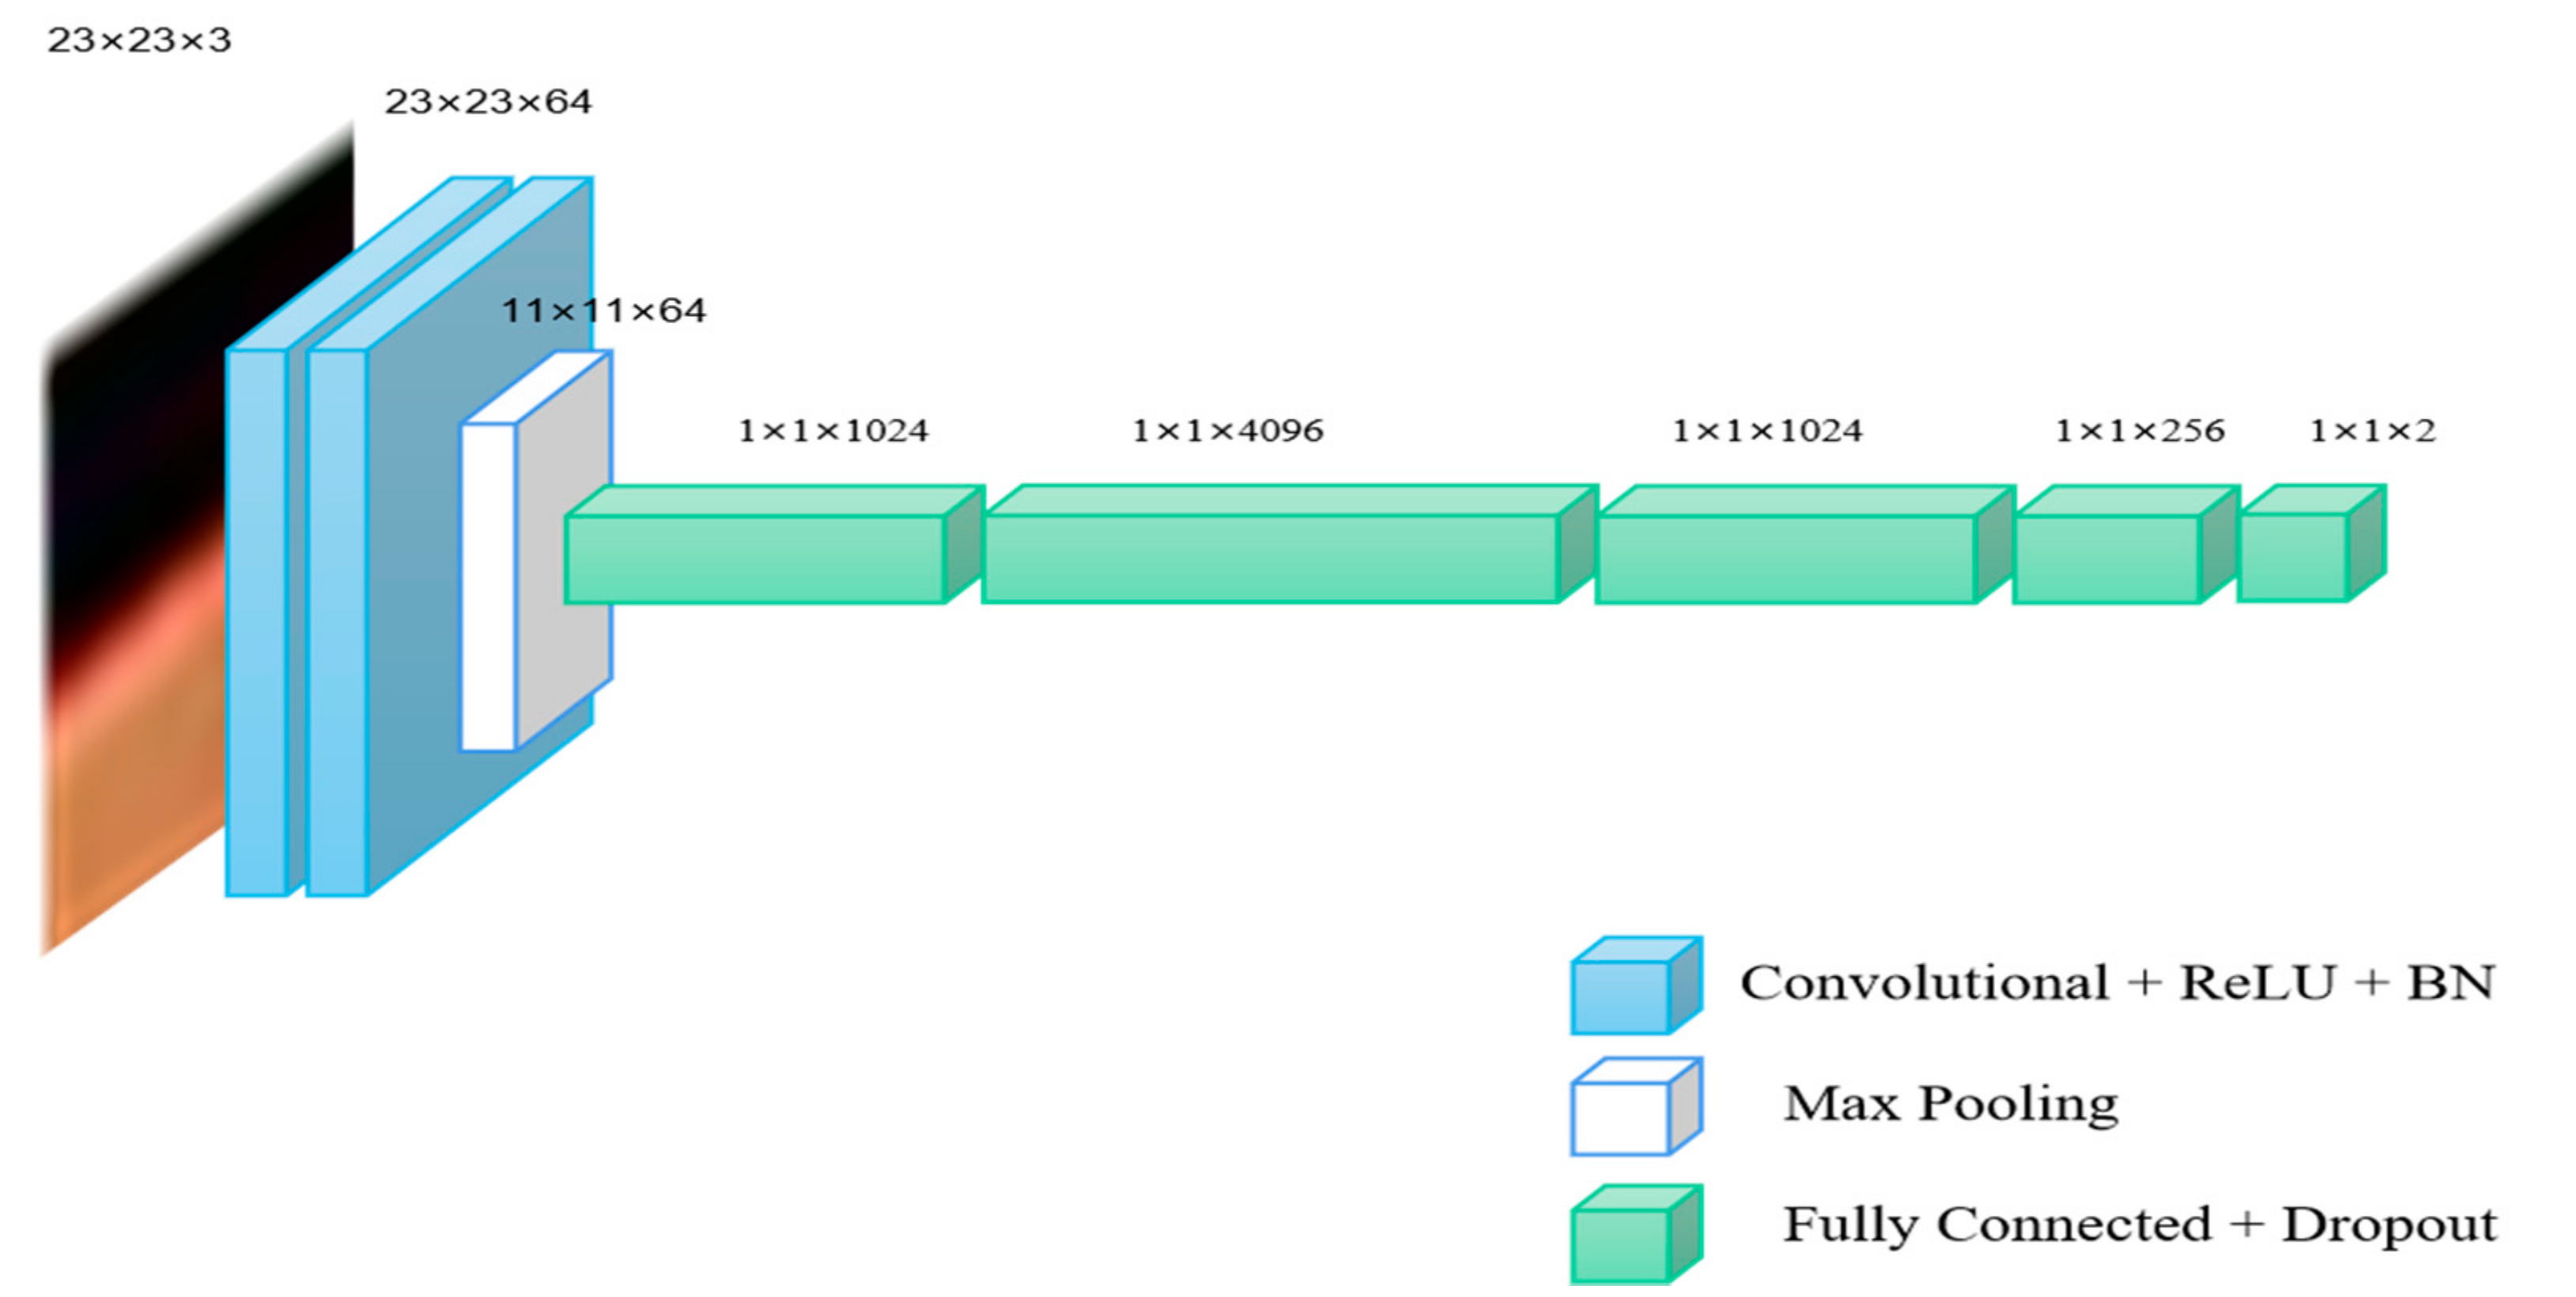
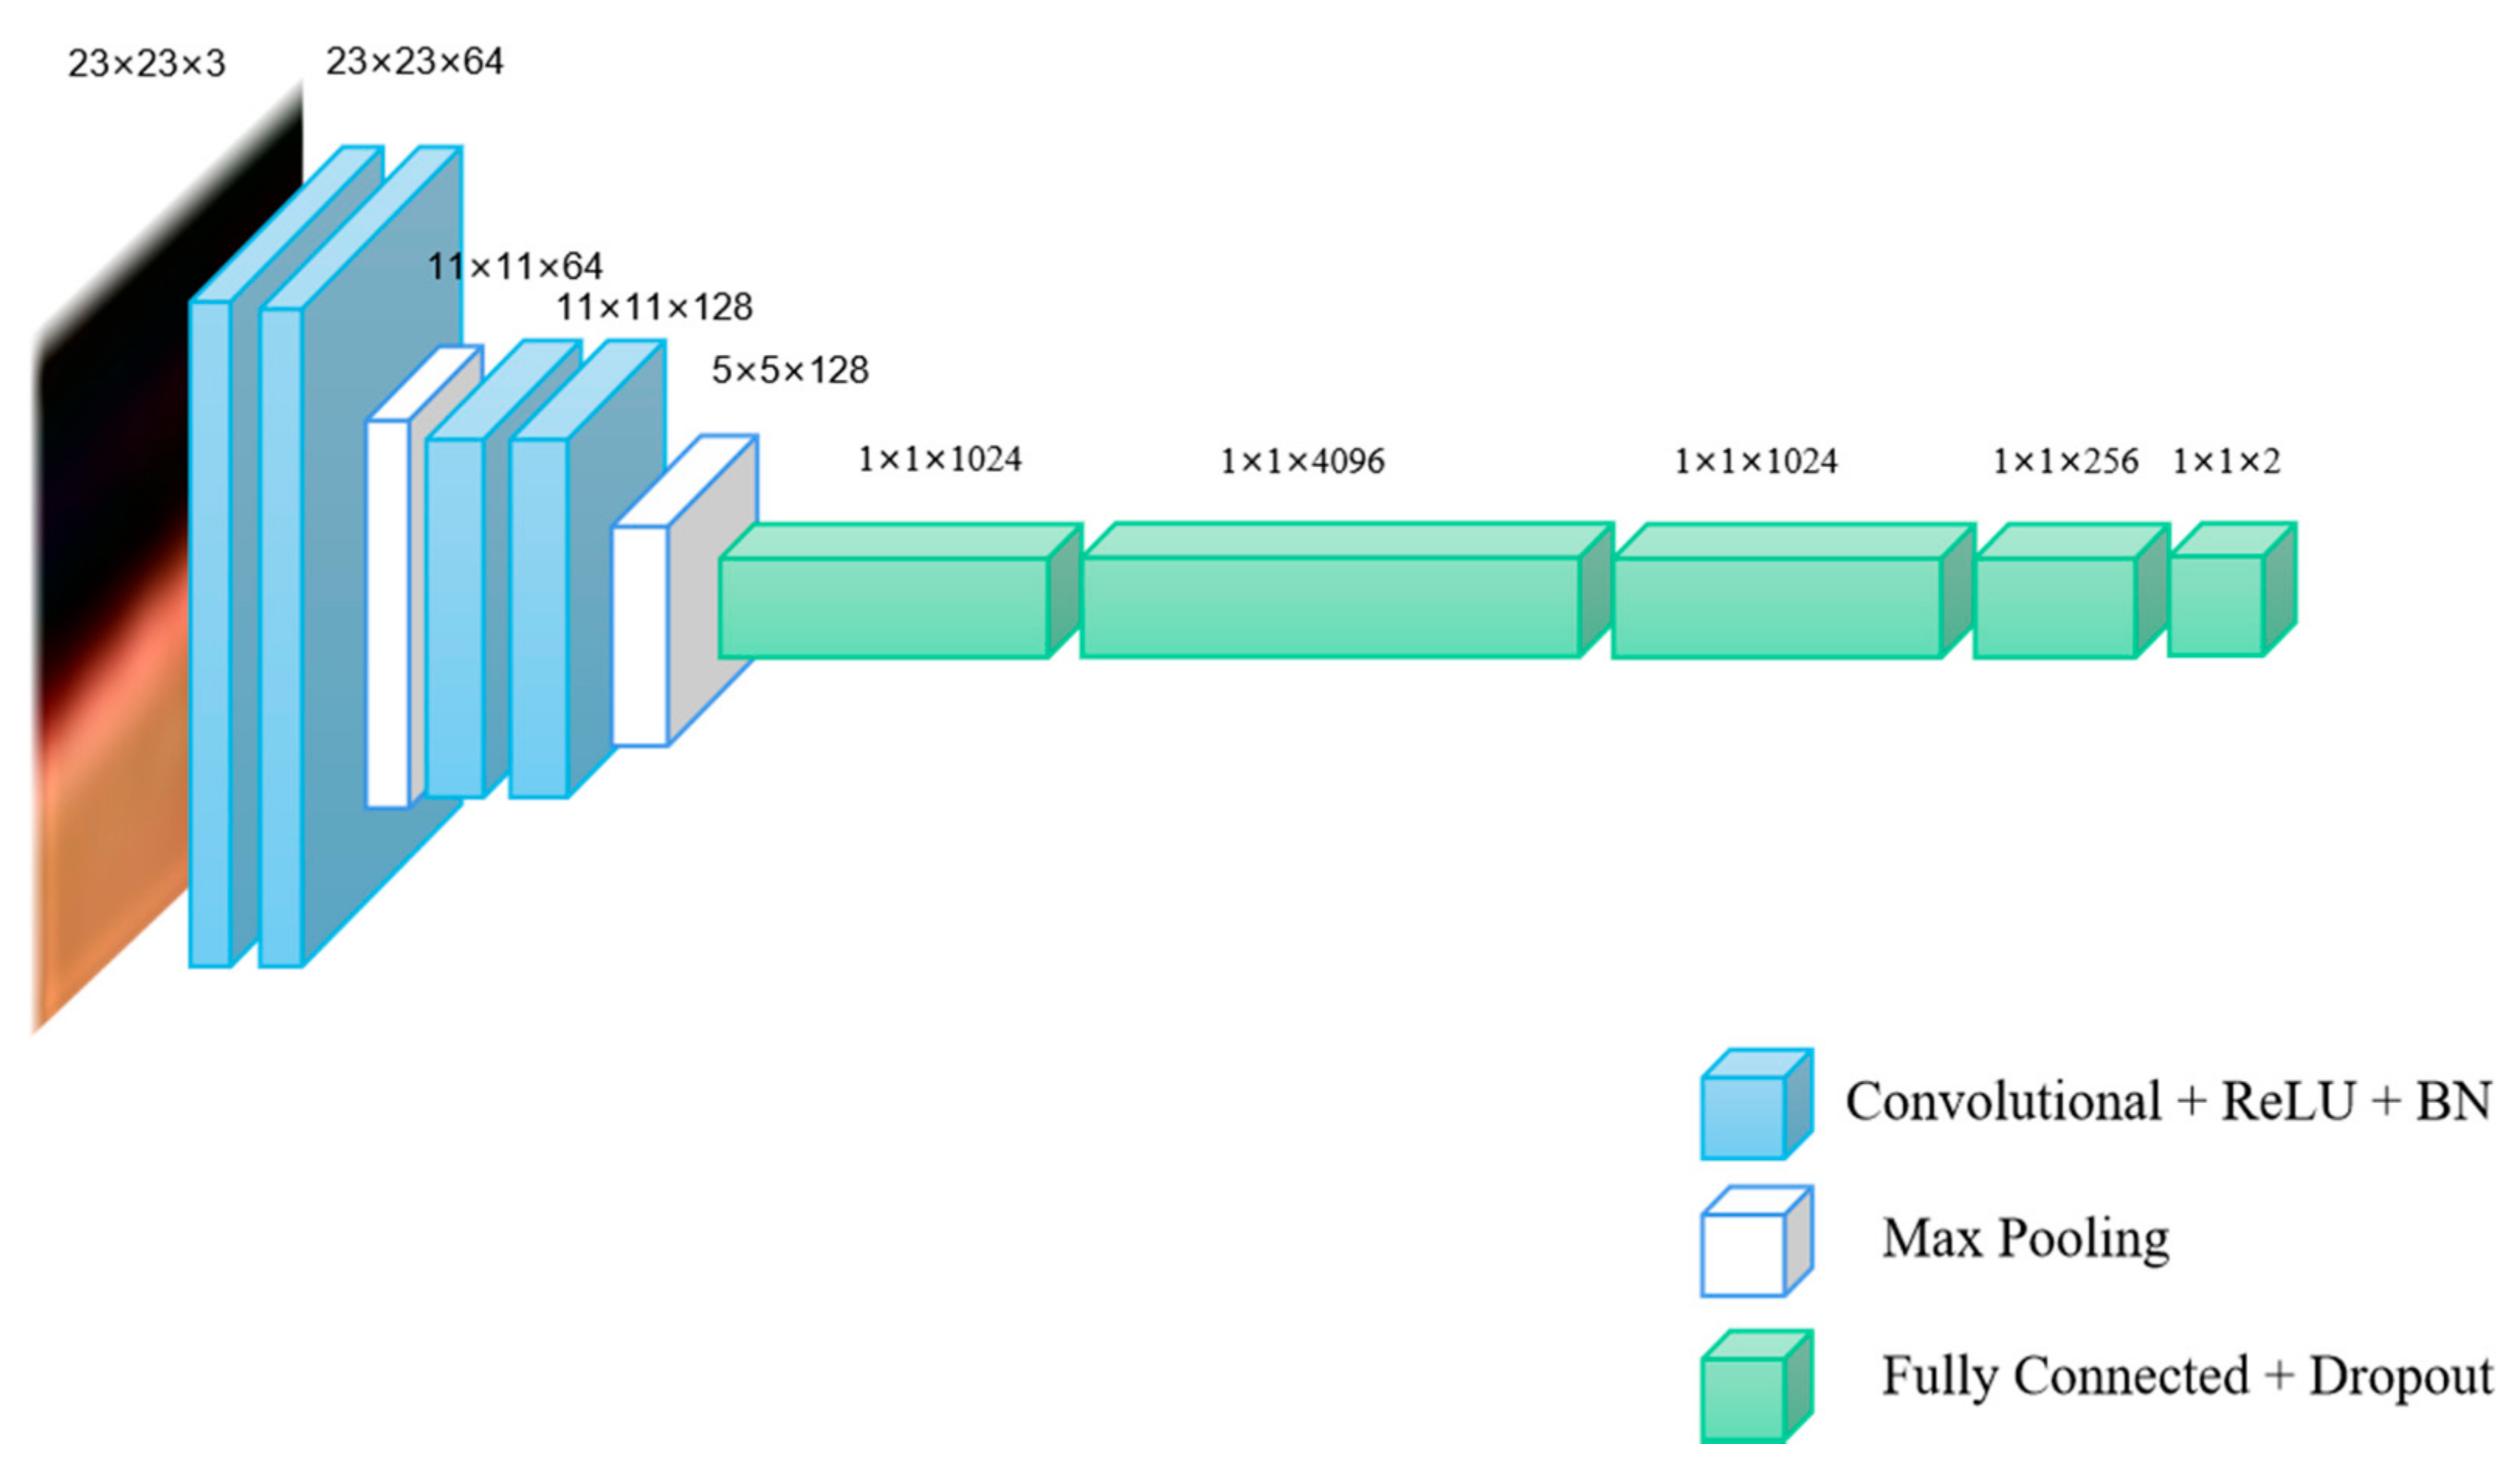
25]. VGG-16 network is composed of 13 convolutional layers, five pooling layers and three fully connected layers. In this paper, we use previous 2, 4, 7 convolutional layers of VGG-16 to establish new different models as multiple networks, which are called VGG-16-2, VGG-16-4 and VGG-16-7, respectively.
The detailed structures of VGG-16-2, VGG-16-4 andVGG-16-7 are shown in Table 1.
As shown in Table 1, conv3-64 indicates that the size of the convolution kernel is 3 × 3 and the number of channels is 64. FC-1024 indicates that the layer is a fully connected layer and the number of hidden nodes in the fully connected layer is 1024. The schematic diagram of network structures of the three networks are shown in Figure 1, Figure 2 and Figure 3.
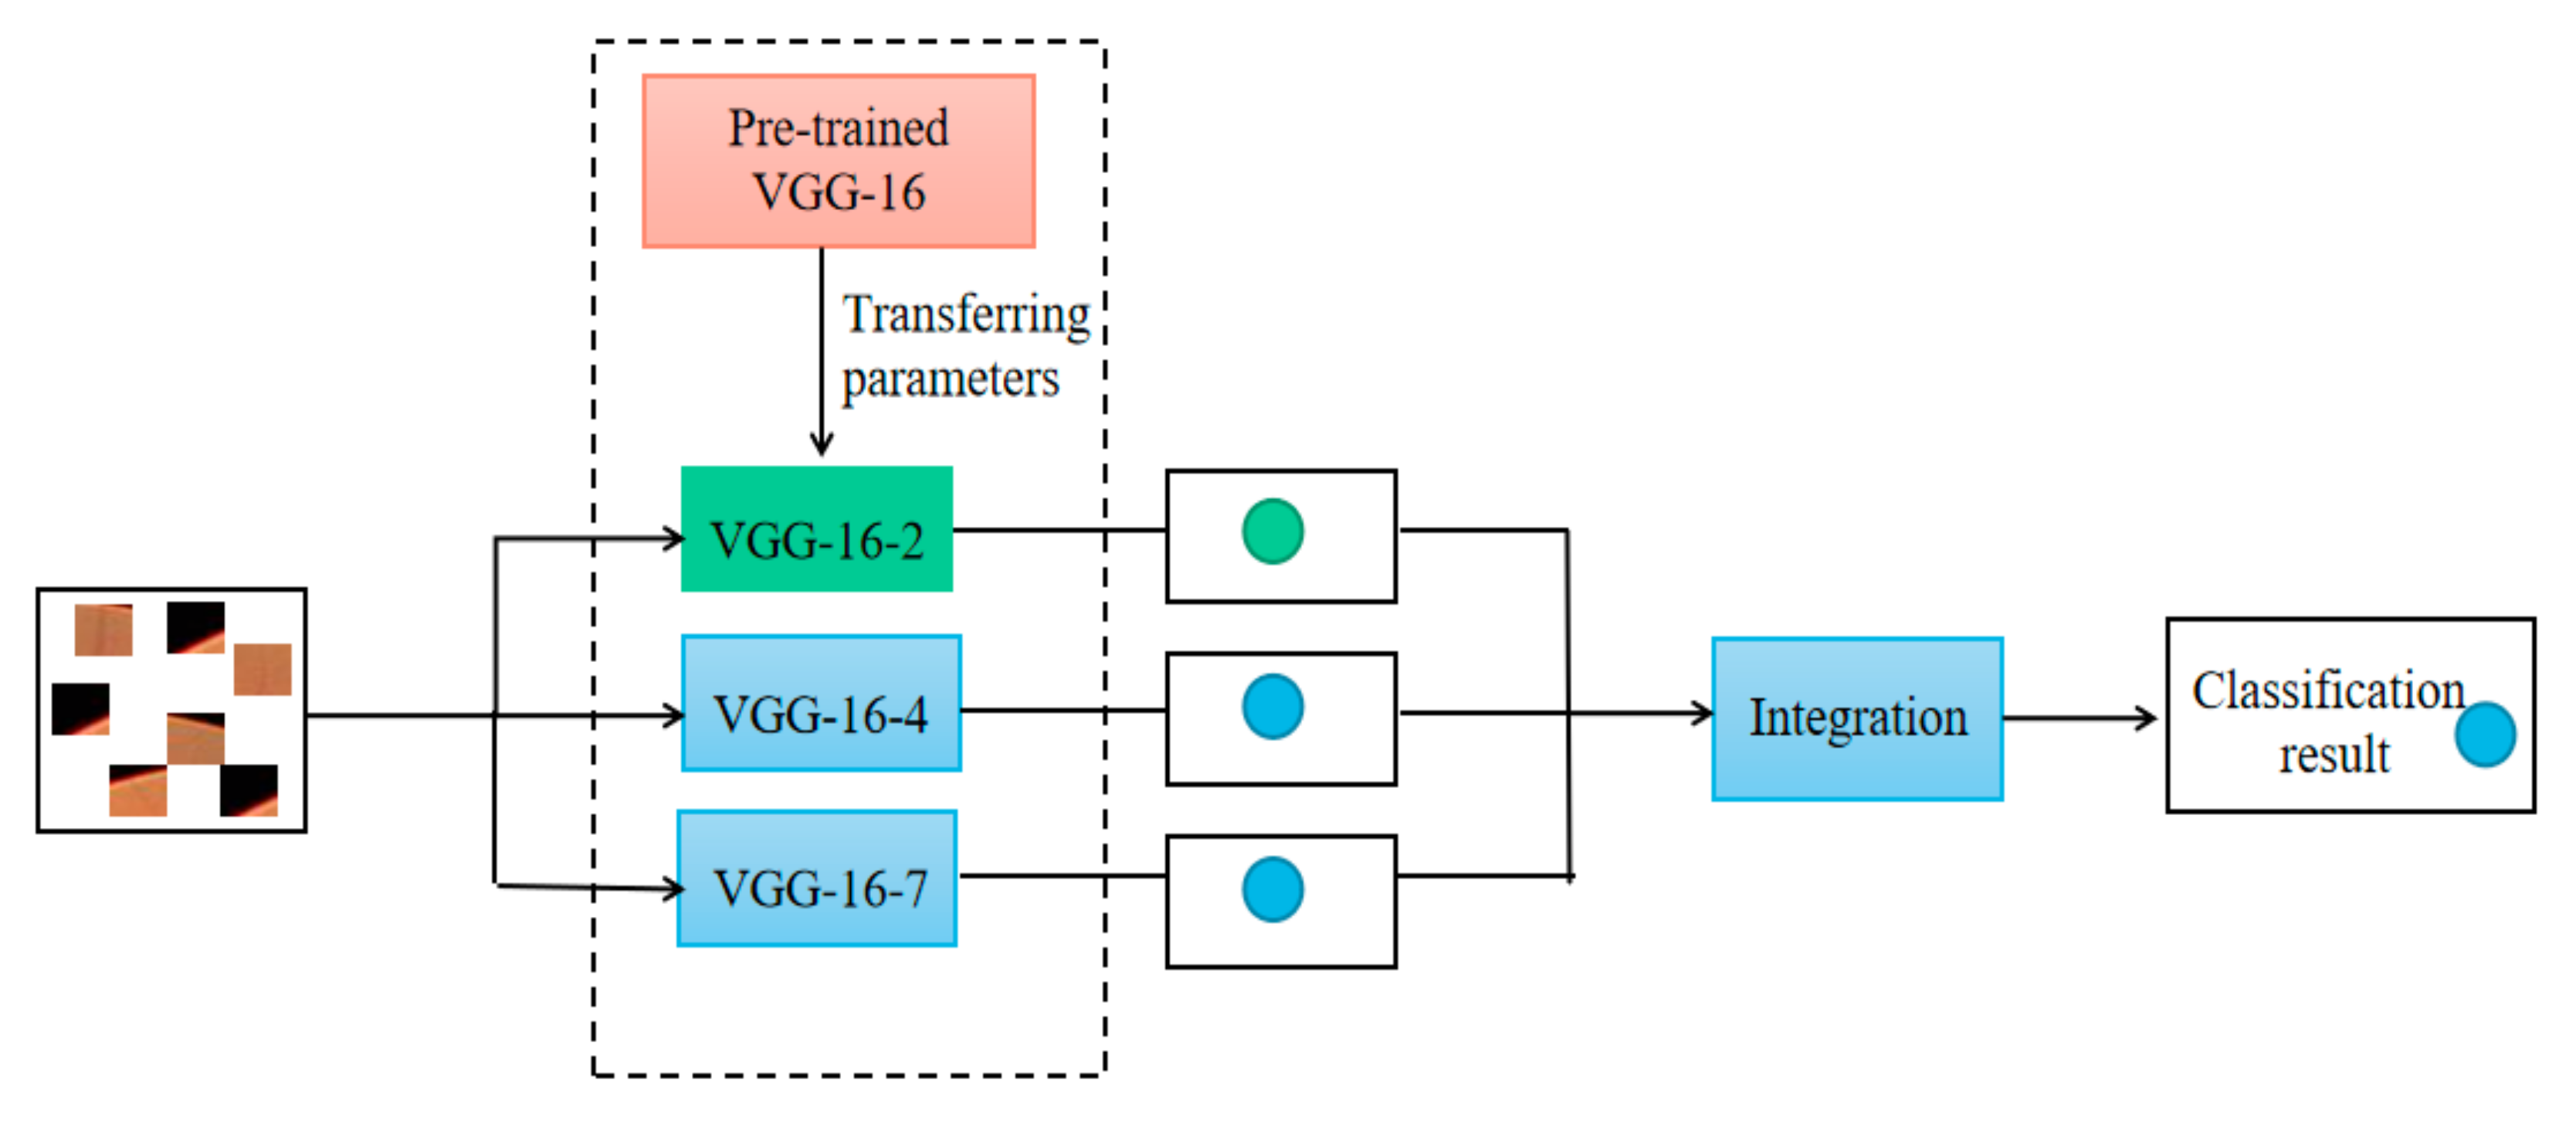
The integrated model includes three different networks, VGG-16-2, VGG-16-4 and VGG-16-7, which are shown in Figure 4. The final classification result is determined by the multiple networks integration, as shown in Equation (2):
y = 1 , i = 1 n y i n 2 0 , i = 1 n y i < n 2
In Equation (2), y represents the final classification result, y i represents the classification result of each network classifier, and n represents the number of network classifiers. When the sum of the classification results of multiple network classifiers is greater than or equal to n / 2 , the final classification result is 1, which represents the blood vessel pixel point. In contrast, it is the background pixel point. The schematic diagram of multi-network integration is shown in Figure 4.

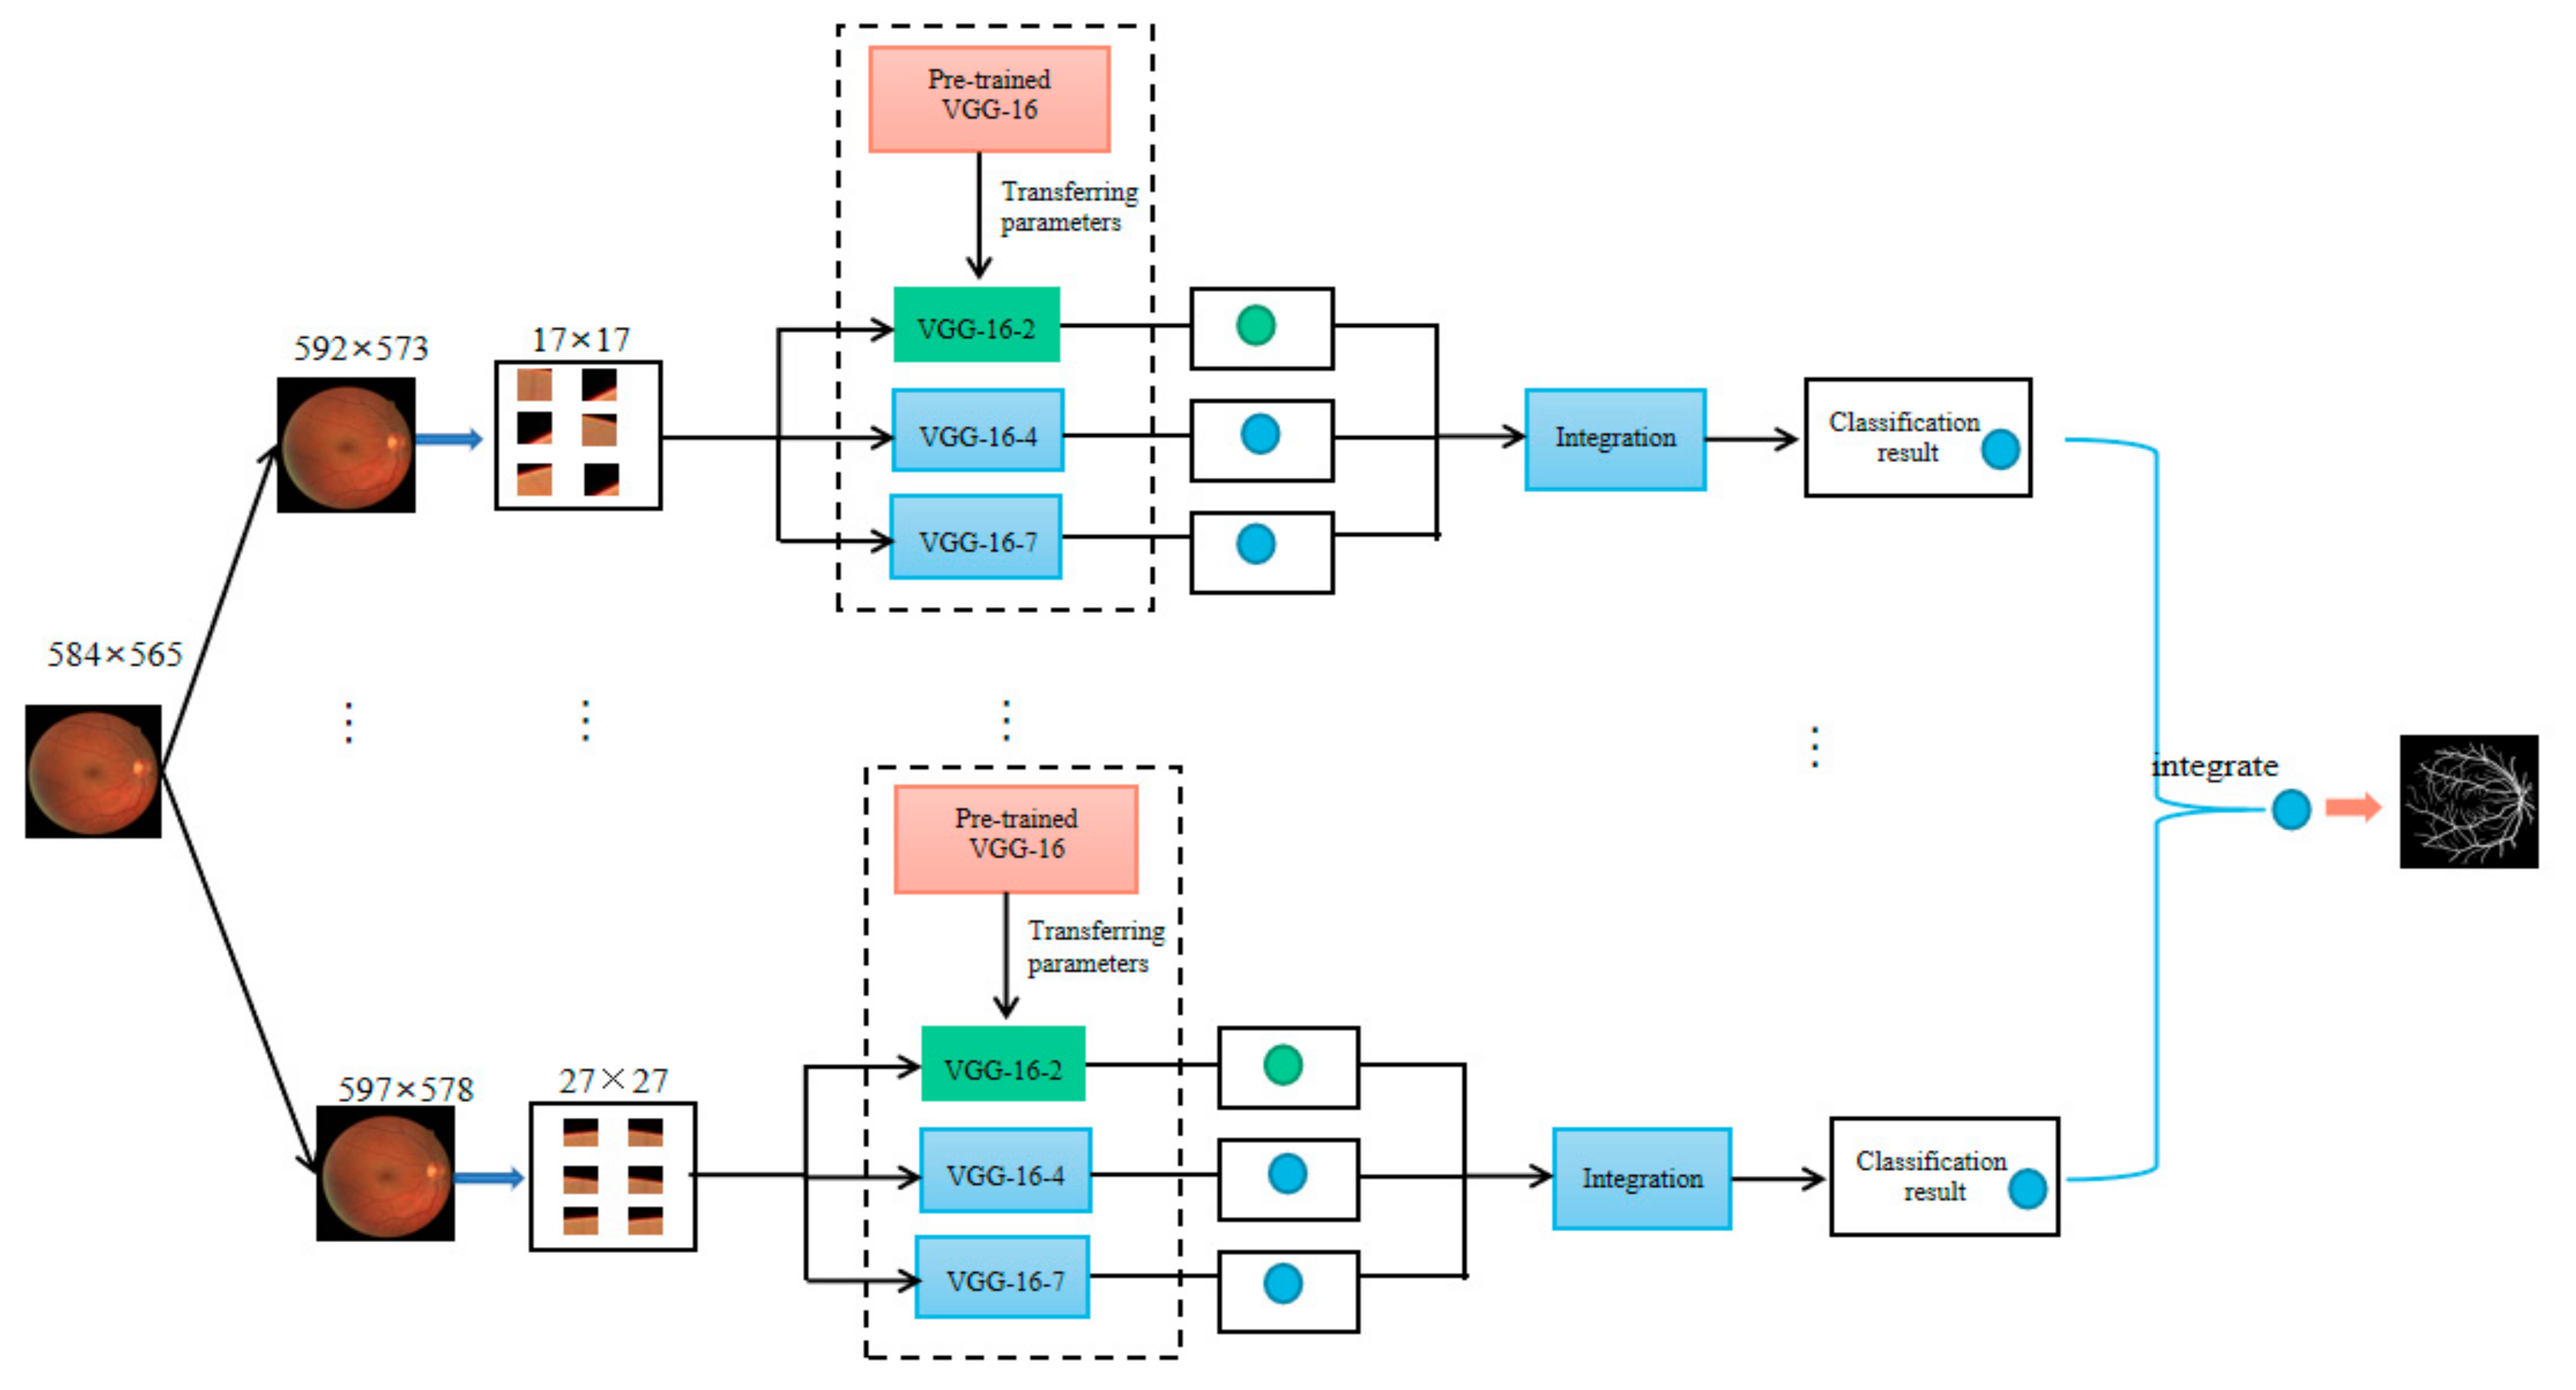
2.2.2. Multiple and Multi-Scale Networks Integration

In order to extract features with different sizes, the input blocks can be with different sizes. If each pixel is denoted by the corresponding image blocks with different sizes, the pixel can have different features in the same nodes of the same layer in the same neural network. For this reason, we use groups of image blocks with different sizes as the network input for obtaining different features. The structure of the multiple and multi-scale network integration model is shown in Figure 5.

2.2.3. Knowledge Transfer

A transfer learning algorithm is usually used to decrease the network training. VGG-16 network is designed to process the ImageNet classification dataset and obtain an effective result. Through VGG-16 network trained by ImageNet, retinal blood vessel images are finetuned, which can be easily achieved by the effective network model after short training.
In order to reduce the training time, the method of transfer learning is adopted and the parameters of convolutional layers of VGG-16 pre-trained by the ImageNet dataset are used. The retinal blood vessel images are used for finetuning the CNN models with 10 iterations to get the testing result.

3. Experiments and Analysis

3.1. Datasets

To verify the effectiveness of the proposed method, two open fundus retinal datasets are used in the experiments, the details of the datasets are shown as follows.
DRIVE [26]: The Digital Retinal Images for Vessel Extraction (DRIVE) dataset was published in 2013 from a diabetic retinopathy screening program in the Netherlands. The screening population was 400 diabetic subjects aged 25–90 years. Forty images were randomly selected, 33 photos had no signs of diabetic retinopathy and 7 photos showed signs of mild early diabetic retinopathy, the size of each image is 584 × 565.
CHASE_DB1 [27]: The Child Health and Heart Studies in England (CHASE_DB1) contains images of different diseases in which retinal images along with ground truth vessel can be found in the first database entitled CHASE_DB1. It includes 28 retinal images taken from the eyes of 14 school children. Typical 20 images are used for training and 8 for testing, the size of each image is 999 × 960.

3.2. Experimental Setup

3.2.1. The Hardware Setup

The code runs on a computer with Intel(R) Core i9-10900K CPU 3.70 GHz and NVIDIA GeForce RTX 2080Ti.

3.2.2. The Software Settings

The code runs in the Ubuntu environment, the ubuntu version is ubuntu 9.3.0-17ubuntu1-20.04, the Linux kernel version is Linux version 5.8.0-40-generic (buildd@lcy01-am64-014), the Gcc compiler version number is Gcc 9.3.0.

3.2.3. Experimental Parameters

The model uses Adaptive Moment Estimation (Adam) as the overall optimization and cross-entropy as the loss function. The initial learning rate is set to 0.01, the epochs of the training model is set to 10, and the batch size is set to 2260.

3.3. Experiment Indicators

In order to accurately evaluate the experimental results, the following important indicators were used in this paper, including Sensitive (SE), Specificity (SP) and Accuracy (Acc), and the calculation formulas are shown as follows:
S E = | T P | | T P + F N |
S P = | T N | | T N + F P |
A c c = | T P + T N | | T P + T N + F P + F N |
TP, FP, TN and FN represent true positive, false positive, true negative and false negative, respectively. SE represents true positive rate and SP represents true negative rate. In this paper, TP represents the vascular pixels predicted by the model as blood vessels, and FP represents the vascular pixels predicted by the model as background. TN represents the background pixel predicted by the model as the background, and FP represents the background pixel predicted by the model as the blood vessel [28].
SE represents the ratio of the number of correctly predicted vascular pixels to the number of total vascular pixels, which is the probability of correctly predicting vascular pixels.
SP represents the ratio between the number of correctly predicted background pixels and the total number of background pixels, which is the probability of correctly predicting background pixels.

3.4. Experimental Results and Analysis

In this section, six experiments on two datasets (DRIVE and CHASE_DB1) demonstrate the effectiveness of the proposed method. In order to ensure the fairness of the experiment, the training epoch of all experiments was 10.

3.4.1. Effectiveness of Knowledge Transfer

In the following two experiments, the network structure of VGG-16-7 is used. The image blocks with a size of 23 × 23 were extracted from the DVIRE dataset, and the image blocks with a size of 31 × 31 were extracted from the CHASE dataset. On the DRIVE dataset, three experiments were used to verify the effectiveness of transfer learning. Firstly, the random initial model is used for training and testing, and the experimental results are obtained. Secondly, using the transfer parameters to initialize the model, we remain the transfer parameters of the convolution layer and only the finetuning parameter of the classifier. Finally, the transferring parameters are used to initialize the model and finetune the whole model. The same operation is used for CHASE_DB1. The experimental results in Dataset 1 and Dataset 2 are shown in Table 2 and Table 3.
In Table 2, when knowledge transfer was used and the whole model was fine-tuned, Acc and SE reached the highest values, 96.58% and 79.35% respectively, which were increased by 0.06% and 2.92% compared with the random initial model. According to the data on the DRIVE dataset, Acc and SE of the whole model using knowledge transfer and finetuning are higher than those of the random initial model and using knowledge transfer only in the finetuning classifier.
In Table 3, Acc and SE improved by 0.07% and 2.39%, respectively, when using knowledge transfer and finetuning of the whole model compared with the random initial model. Because the parameters of knowledge transfer are trained, the model after knowledge transfer has the ability to extract features. After finetuning with a dataset of retinal images, the model gains the ability to extract features of retinal blood vessels. Consequently, on the DRIVE and CHASE_DB1 datasets, better results can be achieved when using knowledge transfer and finetuning the whole model.

3.4.2. Effectiveness of Multi-Network Integration

The experiment is used to verify the effectiveness of multiple network integration of VGG-16-7. The size of the image block extracted on the DRIVE dataset is 23 × 23, and the size of the image block extracted on the CHASE_DB1 dataset is 31 × 31. In the case of the same network structure, a single network is used to compare with triple networks integration, the results are shown in Table 4 and Table 5.
According to the data in above tables, the integration of Acc and SE of triple networks is significantly better than in the single network.
In Table 4, the Acc and SE of multi-networks integration are 96.64% and 81.16%, respectively. Compared with a single network, it has increased by 0.06% and 1.81%, respectively.
In Table 5, Acc and SE of triple networks integration increased by 0.01% and 0.27% compared with the single network.
Compared with a single network, multiple networks can extract the features of image blocks more comprehensively and reduce the omission of vascular information. The experimental results on the DRIVE dataset and the CHASE_DB1 dataset confirm the effectiveness of multi-network fusion.

3.4.3. Effectiveness of Multiple Different Networks Integration

This experiment is to verify the effectiveness of multiple different network integration. The size of the extracted image block is 23 × 23 in the DRIVE dataset and 31 × 31 in the CHASE_DB1 dataset. The integration of three different networks is compared with the integration of three identical networks. VGG-16-7 is used for the same network structure. VGG-16-2, VGG-16-4 and VGG-16-7 are used for the three different networks. Experiments in the two datasets of DRIVE and CHASE_DB1 and the results are shown in Table 6 and Table 7.
The integration results of the three identical networks and the three different networks are shown in Table 6 and Table 7. In Table 6, compared with the integration of three identical networks, although the Acc of the three different networks integration remained unchanged, the SE increased by 0.9%.
In Table 7, the Acc and SE of integration of the three different networks, which are 97.25% and 76.84% in the CHASE_DB1 dataset, compared with integration of the three identical networks, ACC and SE increased by 0.14% and 0.88%. Compared with multiple identical networks, different networks with different depths can extract vascular features in different regions, and the features extracted by the same network may be repeated. Therefore, the effect of the integration of multiple different networks is better than the integration of multiple identical networks.

3.4.4. Effectiveness of Multi-Scale Integration

This experiment is used to verify the effectiveness of multi-scale integration. The integration of three identical network is used for comparing with different scales of integration. In order to ensure the fairness of the experiment, each group of experiments uses three VGG-16-7 networks.
In the DRIVE dataset, we used three identical scales with a size of 23 × 23. In another group of experiments, we used three different scales integration, as shown in Table 8. In the CHASE_DB1 dataset, the same scale size is 31 × 31, and the different scales are shown in Table 9. The testing results on the two datasets are shown in Table 10 and Table 11.
In Table 10, Acc is the highest when three different scales are fused, which reaches 96.72%. The Acc of Group 1 compared with the integration of three identical scales, which has increased by 0.08%.
In Table 11, we can get the same conclusion, compared with the integration of three identical scales, Acc increased by 0.13% when the three different scales are fused. Different scale image blocks contain different vascular information, and the features extracted by the network are also different. The model fused the features extracted from three different scale image blocks and achieved better Acc. This experiment proves the effectiveness of multi-scale integration.

3.4.5. Effectiveness of Multiple Multi-Scale Networks Integration

It can be seen from the above that different networks integration is effective compared with the same network integration, different scales integration is effective compared with single scale integration. In this experiment, the effectiveness of multiple multi-scale neural networks will be verified. In the DRIVE and CHASE_DB1 datasets, the corresponding scales in different groups are shown in Table 12 and Table 13. Each scale includes three networks: VGG-16-2, VGG-16-4, and VGG-16-7. The integration results of different networks with single scale and different networks with different multiple scales in two datasets are shown in Table 14 and Table 15.
In Table 14, the Acc and SP reached the highest when the seven scales were fused, which were 96.74% and 98.27%, and the SE reached 81.48%. In Table 15, the Acc, SE, and SP reached the highest values when seven scales were fused, which were 97.38%, 78.22%, and 98.80%, respectively. After multi-scale and multi-network fusion, the model extracts more features, including vascular features in different scales and different regional features in each scale. The test results on two datasets confirm the effectiveness of multi-network and multi-scale.
The contrast between the segmented retinal blood vessel image and the manually segmented retinal blood vessel image is shown in Figure 6, with the progress of the experiment, the noise is constantly reduced, and the retinal vessels in detail are increasingly approaching the ground truth.

3.4.6. Effectiveness of Multi-Scale Multi-Network Integration Based on Transfer Learning

In order to prove the effectiveness of the proposed method in retinal blood vessel segmentation, this paper carried out experiments on two classical retinal image datasets and compared with the current seven most advanced methods, which are shown in Table 16 and Table 17.
It can be seen from Table 16, in the DRIVE dataset, the proposed method has the second-best results, whose Acc achieves 96.74% and SE achieves 81.48%. Compared with the classic U-Net, Acc and SE are improved by 0.32% and 2.33%, respectively. The experiment results prove the effectiveness of the proposed method.
It can be seen from Table 17, in the CHASE_DB1 dataset, the proposed method achieves acceptable results. The ACC achieves 97.38% and the SE achieves 78.22%. Compared with the classical U-Net, the ACC increases by 0.22% and SE increases by 2.05%, which proves the effectiveness of the proposed method. SCS net has achieved good results in retinal blood vessel segmentation, but the model proposed in this paper provides a new idea for retinal image segmentation. It can segment blood vessels more accurately by obtaining multi-scale information of different regions, and experiments show that this idea is effective.

4. Discussion

4.1. The Influence of Image Block Size

When image blocks are extracted according to pixel points in fundus retinal images, the sizes of image blocks affect the effect of vascular segmentation. In order to obtain the optimal image block size, we organized experiments in the DRIVE and CHASE_DB1 datasets, whose sizes of extracted image blocks ranged from 9 × 9 to 37 × 37. The experimental results are shown in Figure 7.
It can be seen from the Figure 7, when the results with the sizes of the extracted image block increases, the segmentation effect of retinal blood vessels increases first and then decreases. In the DRIVE dataset, when the size of the extracted image block is 23 × 23, the Acc is highest, reaching 96.63%, SE reached 82.06%. In the CHASE_DB1 dataset, when the extracted image block size is 31 × 31, Acc is highest, reaching 97.25%, and SE reaching 76.84%.
Therefore, the optimal sizes of the image blocks extracted from DRIVE and CHASE_DB1 datasets are 23 × 23 and 31 × 31, respectively.

4.2. The Influence of Training Epochs

In deep learning-based methods, the number of training epochs has a great impact on the segmentation results. In order to obtain the best training epochs, this paper carries out experiments in the DRIVE and CHASE_DB1 datasets, and the experimental results are shown in Table 18 and Table 19.
As shown in Table 18 and Table 19, with the increase of epochs, the segmentation accuracy of the model tends to increase first and then decrease. When the training epochs are 10, both Acc and SE of the model achieve the best results. Therefore, the epochs of the experiment are set to 10, which is the optimal training epochs.

5. Conclusions

This paper proposes a multiple multi-scale neural networks knowledge transfer and integration method for accurate pixel-level retinal blood vessel segmentation. It can fuse different retinal features with different scale sizes and different networks and use the knowledge transfer to enhance the segmentation results. Experiments in the DRIVE and CHASE_DB1 datasets were used to verify the effectiveness of the proposed method in retinal vascular segmentation.

Author Contributions

All of the authors made significant contributions to this work. C.D., W.W. and L.Z. devised the approach and analyzed the data; L.Z., Y.Z. and W.W. helped design the experiments and provided advice for the preparation and revision of the work; R.L., Y.C., Z.Z. and D.W. performed the experiments; R.L. and C.D. wrote this manuscript. All authors have read and agreed to the published version of the manuscript.

Funding

This work was supported by the National Natural Science Foundations of China (grant no. 61901369, grant no. 62071387 and grant no. 62101454), the Foundation of National Engineering Laboratory for Integrated Aero-Space-Ground-Ocean Big Data Application Technology (grant no. 20200203) and the National Key Research and Development Project of China (no. 2020AAA0104603).

Institutional Review Board Statement

Not applicable.

Informed Consent Statement

Not applicable.

Data Availability Statement

Acknowledgments

We acknowledge the author for the DRIVE and CHASE_DB1 datasets.

Conflicts of Interest

The authors declare no conflict of interest. The founding sponsors had no role in the design of the study; in the collection, analyses, or interpretation of data; in the writing of the manuscript; and in the decision to publish the results.

References

  1. Kirbas, C. A review of vessel extraction techniques and algorithms. ACM Comput. Surv. (CSUR) 2004, 36, 81–121. [Google Scholar] [CrossRef]
  2. Ding, C.; Xia, Y.; Li, Y. Supervised segmentation of vasculature in retinal images using neural networks. In Proceedings of the 2014 International Conference on Orange Technologies, Xi’an, China, 20–23 September 2014; pp. 49–52. [Google Scholar]
  3. Zhang, X.; Thibault, G.; Decencière, E.; Marcotegui, B.; Laÿ, B.; Danno, R.; Cazuguel, G.; Quellec, G.; Lamard, M.; Massin, P.; et al. Exudate detection in color retinal images for mass screening of diabetic retinopathy. Med. Image Anal. 2014, 18, 1026–1043. [Google Scholar] [CrossRef] [Green Version]
  4. Kushol, R.; Salekin, M.S. Rbvs-Net: A Robust Convolutional Neural Network for Retinal Blood Vessel Segmentation. In Proceedings of the 2020 IEEE International Conference on Image Processing (ICIP), Virtual, 25–28 October 2020; pp. 398–402. [Google Scholar]
  5. Mishra, S.; Chen, D.Z.; Hu, X.S. A Data-Aware Deep Supervised Method for Retinal Vessel Segmentation. In Proceedings of the 2020 IEEE 17th International Symposium on Biomedical Imaging (ISBI), Iowa City, IA, USA, 4 April 2020; pp. 1254–1257. [Google Scholar]
  6. Wang, K.; Zhang, X.; Huang, S.; Wang, Q.; Chen, F. CTF-Net: Retinal Vessel Segmentation via Deep Coarse-To-Fine Supervision Network. In Proceedings of the 2020 IEEE 17th International Symposium on Biomedical Imaging (ISBI), Iowa City, IA, USA, 4 April 2020; pp. 1237–1241. [Google Scholar]
  7. Li, X.; Jiang, Y.; Li, M.; Yin, S. Lightweight Attention Convolutional Neural Network for Retinal Vessel Image Segmentation. IEEE Trans. Ind. Inform. 2021, 17, 1958–1967. [Google Scholar] [CrossRef]
  8. Chaudhuri, S.; Chatterjee, S.; Katz, N. Detection of blood vessels in retinal images using two-dimensional matched filters. IEEE Trans. Med. Imaging 1989, 8, 263–269. [Google Scholar] [CrossRef] [Green Version]
  9. Azzopardi, G.; Strisciuglio, N.; Vento, M.; Petkov, N. Trainable COSFIRE filters for vessel delineation with application to retinal images. Med Image Anal. 2015, 19, 46–57. [Google Scholar] [CrossRef] [Green Version]
  10. Li, Q.; You, J.; Zhang, D. Vessel segmentation and width estimation in retinal images using multiscale production of matched filter responses. Expert Syst. Appl. 2012, 39, 7600–7610. [Google Scholar] [CrossRef]
  11. Roychowdhury, S.; Koozekanani, D.D.; Parhi, K.K. Iterative Vessel Segmentation of Fundus Images. IEEE Trans. Biomed. Eng. 2015, 62, 1738–1749. [Google Scholar] [CrossRef] [PubMed]
  12. Staal, J.; Abramoff, M.D.; Niemeijer, M. Ridge-based vessel segmentation in color images of the retina. IEEE Trans. Med. Imaging 2004, 23, 501–509. [Google Scholar] [CrossRef] [PubMed]
  13. Imani, E.; Javidi, M.; Pourreza, H.R. Improvement of retinal blood vessel detection using morphological component analysis. Comput. Methods Programs Biomed. 2015, 118, 263–279. [Google Scholar] [CrossRef]
  14. Liskowski, P.; Krawiec, K. Segmenting Retinal Blood Vessels with newline Deep Neural Networks. IEEE Trans. Med. Imaging 2016, 35, 2369–2380. [Google Scholar] [CrossRef] [PubMed]
  15. Guo, S.; Wang, K.; Kang, H.; Zhang, Y.; Gao, Y.; Li, T. BTS-DSN: Deeply supervised neural network with short connections for retinal vessel segmentation. Int. J. Med. Inform. 2019, 126, 105–113. [Google Scholar] [CrossRef] [Green Version]
  16. Hajabdollahi, M.; Esfandiarpoor, R.; Najarian, K.; Karimi, N.; Samavi, S.; Reza-Soroushmeh, S. Low Complexity Convolutional Neural Network for Vessel Segmentation in Portable Retinal Diagnostic Devices. In Proceedings of the IEEE International Conference on Image Processing (ICIP), Athens, Greece, 7–10 October 2018; pp. 2785–2789. [Google Scholar]
  17. Wu, H.; Wang, W.; Zhong, J.; Lei, B.; Wen, Z.; Qin, J. SCS-Net: A Scale and Context Sensitive Network for Retinal Vessel Segmentation. Med. Image Anal. 2021, 70, 102025. [Google Scholar] [CrossRef] [PubMed]
  18. Ronneberger, O.; Fischer, P.; Brox, T. U-Net: Convolutional Networks for Biomedical Image Segmentation. In Medical Image Computing and Computer-Assisted Intervention (MICCAI); Springer: Cham, Switzerland, 2015; Volume 9351, pp. 234–241. [Google Scholar]
  19. Wu, Y.; Xia, Y.; Song, Y.; Zhang, D.; Liu, D.; Zhang, C.; Cai, W. Vessel-Net: Retinal Vessel Segmentation Under Multi-path Supervision. In Medical Image Computing and Computer Assisted Intervention (MICCAI); Shen, D., Ed.; Springer: Cham, Switzerland, 2019; Volume 11764, pp. 264–272. [Google Scholar]
  20. Mou, L.; Zhao, Y.; Fu, H.; Liu, Y.; Cheng, J.; Zheng, Y.; Su, P.; Yang, J.; Chen, L.; Frangi, A.F.; et al. CS2-Net: Deep learning segmentation of curvilinear structures in medical imaging. Med. Image Anal. 2020, 67, 101874. [Google Scholar] [CrossRef] [PubMed]
  21. Kwon, H. MedicalGuard: U-Net Model Robust against Adversarially Perturbed Images. Secur. Commun. Netw. 2021, 2021, 5595026. [Google Scholar] [CrossRef]
  22. Fu, Q.; Li, S.; Wang, X. MSCNN-AM: A Multi-Scale Convolutional Neural Network with Attention Mechanisms for Retinal Vessel Segmentation. IEEE Access 2020, 8, 163926–163936. [Google Scholar] [CrossRef]
  23. Wu, T.; Li, L.; Li, J. MSCAN: Multi-scale Channel Attention for Fundus Retinal Vessel Segmentation. In Proceedings of the IEEE 2nd International Conference on Power Data Science (ICPDS), Kunming, China, 12–13 December 2020; pp. 18–27. [Google Scholar]
  24. Simonyan, K.; Zisserman, A. Very Deep Convolutional Networks for Large-Scale Image Recognition. arXiv 2014, arXiv:1409.1556. [Google Scholar]
  25. He, X.; Chen, Y. Transferring CNN Ensemble for Hyperspectral Image Classification. IEEE Geosci. Remote Sens. Lett. 2021, 18, 876–880. [Google Scholar] [CrossRef]
  26. Soomro, T.A.; Afifi, A.J.; Zheng, L.; Soomro, S.; Gao, J.; Hellwich, O.; Paul, M. Deep Learning Models for Retinal Blood Vessels Segmentation: A Review. IEEE Access 2019, 7, 71696–71717. [Google Scholar] [CrossRef]
  27. Imran, A.; Li, J.; Pei, Y.; Yang, J.J.; Wang, Q. Comparative Analysis of Vessel Segmentation Techniques in Retinal Images. IEEE Access 2019, 7, 114862–114887. [Google Scholar] [CrossRef]
  28. Chen, C.; Chuah, J.H.; Ali, R.; Wang, Y. Retinal Vessel Segmentation Using Deep Learning: A Review. IEEE Access 2021, 9, 111985–112004. [Google Scholar] [CrossRef]
  29. Alom, M.Z.; Yakopcic, C. Nuclei Segmentation with Recurrent Residual Convolutional Neural Networks based U-Net (R2U-Net). In Proceedings of the IEEE National Aerospace and Electronics Conference, Dayton, OH, USA, 23–26 July 2018; pp. 228–233. [Google Scholar]
  30. Schlemper, J.; Oktay, O.; Schaap, M.; Heinrich, M.; Kainz, B.; Glocker, B.; Rueckert, D. Attention gated networks: Learning to leverage salient regions in medical images. Med. Image Anal. 2019, 53, 197–207. [Google Scholar] [CrossRef] [PubMed]
  31. Gu, Z.; Cheng, J.; Fu, H.; Zhou, K.; Hao, H.; Zhao, Y.; Zhang, T.; Gao, S.; Liu, J. CE-Net: Context Encoder Network for 2D Medical Image Segmentation. IEEE Trans. Med. Imaging 2019, 38, 2281–2292. [Google Scholar] [CrossRef] [PubMed] [Green Version]
  32. Li, L.; Verma, M.; Nakashima, Y.; Nagahara, H.; Kawasaki, R. IterNet: Retinal Image Segmentation Utilizing Structural Redundancy in Vessel Networks. In Proceedings of the IEEE Winter Conference on Applications of Computer Vision (WACV), Snowmass Village, CO, USA, 1–5 March 2020; pp. 3645–3654. [Google Scholar]
  33. Wu, Y.; Xia, Y.; Song, Y.; Zhang, Y.; Cai, W. NFN+: A novel network followed network for retinal vessel segmentation. Neural Netw. 2020, 126, 153–162. [Google Scholar] [CrossRef] [PubMed]
Figure 1. The schematic diagram structure of VGG-16-2.
Applsci 11 11907 g001
Figure 2. The schematic diagram structure of VGG-16-4.
Applsci 11 11907 g002
Figure 3. The schematic diagram structure of VGG-16-7.
Applsci 11 11907 g003
Figure 4. The schematic diagram of multi-network integration.
Applsci 11 11907 g004
Figure 5. The structure of multiple and multi-scale networks integration.
Applsci 11 11907 g005
Figure 6. Experimental results of different methods in the DRIVE dataset: (a) random initialization; (b) finetuning classifier; (c) finetuning whole network; (d) three identical networks integration; (d) three different networks integration; (e) integration of multiple networks with three scales; (f) integration of multiple networks with five scales; (g) integration of multiple networks with seven scales; (h) ground truth.
Applsci 11 11907 g006
Figure 7. The influence of the image block size in the segmentation effect in the DRIVE and CHASE_DB1 datasets. (a) The influence of image block scale in Acc in the DRIVE dataset; (b) the influence of image block scale in Acc in the CHASE_DB1 dataset; (c) the influence of image block scale in SE in the DRIVE dataset; (d) the influence of image block scale in SE in the CHASE dataset; (e) the influence of image block scale in SP in the DRIVE dataset; (f) the influence of image block scale in SP in the CHASE_DB1 dataset.
Applsci 11 11907 g007
Table 1. The details of structures of VGG-16-2, VGG-16-4 and VGG-16-7.
Network Configuration
VGG-16-2VGG-16-4VGG-16-7
7 weight layers9 weight layers12 weight layers
Input (n × n RGB image)
Conv3-64Conv3-64Conv3-64
maxpool
Conv3-128Conv3-128
Conv3-128Conv3-128
maxpool
Conv3-256
Conv3-256
Conv3-256
maxpool
FC-1024
FC-4096
FC-1024
FC-256
FC-2
Table 2. The parameters for finetuning the whole network are compared with the parameters of the random initialization and finetuning classifier in the DRIVE dataset.
ModelAcc (%)SE (%)SP (%)
Random initialization96.5276.4398.47
Finetuning classifier96.5673.6998.80
Finetuning whole network96.5879.3598.27
Table 3. The parameters for finetuning the whole network are compared with the parameters of the random initialization and finetuning classifier in the CHASE_DB1 dataset.
ModelAcc (%)SE (%)SP (%)
Random initialization97.0373.3098.76
Finetuning classifier97.0775.1798.66
Finetuning whole network97.1075.6998.74
Table 4. Single network is compared with triple networks integration on DRIVE dataset.
ModelAcc (%)SE (%)SP (%)
Single network96.5879.3598.27
Triple networks96.6481.1698.17
Table 5. Single network is compared with triple networks integration on CHASE_DB1 dataset.
ModelAcc (%)SE (%)SP (%)
Single network97.1075.6998.74
Triple networks97.1175.9698.72
Table 6. Integration of three identical networks is compared with the integration of three different networks on the DRIVE dataset.
ModelAcc (%)SE (%)SP (%)
The same nets96.6481.1698.17
Three different nets96.6482.0698.06
Table 7. Integration of three identical networks is compared with the integration of three different networks on the CHASE_DB1 dataset.
ModelAcc (%)SE (%)SP (%)
The same nets97.1175.9698.74
Three different nets97.2576.8498.76
Table 8. The corresponding scales with different experimental groups in the DRIVE dataset.
GroupScales
Group123 × 23
Group221 × 21, 23 × 23, 25 × 25
Table 9. The corresponding scales with different experimental groups in the CHASE_DB1 dataset.
GroupScales
Group131 × 31
Group229 × 29, 31 × 31, 33 × 33
Table 10. Different scales integration is compared with the same scale integration in the DRIVE dataset.
ModelAcc (%)SE (%)SP (%)
Group196.6481.1698.23
Group296.7279.2898.45
Table 11. Different scales integration is compared with the same scale integration in the CHASE_DB1 dataset.
ModelAcc (%)SE (%)SP (%)
Group197.1175.9698.74
Group297.2475.3498.97
Table 12. The corresponding scales with different experimental groups in the DRIVE dataset.
GroupScales
Group123 × 23
Group221 × 21, 23 × 23, 25 × 25
Group319 × 19, 21 × 21, 23 × 23, 25 × 25, 27 × 27
Group417 × 17, 19 × 19, 21 × 21, 23 × 23, 25 × 25, 27 × 27, 29 × 29
Table 13. The corresponding scales with different experimental groups in the CHASE_DB1 dataset.
GroupScales
Group131 × 31
Group229 × 29, 31 × 31, 33 × 33
Group327 × 27, 29 × 29,31 × 31, 33 × 33, 35 × 35
Group425 × 25, 27 × 27, 29 × 29, 31 × 31, 33 × 33, 35 × 35, 37 × 37
Table 14. The testing results of different multi-scale integration in the DRIVE dataset.
ModelAcc (%)SE (%)SP (%)
Group196.6482.0698.06
Group296.7279.2898.23
Group396.6982.0998.12
Group496.7481.4898.27
Table 15. The testing results of different multi-scale integration in the CHASE_DB1 dataset.
ModelAcc (%)SE (%)SP (%)
Group197.2576.8498.76
Group296.9677.2498.36
Group397.3477.7898.78
Group497.3878.2298.80
Table 16. The result of proposed method compared with the other methods in the DRIVE dataset.
DatasetsMethodsAcc (%)SE (%)SP (%)
U-Net [18]96.4079.1598.08
R2U-Net [29]96.5479.2398.03
Attu-Net [30]96.4978.8298.48
DRIVECE-Net [31]96.5980.1598.16
IterNet [32]96.5779.9598.26
NFN+ [33]96.6880.0297.90
SCS-Net [17]96.9782.8998.38
Ours96.7481.4898.27
Table 17. The result of proposed method compared with the other methods in the CHASE_DB1 dataset.
DatasetsMethodsAcc (%)SE (%)SP (%)
U-Net [18]97.1676.1798.61
R2U-Net [29]97.2181.4598.40
Attu-Net [30]97.2677.2198.50
CHASE_DB1CE-Net [31]97.2380.4298.39
IterNet [32]97.3179.9798.47
NFN+ [33]97.3579.3398.55
SCS-Net [17]97.4483.6598.39
Ours97.3878.2298.80
Table 18. The influence of training epochs in the DRIVE dataset.
EpochsAcc (%)SE (%)SP (%)
196.3475.5798.30
1096.4378.0098.23
2096.3476.6298.26
3096.3177.6398.14
4096.2975.8698.28
5096.3276.2798.28
6096.30 77.1198.17
7096.30 76.2798.25
8096.3176.6696.23
9096.3176.1798.28
10096.3575.6198.37
Table 19. The influence of training epochs in the CHASE_DB1 dataset.
EpochsAcc (%)SE (%)SP (%)
197.0575.0898.73
1097.0875.4398.69
2097.0673.5898.81
3097.0674.1298.76
4097.0774.3398.76
5097.0673.4798.81
6097.0475.1298.68
7097.0373.5198.79
8097.0874.0598.79
9097.0474.2398.80
10097.0773.0998.88
Publisher’s Note: MDPI stays neutral with regard to jurisdictional claims in published maps and institutional affiliations.

