1. Introduction
For the analysis of the bearing capacity of foundations, several procedures have been developed: the limit equilibrium method [
1,
2], the characteristic line method [
3], the limit analysis method [
4,
5], the kinematical approach (as a part of limit analyses) [
6], the numerical method [
7,
8,
9] and artificial intelligence techniques [
10,
11].
Each method adopts a series of hypotheses and failure criterion; currently, the most used is the non-linear method proposed by Hoek and Brown (in its original 1980 version [
12], and modified versions from 1997 [
13] and 2002 [
14]), which is applicable for a rock mass with homogeneous and isotropic behavior, meaning that through the inexistence or the abundance of discontinuities, they have the same physical properties present in all directions.
Traditional formulations of the bearing capacity are based on the Mohr–Coulomb parameters (cohesion and friction angle). The usual practice in rock mechanics is to obtain the equivalent Mohr–Coulomb parameters from the non-linear Hoek and Brown failure criterion according to the stress level of the rock mass. Thus, for example, some Mohr–Coulomb based approaches considered to be non-associative flow rules [
6].
The flow law (also called flow rule) is not an intrinsic hypothesis, neither in the Hoek and Brown failure criterion nor in the Mohr–Coulomb approach; it should be adopted for the method chosen for the estimation of bearing capacity.
The associativity of the plastic deformation of the soil has a significant influence on the result of the bearing capacity. Michalowski [
6] and Drescher and Detournay [
15] studied this effect in soils with the Mohr–Coulomb criterion, concluding that these differences become very substantial for large friction angle values and the bearing capacity results are significantly reduced with decreases in the angle of dilatancy. In this way, it is necessary to consider the influence of the non-associative flow rule especially for rocks, where high values of the instantaneous friction angle are expected. In this regard, works such as those by Chwala and Kawa [
16] consider the influence of dilatancy in their specific studies applied to rock mechanics.
In the past thirty years, some analytical methods were developed to estimate the bearing capacity of rock masses based on the parameters that define the non-linear failure criterion. The analytical method that solves the internal equilibrium equations combined with the failure criterion was proposed by Serrano and Olalla [
17] and Serrano et al. [
18,
19] by applying the Hoek and Brown [
12] and the modified Hoek and Brown failure criterion [
13], respectively. The method was based on the characteristic line method [
3], adopting the plane strain hypothesis, the associative flow law, the coaxiality, the perfectly plastic yield surface and the weightless rock mass.
Other formulations proposed for the estimation of the bearing capacity on rock masses, such as [
8,
20,
21], recommended by AASHTO [
22], and those presented in the regulations outlined in The Canadian Foundation Engineering Manual [
23] and Eurocode 7 [
24], do not define the flow law that is adopted.
Recent studies have focused on the Hoek and Brown criteria, and the associated flow law is usually presented [
25,
26]. The use of numerical methods and the progress of computational geomechanics have allowed access to the practical calculation of more sophisticated bearing capacity problems, involving anisotropic rock masses [
27], and the shape of the foundation [
28,
29] or the bilayer rock under the footing [
30].
Concerning the influence of the flow law on the bearing capacity, no technical literature was found that quantifies how it conditions the bearing capacity of the rock mass. In general, in everyday practice, the dilatancy is usually not taken into consideration in rock engineering. The papers related to the influence of the dilatancy angle or the flow law on the rock mass engineering problems are mainly focused on the slope stability analysis and tunneling.
Considering that the mechanical behavior of the rock masses is non-linear, Detournay [
31] claimed that the assumption of a constant dilatancy angle is believed to be unrealistic because the dilation should be a function of the plastic strain (damage) and the confining stress.
Thus, the definition of the value of the dilatancy angle is very complex, and the adoption of the null dilatancy (ψ = 0°) or the associative flow rule (ψ = φ) is common on both soils and rocks. The adoption of the null dilatancy in some cases underestimates, but never overestimates, the bearing capacity of the rock mass, so this option is on the conservative side.
Authors such as Hoek and Brown [
13], and Vermeer and de Borst [
32], claim that the associative flow rule overestimates the strength of the rock mass; the value of the dilatancy angle recommended by these authors is much lower than the instantaneous friction angle.
According to [
32], the soil mechanics concept of a dilatancy angle is useful for concrete and rock, and the dilatancy angle is at least 20° less than the internal friction angle (
φ). Hoek and Brown [
13] proposed correlations depending on the overall geotechnical quality of the rock mass (geological strength index,
GSI): (a)
ψ =
φ/4 for very good quality hard rock mass (
GSI = 75) that presents an elastic-brittle behavior; (b)
ψ =
φ/8 for average quality rock mass (
GSI = 50), considering the behavior as strain softening; (c)
ψ = 0° for very poor quality rock mass (
GSI = 25) that behaves perfectly plastically.
In the field of tunnels, Alejano and Alonso [
33] proposed a method for the estimation of the variation of the dilatancy angle, depending on the stress state, in a way that allows a better adjustment of the tunnel support (shotcrete and reinforcement) and the estimation of deformations during underground excavations.
In [
34], convergence curves were developed for circular tunnels subjected to hydrostatic pressures based on the theory of plasticity. The solution is valid for any failure criterion and for any plastic flow law, considering that the dilatancy varies from one point to another in the plastic area as the result of being the function of failure stresses and the instantaneous friction angle.
Rahjoo and Eberhardt [
35], also focusing on support design, proposed an empirical dilation model, based on the dilation model of Zhao and Cai [
36], as a function of the loading history and confinement of the rock mass.
Melentijevic et al. [
37] emphasized that the hypothesis of the associative flow law is broadly accepted in applications related to slope stability analysis, resulting in values of the safety factor that are evidently higher than the values obtained under the assumption of the non-associative flow law.
For this paper, the upper and lower limits of the bearing capacity in terms of the function of the flow law are estimated by numerical analysis through the finite difference method, employing the FLAC commercial code (Version 7, Itasca) [
38]. The correction factor (
DF) is defined to estimate the decrease in the bearing capacity due to the adoption of the non-associative flow rule with null dilatancy under the assumptions of a weightless rock mass.
This factor can be applied to the bearing capacity value obtained by analytical formulation, as exemplified in the work of Serrano et al. [
18], which adopts the hypothesis of the associative flow rule. Using this factor, the value of the bearing capacity with the non-associative flow rule with null dilatancy can be estimated in a semi-analytical way.
The influence of the flow rule on the bearing capacity, taking into account the self-weight of the rock mass, is presented as well. Finally, an example is included to show the application of proposed formulation.
2. Numerical Analysis
The numerical analysis was developed by the finite difference method, using FLAC v.7 [
38]. In the finite differences method, every derivative in the set of governing equations is directly replaced by an algebraic expression written in terms of the field variables (stress or displacement) at discrete points in space; these variables are undefined within elements. Using the approach by Wilkins [
39], boundaries can be of any shape, and any element can have any property value.
FLAC uses an explicit time-marching method to solve the algebraic equations. Although a static solution is needed, the dynamic equations of motion are included in the formulation. Because of instability in the physical system model, this approach is used to make the numerical scheme stable: physical instability can be present with nonlinear materials. In contrast, schemes without inertial terms must use some numerical procedure to treat physical instabilities. This procedure starts with the equations of motion to derive new velocities and displacements from stresses and forces. Then, the strain rates are derived from velocities and new stresses are derived from the strain rates.
The numerical implementation of the Hoek–Brown model uses a linear approximation, whereby the nonlinear failure surface is continuously approximated by the Mohr–Coulomb tangent at the current stress level indicated by the minor main stress. The use of tangent linear approximation in geotechnical software is usually considered to be independent of the numerical method adopted for the calculation. However, its use could be the main limitation in terms of obtaining adequate numerical solutions when the failure criterion curve is very steep. Thus, in cases of rock masses of low geomechanical quality (low GSI), the Hoek and Brown criteria estimate a very low tensile strength, close to zero. Furthermore, the failure criterion always responds with a steeper slope in the vicinity of the origin for higher values of the parameter mi. This means that in the absence of load (a weightless rock mass or a rock mass without external overload in the boundary adjacent to the foundation), the slopes of the failure criterion are close to 90° and are very sensitive to stress variations and, therefore, highly unstable. In particular, among the calculation cases that were performed in this research, for values of GSI = 10 and mi = 32, at times, the unbalanced force was extremely high and the calculation did not converge to a valid result.
Several numerical calculations were developed involving the application of the finite difference method to define and quantify the influence of the application of different flow laws on the estimation of the bearing capacity. A total of 192 cases were analyzed, resulting from the combination of four influential parameters (rock type (
mi), foundation width (
B), uniaxial compressive strength of the rock (
UCS) and geological strength index (
GSI)). With the values given in
Table 1, a wide variety of types and states of rock masses are covered. The widths were varied between 4.5 and 22 m in an attempt to represent foundation widths in bridges, and dams or foundation slabs in high buildings, where the bearing capacity of a rock can be restrictive.
Theses 192 cases were studied using the hypothesis described in
Table 2. The flow law (associative and non-associative with null dilatancy angle) was varied and the self-weight of the rock mass was also considered, assuming a weightless rock mass or adopting the unit weight of 26 kN/m
3 up to a total of 768 calculation models. In all cases, a plane strain model and perfectly rough interface were used.
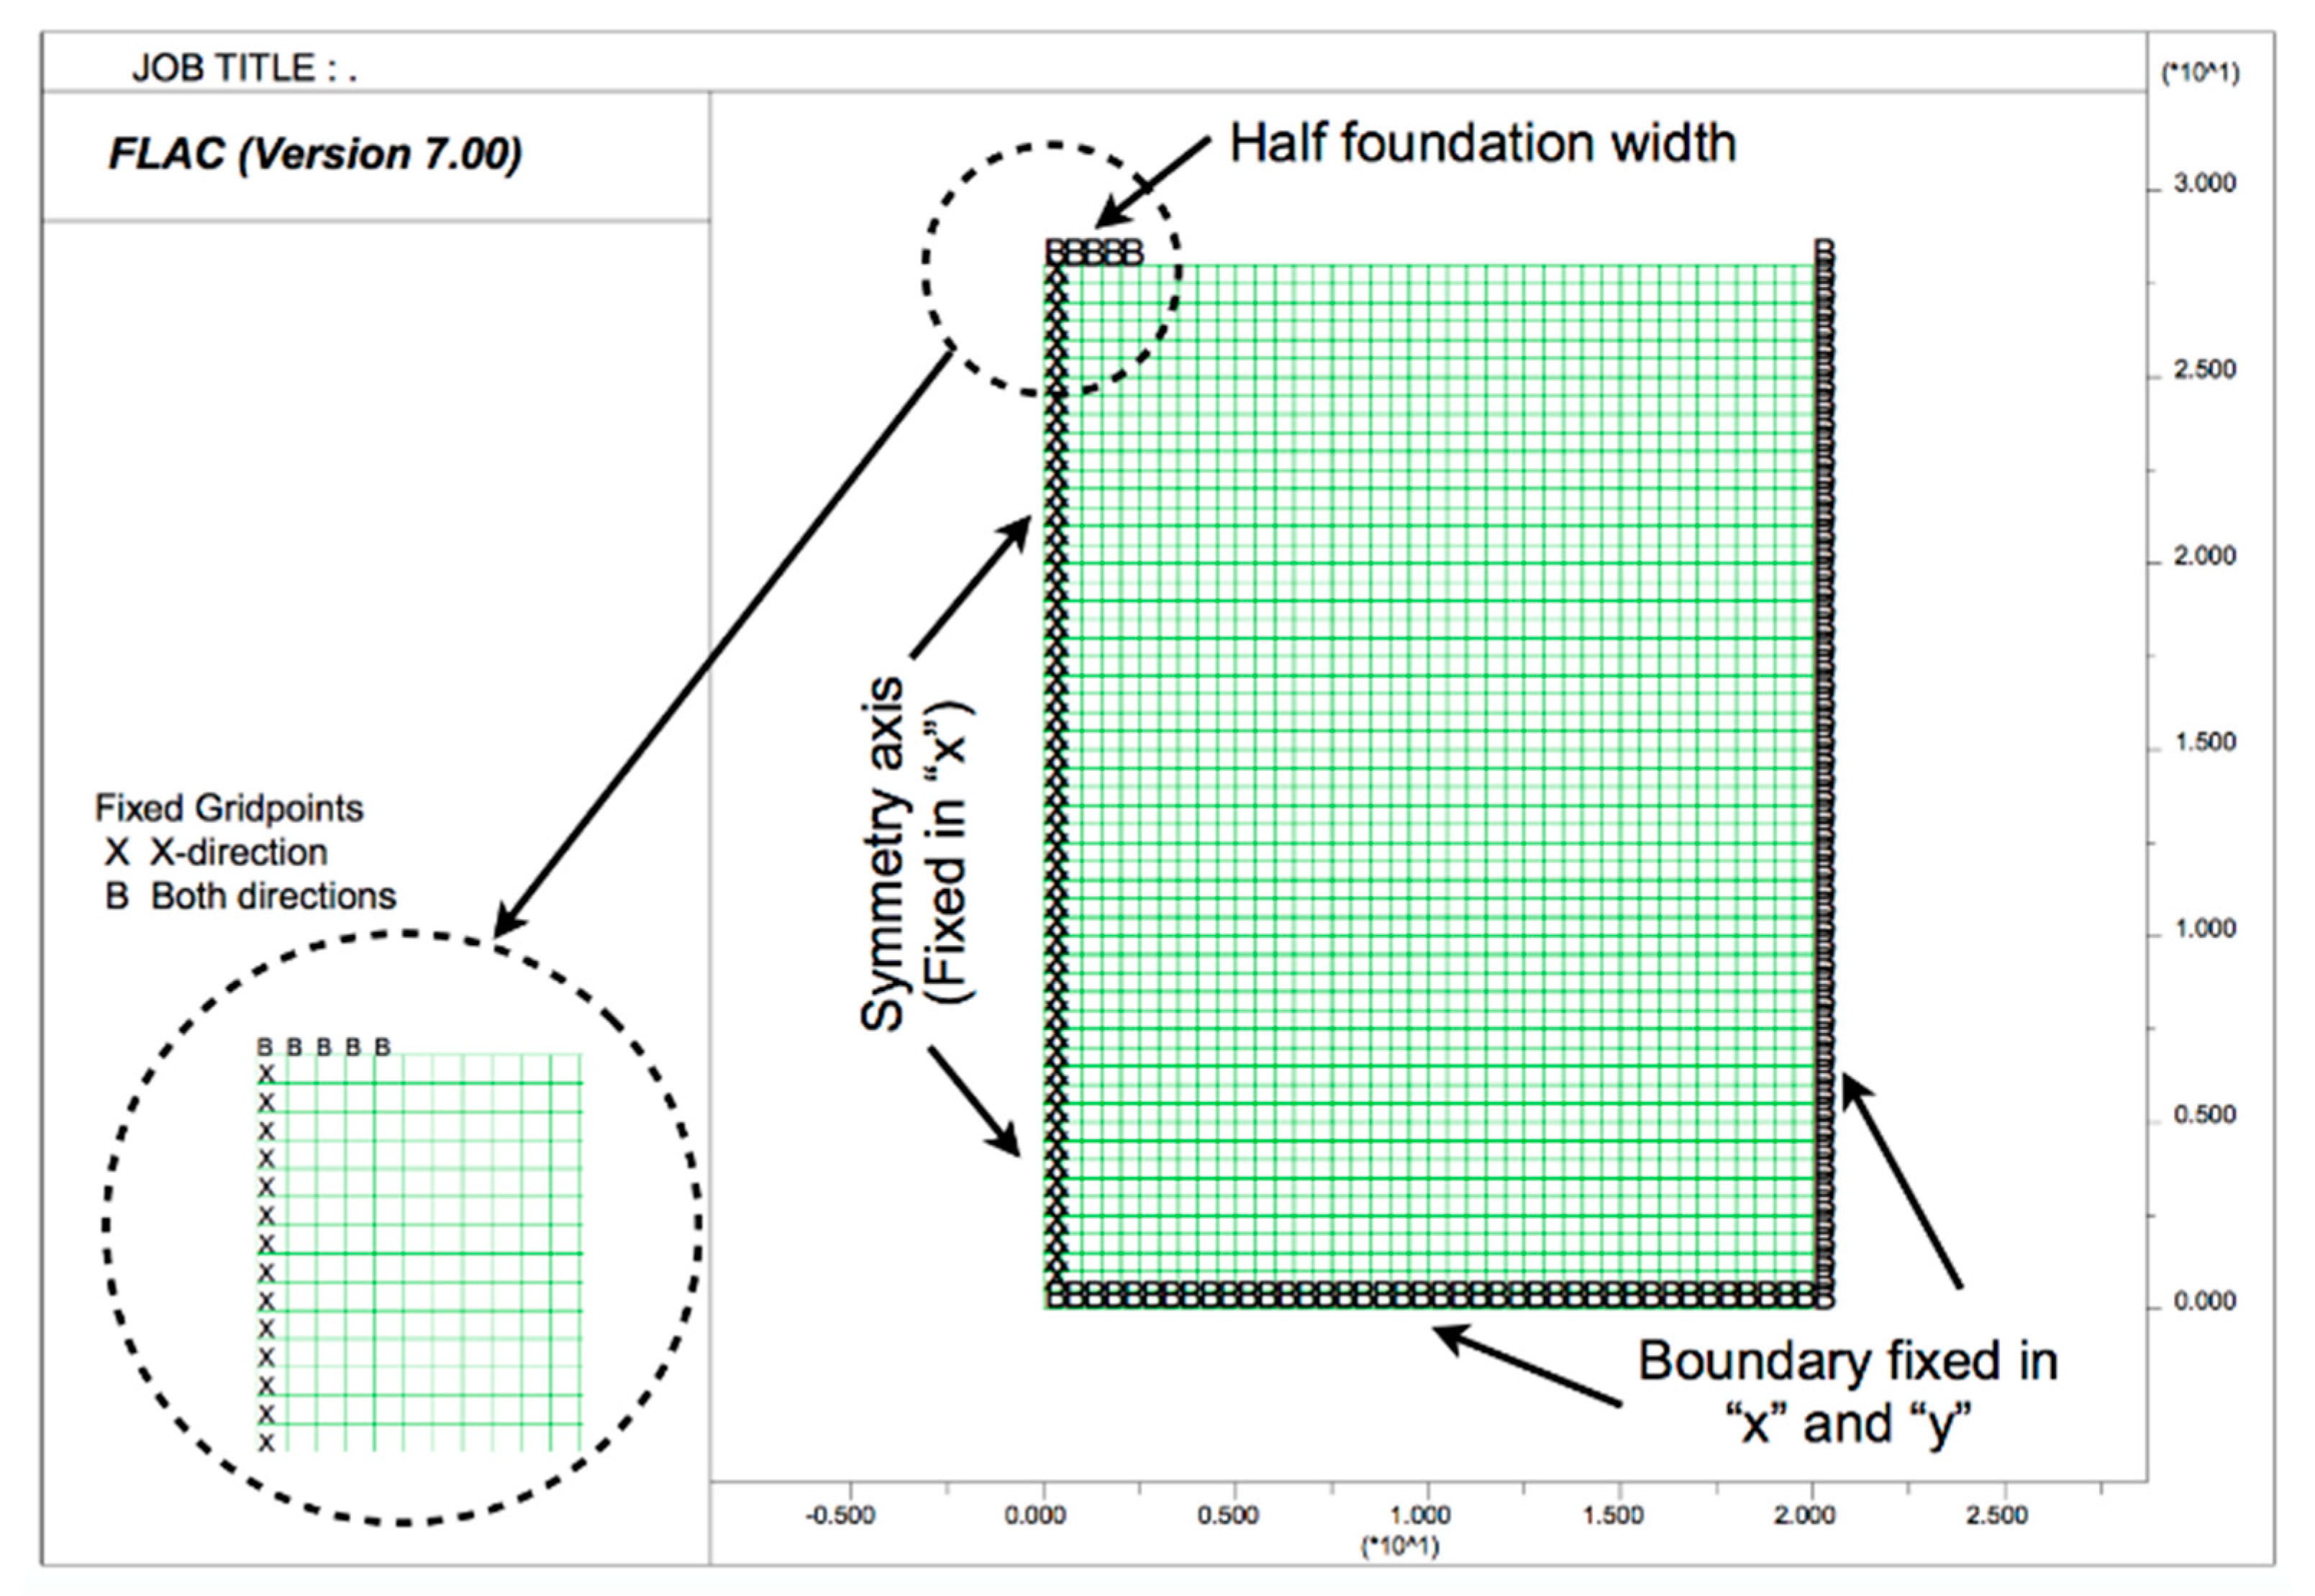
A symmetrical model was used, where only half of the strip footing was represented, and the boundaries of the model were located at a distance that did not interfere with the result (
Figure 1). It was proven that the boundaries of the model took on negligible stresses, which implied that, in some FLAC models, the width of the model was adapted according to the width of the footing (load application). These checking and adaptation procedures were undertaken for each model. In the numerical model, the vertical load was applied directly on the nodes (ground surface) via velocity increments; therefore, the characteristics of the foundation and the interaction with the ground surface did not influence the result.
In the numerical analysis, it was assumed that the bearing capacity was reached when the continuous medium could not withstand more load because this indicated that the internal failure mechanism had formed.
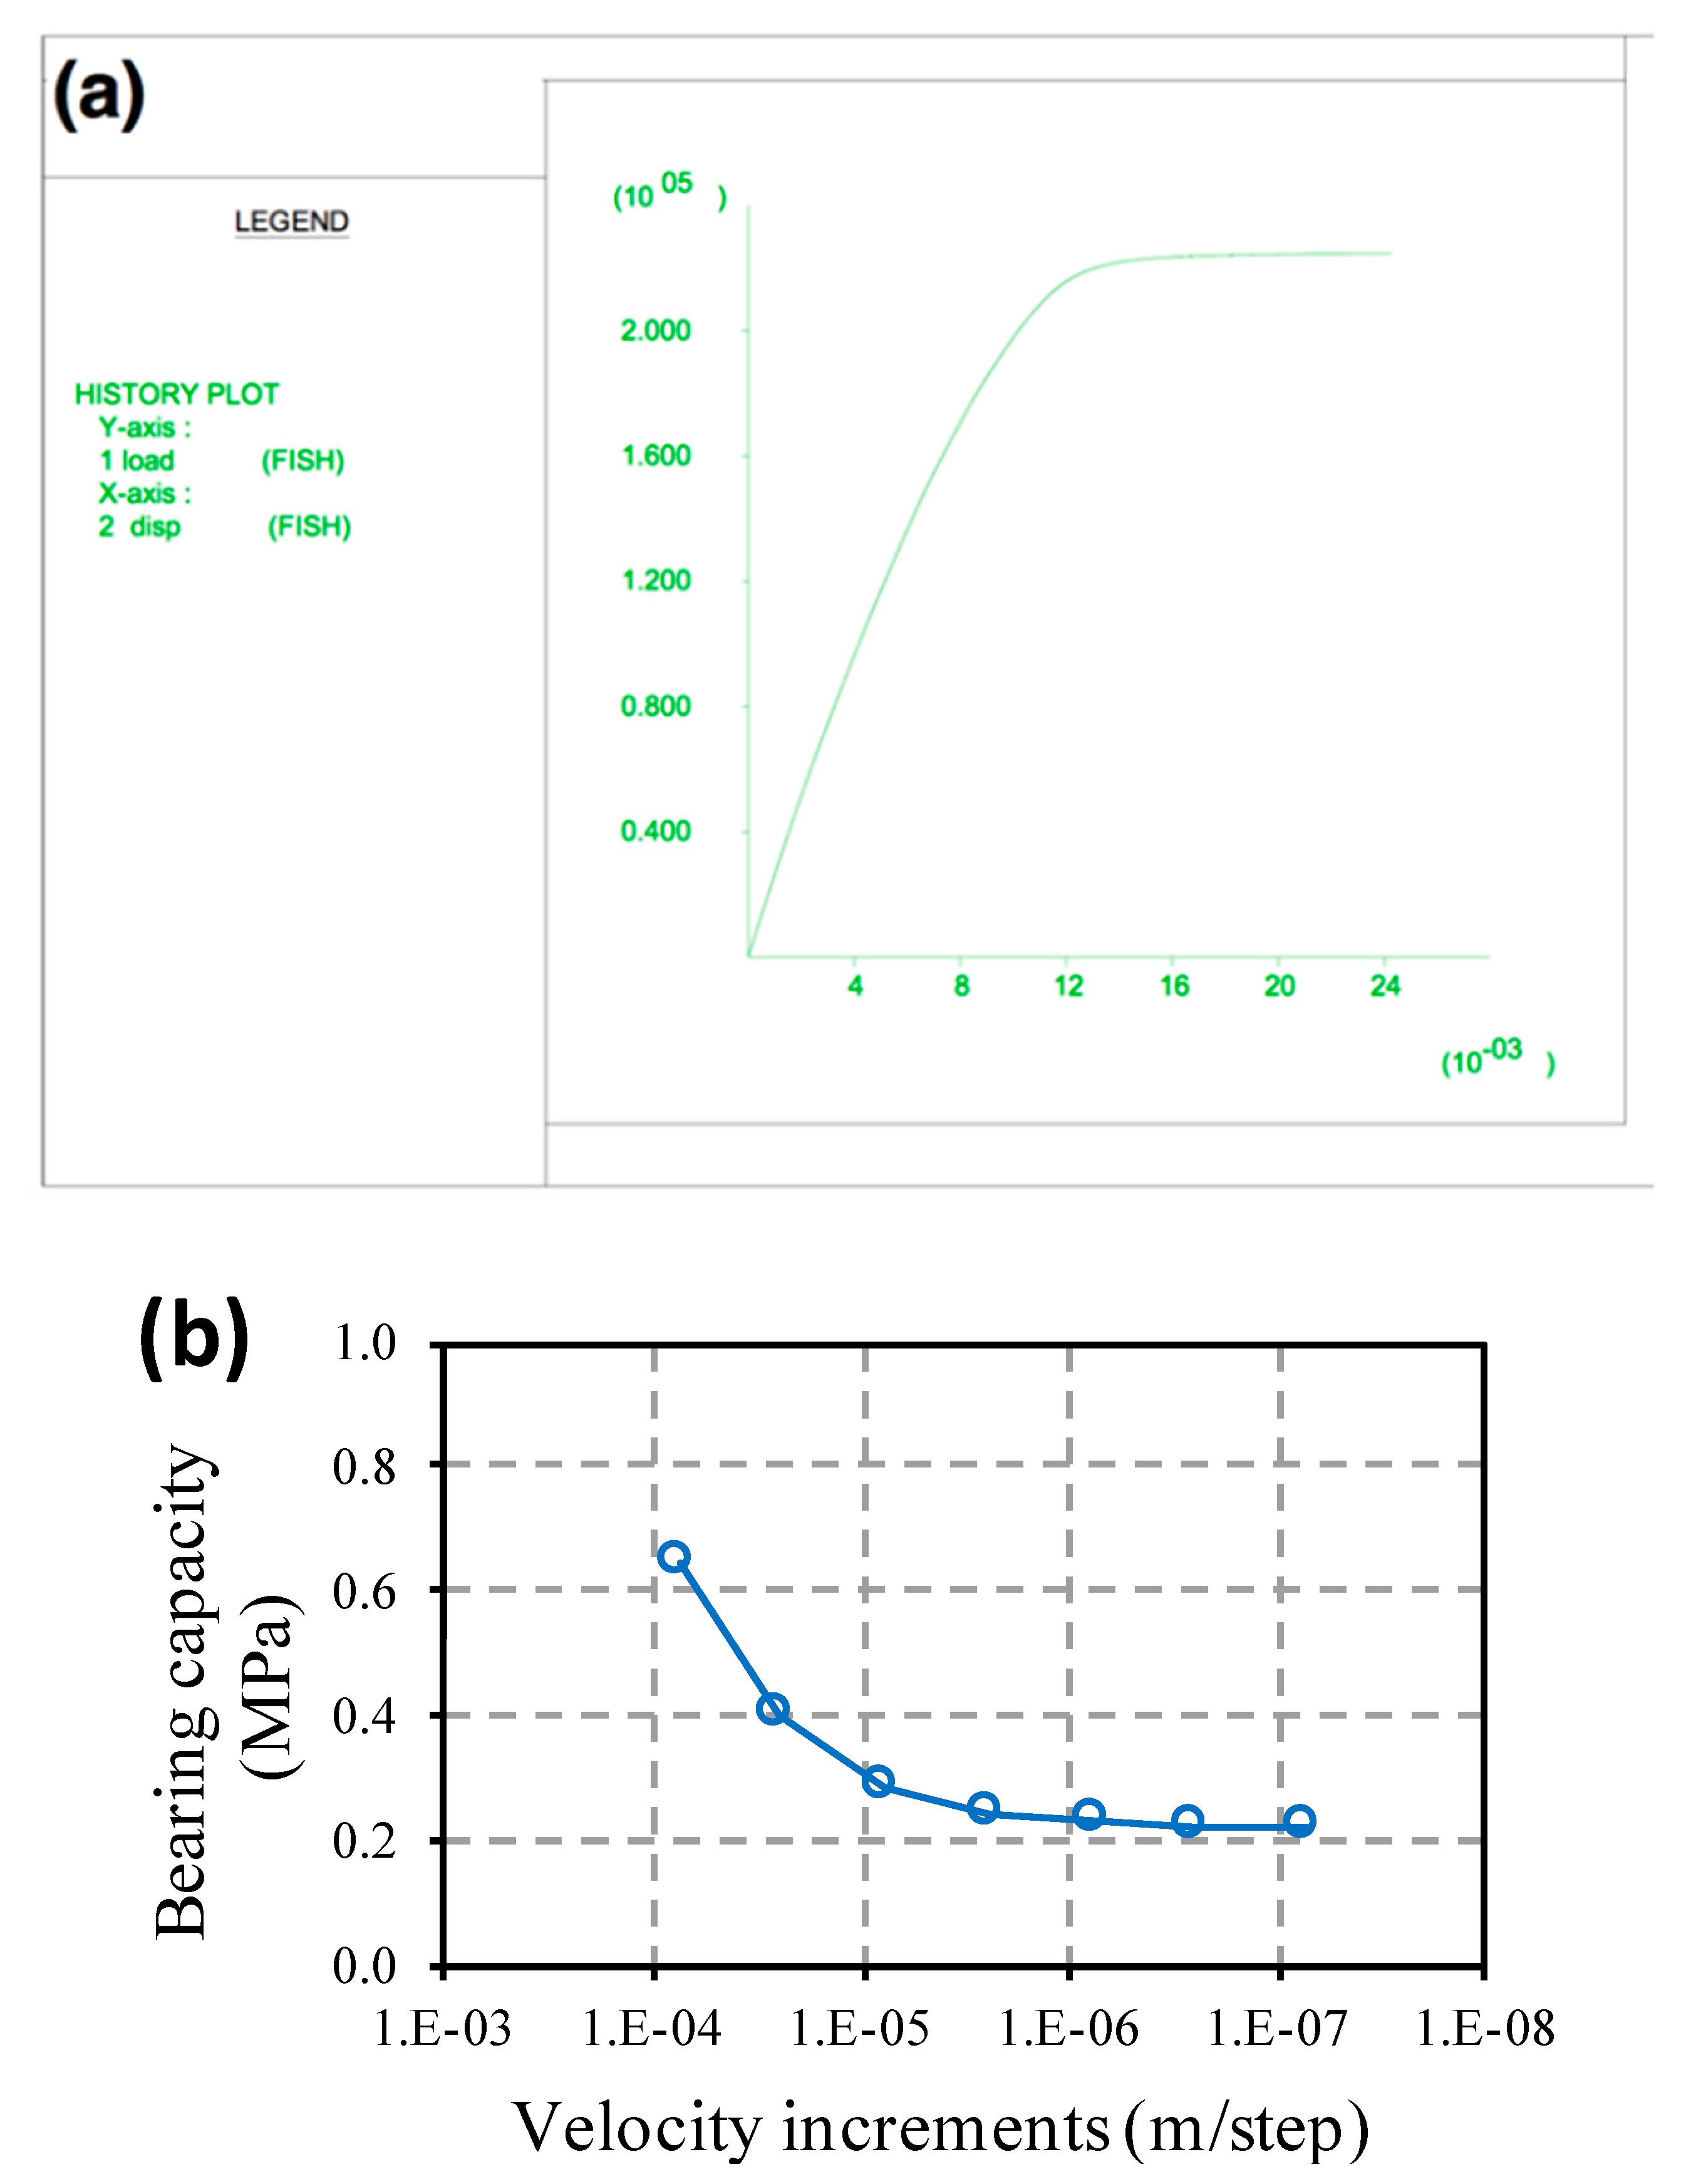
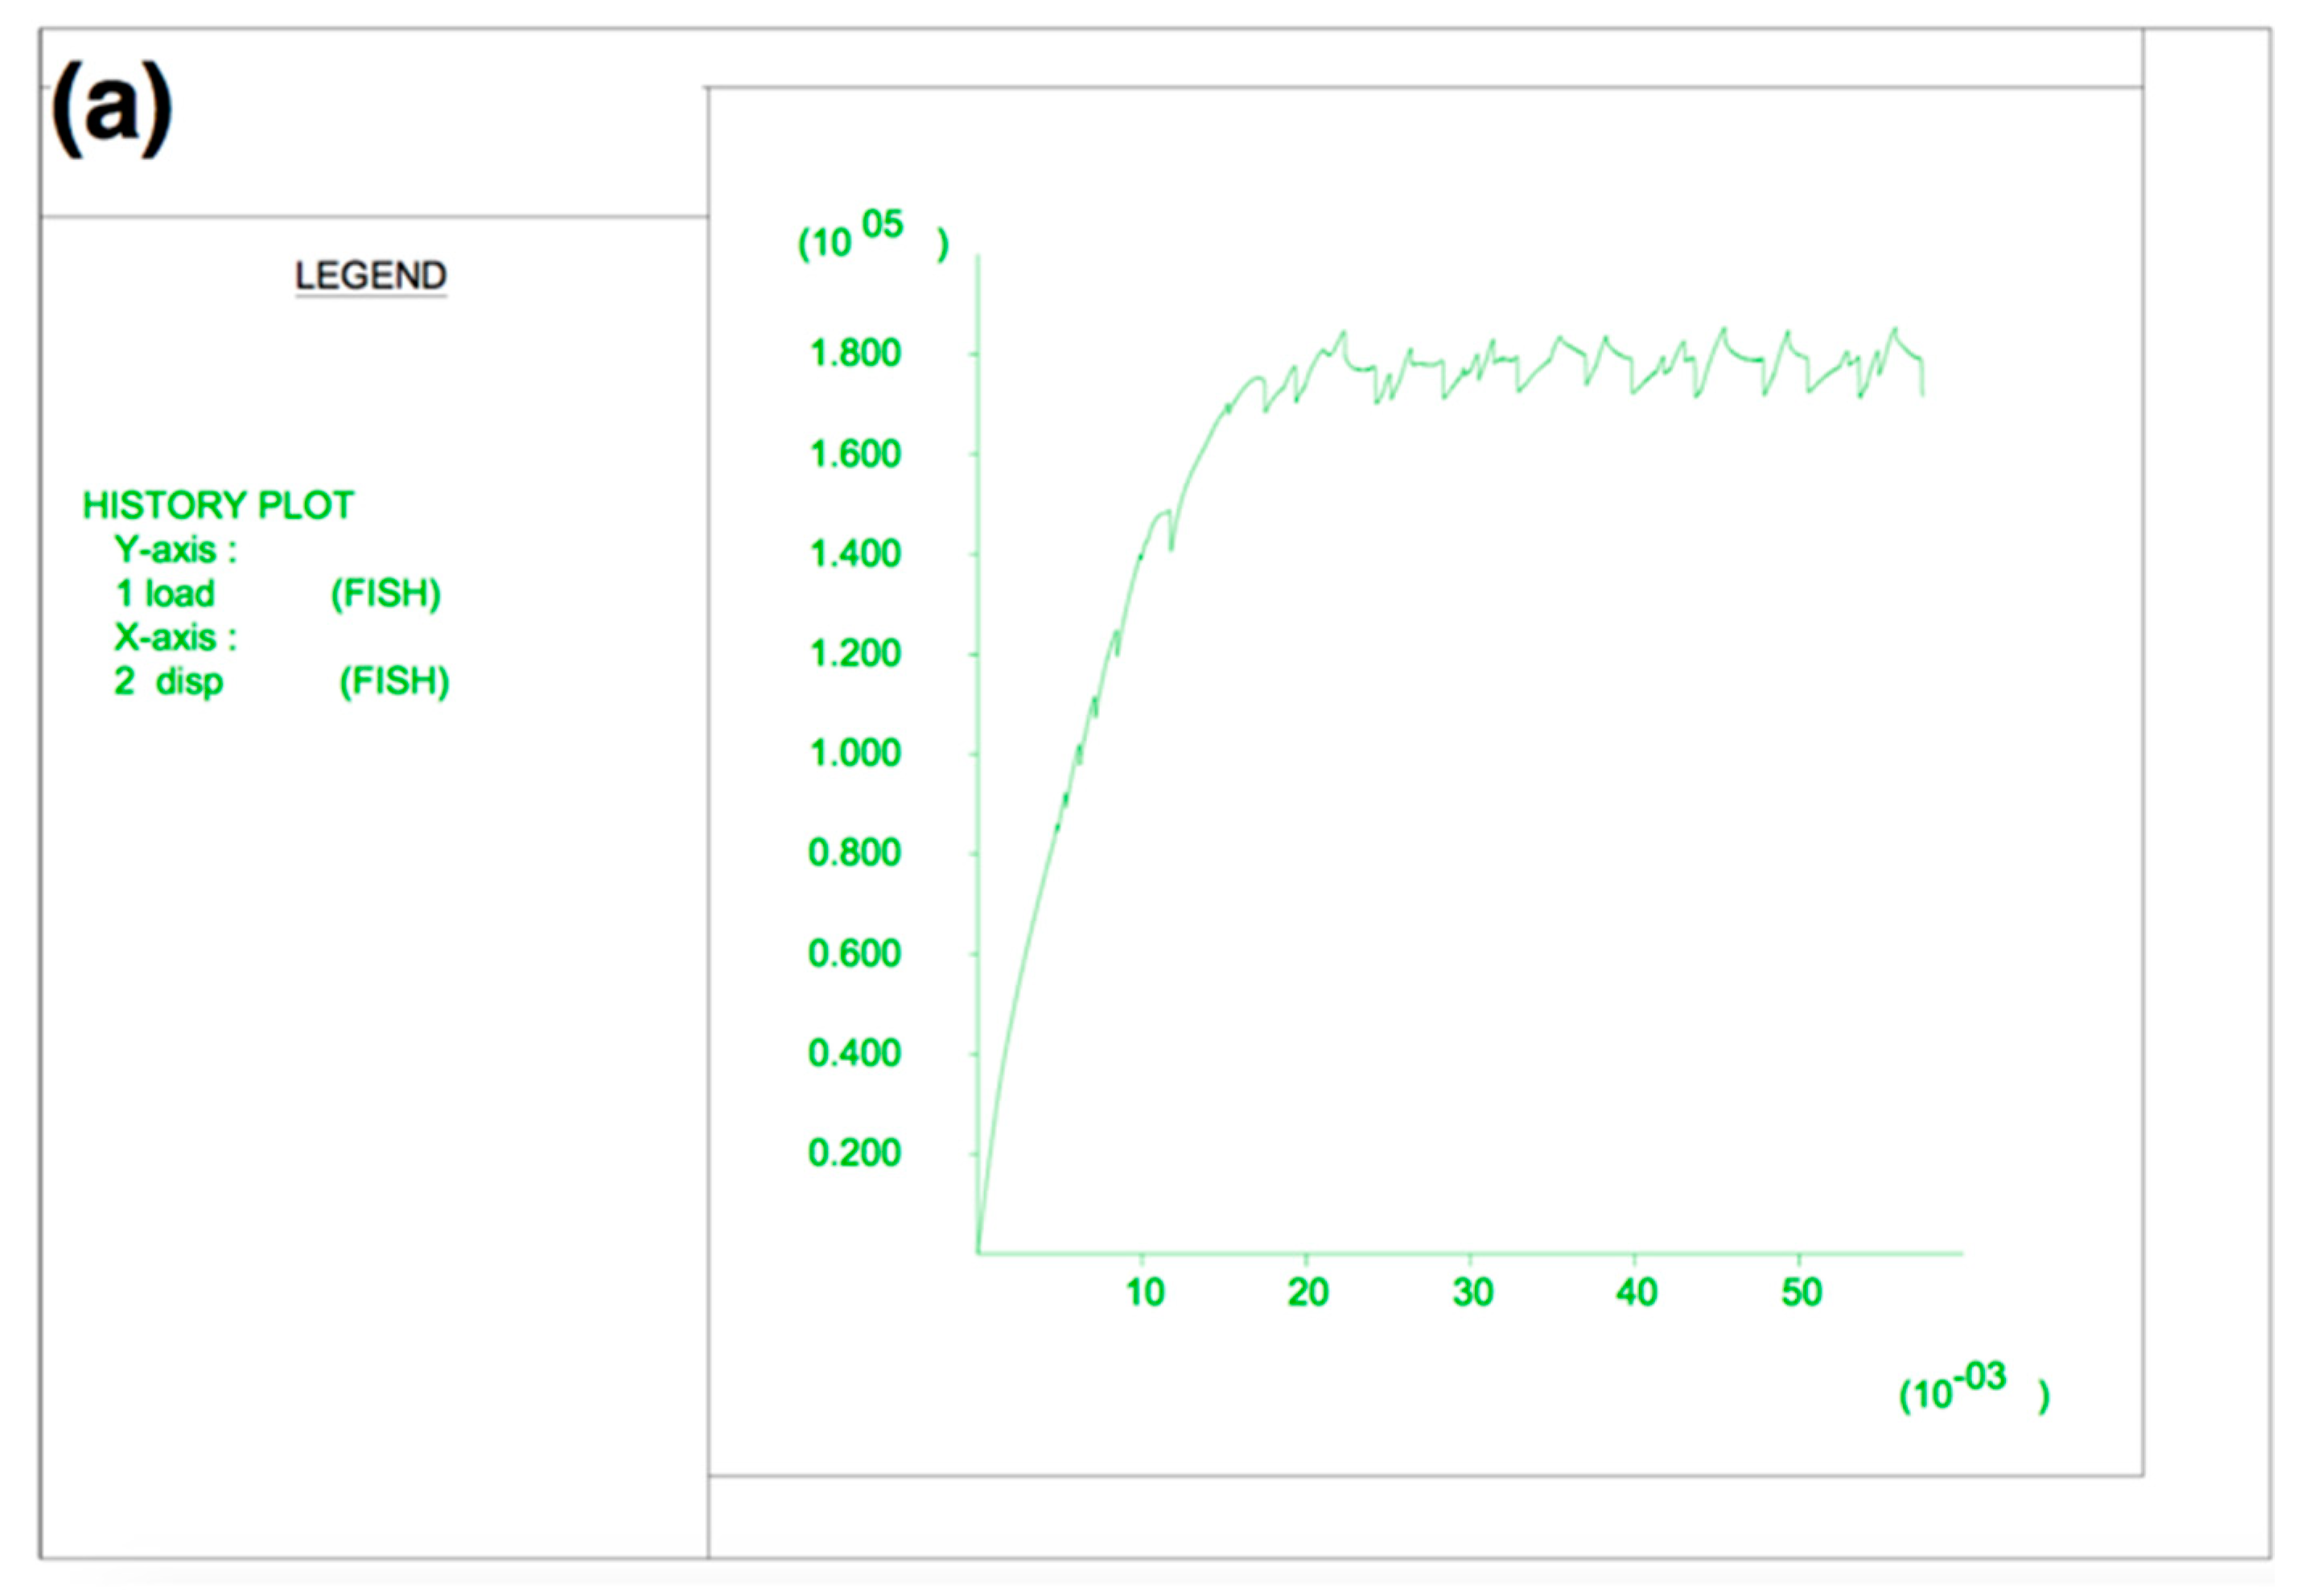
The hypothesis of a rigid or flexible foundation depended on the relative deformability of the shallow foundation regarding the supporting ground. This consideration could not be included in the analytical solution since the bearing capacity was independent of the ground deformability. The conditions of uniform stresses and displacements at the contact points could not be simultaneously imposed, and therefore, it was necessary to previously investigate how to consider the rigidity of the foundation using the FDM method. The best approximation of the numerical result with the analytical solution (for cases with associated dilatancy where such a theoretical solution existed) was observed when assigning a constant deformation velocity for the contacting points of the foundation and the rock. Thus, the load in FLAC was applied through velocity increments, and the bearing capacity was determined from the relation between the stresses and displacements of one of the nodes; in this case, the central node of the foundation was considered. In
Figure 2a, the displacement of the central node of the foundation (horizontal axis) with respect to the load applied to the ground from the foundation is represented. In this figure, it can be observed that the maximum load that the ground supported was limited to the asymptotic value of the represented curve.
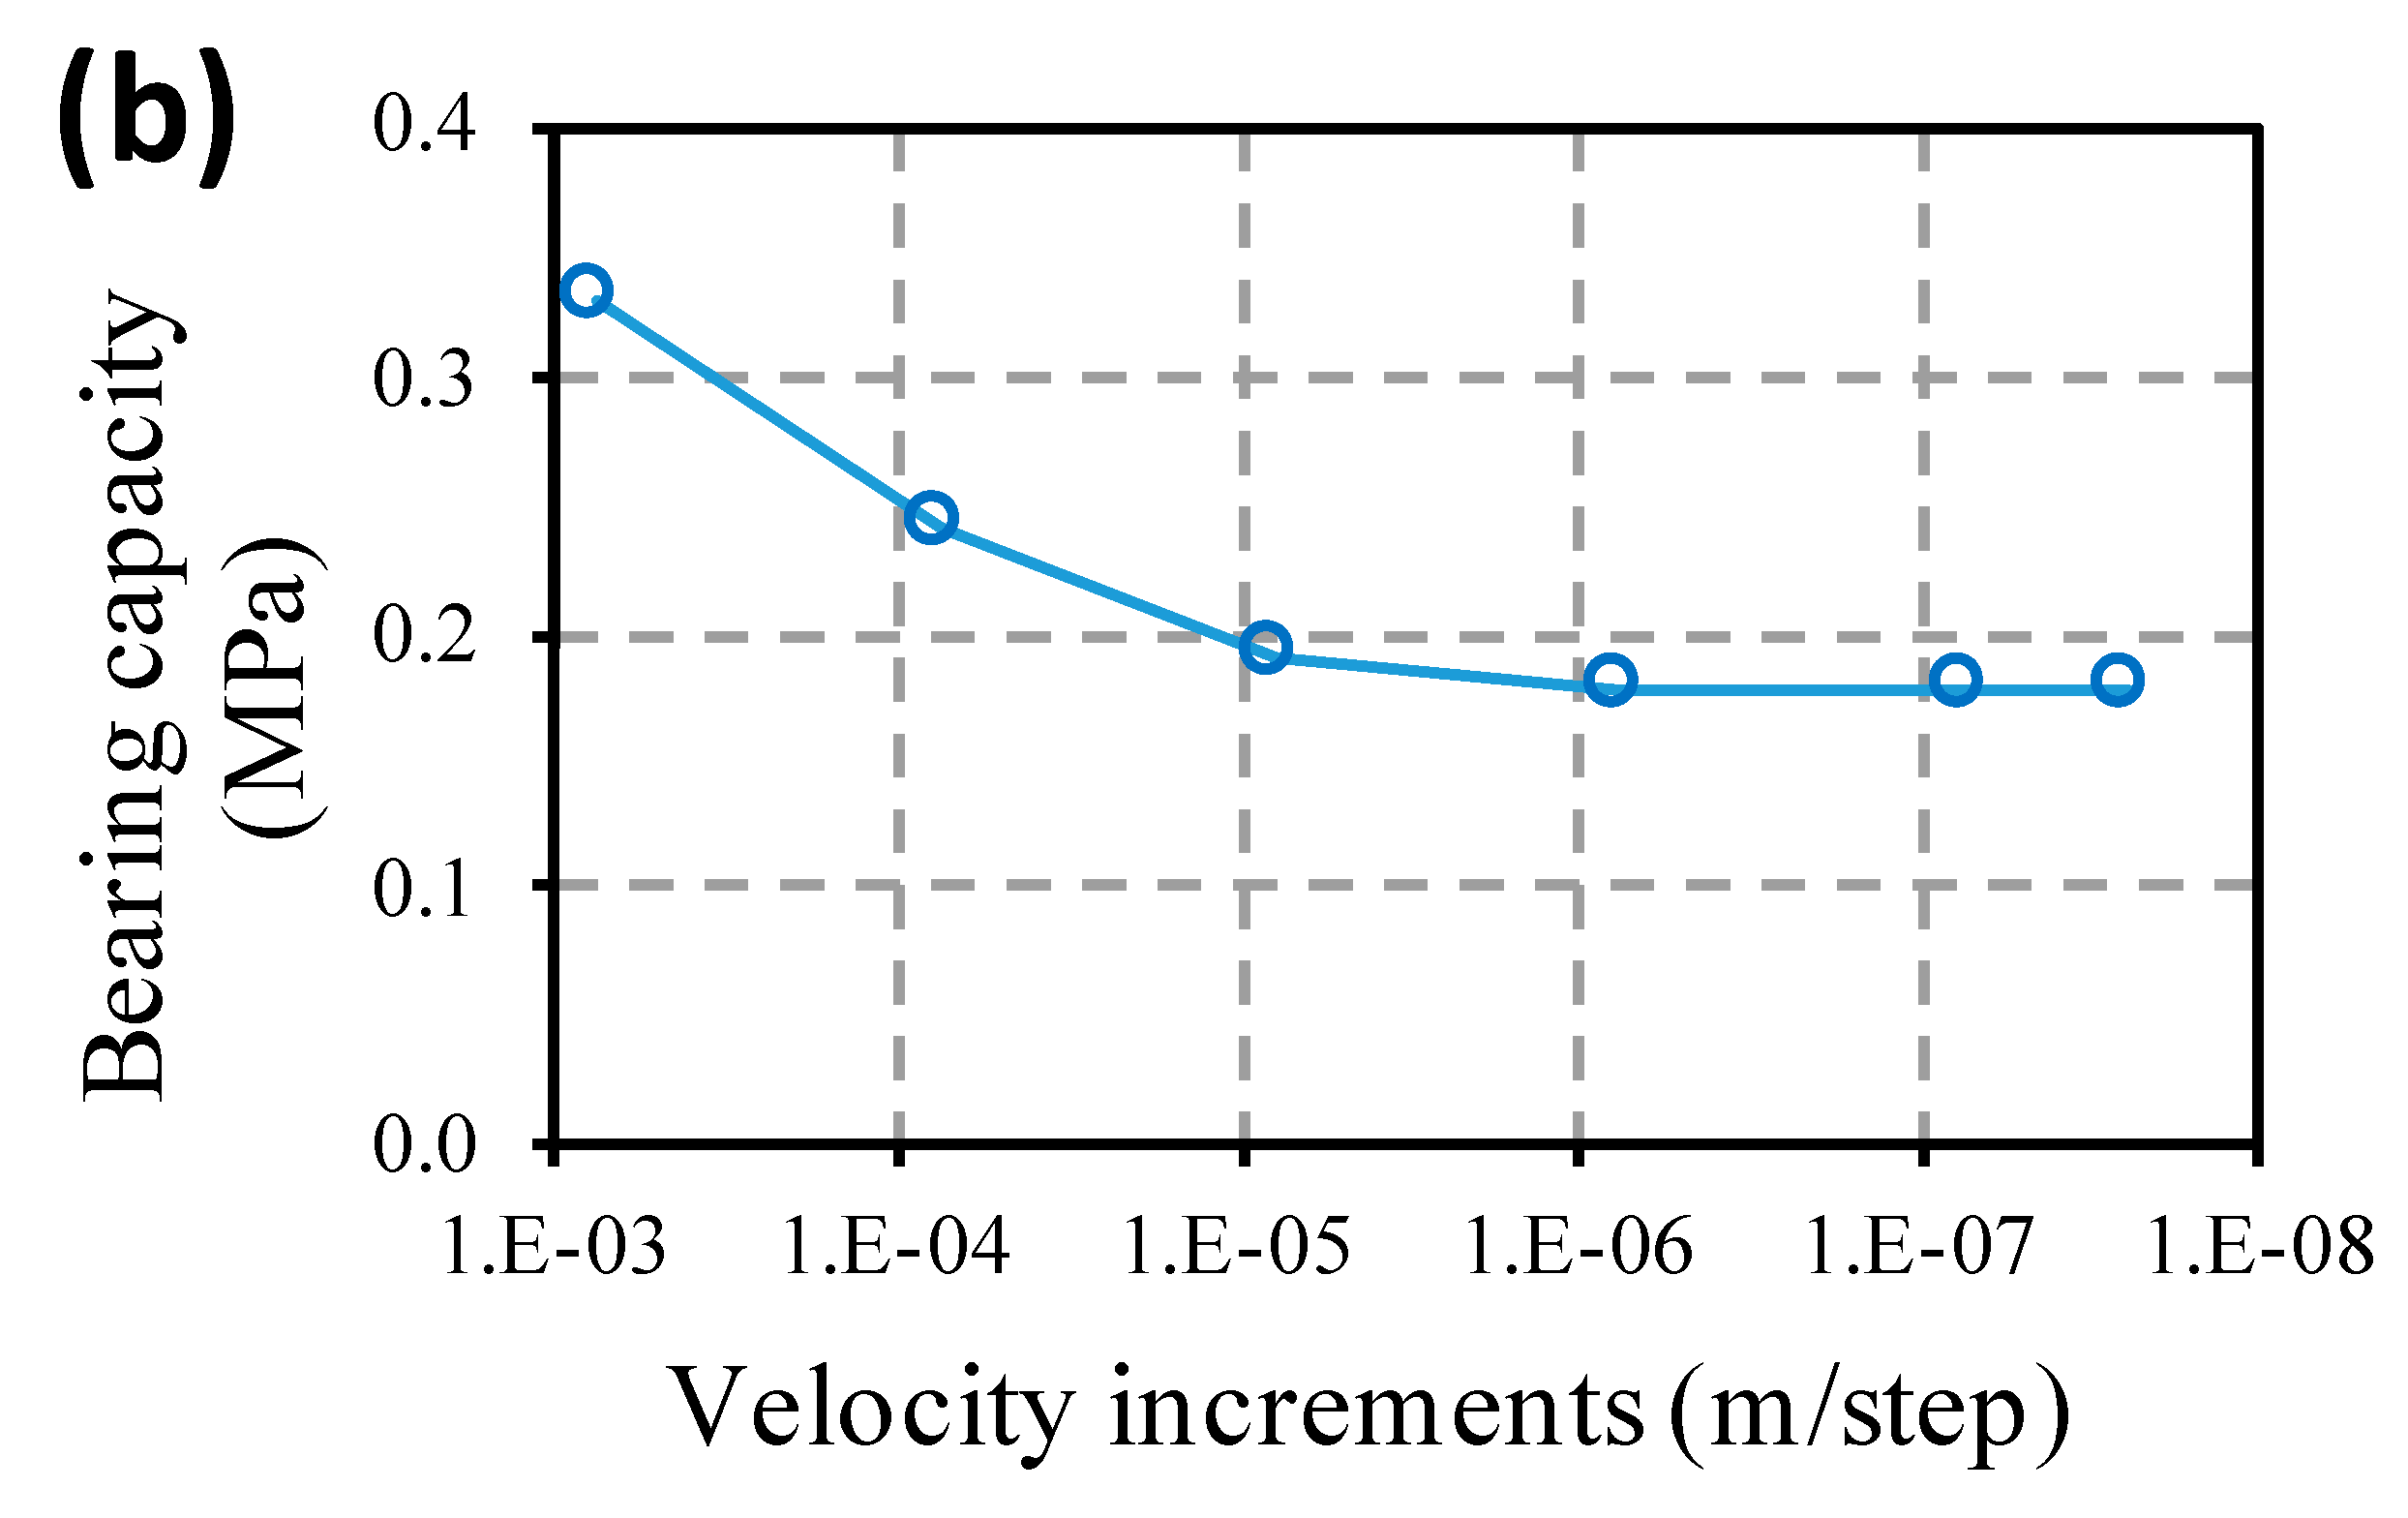
A convergence study was carried out that involved controlling the value of the bearing capacity obtained under different increments of the applied velocity.
Figure 2b shows the dependence of the results of the bearing capacity in relation to the velocity increments applied on the nodes, and how, with the decrease in the value of velocity increments, the result converged towards the final value. This convergence study was carried out for each case with a different combination of geometrical and geotechnical parameters.
In this study, both the associative flow rule (with an angle of dilatancy equal to the instantaneous friction angle) and the non-associative flow rule (with an angle of dilatancy equal to zero) were used. The commercial program FLAC has two constitutive models implemented that combine the generalized Hoek and Brown failure criterion [
14] with different flow rules, allowing the adoption of different values of dilatancy. The calculations were tested with the two constitutive models under the same flow law hypothesis and the results converged to the same value of bearing capacity for each case study that was analyzed.
3. Bearing Capacity for Weightless Rock Mass
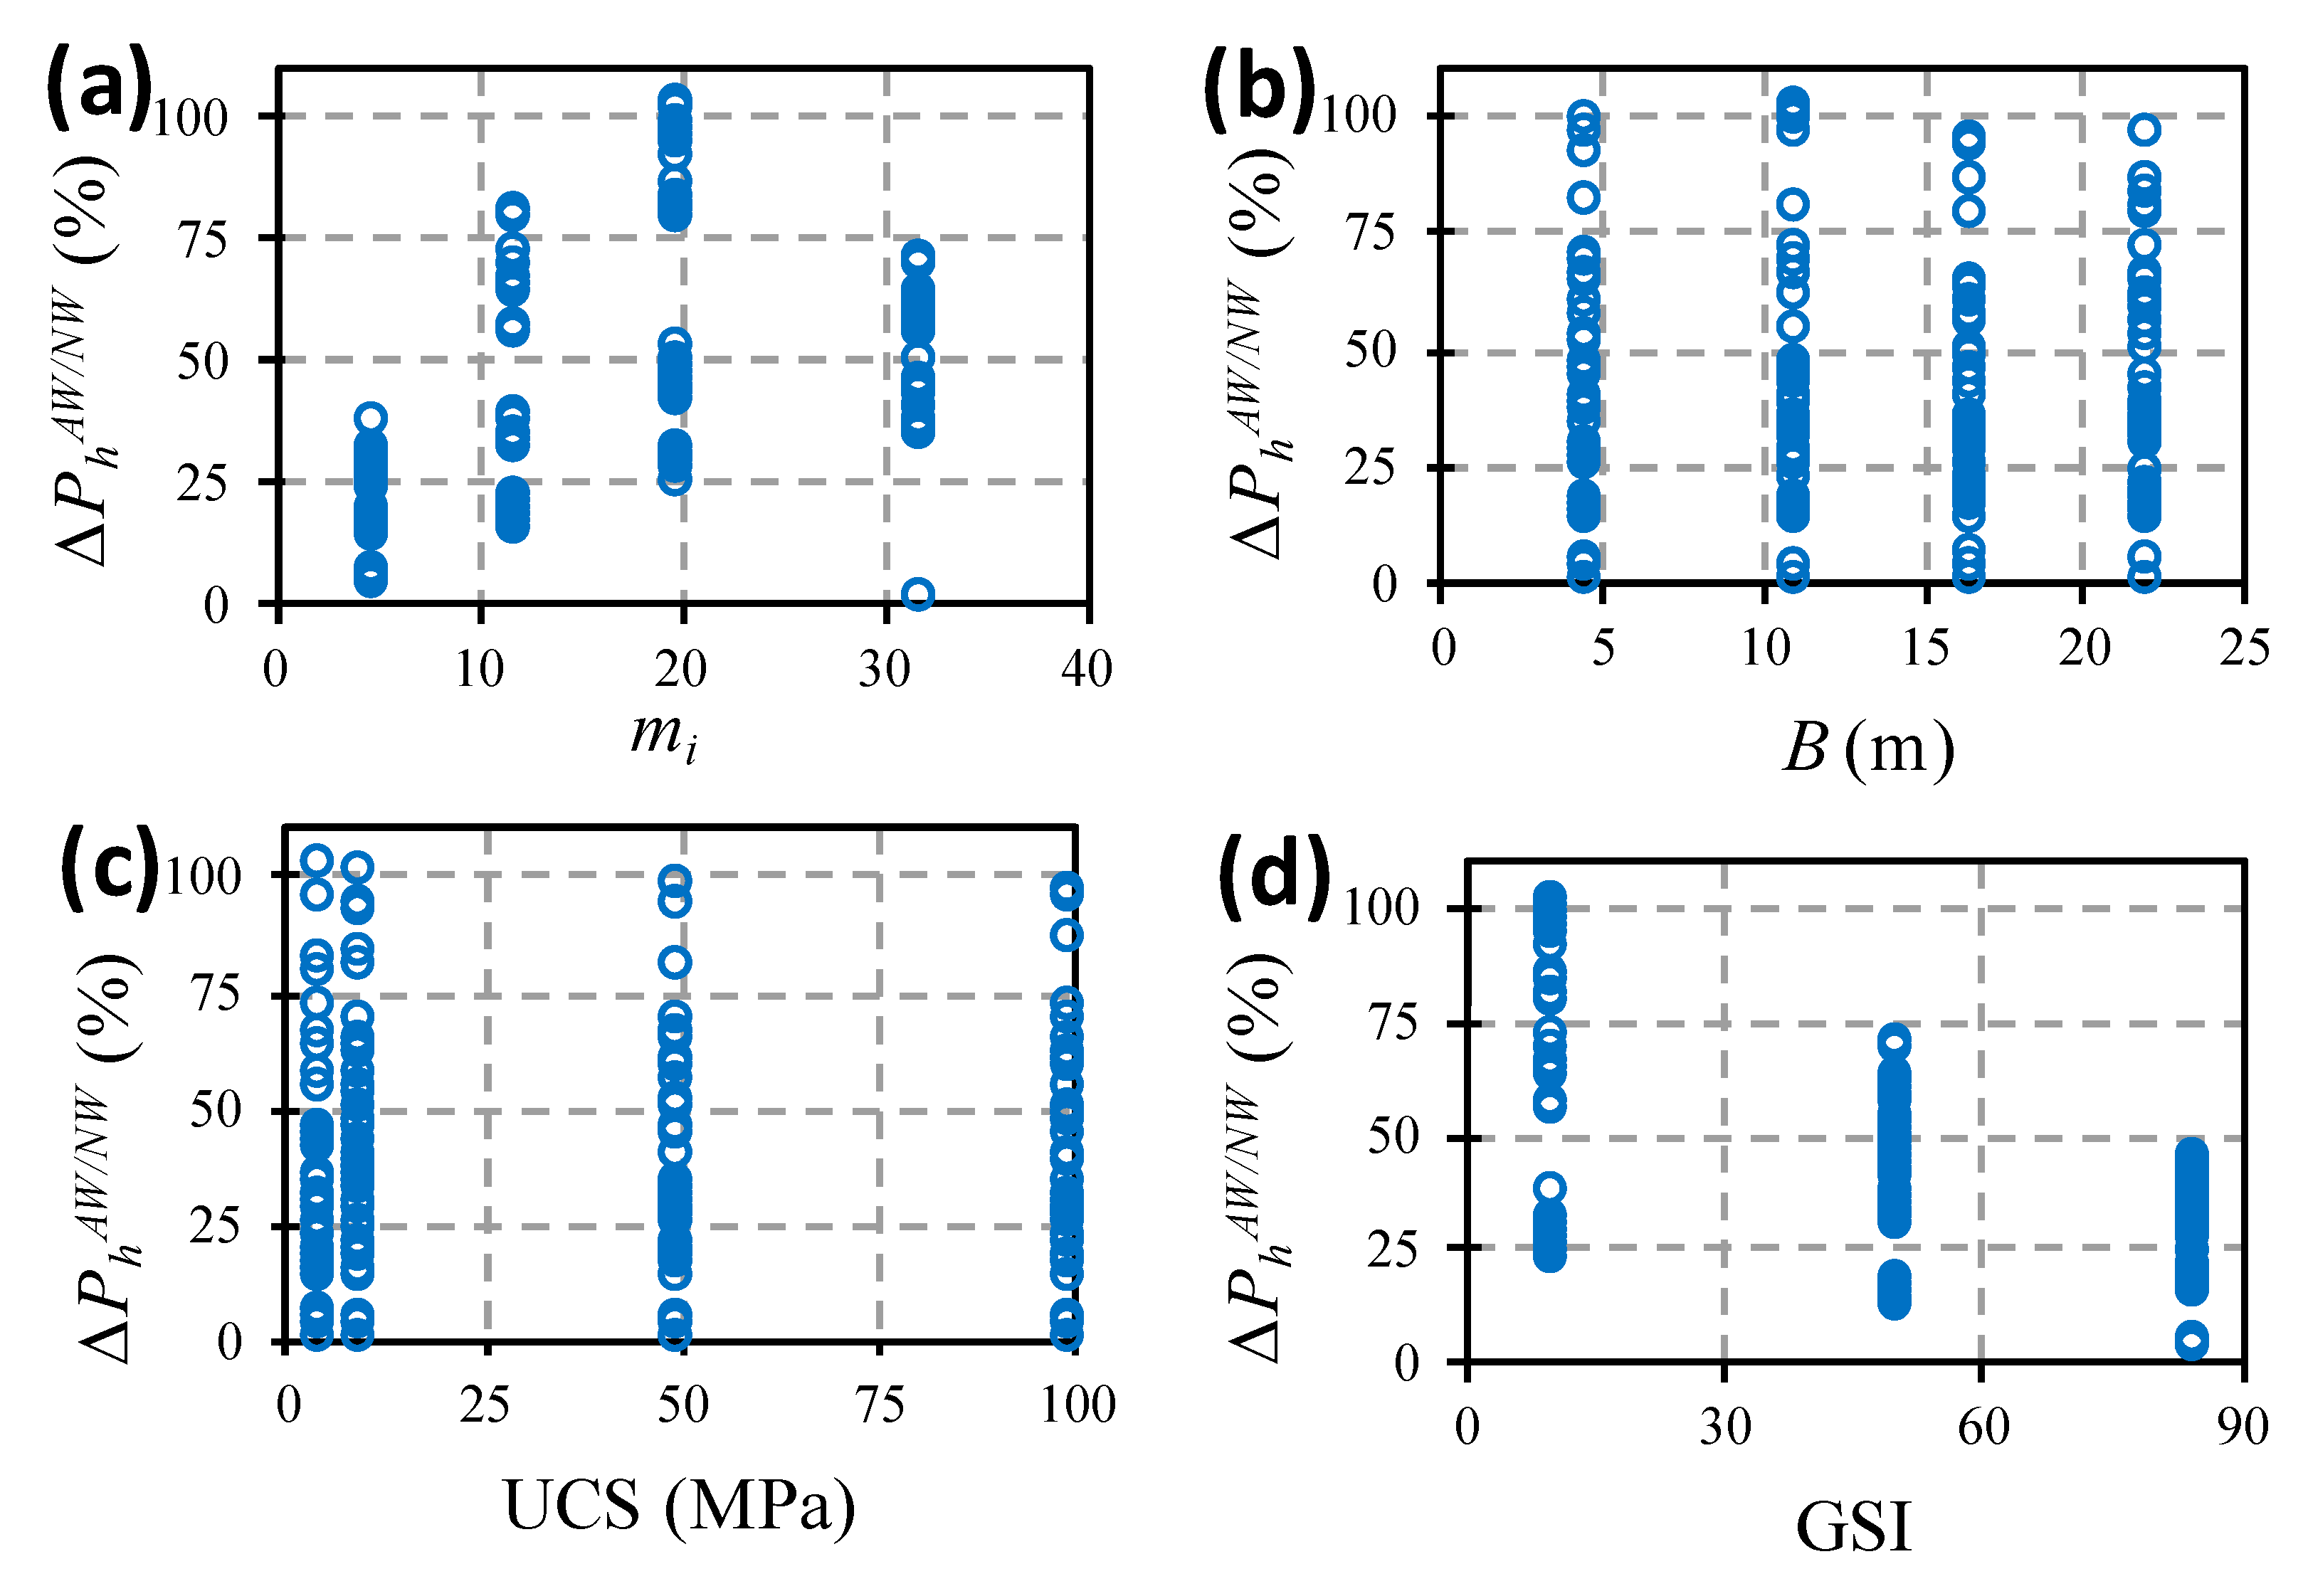
With the results obtained by varying the flow law, we can observe that the variation of the dilatancy angle made it possible to modify the bearing capacity by up to 100% (
Figure 3). The results were obtained in the extreme condition, in which an associative flow law (
PhAW) and a non-associative flow law with a null dilatancy angle (
PhNW) were compared, under the assumptions of weightless rock mass.
The comparison ratio (
) between the results
PhAW and
PhNW is expressed in Equation (1).
From
Figure 3a–d it can be concluded that the two parameters that most influenced the dispersion of the ratio between
PhAW and
PhNW were
mi and
GSI. On the other hand,
Figure 3b,c, show that the dispersion range was independent of the
B and
UCS values.
In
Figure 3, it can be observed that the influence of dilatancy angle value on the bearing capacity grew with the increasing of
mi. It is recalled that due to the numerical instability problems, it was not possible to obtain the results of the bearing capacity for the combination of
mi = 32 and
GSI = 10 for the weightless rock mass, which would be the cases that correspond to greater dispersion according to
Figure 3a–d. Due to the absence of these results in the mentioned graphs, the variation between
PhAW and
PhNW for
mi = 20 ranged from 25 to 105%, while for
mi = 32, the variation ranged from 30 to 75%, and this difference would probably be much greater, confirming the tendency for
to increase with the increasing of
mi.
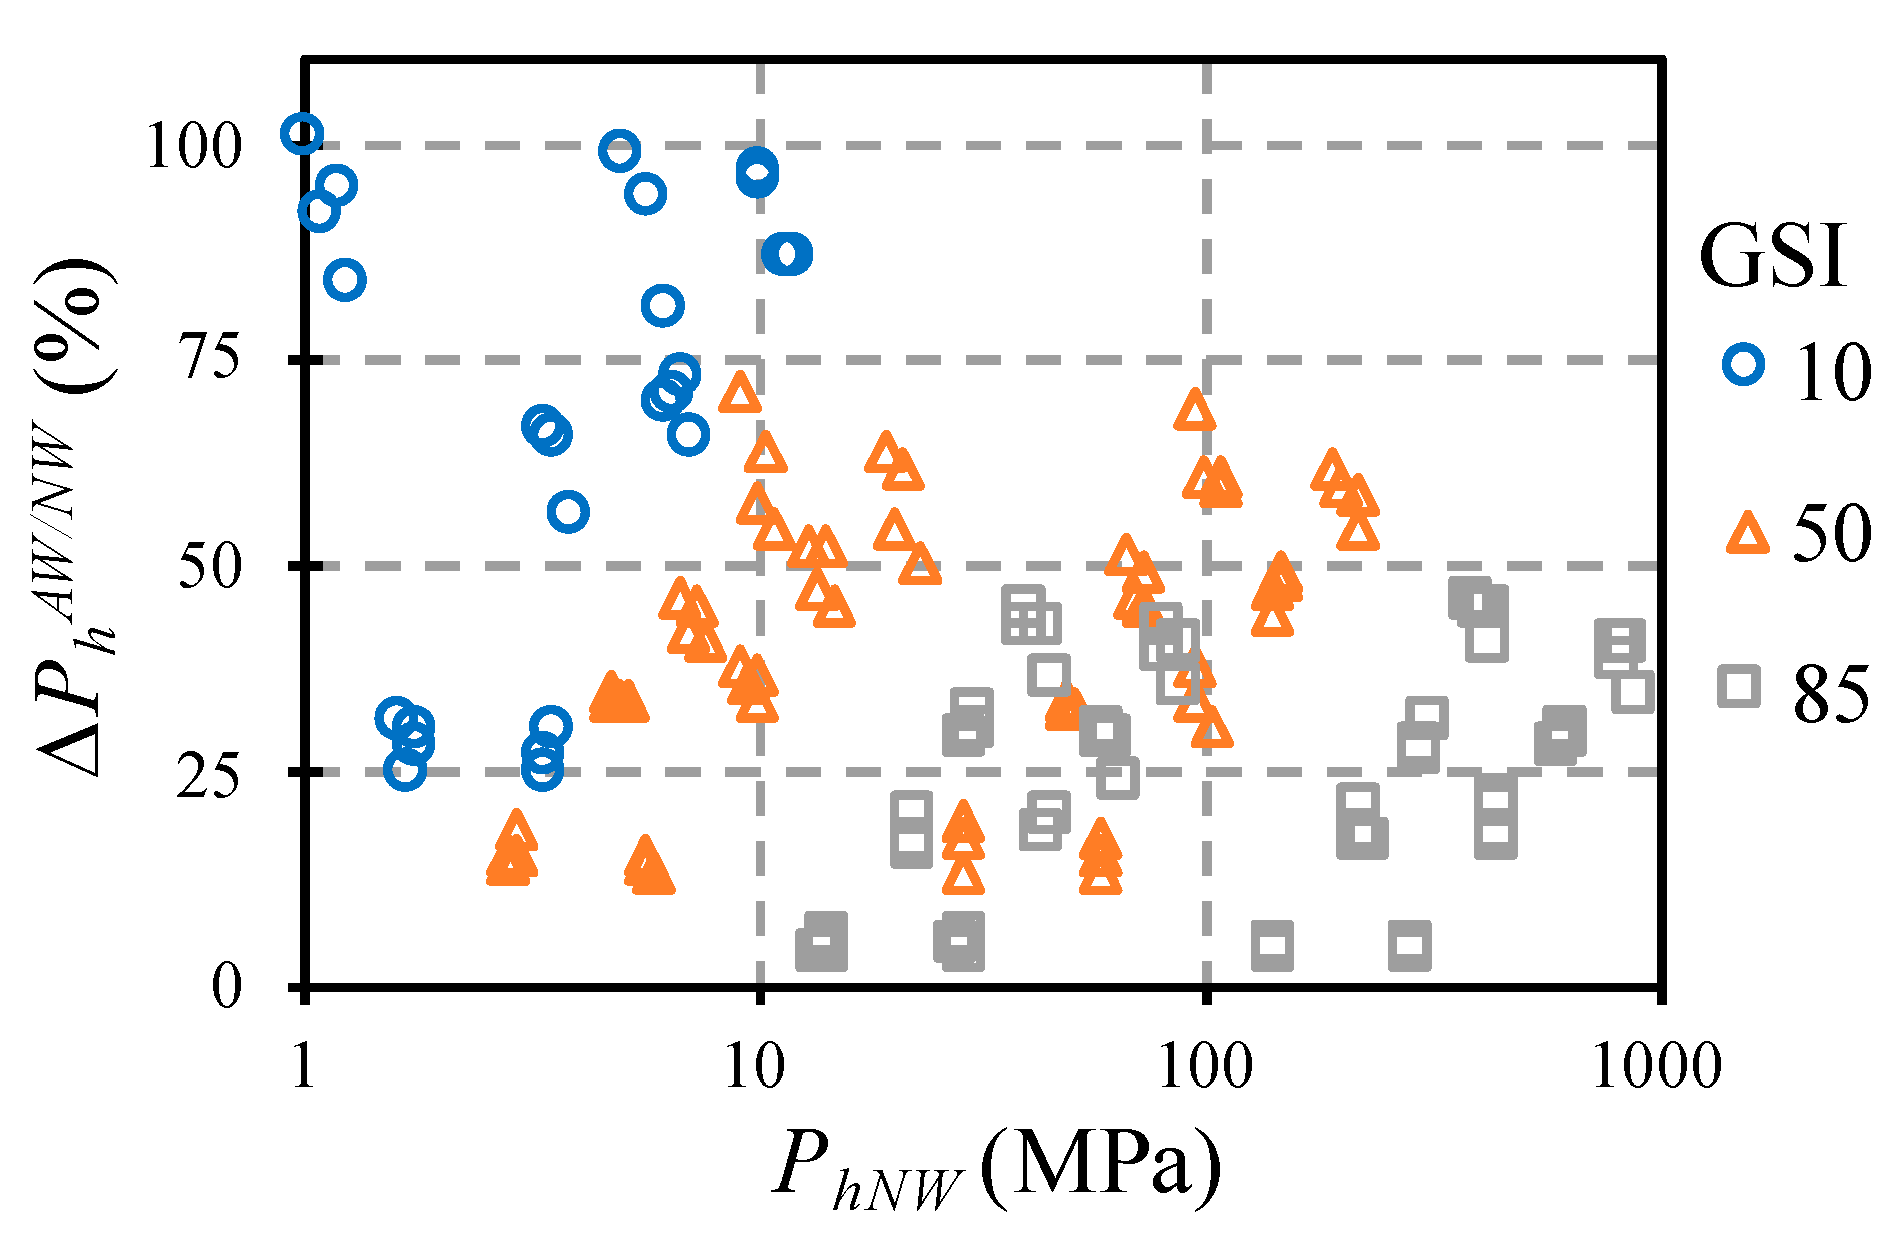
Figure 4 presents the values of
as determined in relation to the values of the bearing capacity obtained with non-associative flow rule with null dilatancy (
PhNW) as a function of the value of
GSI. From this figure, it can be concluded that the cases of low bearing capacity were the most conditioned by the variation of the dilatancy angle, and that the values obtained with the associative flow rule could exceed, in the most unfavorable cases (generally in the cases of low
GSI), twice the value obtained under the hypothesis of the non-associative flow law with zero dilatancy angle.
It is emphasized that the value of 25 MPa is the medium value of the compressive strength of concrete, as well as being the limit between soft and hard rock according to the ISRM [
40]. Therefore, as the low values of bearing capacity were especially sensitive to the flow law according to
Figure 4, it can be concluded that the non-associative law has a singular importance in soil-structure interaction studies.
Figure 4 shows that the bearing capacity value and the dispersion with the angle of dilatancy were highly conditioned by the value of the
GSI.
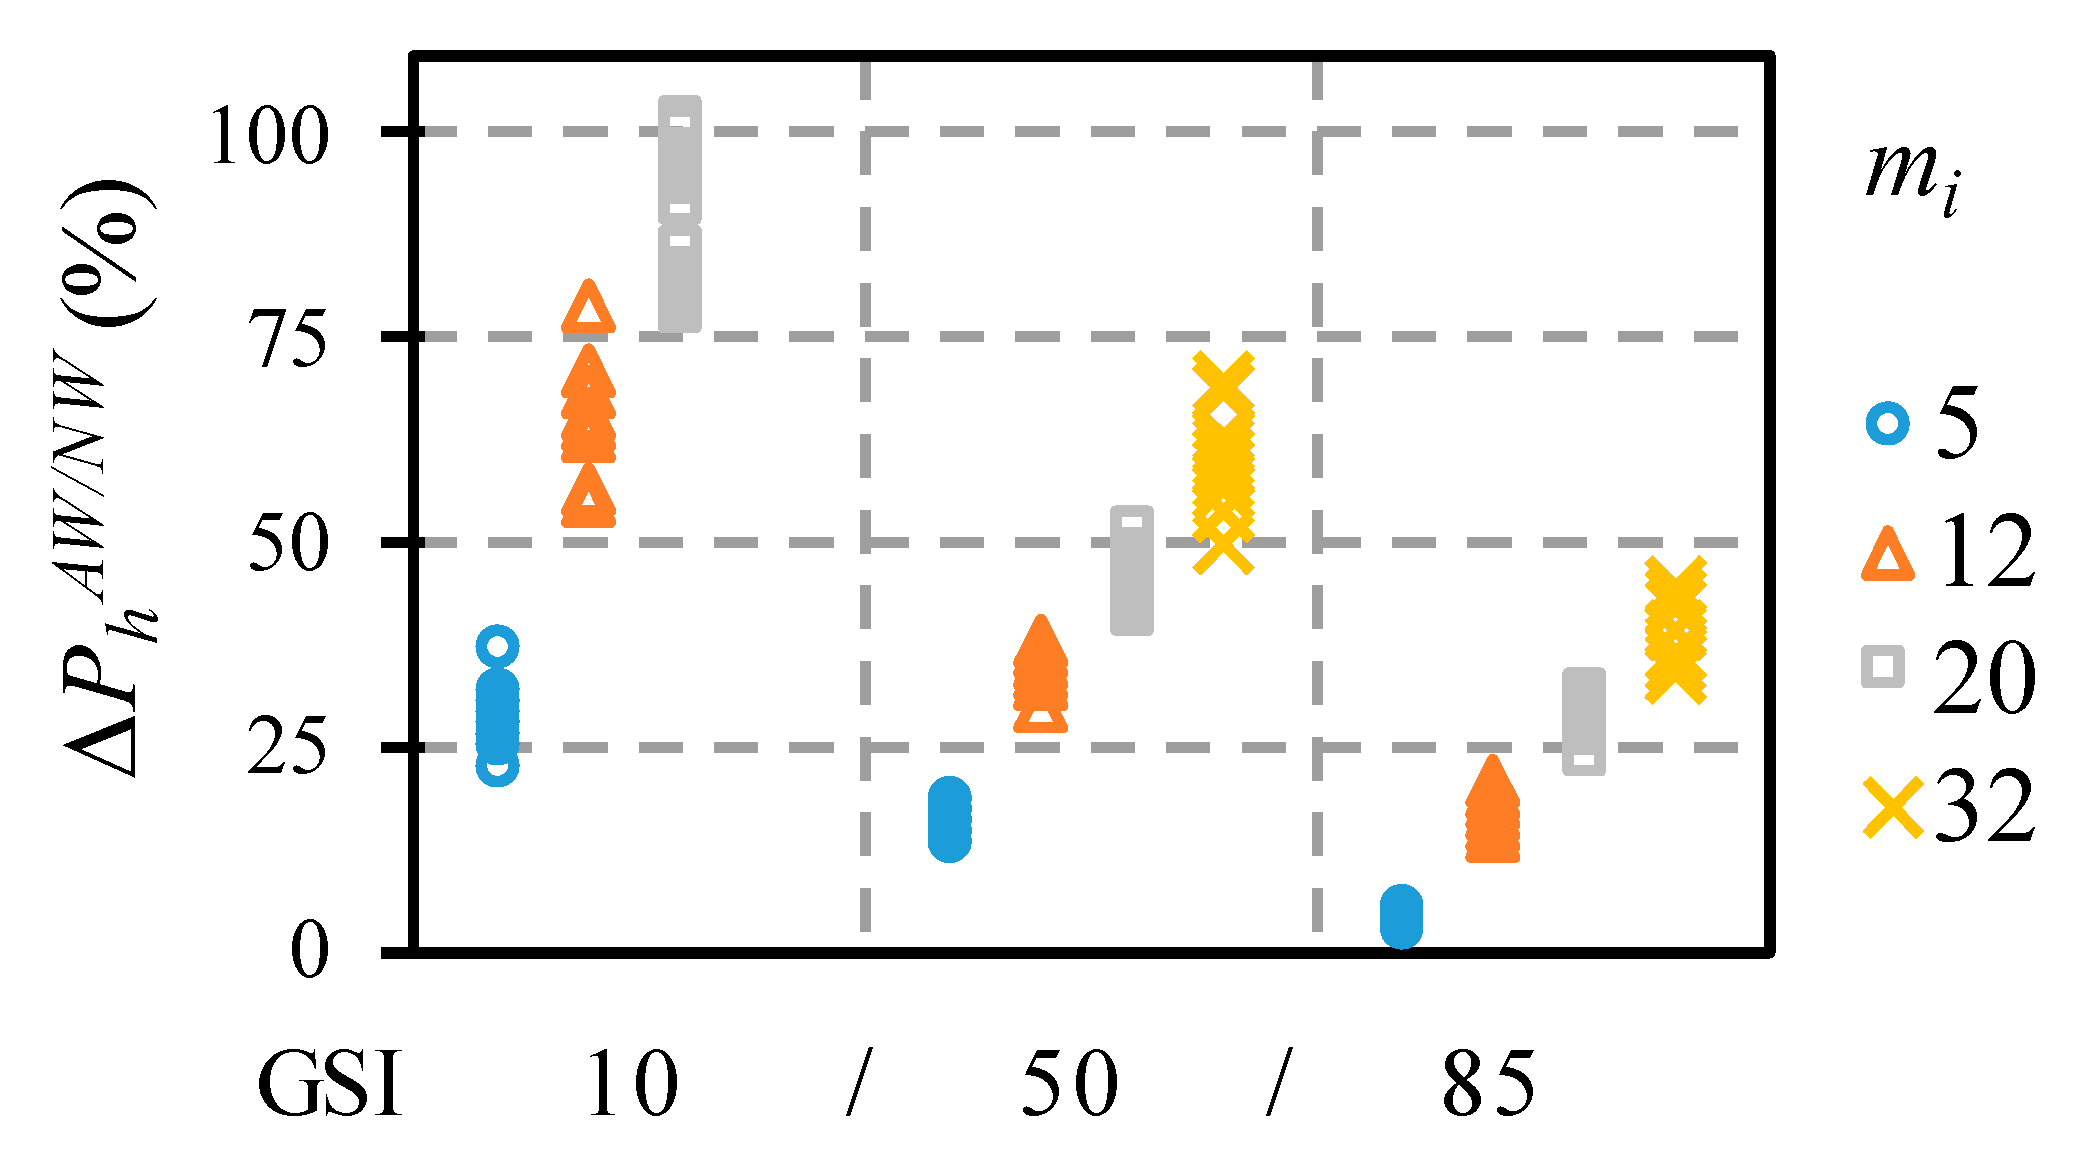
Figure 5 shows that the range of dispersion depended on the combination of the
GSI with the
mi, varying from 5% for lower
mi and great
GSI, to more than 100% for a larger
mi and a small
GSI. Therefore, the increase in the value of
mi implies the increase in the dispersion range in the results. As said previously, due to numerical instability problems, it was not possible to obtain results for the combination of
mi = 32 and
GSI = 10, and for that reason, in
Figure 5, for
GSI = 10, only three instead of four columns are presented.
It is important to note that the cases that showed the greatest variation were those of the low
GSI values, corresponding to cases for which Hoek and Brown [
13] recommend the adoption of null dilatancy, since it corresponds to a very poor quality rock mass. Based on the results and in accordance with the Hoek and Brown recommendations, it can be concluded that in cases of low
GSI, the assumption of the associative flow rule overestimates the bearing capacity of the rock mass up to 100%.
3.1. Dilatancy Correlation Factor (DF)
Once the most determining parameters were known, it was possible to develop a correlation coefficient (DF) to estimate the percentage of variation of bearing capacity due to the adopted flow law.
As expected, the results obtained under the hypothesis of the associative flow law were always greater than those estimated with the non-associative flow law with null dilatancy; thus, from Equation (1), the correlation factor (
) could be expressed by Equation (2):
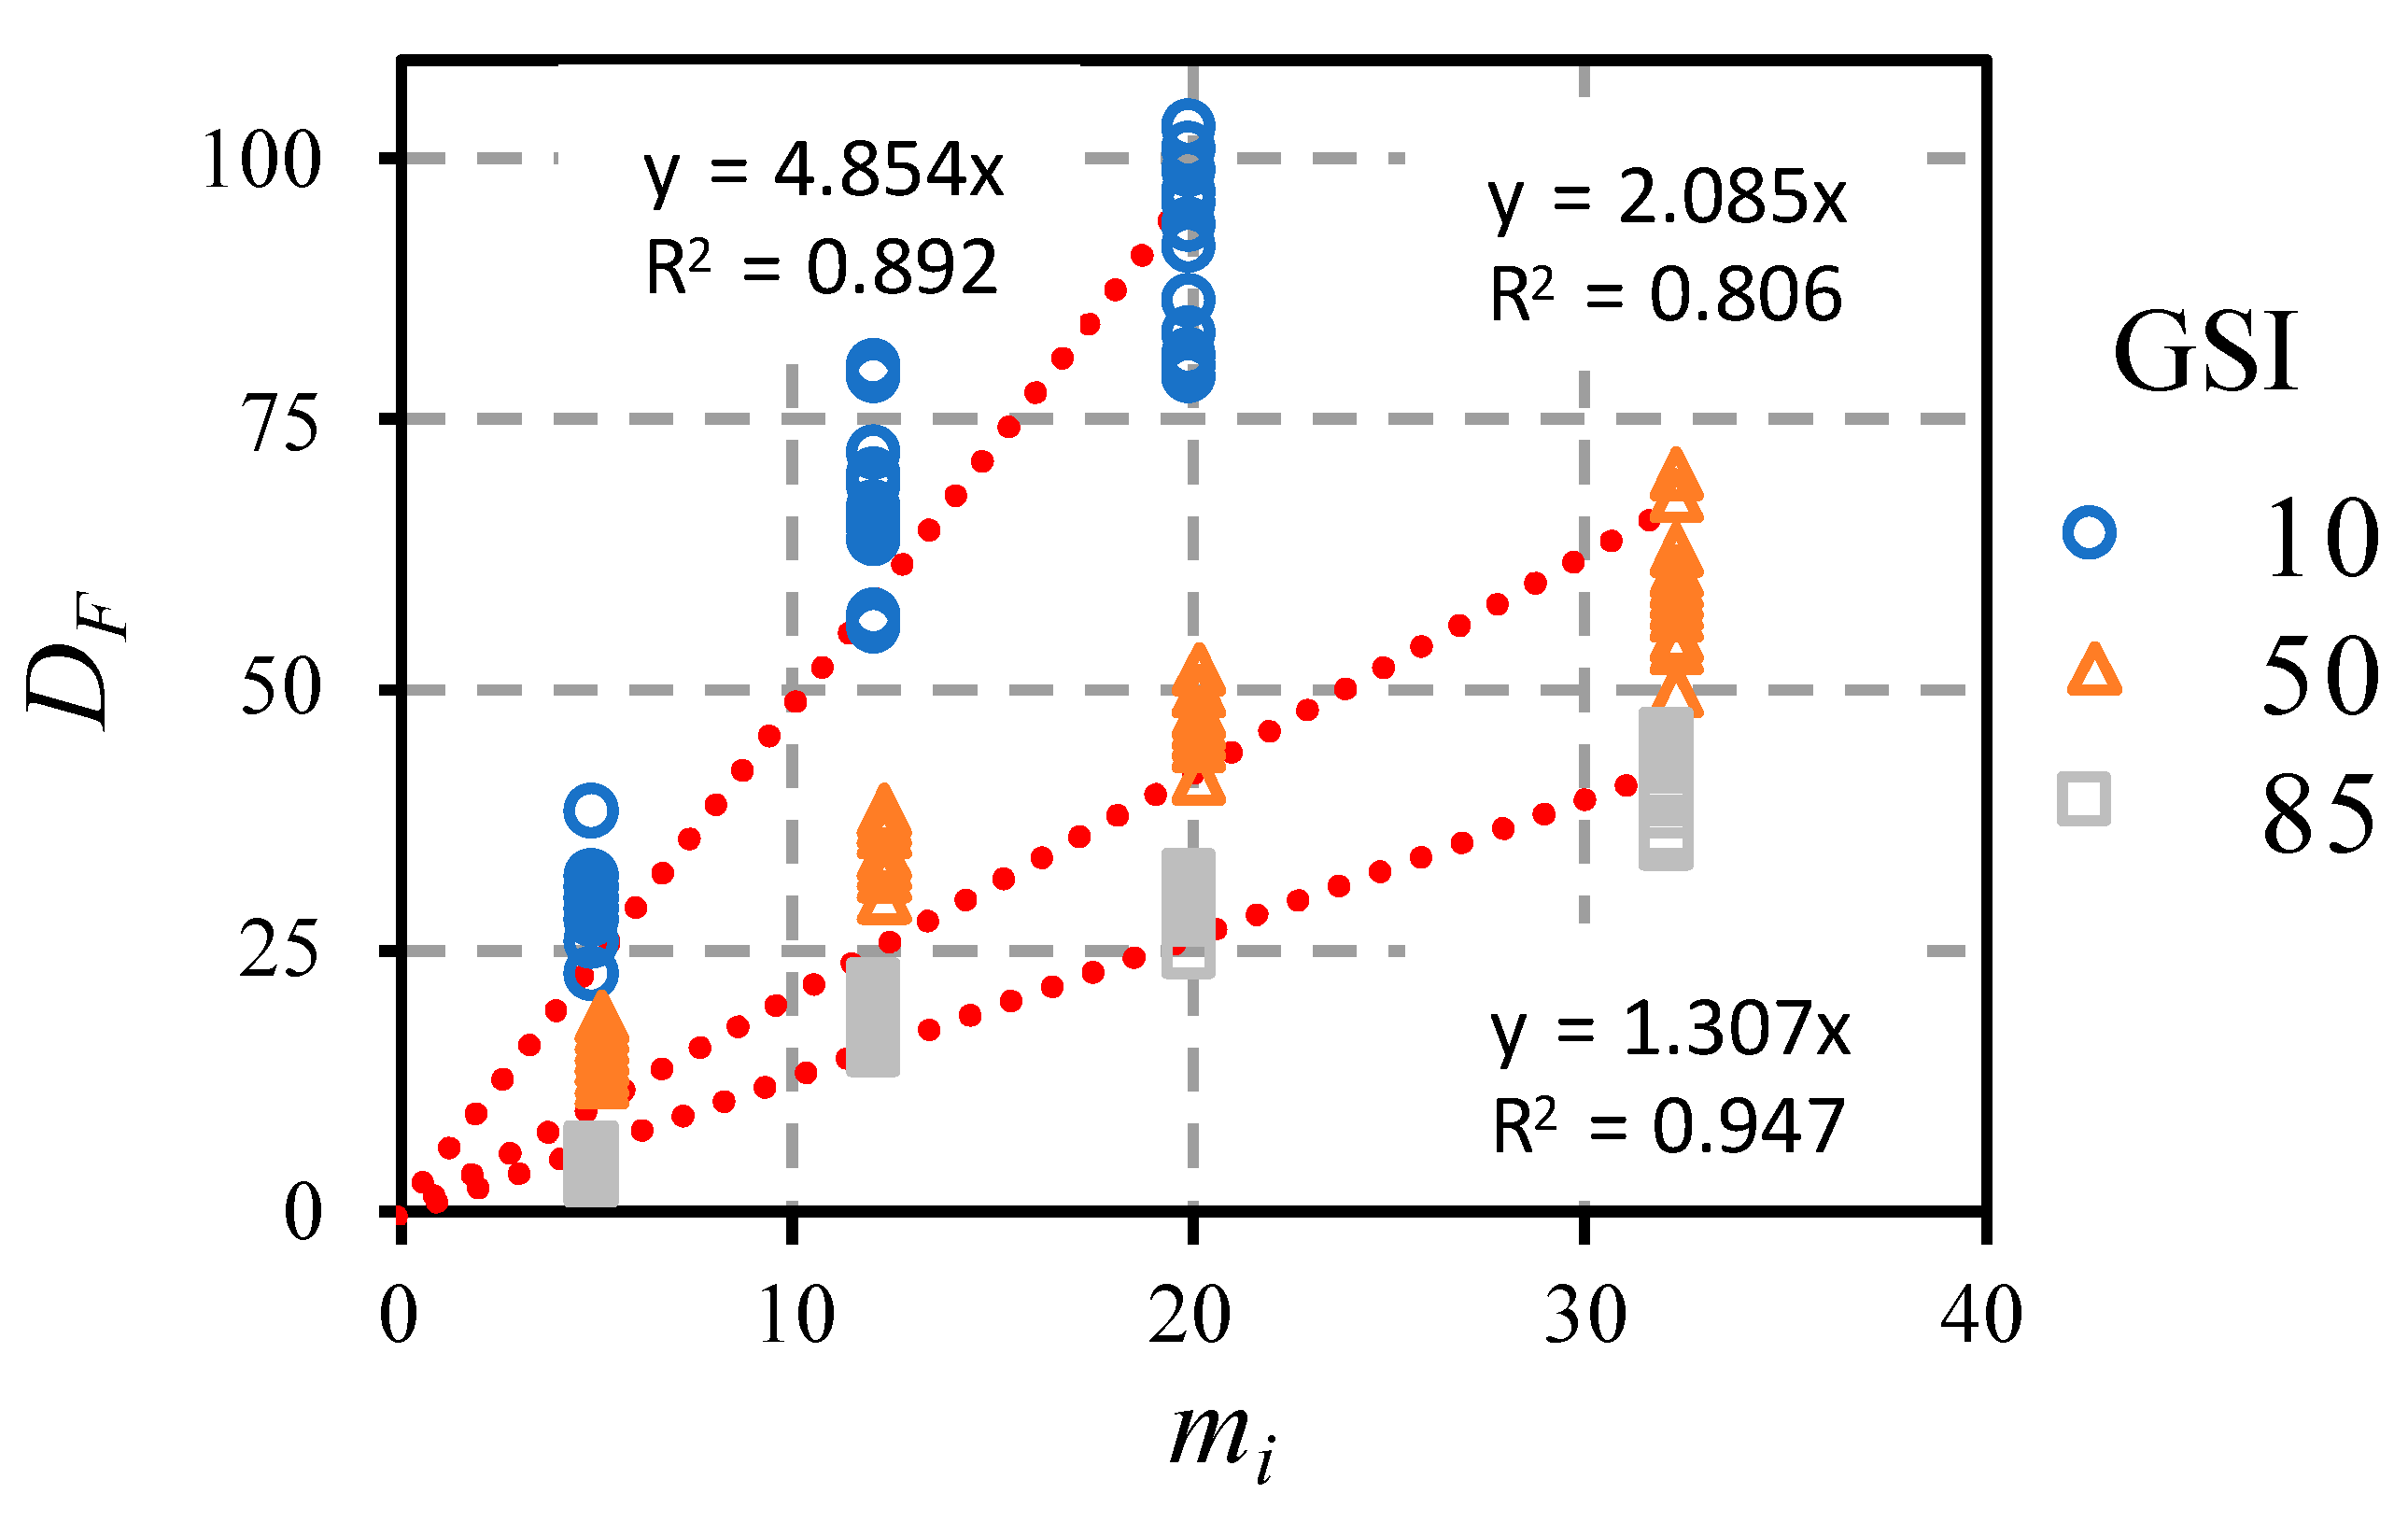
Knowing that the most influential parameters were
GSI and
mi, the correlation of the results for each value of the
GSI could be analyzed according to the rock type (
Figure 6) using three equations with acceptable correlation coefficients. In
Table 3, these equations are summarized.
Therefore, using the same equation structure to fit the different
GSI values in
Table 3, it was possible to formulate a single equation for DF based on
GSI:
If this correlation factor is applied to the bearing capacity value determined analytically by a formulation such as that of Serrano et al. [
18], the bearing capacity with the non-associative flow law with null dilatancy can be defined in a semi-analytical way. In this way, by means of Equation (3), the influence of the null dilatancy on the closed formula could be directly evaluated, without the need to use numerical models and convergence studies to obtain the final solution. The usefulness of this direct formulation without consideration of the self-weight must be emphasized, given that: (a) the self-weight generally has little influence on the result since its contribution is much lower than the resistance capacity in rocks; (b) not considering self-weight is always the safer option.
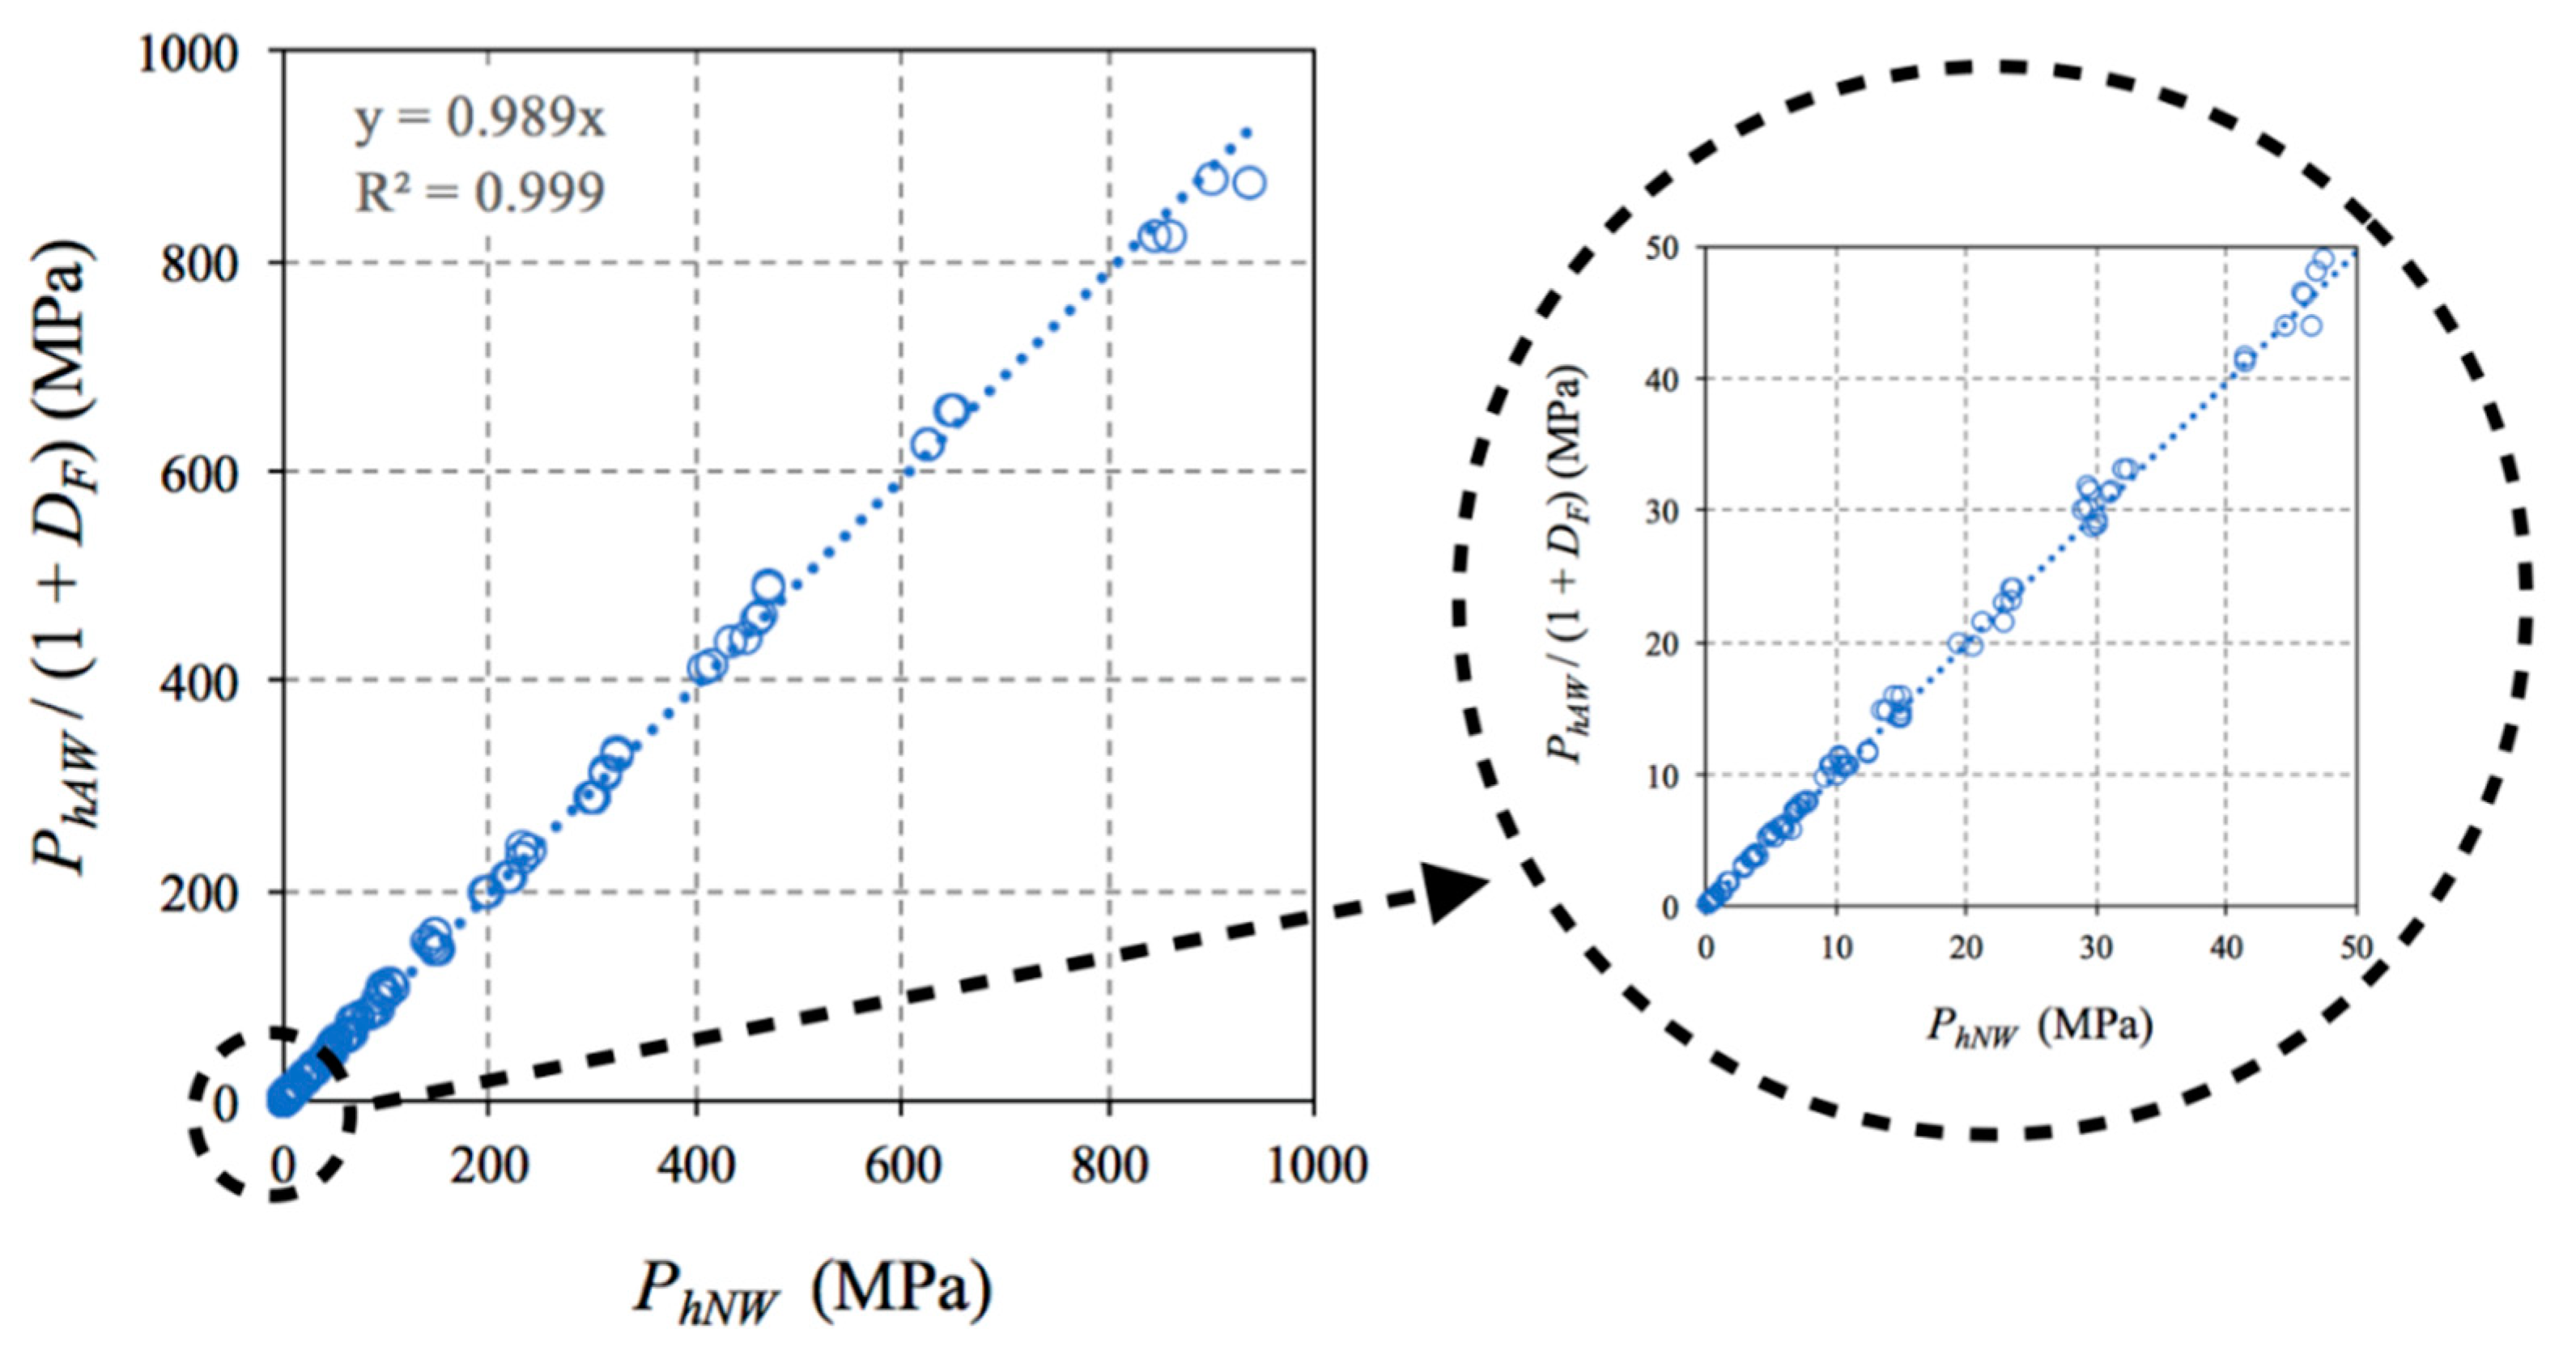
Figure 7 shows that the percentage variation calculated by Equation (3) had a good fit in the 192 cases that were studied, with a variation between the results that did not exceed 2%, emphasizing that most of the results were concentrated in the initial area of the graph.
3.2. Displacement Analysis
In the numerical calculation, a stress path was formed until the failure was reached, taking into account the whole wedge of the ground below the footing. The graphic output of the displacements (horizontal and vertical) developed below the foundation using FDM are presented in this section to understand how the failure mechanisms affected the results.
It is emphasized that the wedges developed in the cases with associative flow law were clearly defined. Independently of the hypothesis of the flow law adopted, the horizontal and vertical displacements grew with the increasing of GSI and mi.
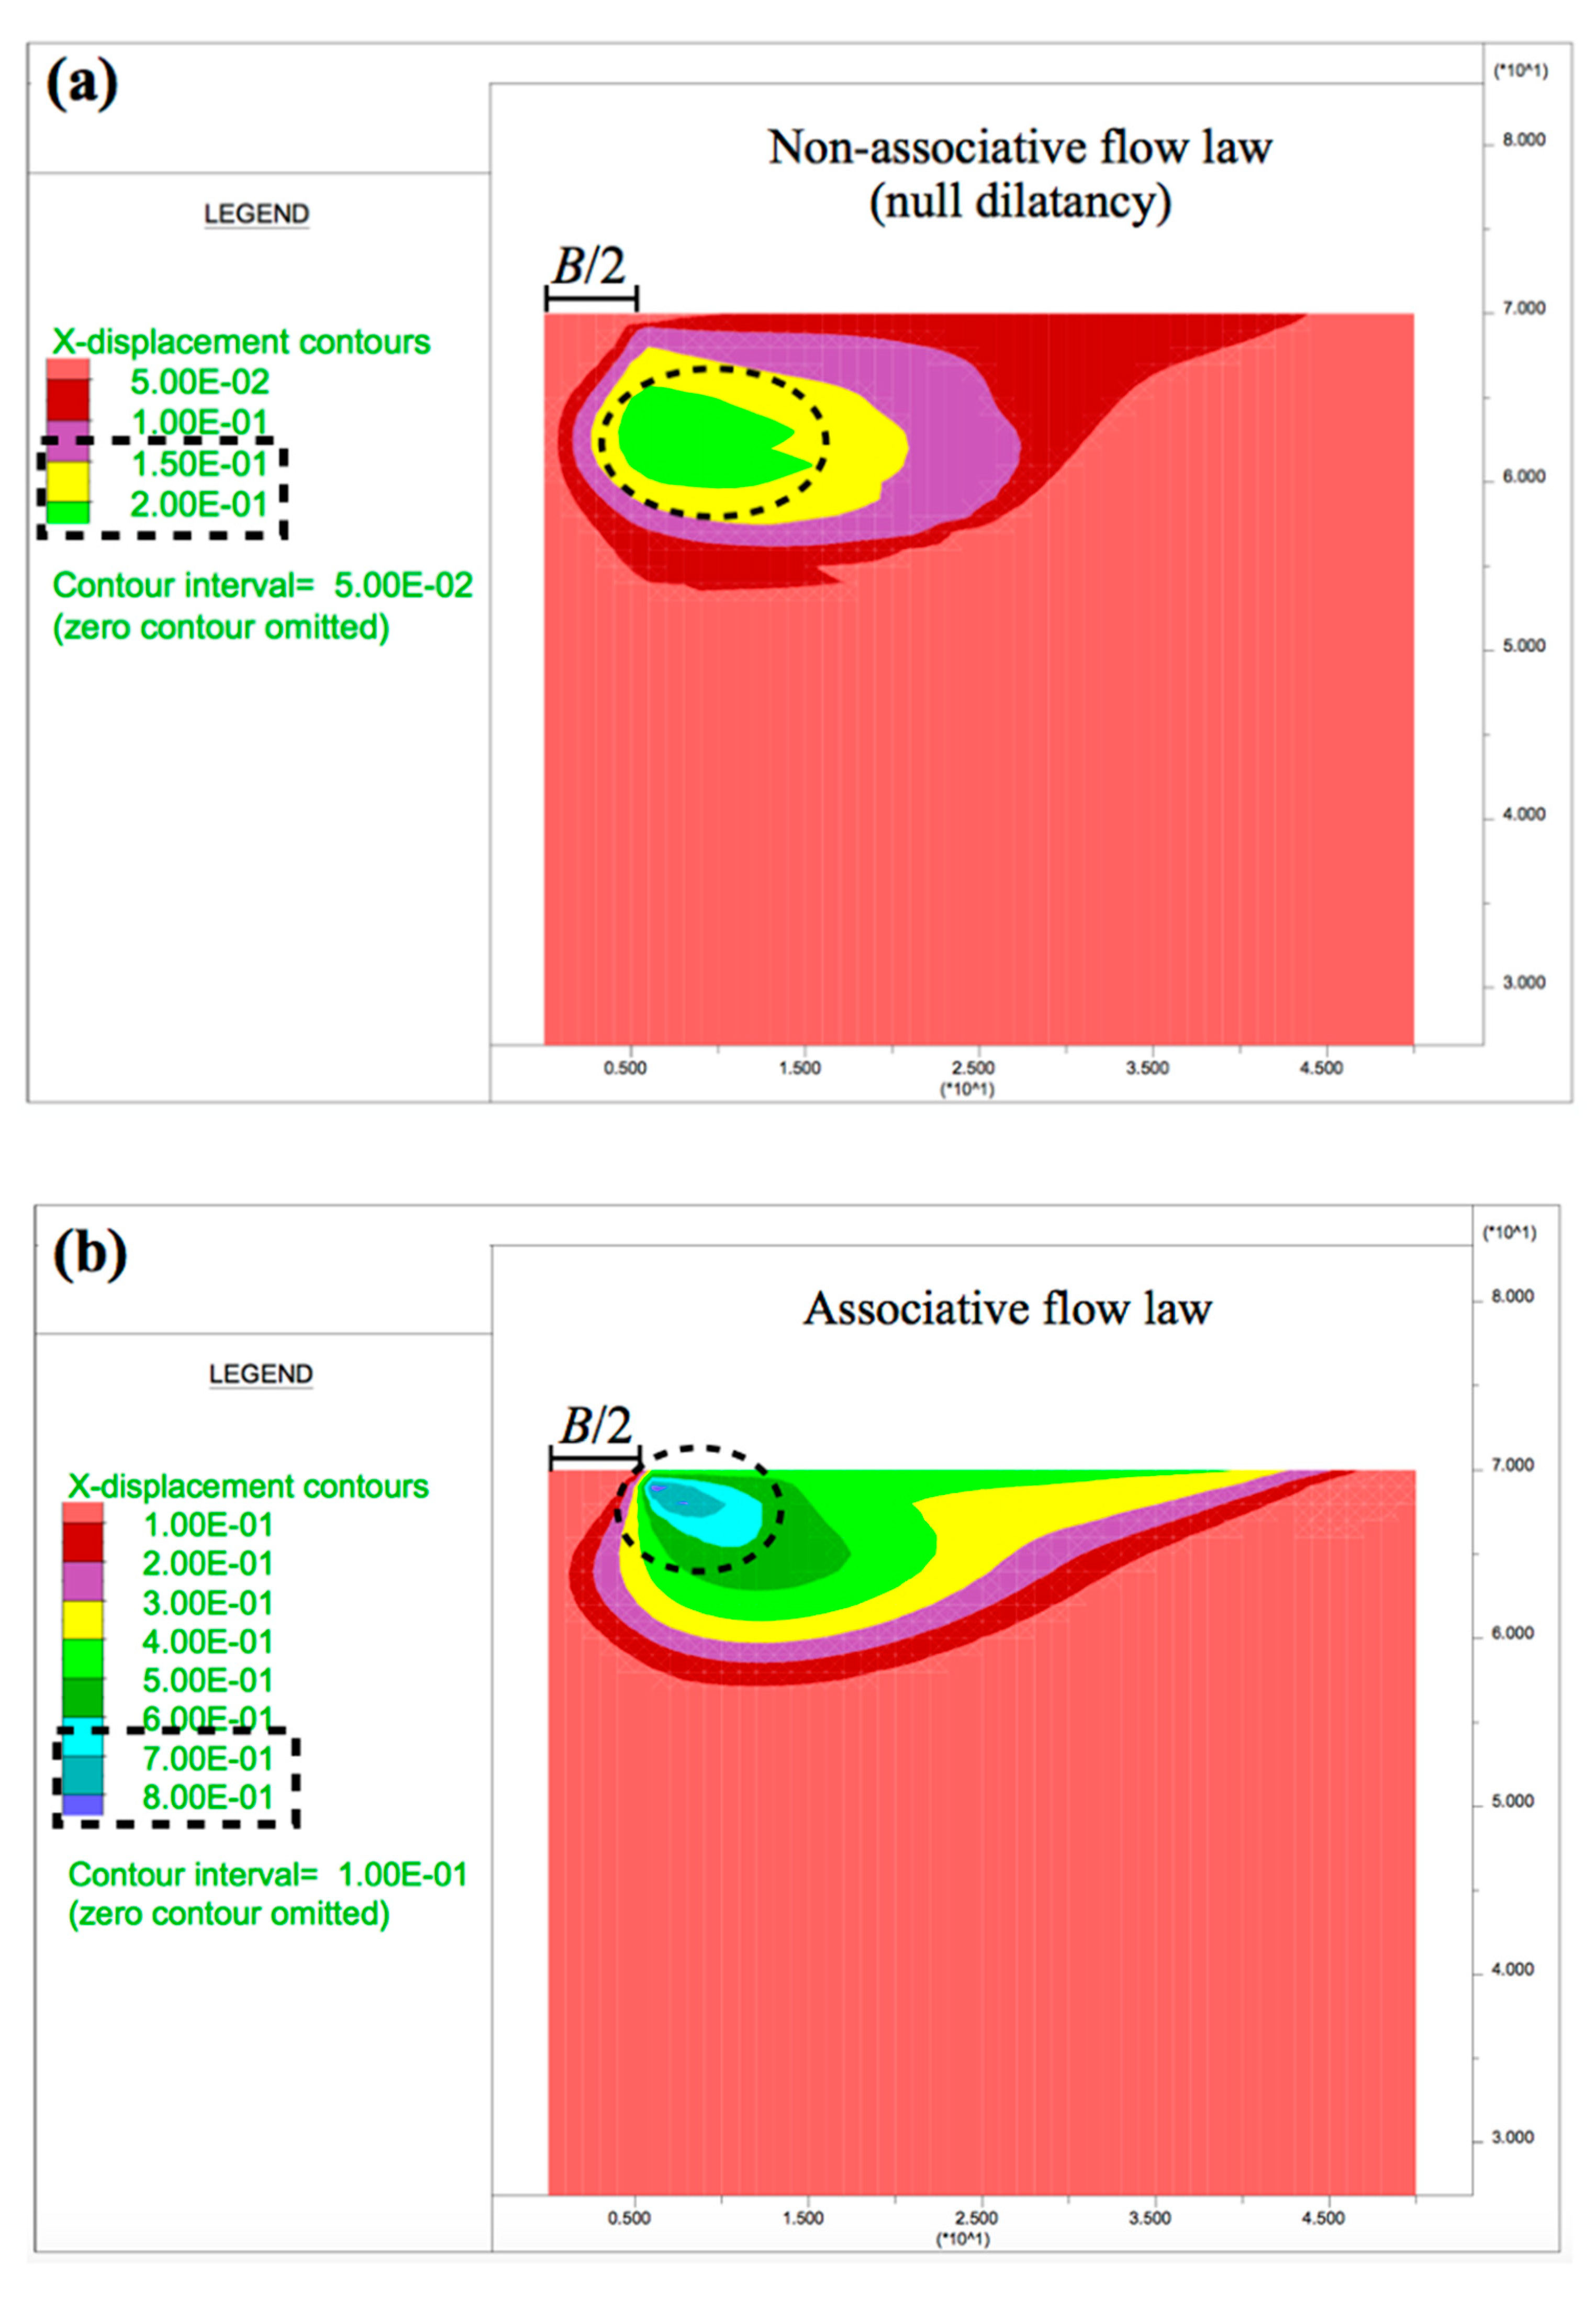
In relation to the horizontal displacement, in
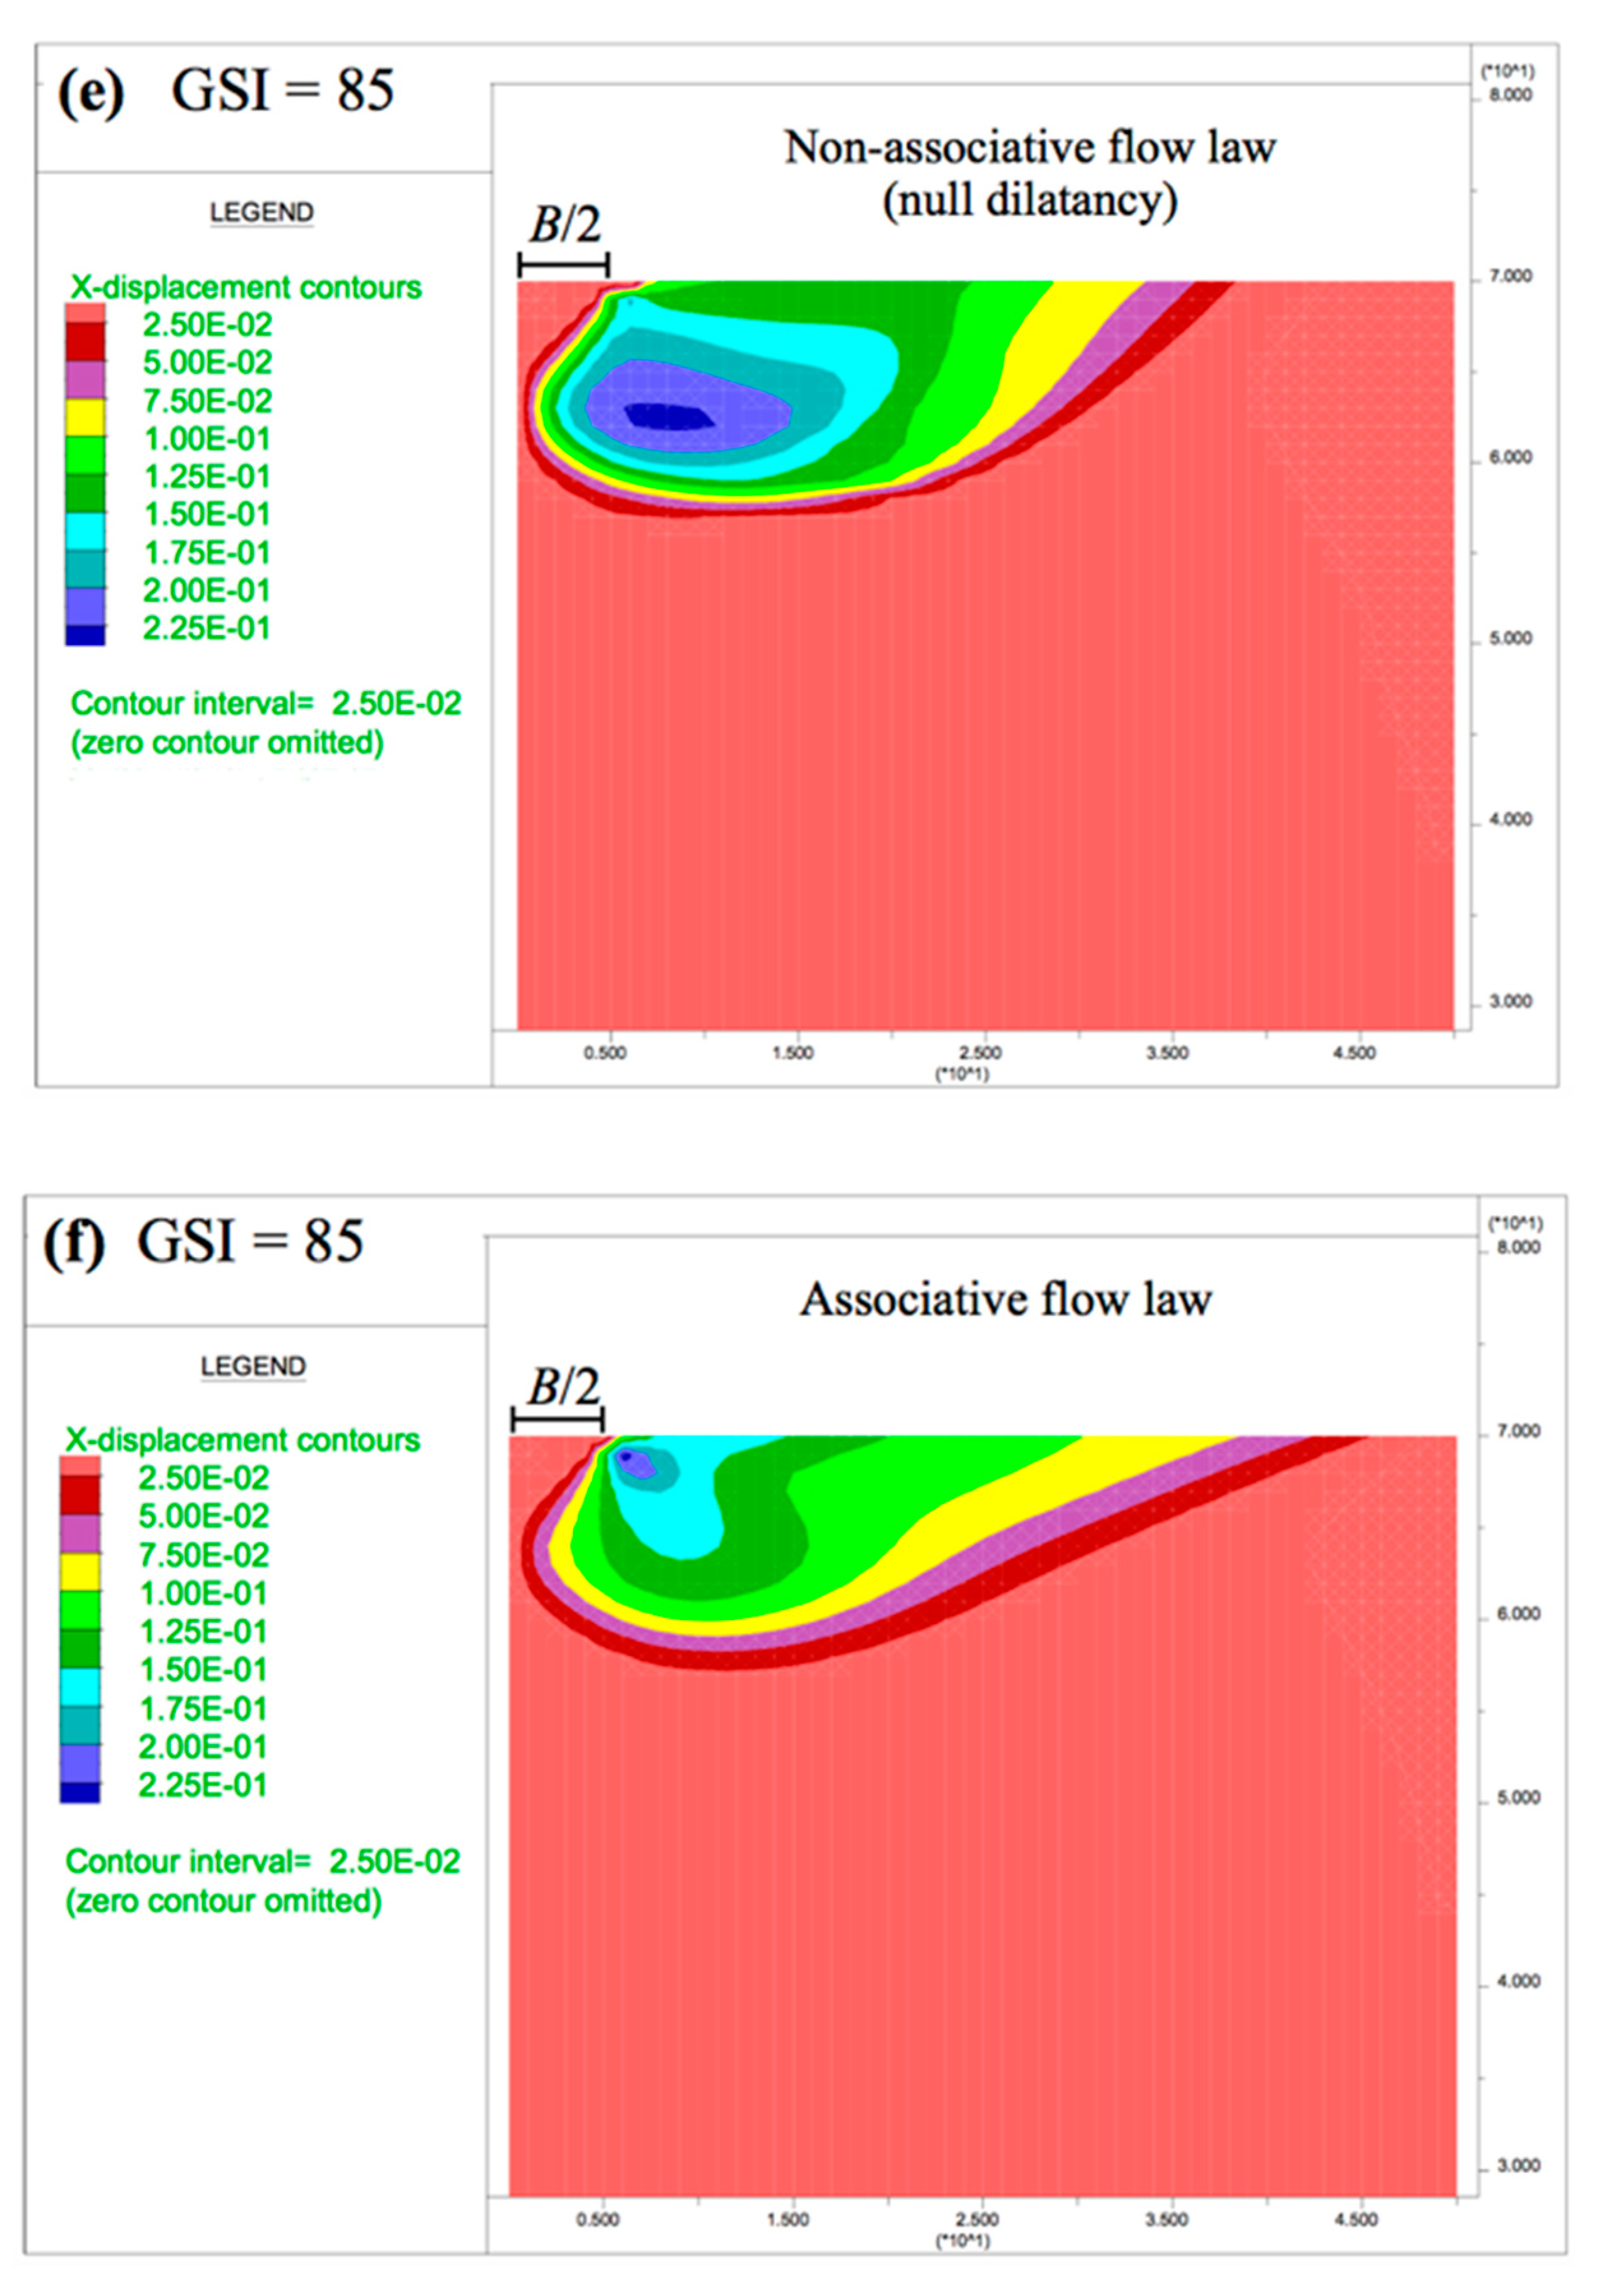
Figure 8, it can be observed that with the associative flow rule, more horizontal displacements occurred in comparison to the same case with the non-associative (null dilatancy) flow law. In addition, in cases with the associative flow rule, the points of the maximum horizontal displacement were located close to the ground surface and under the exterior edge of the foundation. In cases with the non-associative flow rule, the same points were displaced horizontally to the area under the foundation and vertically at deeper zones.
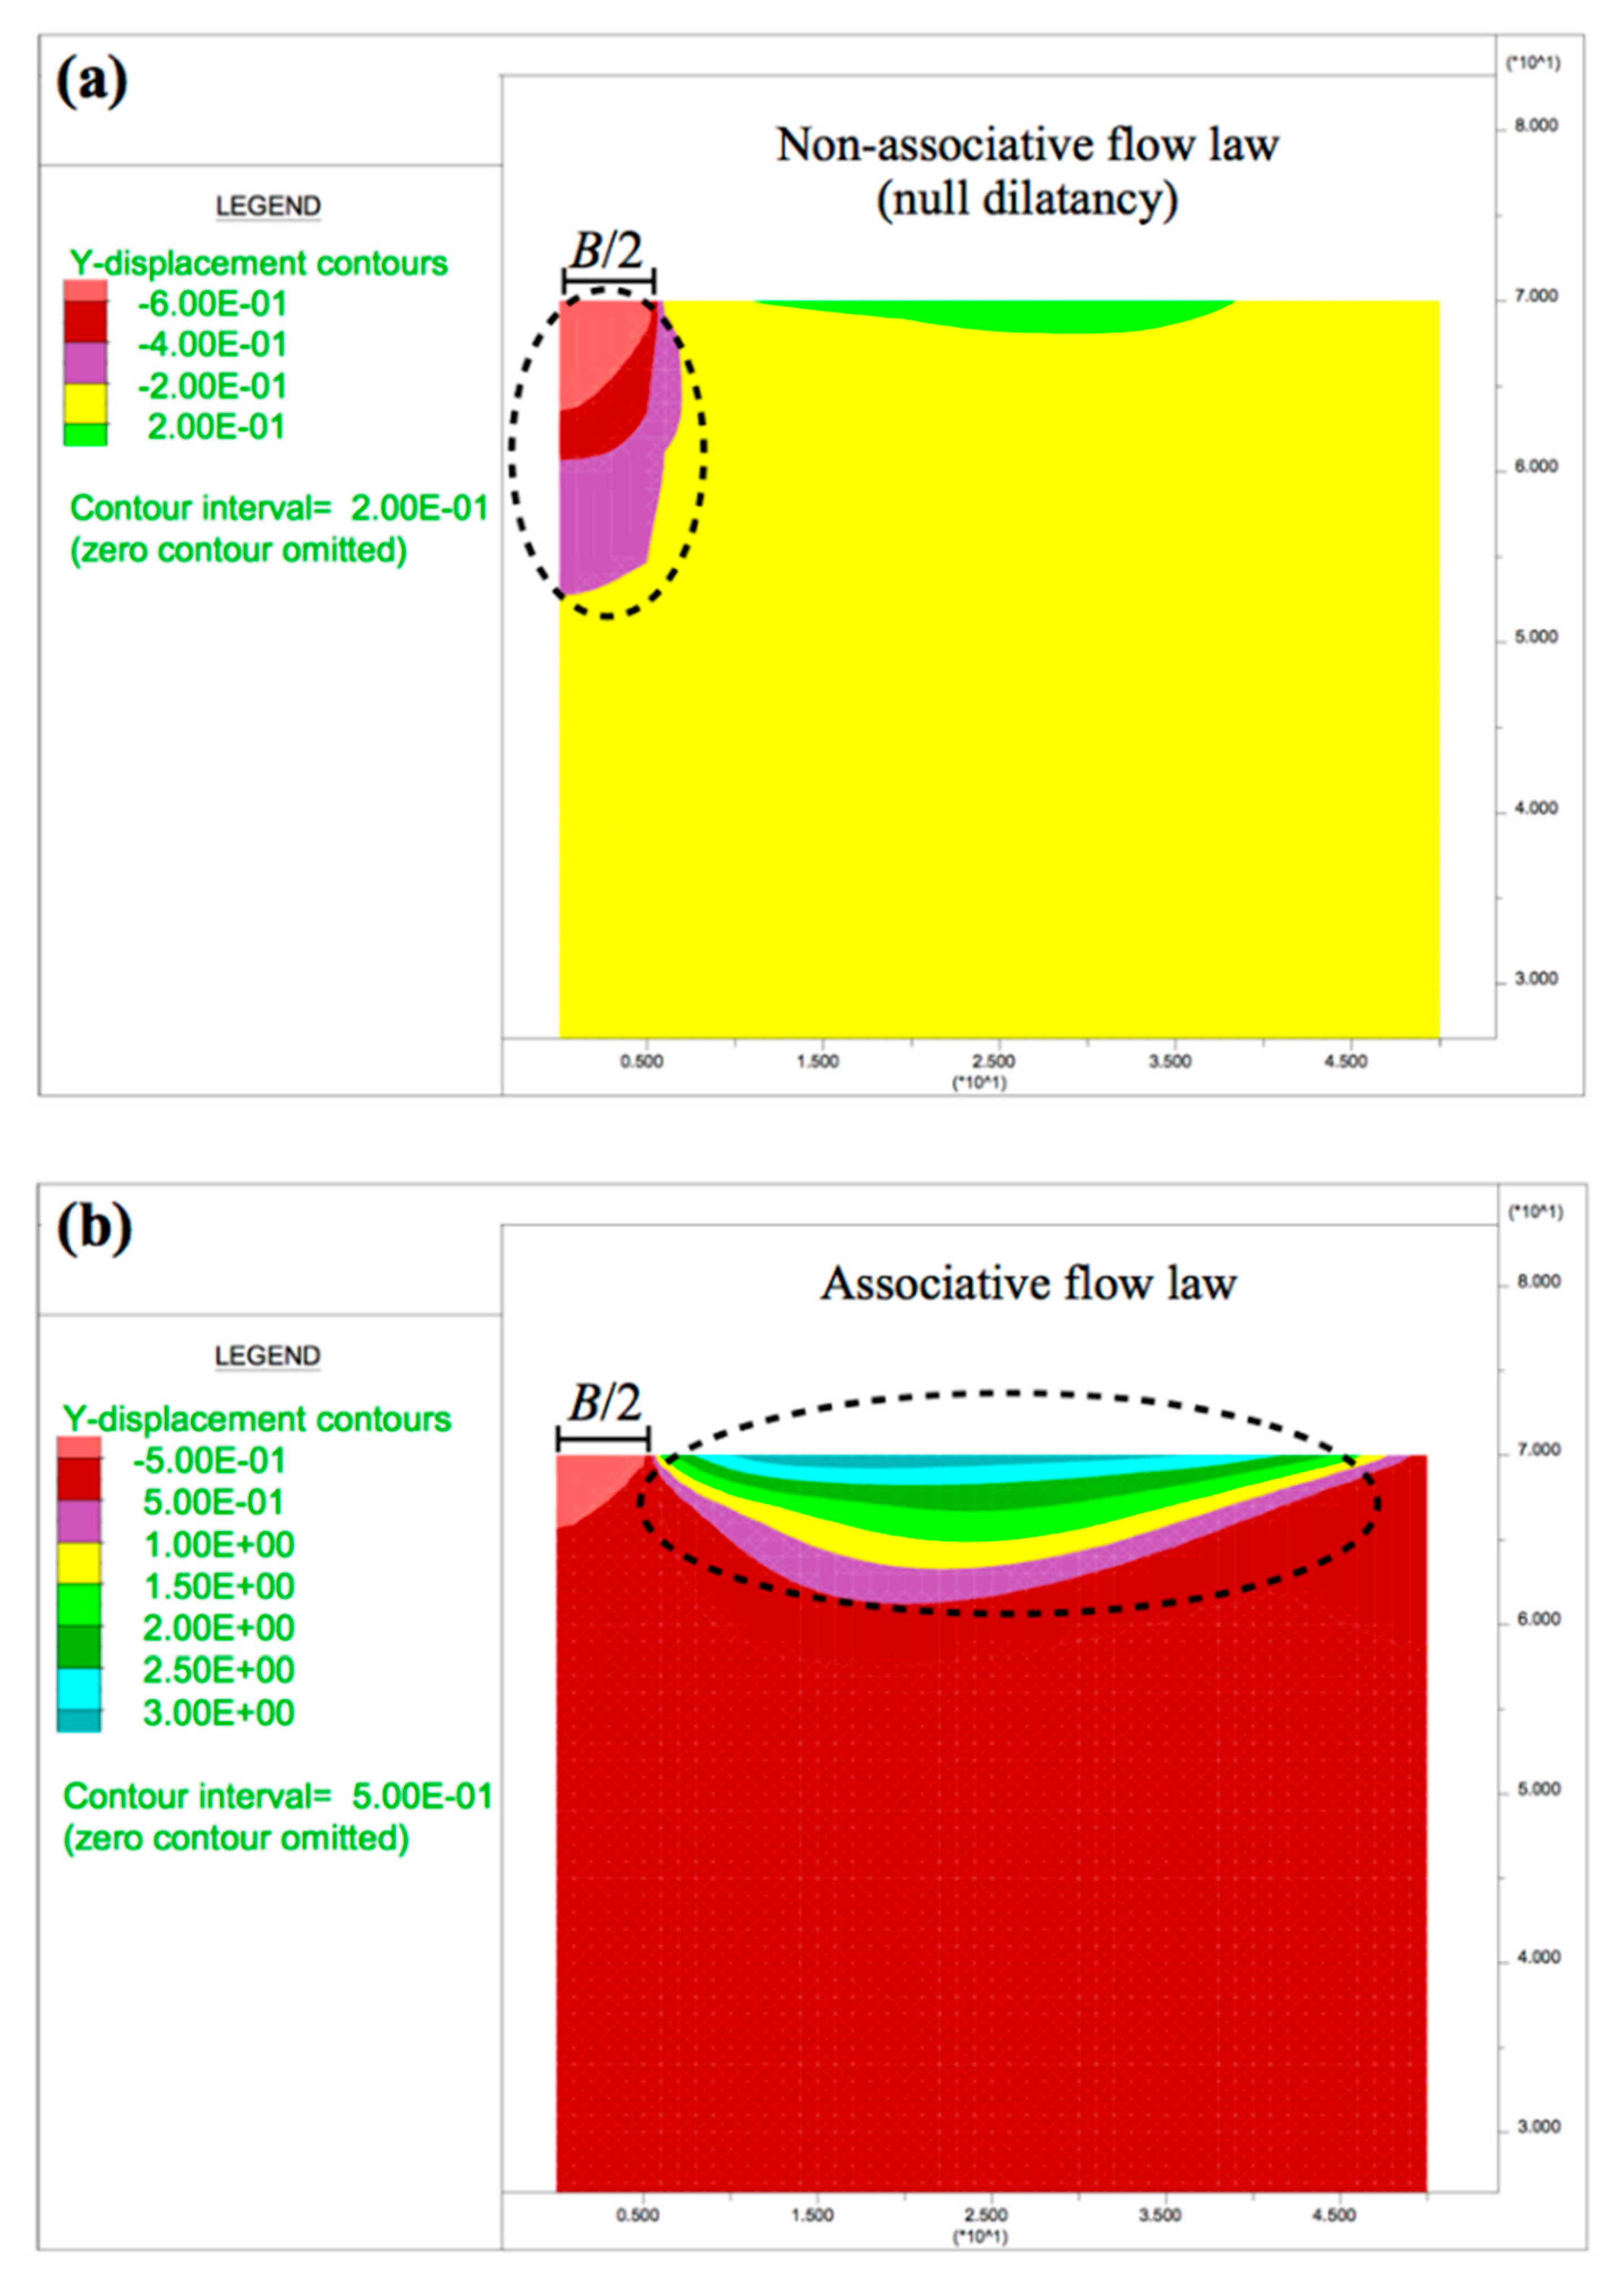
The vertical displacements presented a greater variation depending on the flow rule adopted (
Figure 9). With the non-associative (null dilatancy) flow rule (
Figure 9a), the vertical displacements were concentrated under the footing, while in the cases of the associative flow law (
Figure 9b), the lateral ground near the foundation was more affected.
4. Bearing Capacity Considering the Self-Weight of the Rock Mass
In this section, in contrast with the hypothesis adopted and the results presented in
Section 3, the self-weight of the rock mass is considered. The same procedure is applied, the results obtained with the non-associative flow law with null dilatancy (
PhNS) are compared with those obtained with the associative flow rule (
PhAS).
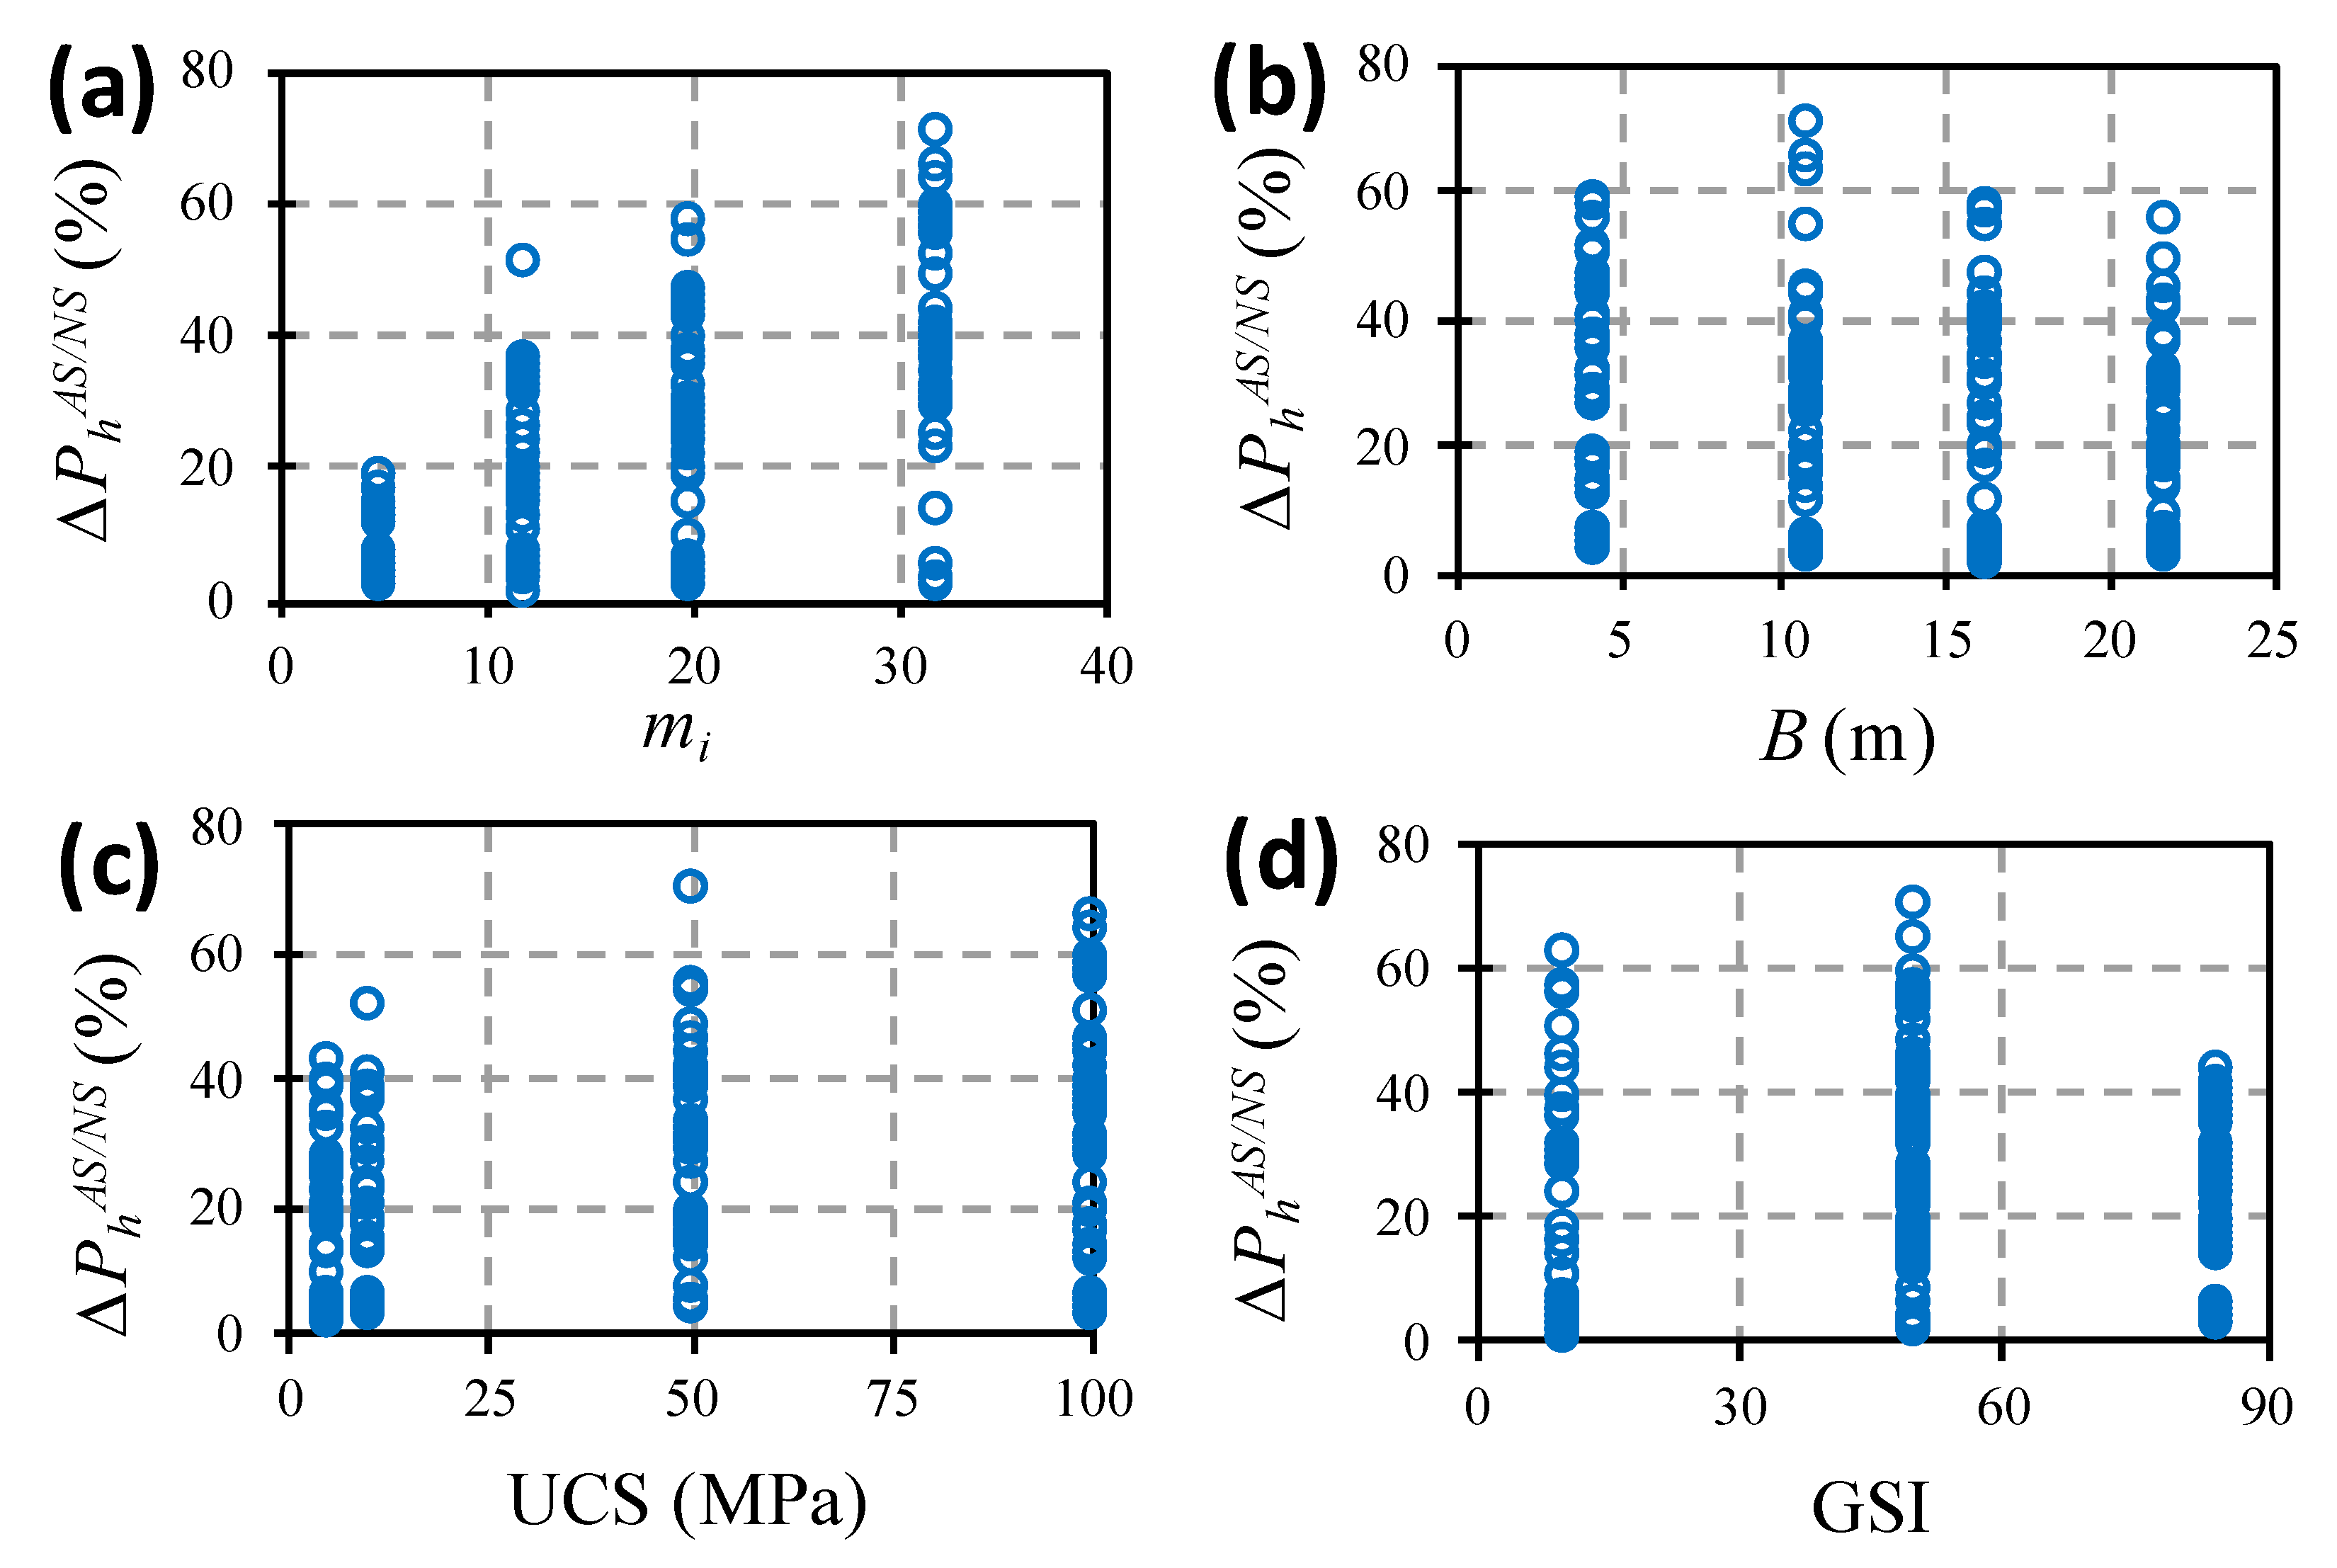
Figure 10 shows that the dispersion ranges observed in
Section 3 (
Figure 3) were not similar to the cases with self-weight. From this figure, it can be concluded that the parameters that influenced the
were
GSI,
mi and
UCS.
From
Figure 10a, it can be observed that the difference between
PhNS and
PhAS, as well as the dispersion of the results, grew with the increasing of
mi. The cases with lower
mi (
mi = 5) presented a variation below 20%, while for higher
mi (
mi = 32), the variation could exceed 65%.
Observing
Figure 10b, it can be concluded that the width of the foundation (
B) had little effect on the dispersion of the results.
In relation to the
UCS,
Figure 10c shows that the variation between the results increased slightly with the increment of
UCS. For low values of the
UCS (5–10 MPa), the dispersion was in the order of 0 to 40%, while the cases with
UCS = 100 MPa presented a range that varied between 0 and 65%.
Figure 10d does not show a clear trend of influence in terms of the function of the
GSI.
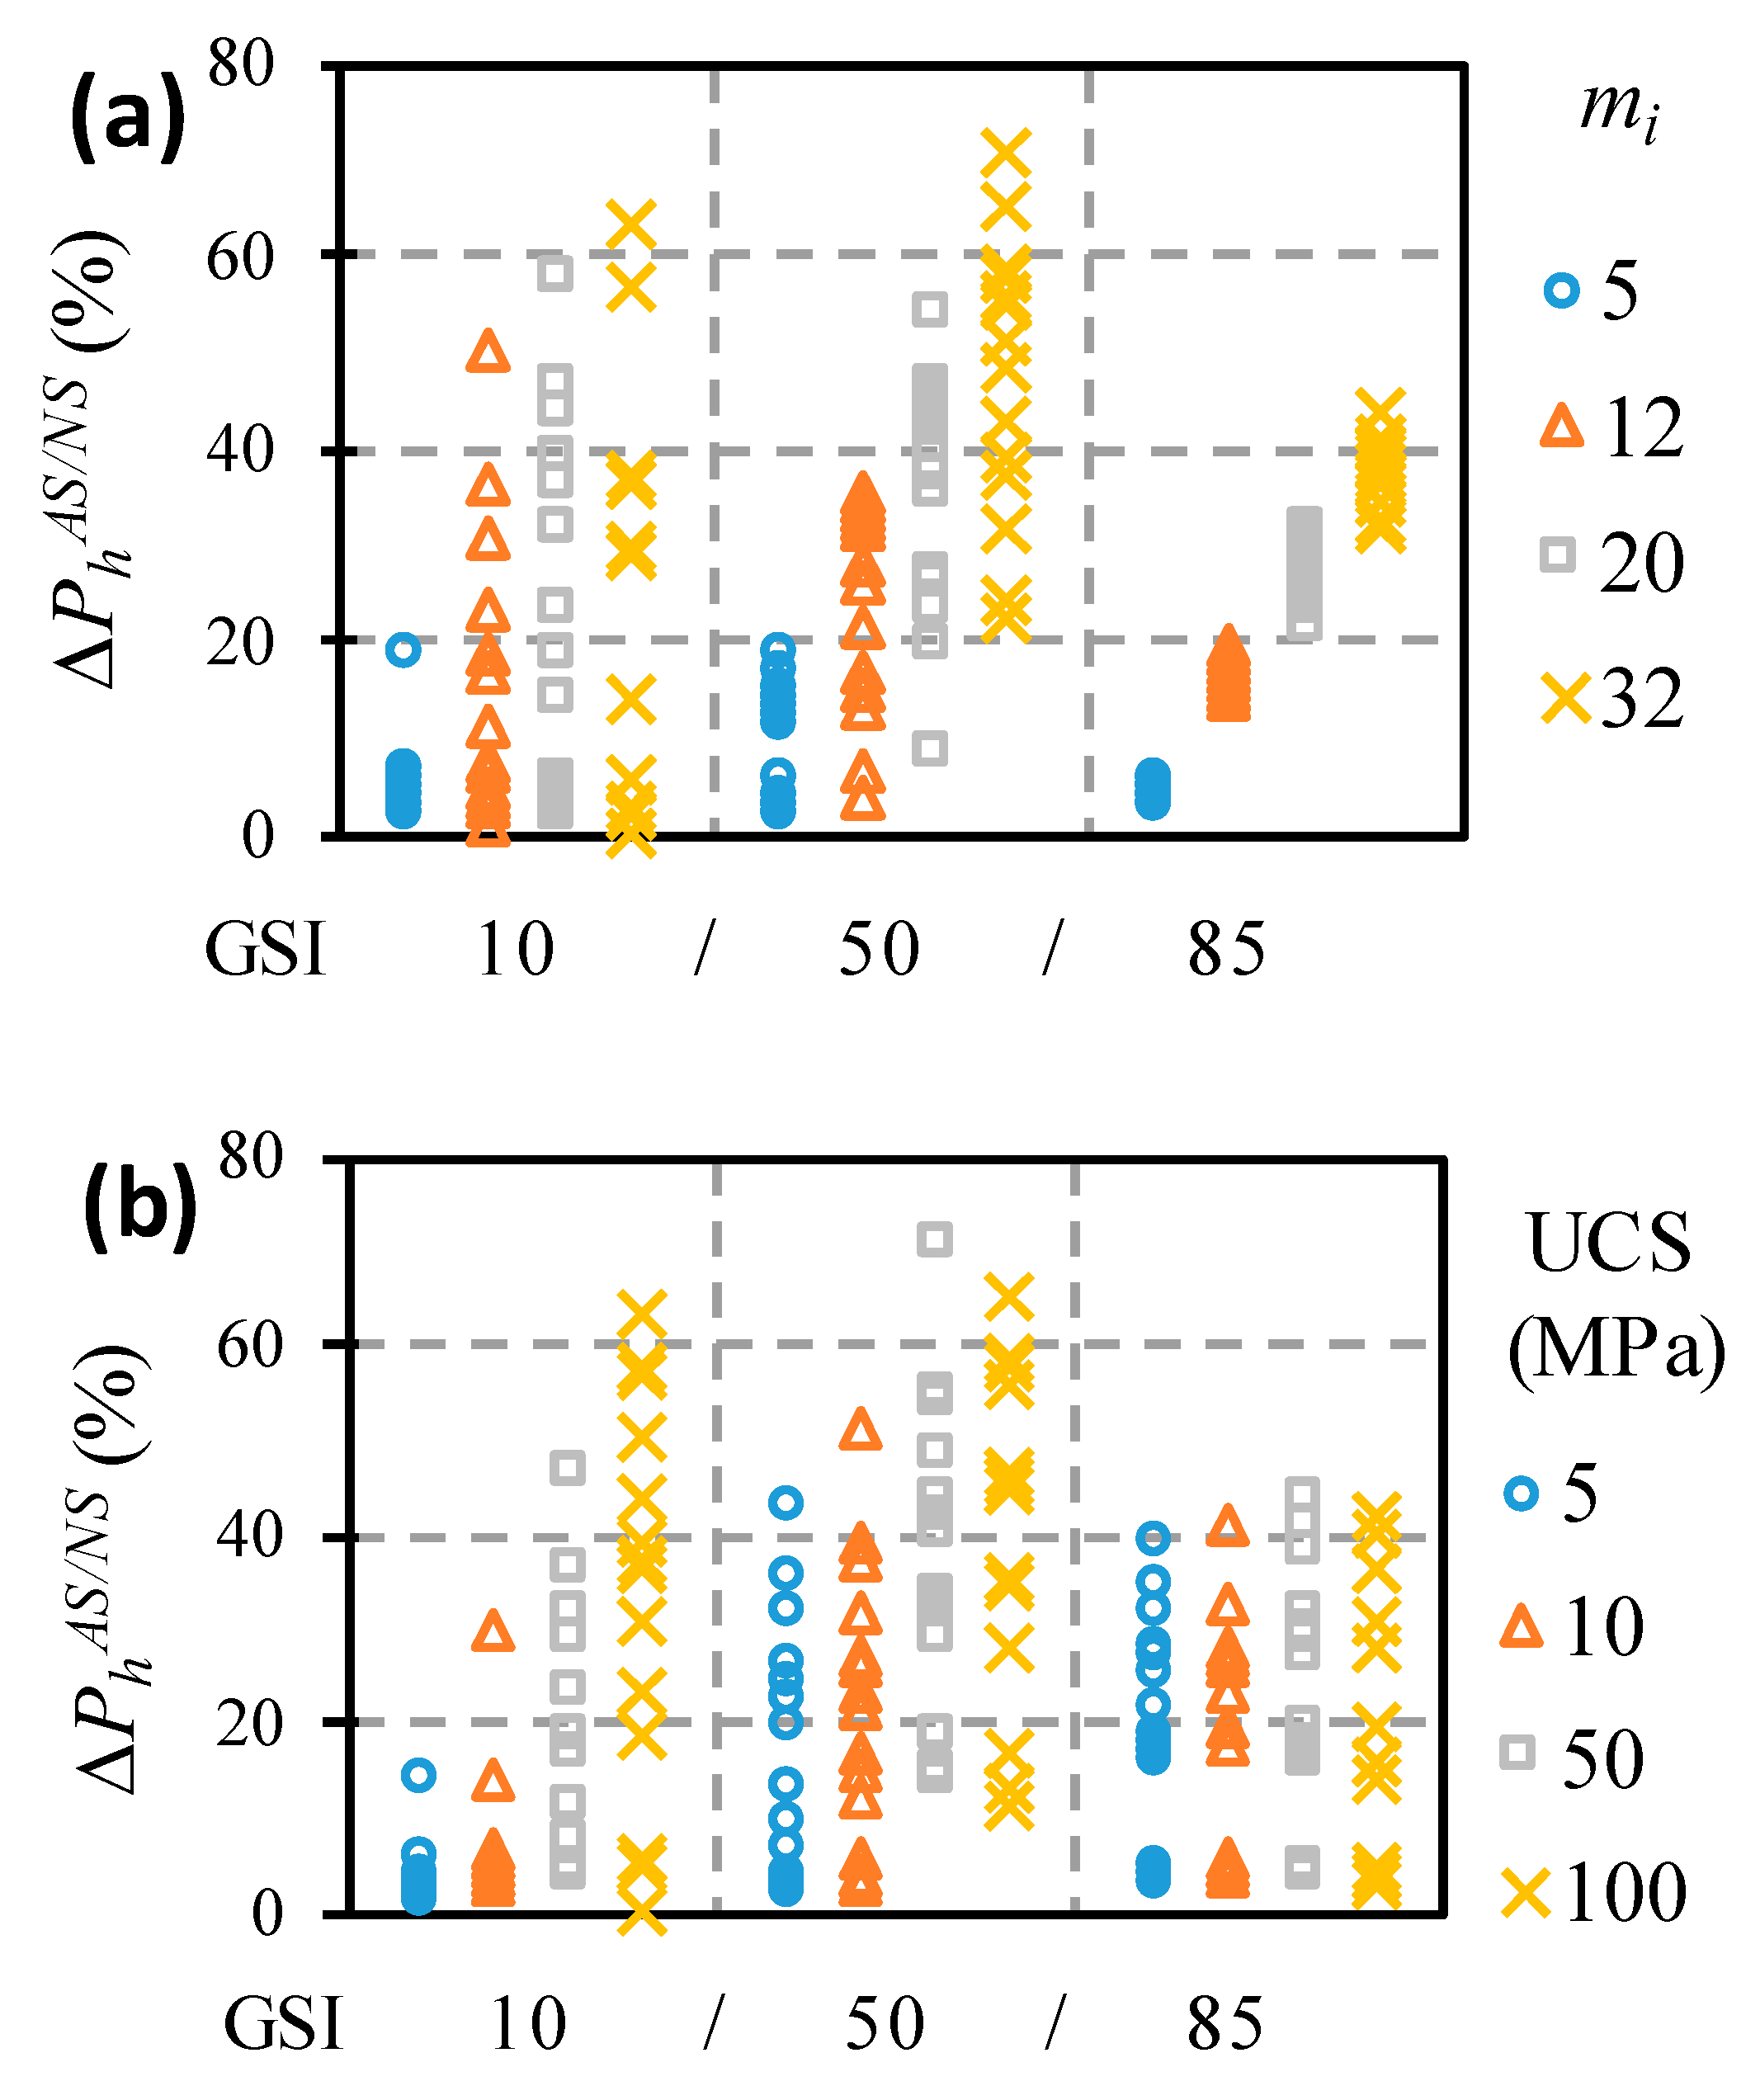
In
Figure 11, it is observed that the influence of the
UCS and
mi on the correlation between the results depended on the value of the
GSI. Concluding that the
GSI was the most dominant parameter, in
Figure 11a, it is observed that the dispersion range decreased with the increment of the
GSI, and in
Figure 11b, it can be seen that for greater values of the
GSI (
GSI = 85), the value of the
UCS had little effect on the dispersion of the results. Furthermore, it was observed that both the average value and the dispersion in the variation of the bearing capacity increased at higher values of the parameter
mi.
In
Figure 11b, it is observed that for the combination of low
GSI and
UCS, the variation of the flow law type had very little effect on the correlation of results for
PhAS and
PhNS (less than 10%). This was due to the fact that the majority of the bearing capacity was associated with the self-weight of the rock mass.
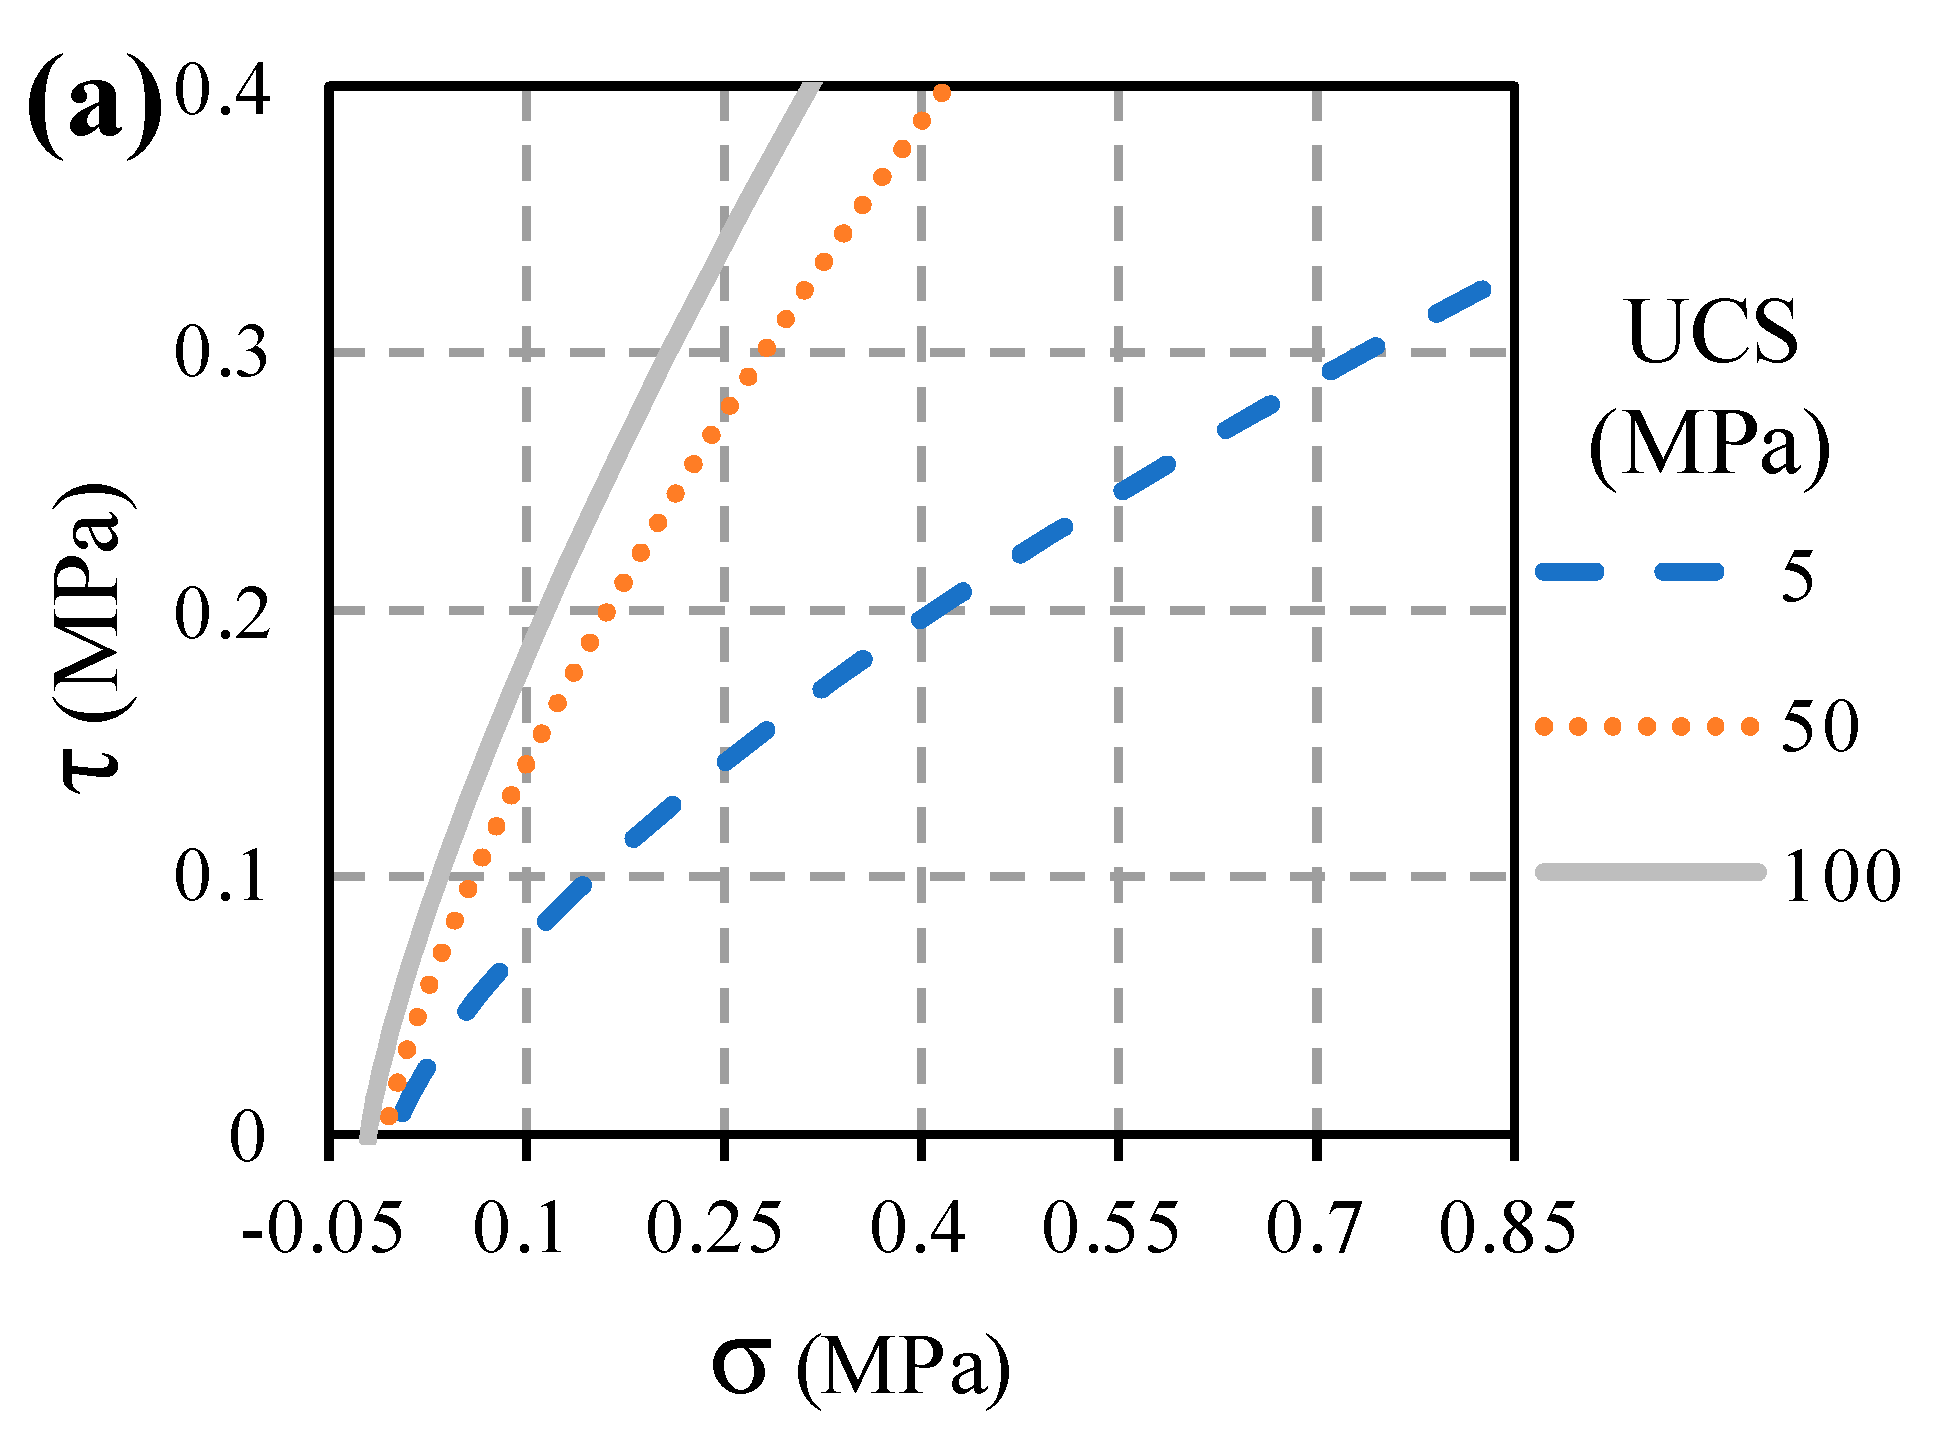
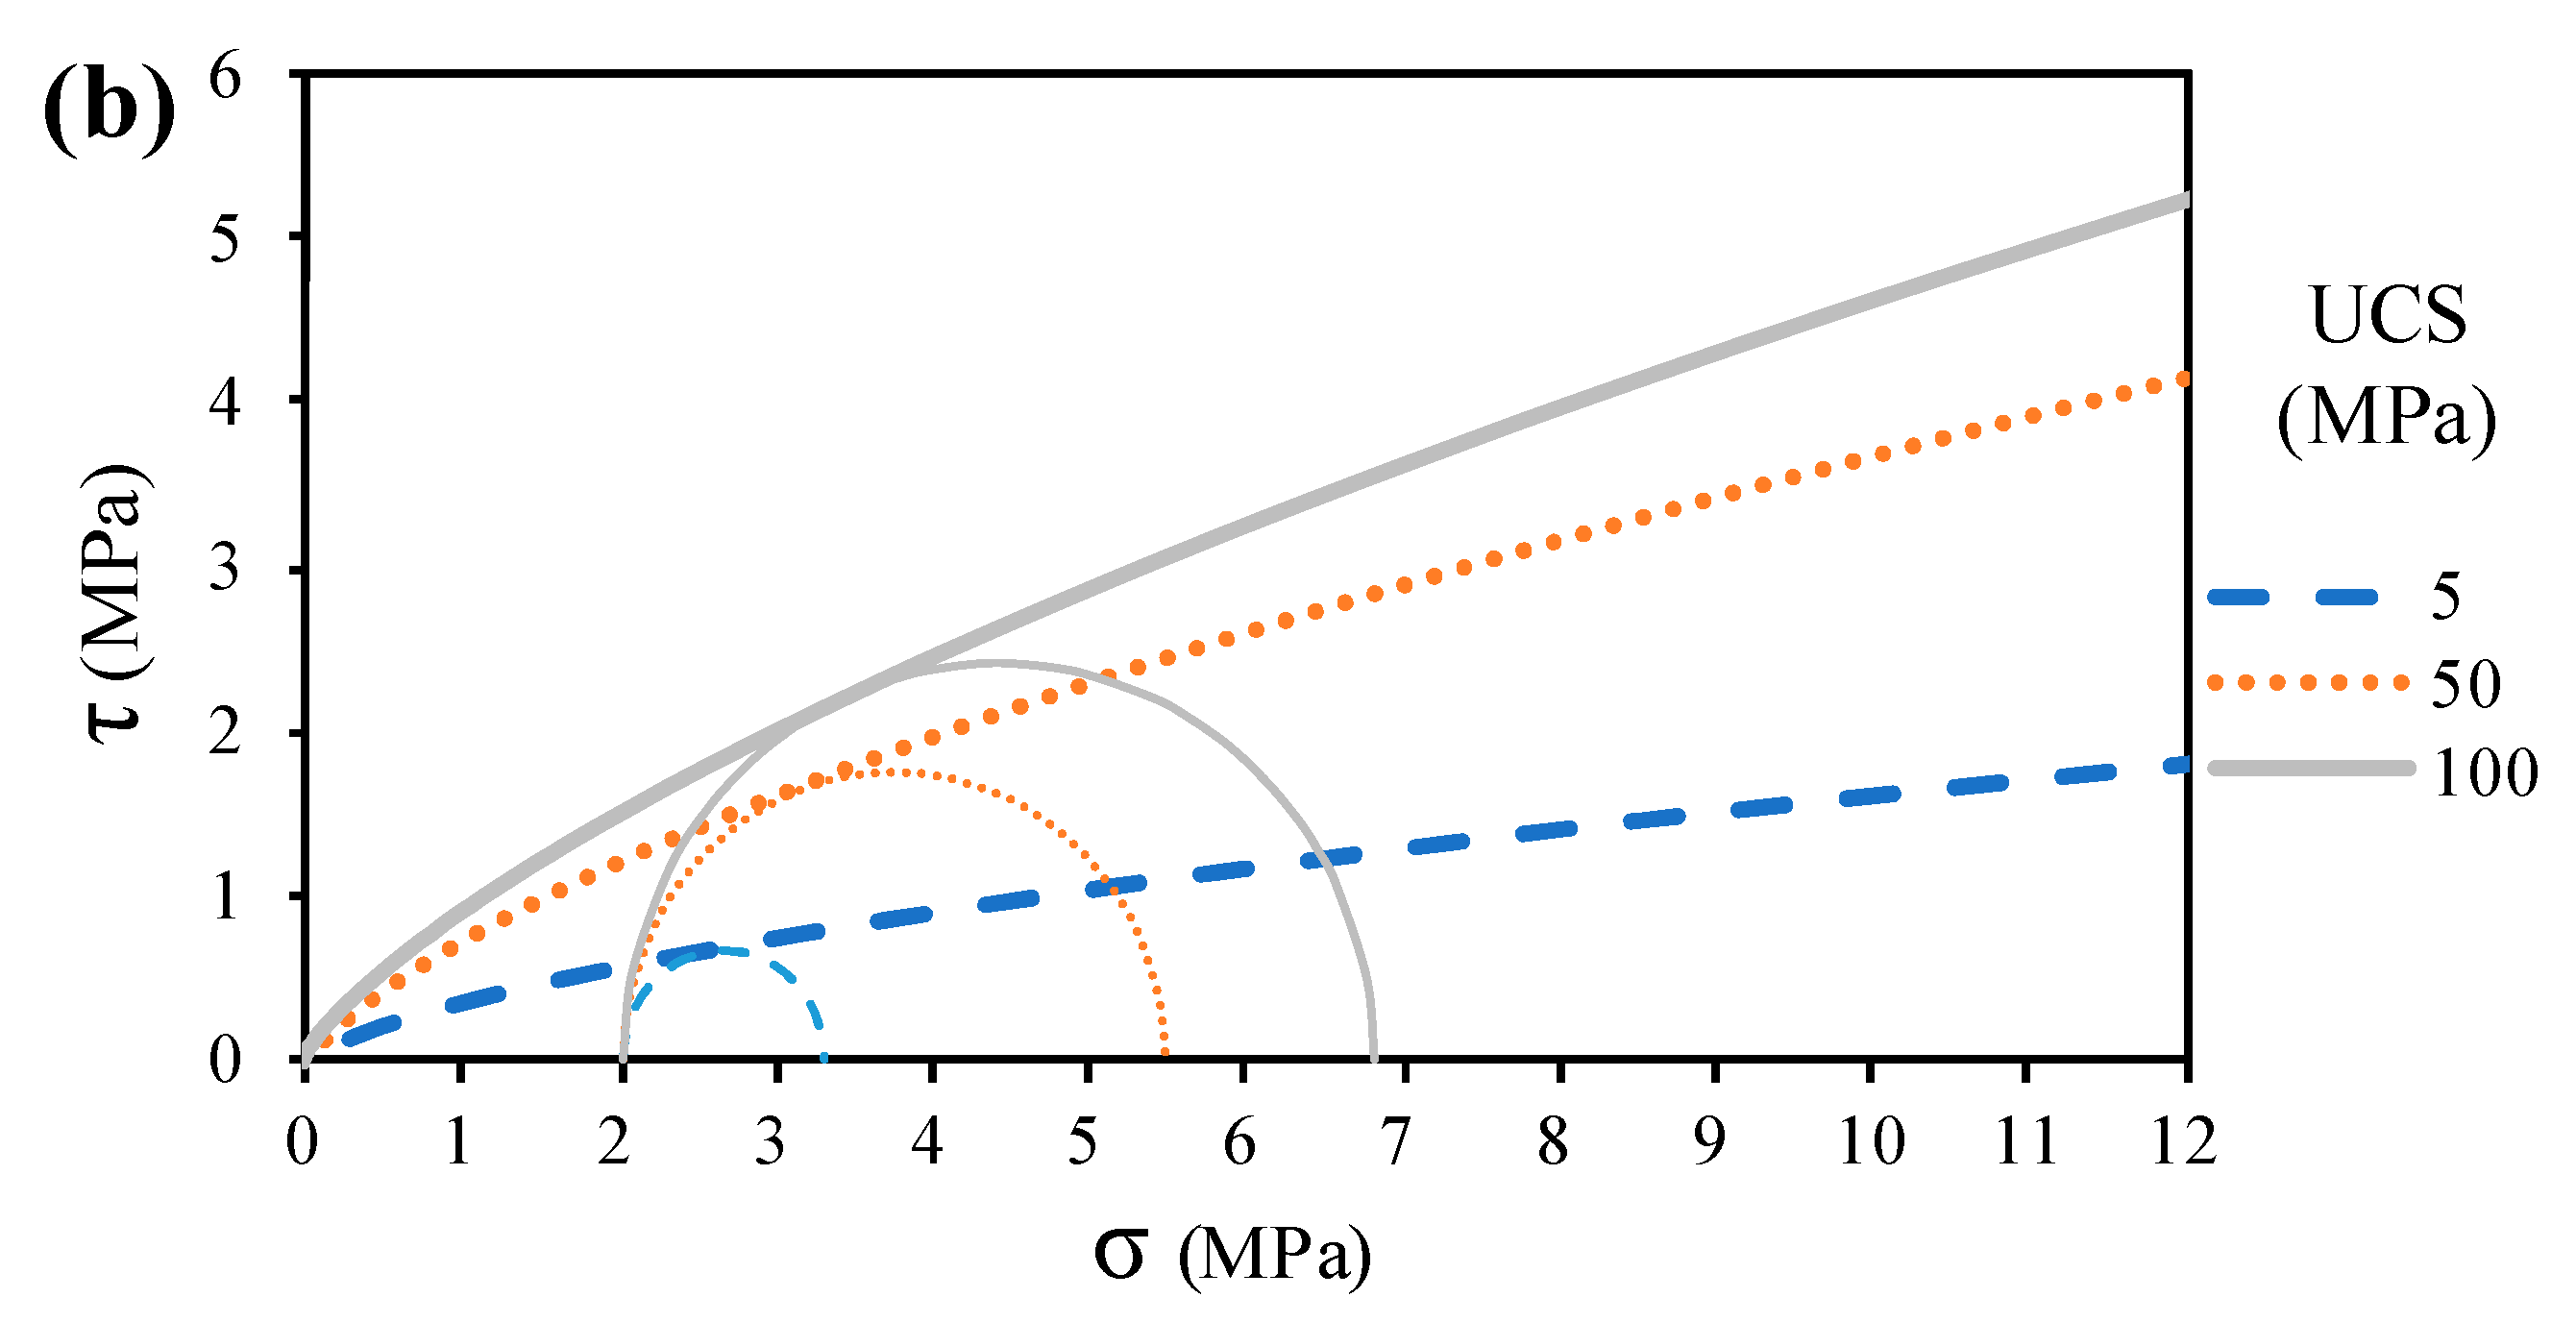
The self-weight of the material tended to increase the normal stress, as can be seen in the diagram representing the failure criterion (
Figure 12). In addition, the inclination of the Hoek and Brown failure envelope depended directly on the value of the
UCS (
Figure 12); for this reason, in the cases of the low values of
UCS, the envelope tended to become horizontal quickly (even for low stress states).
Thus, when the self-weight of the material is considered, in cases with low
UCS and
GSI, the normal stress was higher, and thus, the Mohr circle intercepted the Hoek and Brown failure envelope in the almost-horizontal sector (
Figure 12b). In those cases, the value of the instantaneous internal friction angle was small; consequently, the value of the associative dilatancy angle was also small. Therefore, the variation of the bearing capacity calculated with the associative and the non-associated (null dilatancy) flow law was very small, due to the fact that the value of the associative dilatancy angle was small.
Furthermore, in theory, the influence of the self-weight of material on the bearing capacity reduces with the increase in the
UCS. For this reason,
Figure 11b shows that the influence of the dilatancy grew for higher values of the
UCS.
On the other hand, the self-weight of the rock mass did not influence the bearing capacity when the GSI values were high. In these cases, the value of the UCS also did not condition the correlation of the results with different values of dilatancy; this was because the bearing capacity was measured a percentage of the UCS, similarly to the cases analyzed under the hypothesis of the weightless material.
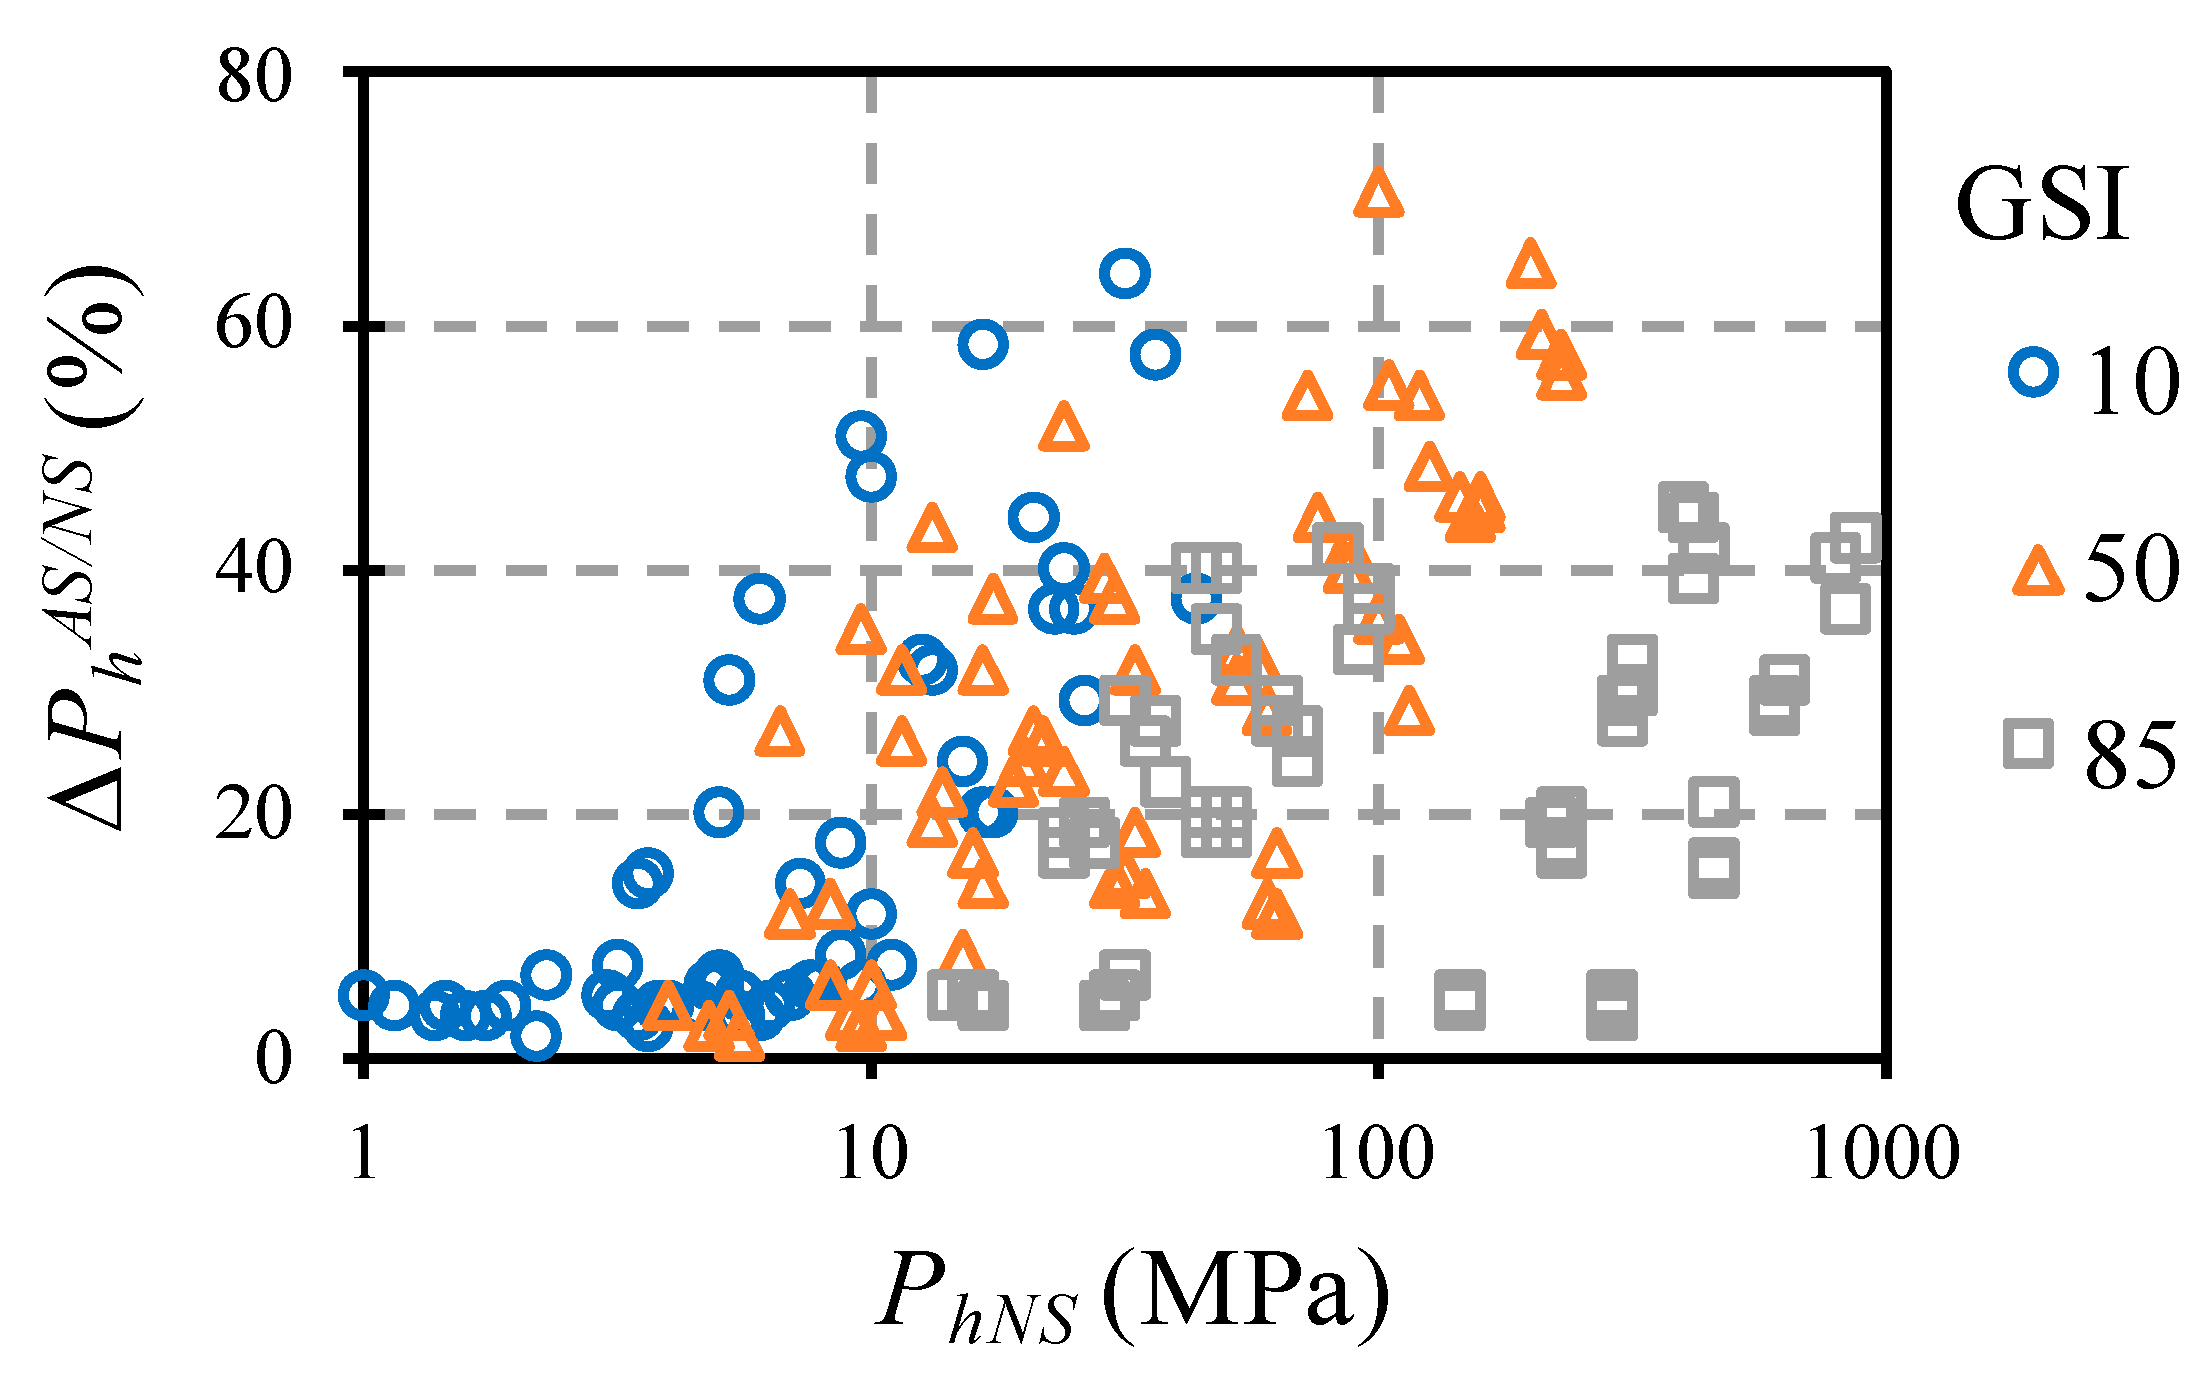
Finally, the influence of the flow law was analyzed as a function of the bearing capacity value (
Figure 13). In contrast with
Figure 4 (
Section 3), in
Figure 13, it can be observed that the variation of the flow law presented little effect on the dispersion of results in cases of small bearing capacity. This occurred because when the bearing capacity was small, the rock mass presented a poor quality; therefore, the percentage of the bearing capacity that depended on the self-weight of the material was higher and this amount was not influenced by the flow law. For medium and high values of bearing capacity, the dispersion range varied from 5 to 65%; this seemed to be conditioned by a combination of geotechnical parameters.
Displacement Analysis
In this section, it is emphasized that the horizontal displacement depended on the
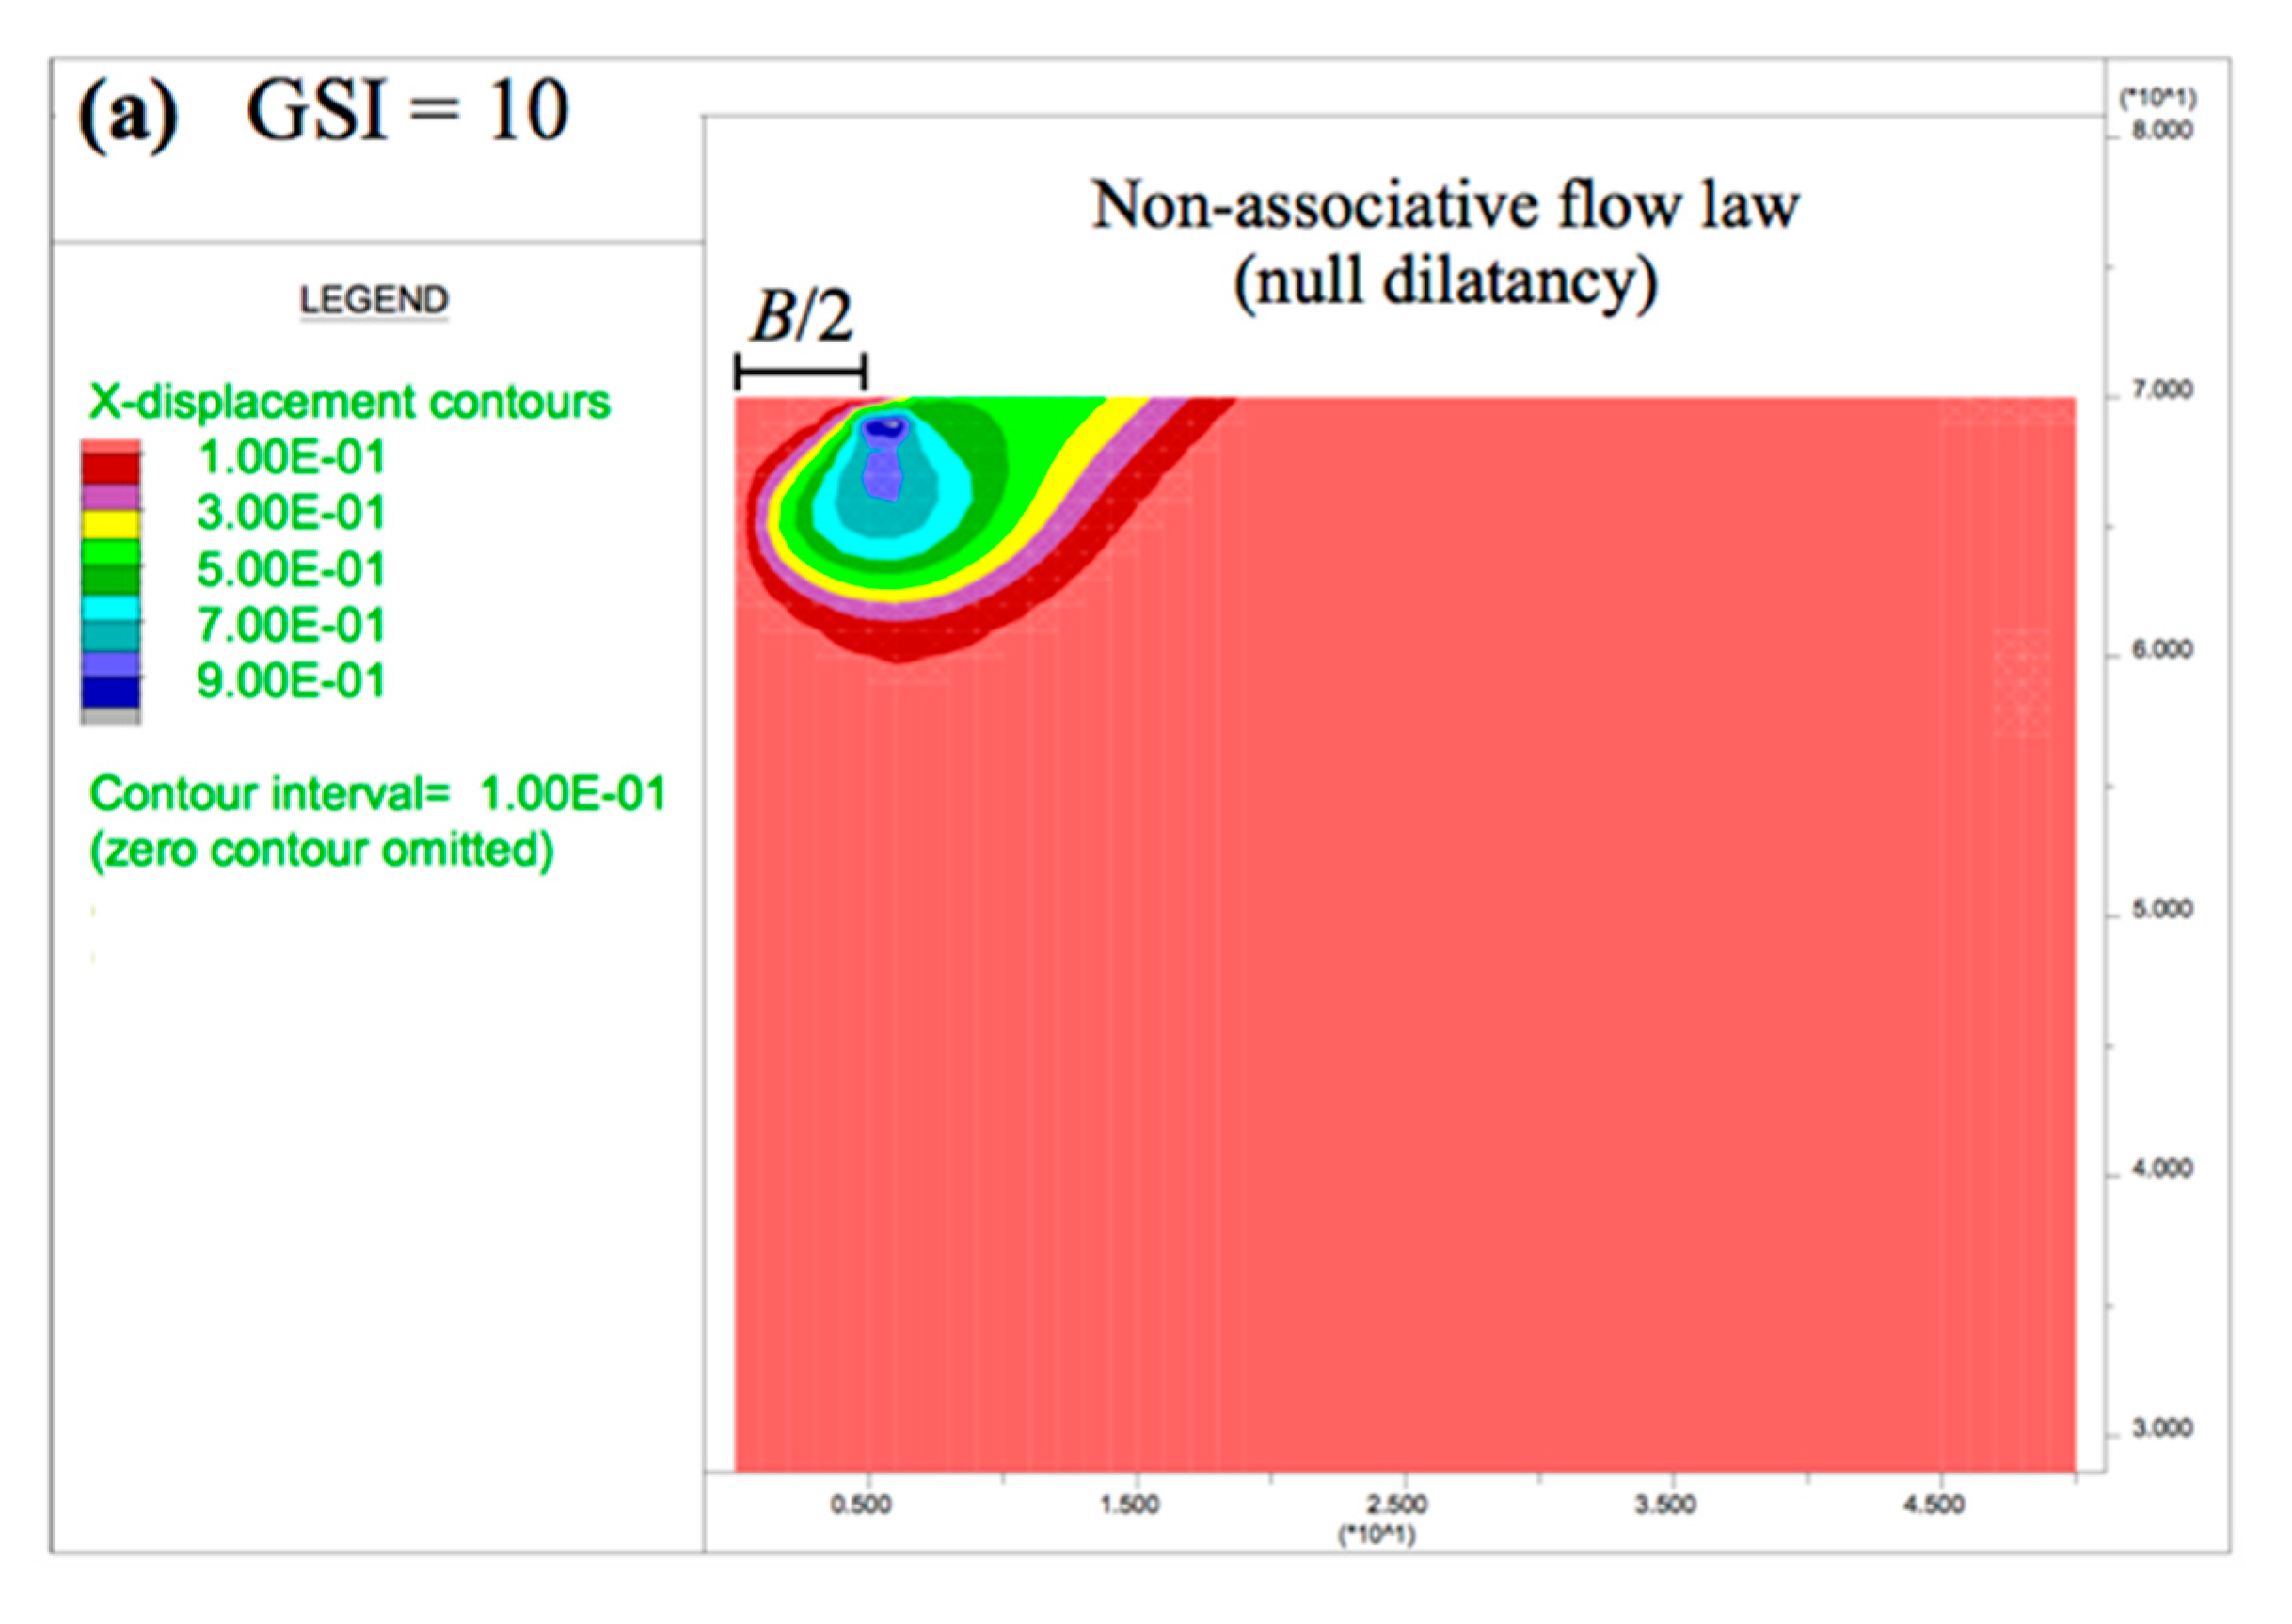
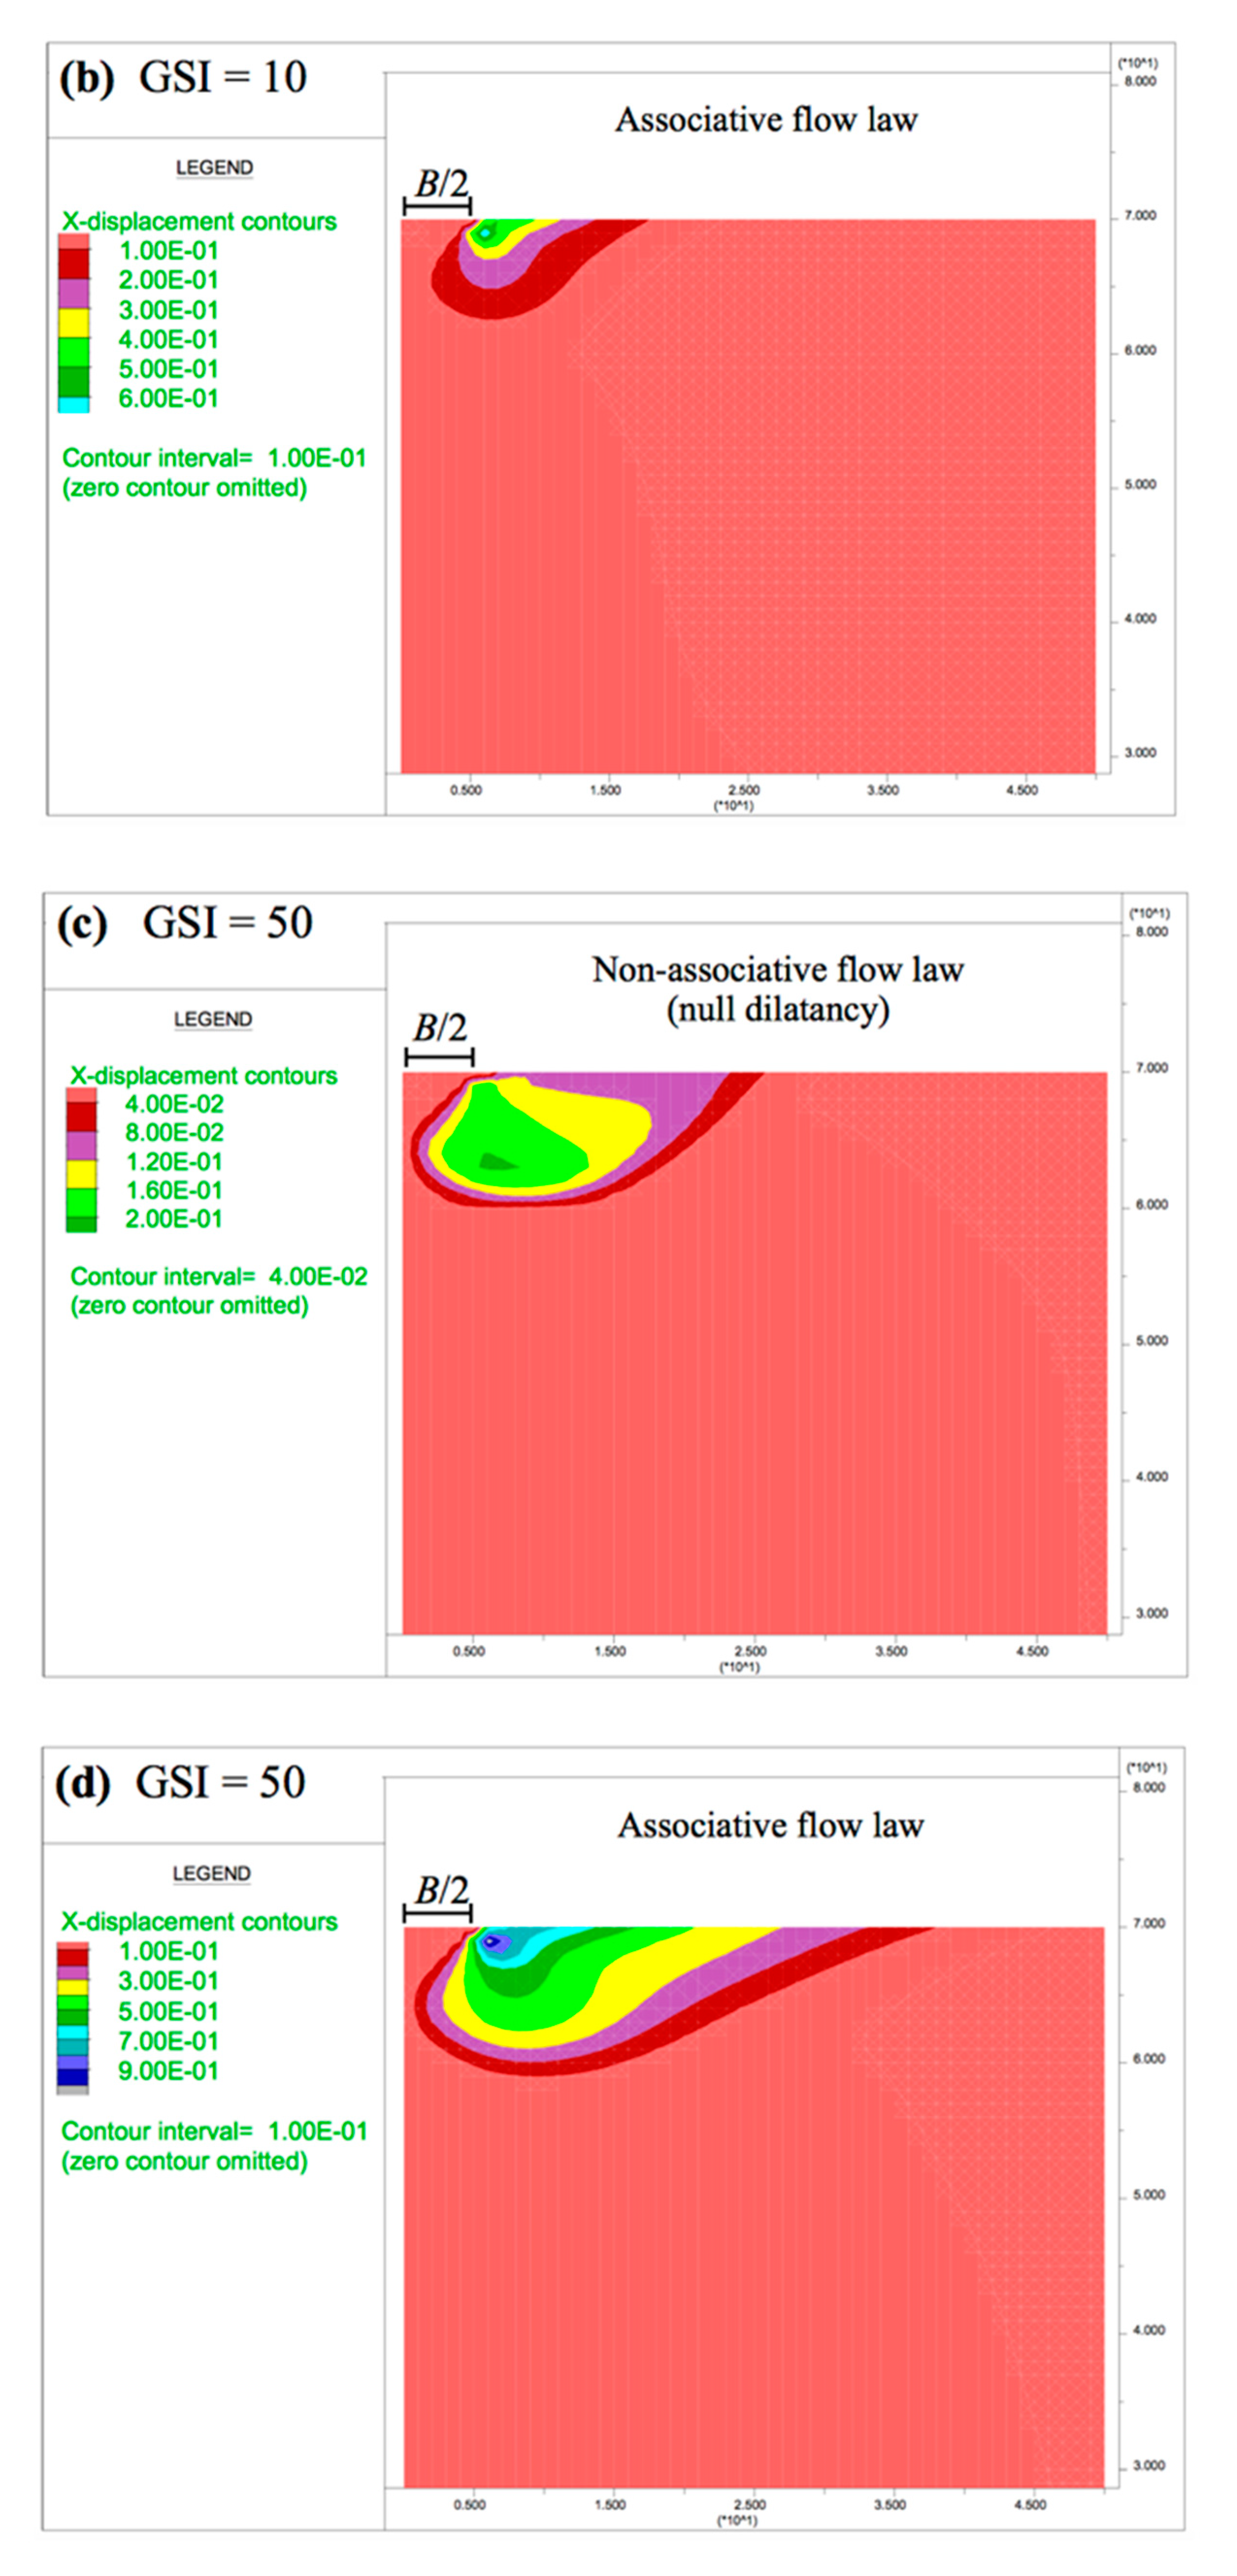
GSI. The cases with the associative flow rule presented the same behavior as in
Section 3; the points of maximum horizontal displacement were located close to the ground surface and under the exterior boundary of the footing. However, for the cases considering the non-associative (null dilatancy) flow rule, the zone corresponding to maximum horizontal displacements changed as a function of the
GSI value. For the
GSI value of 10, the point of the maximum horizontal displacement was almost the same as that observed in cases with the associative flow rule, confirming that the flow rule in these cases did not interfere on the results. Regarding
Figure 14, it can also be observed that with the increasing of the
GSI, the point of maximum horizontal displacement progressively came to be under the footing and at greater depth.
In relation to the vertical displacement, the behavior was similar to that observed in
Section 3. Under the associative flow law, the lateral area was affected, while in the cases with the non-associative (null dilatancy) flow rule, the vertical displacements were concentrated under the foundation.
5. Example
The correlation factor (DF) proposed in Equation (3) makes it possible to estimate the percentage of the variation of the bearing capacity according to the flow law adopted; thus, for the estimation of the bearing capacity with null dilatancy, this factor can be applied to the bearing capacity calculated with other methods that use the associative flow rule.
In this section, an example is given to illustrate the use of factor DF to estimate the bearing capacity. A rock mass with the following geomechanical properties is considered: mi = 5, B = 4.5 m, UCS = 5 MPa and GSI = 10, under the assumption of the plane strain, horizontal ground and the weightless rock material.
It is first necessary to estimate the bearing capacity considering the associative flow law (
PhAW) by a method that can be numerical (FDM, FEM) or analytical [
18].
The method proposed in [
18] applies the theory of characteristic lines, by adopting the plane strain hypothesis, the associated flow rule, the coaxiality, the perfectly plastic yield surface and the weightless rock mass (therefore, independent of width). This analytical formulation of the ultimate bearing capacity introduced a bearing capacity factor that makes the failure pressure proportional to the uniaxial compressive strength of the rock (
UCS).
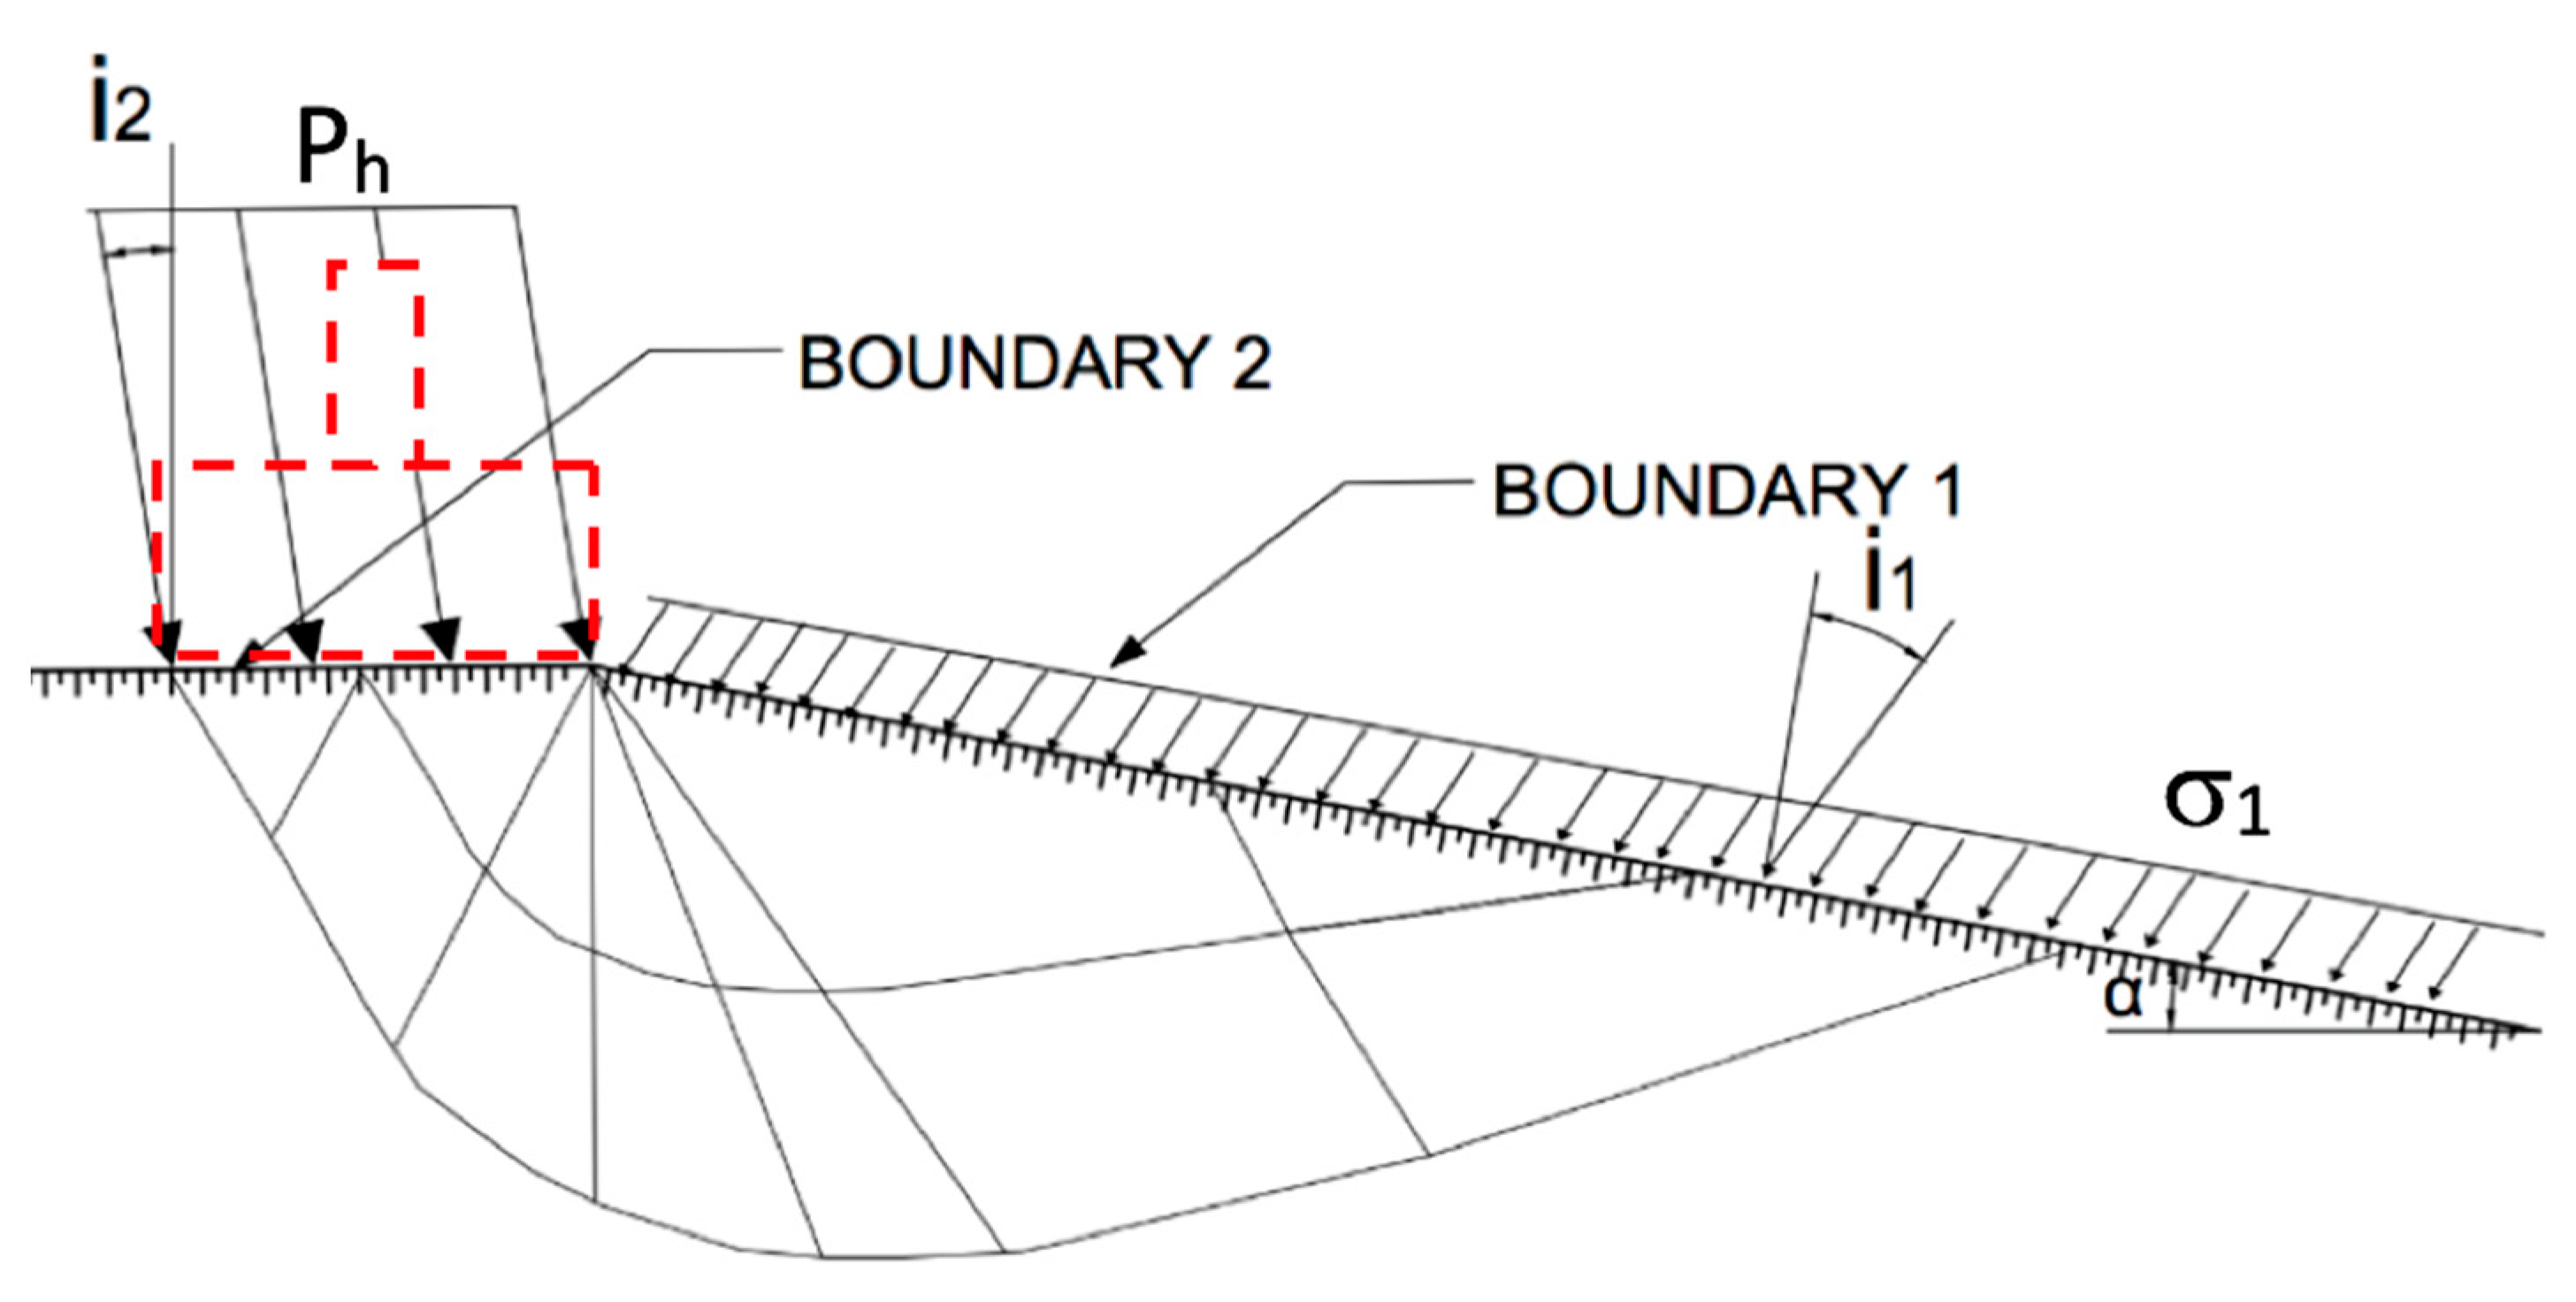
According to this analytical formulation, the ground surface that supports the foundation is composed of two sectors (
Figure 15): boundary 1 (free) with the inclination
i1 where the load acting on a surface is known (for example, the self-weight load on the foundation level or the load from installed anchors); and boundary 2 (foundation), where the bearing capacity of the foundation should be determined (acting with the inclination of
i2).
The solution based on the characteristic line method requires the equation of the Riemann invariants (
Ia) to be fulfilled along the characteristic line:
In this equation, the instantaneous friction angle at boundary 2 (ρ2) is the only unknown, because the other variables can be defined at boundary 1, namely the instantaneous friction angle at boundary 1 (ρ1) and the direction of the principal stress in this sector (Ψ1), thus expressing Ψ2 as a function of ρ2. Finally, knowing ρ2, the ultimate bearing capacity can be estimated.
Through the analytical method, the bearing capacity is obtained using Equation (6).
The resistant parameters
βa and
ζa are applied to make the calculation of the Hoek and Brown failure criterion dimensionless.
βa represents the characteristic strength that has the same units as
UCS and is used to make pressures dimensionless, while
ζa (the “tenacity coefficient”) is a dimensionless coefficient that, when multiplied by
βa, corresponds to the tensile strength.
Aa, k and the exponent a are constants for the rock mass, and depend on the rock type (m), UCS and GSI.
Nß is the bearing capacity factor and it can be calculated, according to the problem statement, as follows.
The angle of internal friction (ρ1) can be obtained by iteration from the load at boundary 1. From the value of ρ1 and by the iteration of Equation (4), the value of the internal friction angle at boundary 2 (ρ2) can be calculated.
Finally, knowing
ρ2, the bearing capacity factor (
Nß) can be calculated and, again using parameters
βa and
ζa, the ultimate bearing capacity (
Ph) can be estimated:
Using the analytical method, in this case, PhAW = 0.22 MPa.
Using Equation (3), factor
DF can be calculated:
The bearing capacity can be estimated using the
DF factor equal to 0.177 MPa, which is very similar to the value of 0.18 MPa that can be obtained through a finite difference numerical model using FLAC (
Figure 16).
