1. Introduction
Noise-induced hearing loss (NIHL) is the second most common sensorineural hearing loss after age-related hearing loss [
1]. According to the 2019 State of the UK Fitness Industry Report [
2], the health and fitness industry continues to grow in UK; hence, the noise-induced hearing loss during gym activities should be taken seriously. There is evidence that the main noise in the gym comes from aerobic training and weight training. Existing studies have shown that average noise levels during aerobics in gym range from 78 to 106 dB, and 76% of readings reach or exceed 90 dB [
3], which is very likely to cause hearing loss. Some class members have complained to instructors that they suffer from hearing loss or tinnitus. Whereas the database is massive for the NIHL in aerobics classes, the database is less impressive for exposure to the impulse noise caused by dropping barbells. Hearing loss is usually a cumulative process.
At present, there is no research to show whether there is hearing loss due to the cumulative number of barbells drops during weightlifting activities. Through field measurements in a gym at an early stage of this study, four critical activities among many that produce the most noise could be identified for this research. The top four activities and some preliminary results are shown in
Table 1. The noises were measured in a gym using a sound level meter (Duratool D03130) and calibrated mobile phone sensors. The peak noise levels were recorded from a number of heavy gym activities, and the mean value could be determined from those peaks. In this study, shock noise and vibrations were emphasized; thus, A-weighting was selected for comparisons.
It can be seen from the data in
Table 1 that there is a great risk of hearing loss in the above four activities, and the noise peak value even exceeds 100 dBA. Therefore, this project focuses on these four heavy gym activities.
Barbells, one of the biggest culprits for audible noise in gyms, mainly cause intermittent noise and impulse noise. Compared with continuous exposure to steady-state noise, the situation of exposure to noncontinuous noise is much more complicated. This is partly because of the ability of the ear to recover from the noise exposure during quiet periods; in other words, even short rest periods may be helpful to prevent hearing loss [
4]. However, studies have shown that repeated exposure to impulse noise can induce hearing loss. Therefore, the purpose of this project was to explore the dose value produced by the single drop of a barbell, as well as to study whether the cumulative dose has the risk of exceeding the safe value with repeated drops.
2. Method
2.1. Criteria for Judging Hearing Loss
As early as the last century, people began studying methods to evaluate hearing impairment. This project adopts the judgment criteria called 85 A-weighted decibel recommended exposure level, which is acknowledged by the National Institute for Occupational Safety and Health [
5]. However, it must be mentioned that whether 85 dB is a safe noise exposure level for the public is still controversial [
6]. Several key terms used in this standard care explained below.
Decibel (dB): unit of level when the base of the logarithm is the 10th root of 10 and the quantities concerned are proportional to power (ANSI S1.1-1994: decibel).
Dose: the amount of actual exposure relative to the amount of allowable exposure, for which values of 100% and above represent exposures that are hazardous.
Time-weighted average (TWA): the averaging of different exposure levels during an exposure period.
REL: recommended exposure limit.
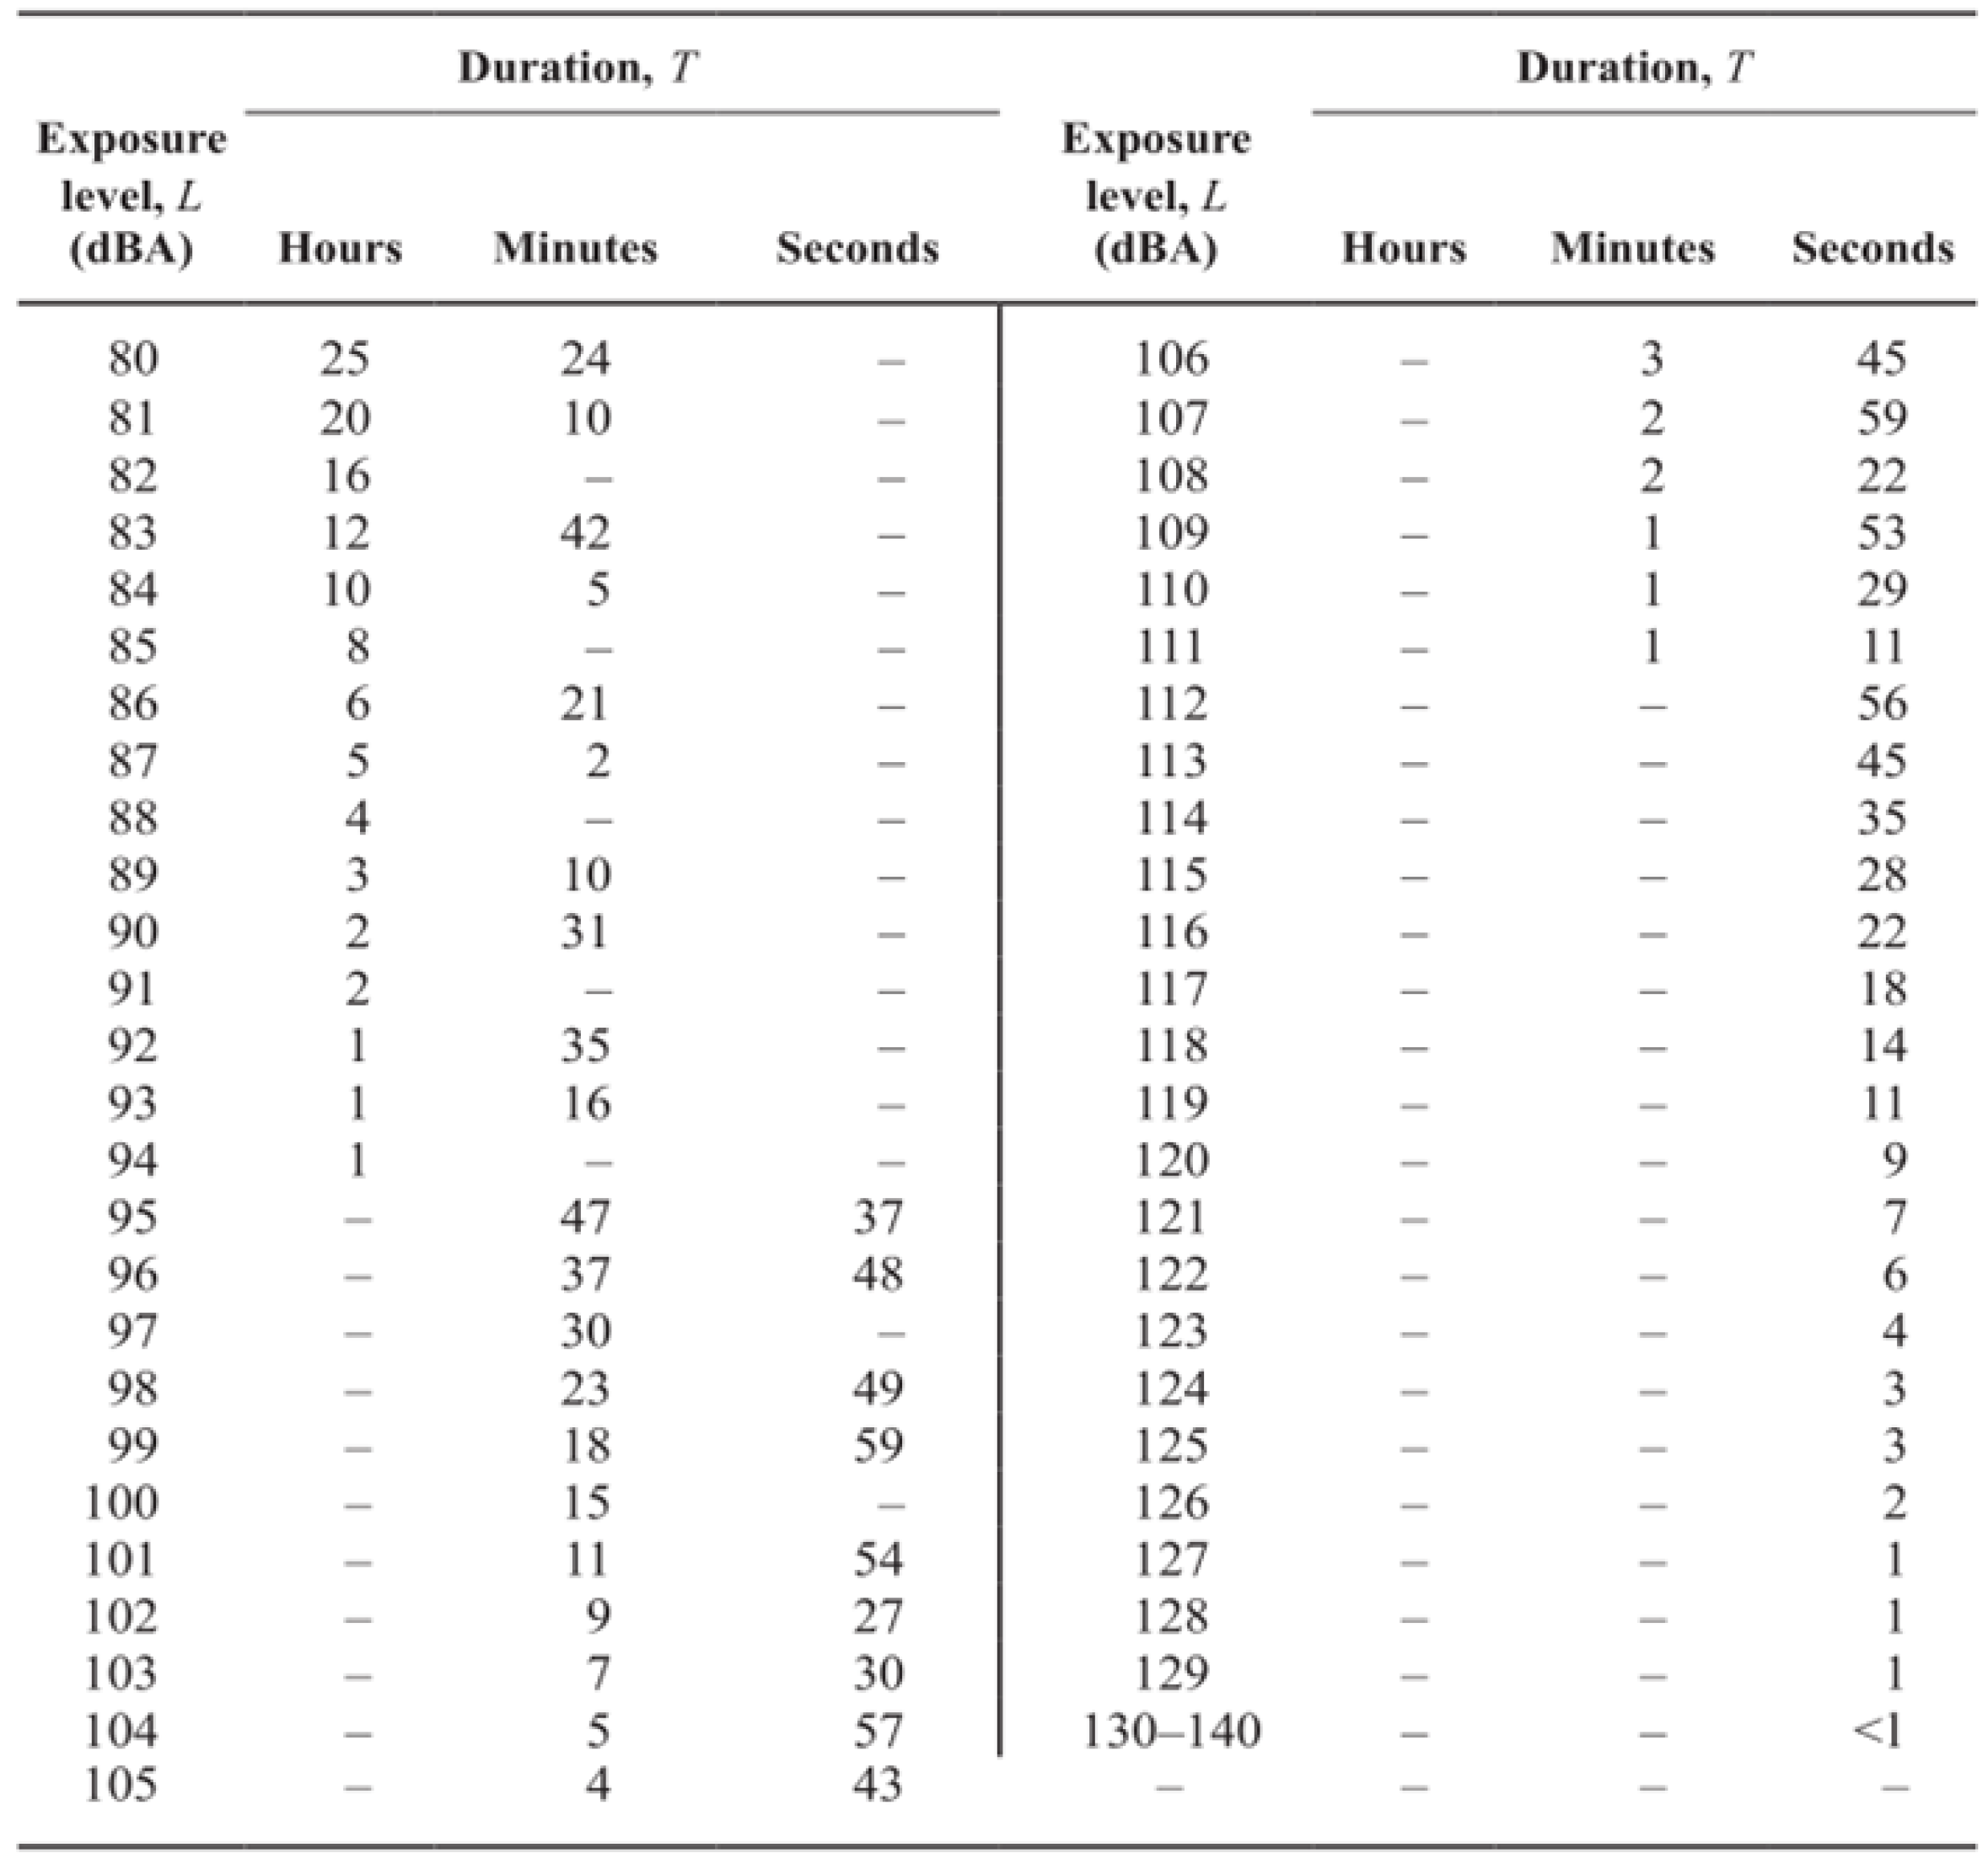
In order to control the noise exposure levels and durations, the combination of exposure level (
L) and duration (
T) can be calculated as follows:
According to Equation (1), the exchange rate is 3. In other words, when the noise increases by 3 dB, the duration is halved [
7]. Considering that daily noise exposure consists of periods of different noise levels, this can be calculated as follows:
where
Cn is the total time of exposure at a specified noise level, and
Tn is the exposure duration for which noise at this level becomes hazardous.
Usually, for noise, given an 85 dBA exposure limit and a 3 dB exchange rate, the
TWA is calculated as follows:
where
D is the dose.
Using Equation (3), the daily dose can be converted into an 8 h
TWA. This method provides a unified judgment standard for hearing loss. In order to more intuitively show the relationships between exposure level (
L) and duration (
T), daily noise dose, and 8 h
TWA,
Figure 1 and
Figure 2 [
5] are provided.
2.2. Selection of Measuring Instruments
The smartphone is our prime assessor as it can be commonly used by the general public. This adoption can enable societies to be self-aware and to manage their own risks. The majority of contemporary smartphones have various built-in sensors, such as embedded microphones, accelerometers, cameras, light sensors, and gyroscopes, which enable them to be used in noise pollution monitoring studies. Smartphone application developers provide various sound testing applications across the Apple iOS and Android platforms. Compared with conventional decibel meters, the majority of these applications are relatively more user-friendly.
A previous study compared various free sound measurement software, one of which is called Decibel X, which can provide users with the most detailed and accurate information [
8]. The test results include not only the minimum, maximum, and average values in dBA, but also the TWA and dose. According to these features, Decibel X is the best fit for the desired test. This app can record noises, identify and detect peak values, and perform fundamental signal processing (FFT, noise weighting, etc.).
2.3. Calibration for Measurement
In order to avoid the interference of the equipment toward the collected data, several iPhones with similar production years were selected as measuring instruments. To ensure the embedded sound measurements of the phones were accurate, all devices were calibrated by measuring the same sound signals (40 and 60 dBA) produced by a reference sound source. The distance between each device and the sound source was set to be 50 cm. Slight differences in the measured readings could be seen on the devices, with the variations usually ranging from 0.2 dBA to 1 dBA, which is reasonably acceptable for the measurement in this project. Note that, for each smartphone, the sound measurement device was calibrated, and the sound signals showed an identical level to the reference source (40 and 60 dBA). The aim of the study was to use smartphones as an alternative device to quantitatively assess noises for public use. This will help the public to promptly and quantitatively assess any sound or noise in various situations.
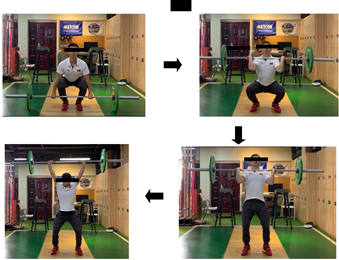
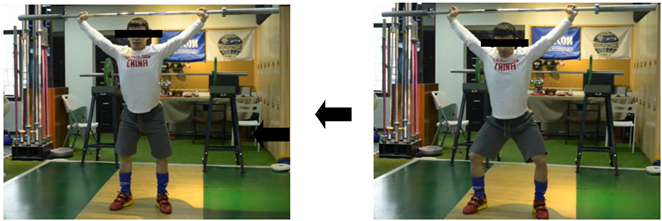
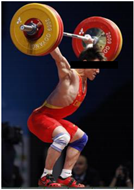
2.4. Barbell Weightlifting Exercise Analysis
According to several field surveys in the gyms, the most common exercises in the barbell weightlifting area are the squat and deadlift. Because of the difference in the targeted muscle groups, the clean and jerk and the snatch often involve the heaviest weights among exercises. In addition, these two exercises most likely involve the dropping of heavy objects accidentally or intentionally in the fitness center. Although the usage rate of Olympic weightlifting exercises is relatively low in a normal gym, these activities could involve dropping the weight to the floor from a higher position. Therefore, the squat, deadlift, snatch, and clean and jerk (mentioned in
Table 1) were selected as the main test exercises.
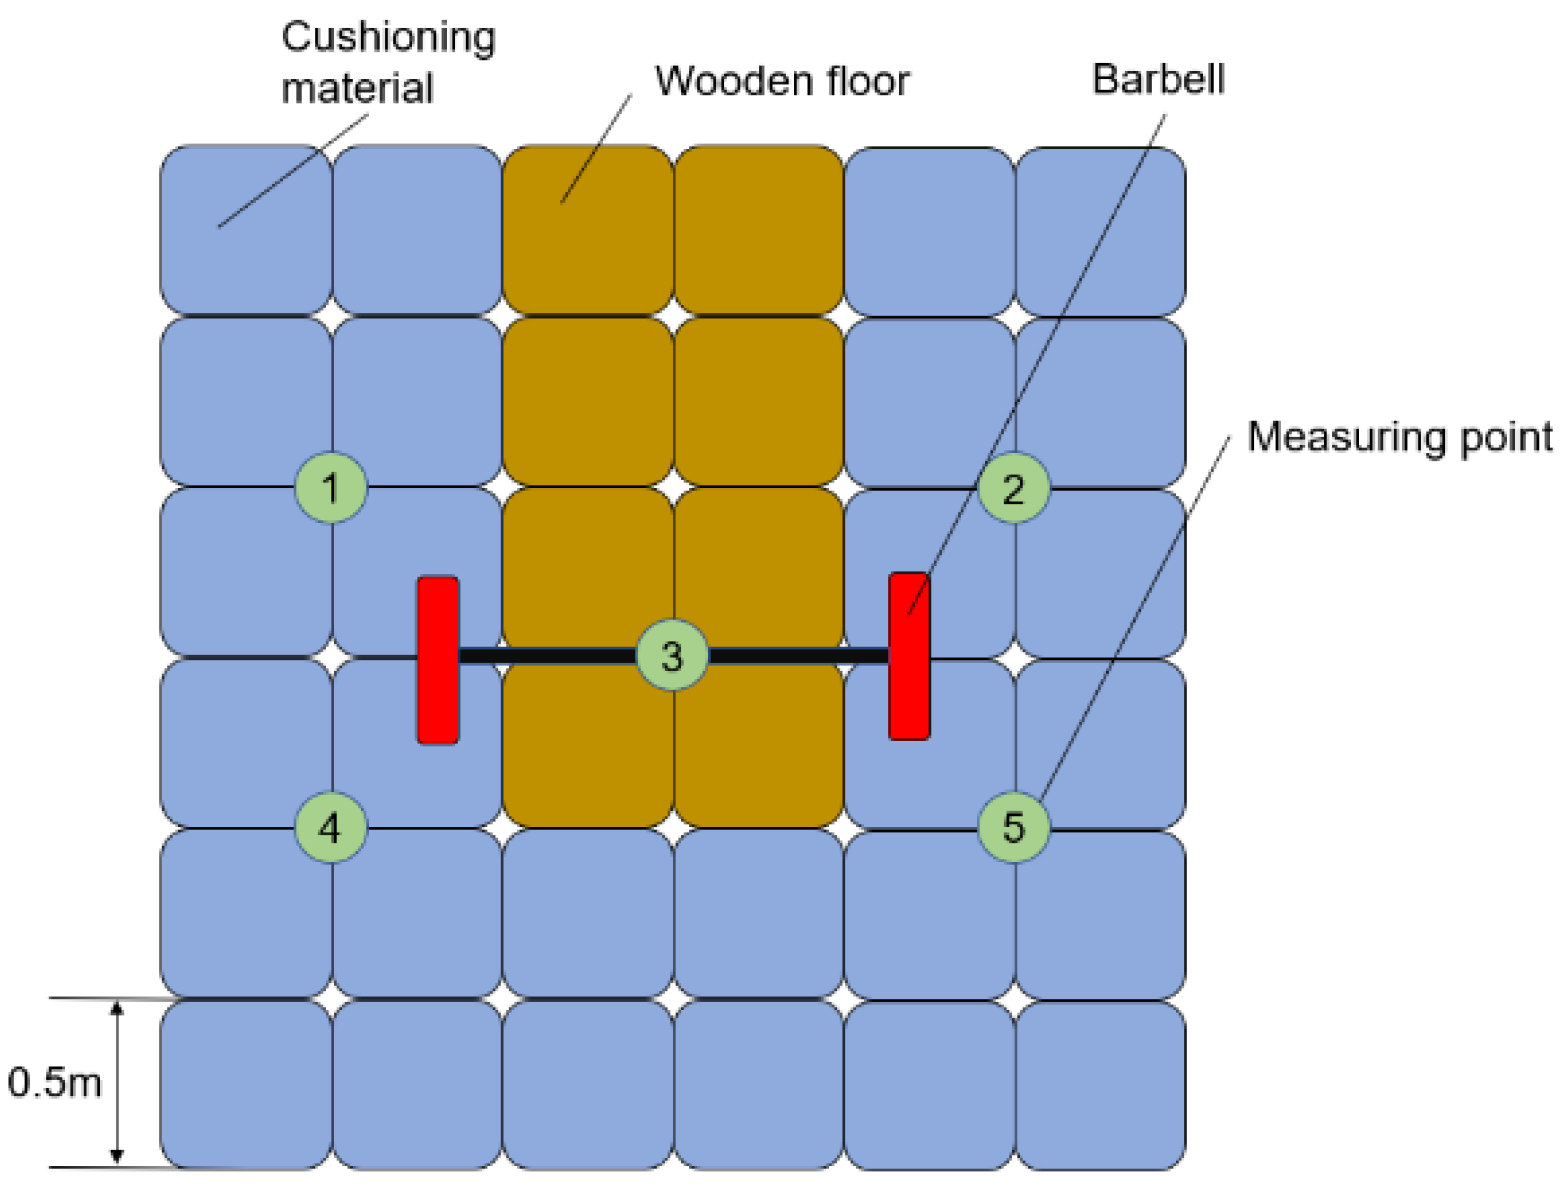
2.5. Testing Arrangement
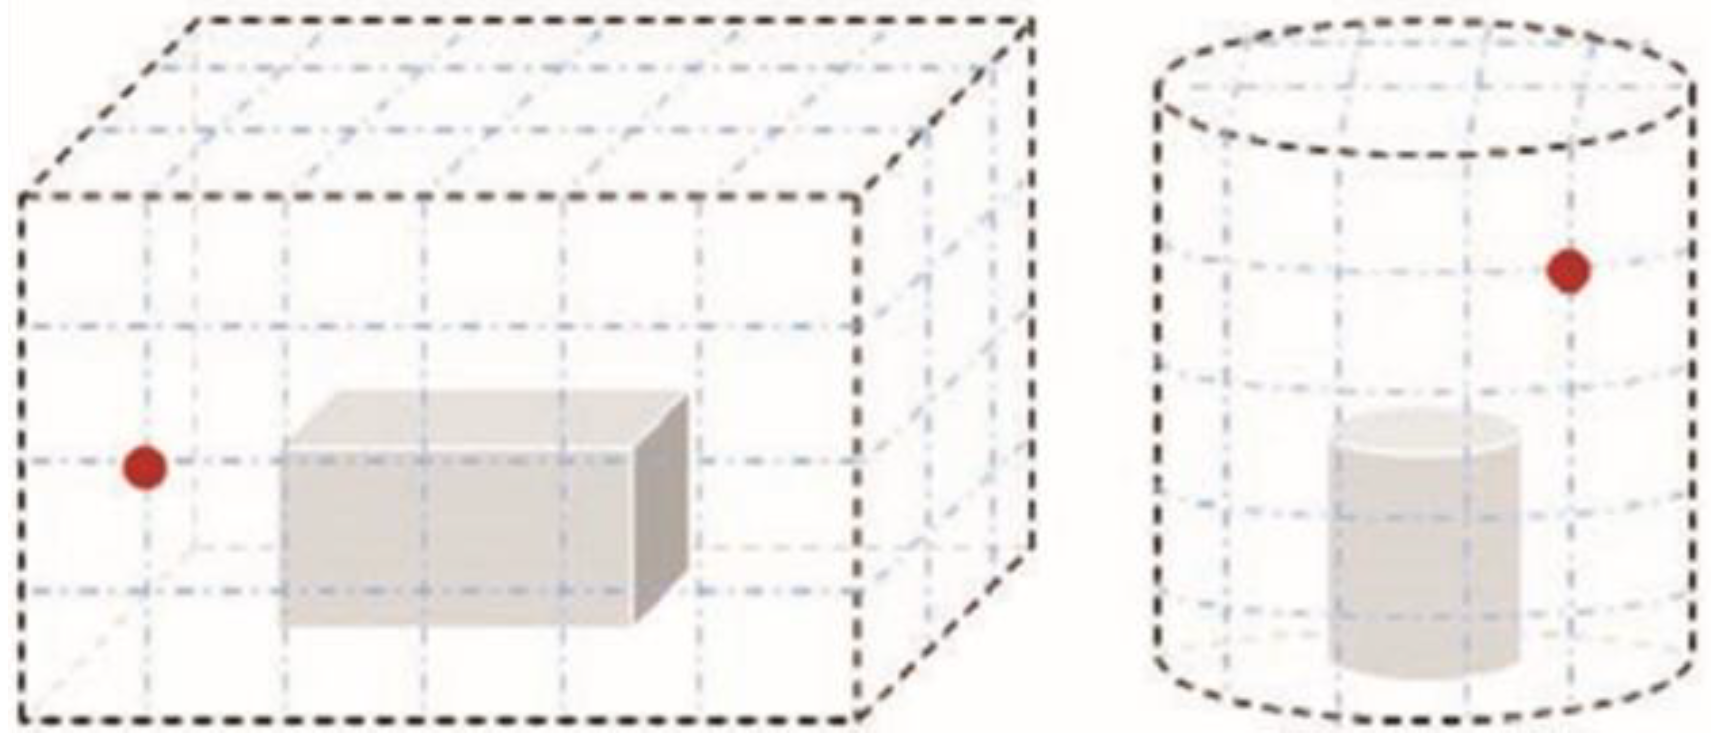
Figure 3 shows an enlarged version of the test area floor plan. Each lifting area was approximately 3 m × 3 m with two different floor finishings. The proposed locations of the testing devices are indicated by the green dots. The position of devices remained constant between tests to maintain consistency. According to ISO 9614-1 and ISO 6926, the distance interval between every device should be greater than 0.5 m.
Figure 4, provided by SIEMENS [
9], demonstrates a model for operators to place the sound level meters around a source, which can yield a sound power contour. In this study, the goal was to understand the noise level map generated by the heavy gym activities. The exact value of noise level at various locations (e.g., at various ear levels) can be determined on the basis of the physics of noises but is beyond the scope of this study. In this study, A filters were adopted for consideration. Measurements made on A filters are expressed in dBA. The dBA sound level meter applies to mid-range frequencies, as opposed to the dBC sound level meter that measures low and high frequencies. In general, the Occupational Safety and Health Administration provides the guidelines regarding workplace noise exposure limitations based on dBA measurements [
5].
2.6. Barbell Weight Combination
In
Table 2, nine combinations of various weight plates are listed with increasing total weight at an interval of 10 kg. The weights of barbells ranged from 20 kg to 80 kg, because these are the most common weights in gyms. The finishing positions during the different weightlifting training activities are not completely consistent; hence, the barbell drop height is not the same. Combinations C through G were selected to achieve the aim of increasing the weight without changing the contact area between the weight plate and the floor material. Combinations G through I were selected to achieve the aim of increasing the weight plate quantity without changing the total weight of the barbell.
2.7. Test Procedures
In order to avoid the influence of floor materials on the measurement data, all tests were carried out in a fixed area in the same gym. The purpose of this project was to explore the relationship between the dose and the number of barbell drops. A large number of field measurements were carried out for each activity. The dose resulting from each single barbell drop was recorded, and the weight of the barbell was constantly changed to determine its influence. However, the dose value recorded by Decibel X is only to one decimal place. In order to make the measurement results more accurate, each group recorded the decibels produced by 20 drops (of heavy weights) and the corresponding dose, before taking the average value for every scenario.
Because the measurements were carried out in a public fitness center with an uncontrollable environment, the influence of ambient noise was unavoidable. Therefore, the tests were carried out with as many sets as possible to estimate a valid average value to be used in data processing and analysis. Several sets of noise tests were conducted, and average values were calculated by considering the recorded data from all five devices.
3. Results
After a number of preliminary measurements, it was found that a single drop of barbell only produces a small dose value. However, the value of dose recorded using the Decibel X application is only to one decimal place; thus, not every drop of barbell causes a change in the value of dose. In order to get a more accurate dose value, the measurement method adopted in this project was not to directly measure the dose value produced by a single drop. Ten groups of measurements were conducted, with each group recording the noise generated by 20 drops and the total dose generated in turn, before averaging the results to obtain a more accurate dose value generated by a single drop.
Ten sets of measurements were conducted for each activity at each weight. By calculating and comparing the standard deviation of the data, four sets of data with the least fluctuation were selected, and the average values of the four groups of data are presented in
Table 3. The details of these four sets of data are listed in
Table A1 (
Appendix A).
According to the widely accepted safety noise level [
6,
10], 85 dBA was also adopted as a safe standard in this project. It can be seen from the data in
Table 3 that all the measured data exceeded the safety standard, which is very likely to cause hearing loss.
4. Discussions
4.1. Relationship between Drop Weight and Noise and Dose
Data from combinations A to G were selected to study the relationship between the drop weight and the noise and dose. The two lines charts in
Figure 5 show how the noise level and dose varied with the weight of the barbell. It can be seen that both noise level and dose exhibited a proportional relationship with increasingly heavy dropped weights. The change trend of the four curves corresponding to the four activities in terms of noise level and dose was basically the same.
However, it should be noted that there were two inflection points in the curves at 30 kg and 40 kg. It can be seen from the figure that, compared with 20 kg to 30 kg and 40 kg to 80 kg, the rising trend of the curve in the range of 30 kg to 40 kg was gentler.
This is mainly because combination B used more weight plates at both ends of the barbell than combination A. When the barbell fell to the ground, there was a slight collision between the weight plates, resulting in more noise. Although combination C used the same number of weight plates as combination B, it used weight plates with a rubber cover, thereby reducing the noise caused by their collision. Therefore, combination C used a heavier weight than combination B, but the noise level difference between the two combinations was not significant. When the weight was increased to more than 50 kg, despite rubber-covered weight plate being used in combinations D to G, more metal weight plates were also used; hence, so the noise caused by their collision was inevitable. Generally, an increase in weight led to an upward trend of the curve.
4.2. Uncertainty Analysis
By analyzing the trend of the original data, the noise test showed a high degree of uncertainty. In
Figure 6, the scattered black dots are distributed over a wide range. However, the length of the interval corresponding to each weight was basically the same. This also shows that the uncertainty of the test seemed to have nothing to do with the weights used in the test.
4.3. Comparison among Gym Activities
It can be seen from
Figure 5 and
Figure 6 that, although the change trends of noise and dose of the four activities were basically the same, there were still high and low levels. The blue and red lines (representing the clean and jerk and the snatch, respectively) were very close in terms of both change trend and numerical value, always being at the highest level. They were followed by the squat (yellow line), with the noise level ranging from 90 to 100 dBA. The gray line (deadlift) was the lowest among the four lines, with the noise level remaining below 100 dBA.
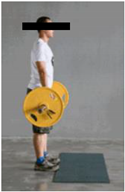
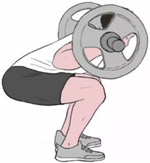
This phenomenon could be due to the difference in the finishing position of each activity, shown in
Table A2 (
Appendix A). The finishing positions of the snatch and the clean and jerk are located above the trainer’s head, whereas the finishing position of the squat is located at the trainer’s shoulder, and the finishing position of the deadlift is located at the trainer’s knee. This results in different falling heights of the barbell for each activity. The effect of falling height on the noise level was investigated in [
11].
4.4. Influence of Barbell Weight Plate Quantity
Table 4 presents a summary of the results, showing that the quantity of weight plates had a certain impact on the noise level. As the quantity of weight plates increased, the noise level continued to rise. Although the change rates of the four activities were different, the overall upward trend was consistent.
4.5. Calculations of 8 h TWA and Dose
For the calculations of 8 -h
TWA and dose, the largest average decibel level recorded from
Table 3 was used to show the maximum effect of these drops. The average example selected was the 80 kg drop at 103.9 dBA. According to the sonogram generated using Decibel X, the duration of the sound around the peak level was conservatively taken as 0.5 s. Then, the
TWA and dose were calculated as follows using the three equations in
Section 2.1:
The calculated value of dose was basically consistent with the actual measured value with a slight tolerable difference. The 8 h
TWA was equal to 56.5 dBA, which is equivalent to 8 h in a quiet home [
12]. It does not appear that there would be a negative effect on people. However, this was the
TWA produced by a single drop; an increase in the number of drops would bring
TWA closer to the threshold.
4.6. Risk of NIHL
It can be seen from Equations (1)–(3) in
Section 2.1 that TWA is a logarithmic function, and that the change rate of the function decreases with the number of times a barbell falls repeatedly. However, dose is proportional to the cumulative number of times a barbell drops. Therefore, it is more appropriate to choose dose to indicate the possibility of NIHL in a gym.
According to the calculated value (in
Section 4.5) and measured values (in
Section 4) of dose, even in the most critical case, the dose caused by a single drop was less than 0.16%. In other words, hearing loss can only occur if the barbell is dropped more than 600 times repeatedly. However, for ordinary fitness trainees, the daily frequency of barbell training is far less than 600 times [
13]; thus, daily weightlifting training is not likely to induce hearing loss. However, the noise during weightlifting activities should also be taken seriously, because exercisers may also be subjected to other occupational noise exposure.
Furthermore, for professional athletes who undergo weightlift training every day and for instructors or staff members who stay in the gym for long durations, measures are necessary for protection from hearing loss. It is recommended to rest in a relatively quiet environment after exposure to noise [
14].
4.7. Practical Recommendations
Although simple weightlift training is unlikely to induce hearing loss, barbells are not the only source of noise in gyms; music and noise from cardio machines can also contribute to a larger 8 h equivalent energy value. Therefore, a gym should have separate areas for aerobic courses and weightlift training. Moreover, the environment in these areas will vary, such as absorbent ceilings, local screens, soundproof walls, and vibration-damping keels. In addition, the staff office/rest area should be located away from the noise sources.
The floor selection of the gym is also critical, since flooring materials have a special efficient working range to reduce noise and vibration. The weightlifting area with barbells can be divided into areas with different weight restrictions with respect to the floor material in the fitness center. In addition, it is not recommended to use bumpers and metal plates without rubber covers in weightlifting training. Regular checks and maintenance plans of the floor are essential to avoid material deterioration.
For exercisers, one of the most effective methods to reduce the risk of noise-induced hearing loss is wearing hearing protection devices [
15,
16,
17,
18], such as ear plugs. Moreover, weight plates with rubber covers are recommended. In addition, all weight training should be conducted in areas where special floor materials such as impact-resistant elastomer, metamaterials, are used [
11,
19].
4.8. Limitation
In the noise test, barbells were thrown to the ground during the normal training of weightlifters in real life; hence, there may have been some slight differences in the height and initial speed of each barbell drop. The lack of precise control means that the weights at the bar ends may have hit the ground with different energy, thereby leading to fluctuation of the noise level data. In addition, barbells may bounce and land again after hitting the ground, resulting in multiple noise peaks. However, this test only recorded the noise level after the barbell landed for the first time. This test was not measured in a completely quiet environment; thus, music, background noise, and other ambient noise may also have had an impact on the experimental data.
All the tests in this project were conducted in the same area of a fitness center. Details of flooring materials and usage cannot be provided. In addition, the deterioration level of floor materials may differ across fitness centers, and the suppression effect on noise and vibration may also be different.
Another limitation was the accuracy of the measuring equipment. The minimum scale value of the tested application on a smart phone is 0.1 dBA. Professional measuring equipment with a higher level of precision should be used in the future.
5. Conclusions
Improving healthy lifestyles and promoting positive wellbeing at all ages is critical to sustainable development. This study highlights one of the United Nations sustainable development goals, i.e., ‘good health and wellbeing’. Activities (or exercises) can enhance life expectancy and decrease some of the common risk factors linked to obesity and heart diseases. However, active lifestyles should not expose individuals to other health risks. In this study, noise measurements of the loudest fitness activities were investigated to assess any offset in terms of potential hearing loss of gym users.
The test results showed that it is unlikely that pure weightlifting activities in fitness centers would induce hearing loss for the public, despite all measurement results being above 85 dBA. This is because exposure to the noise doses is not excessive during a general gym session (e.g., 1 h). However, it must be mentioned that noise exposure in a gym is only one element of daily exposure, and gym members may also be subjected to other occupational noise exposure. Hence, for individuals who are exposed to a lot of noise at work, noise exposure at a gym is likely to cause hearing loss. Accordingly, the noise in fitness centers should be taken seriously, especially for professional athletes and gym staff members who are exposed for a long duration (>3 h a day). Reasonable methods should be adopted to reduce the risk of noise-induced hearing loss.
Author Contributions
Conceptualization, S.K. and Y.S.; methodology, S.K. and Y.S.; software, Y.S.; validation, Y.S.; formal analysis, Y.S.; investigation, S.K. and Y.S.; resources, S.K.; writing—original draft preparation, Y.S.; writing—review and editing, S.K.; visualization, Y.S.; supervision, S.K.; project administration, S.K.; funding acquisition, S.K. All authors read and agreed to the published version of the manuscript.
Funding
This research was funded by European Commission, grant numbers H2020-MSCA-RISE No. 691135 and H2020-S2R No. 730849. The APC was funded by MDPI’s Invited Paper Program.
Institutional Review Board Statement
Not applicable.
Informed Consent Statement
Not applicable.
Data Availability Statement
Data can be made available upon reasonable request.
Acknowledgments
The authors gratefully acknowledge the European Commission for H2020-MSCA-RISE Project No. 691135 “RISEN: Rail Infrastructure Systems Engineering Network” (
www.risen2rail.eu) (accessed on 8 December 2021) [
20].
Conflicts of Interest
The authors declare no conflict of interest.
Appendix A
Table A1.
Detailed data of four selected groups (clean and jerk).
Table A1.
Detailed data of four selected groups (clean and jerk).
| Combination | Weight | Average Noise Level for 20 Drops (dBA) | Average Noise Level (dBA) | Standard Deviation |
|---|
| Position 1 | Position 2 | Position 3 | Position 4 | Position 5 |
|---|
| A | 20 | 91.4 | 91.9 | 92.2 | 91.8 | 91.2 | 91.7 | 0.36 |
| B | 30 | 95.9 | 96.4 | 98.2 | 97.3 | 97.2 | 97.0 | 0.79 |
| C | 40 | 98.8 | 98.2 | 100.3 | 98.3 | 97.9 | 98.7 | 0.85 |
| D | 50 | 98.9 | 100.8 | 101.0 | 100.5 | 100.3 | 100.3 | 0.74 |
| E | 60 | 102.8 | 101.3 | 103.6 | 101.7 | 100.6 | 102.0 | 1.07 |
| F | 70 | 103.2 | 104.1 | 103.6 | 103.2 | 101.9 | 103.2 | 0.73 |
| G | 80 | 104.3 | 103.3 | 105.0 | 102.8 | 104.1 | 103.9 | 0.77 |
| H | 80 | 105.8 | 106.1 | 106.9 | 105.8 | 106.4 | 106.2 | 0.41 |
| I | 80 | 108.1 | 108.2 | 108.3 | 108.5 | 106.9 | 108 | 0.57 |
Table A2.
Detailed data of four selected groups (snatch).
Table A2.
Detailed data of four selected groups (snatch).
| Combination | Weight | Average Noise Level for 20 Drops (dBA) | Average Noise Level (dBA) | Standard Deviation |
|---|
| Position 1 | Position 2 | Position 3 | Position 4 | Position 5 |
|---|
| A | 20 | 90.4 | 90.6 | 91.2 | 89.6 | 89.2 | 90.2 | 0.72 |
| B | 30 | 96.9 | 96.4 | 97.2 | 96.6 | 96.9 | 96.8 | 0.28 |
| C | 40 | 98.9 | 99.0 | 99.2 | 98.6 | 98.8 | 98.9 | 0.20 |
| D | 50 | 100.4 | 99.9 | 100.8 | 100.1 | 100.3 | 100.3 | 0.30 |
| E | 60 | 101.5 | 102.1 | 102.0 | 101.5 | 100.9 | 101.6 | 0.43 |
| F | 70 | 102.6 | 103.1 | 103.4 | 102.8 | 102.6 | 102.9 | 0.31 |
| G | 80 | 103.3 | 103.7 | 103.9 | 103.2 | 103.4 | 103.5 | 0.26 |
| H | 80 | 104.9 | 105.6 | 106 | 105.9 | 106.1 | 105.7 | 0.43 |
| I | 80 | 108.1 | 107.8 | 108.7 | 107.9 | 108.5 | 108.2 | 0.35 |
Table A3.
Detailed data of four selected groups (deadlift).
Table A3.
Detailed data of four selected groups (deadlift).
| Combination | Weight | Average Noise Level for 20 Drops (dBA) | Average Noise Level (dBA) | Standard Deviation |
|---|
| Position 1 | Position 2 | Position 3 | Position 4 | Position 5 |
|---|
| A | 20 | 86 | 86.7 | 86.4 | 85.9 | 86.0 | 86.2 | 0.30 |
| B | 30 | 92 | 91.6 | 92.0 | 92.3 | 92.1 | 92.0 | 0.23 |
| C | 40 | 93.7 | 93.1 | 93.4 | 92.7 | 93.1 | 93.2 | 0.33 |
| D | 50 | 93.6 | 94.3 | 93.8 | 94.2 | 94.6 | 94.1 | 0.36 |
| E | 60 | 95.7 | 95.8 | 95.5 | 95.1 | 95.9 | 95.6 | 0.28 |
| F | 70 | 97.6 | 97.2 | 96.8 | 96.9 | 97.0 | 97.1 | 0.28 |
| G | 80 | 98.3 | 98.0 | 98.2 | 98.9 | 98.1 | 98.3 | 0.32 |
| H | 80 | 100.0 | 99.6 | 100.2 | 99.7 | 99.5 | 99.8 | 0.26 |
| I | 80 | 100.8 | 100.9 | 101.1 | 100.8 | 100.9 | 100.9 | 0.11 |
Table A4.
Detailed data of four selected groups (squat).
Table A4.
Detailed data of four selected groups (squat).
| Combination | Weight | Average Noise Level for 20 Drops (dBA) | Average Noise Level (dBA) | Standard Deviation |
|---|
| Position 1 | Position 2 | Position 3 | Position 4 | Position 5 |
|---|
| A | 20 | 88.7 | 89.1 | 89.8 | 89.4 | 89.5 | 89.3 | 0.37 |
| B | 30 | 94.8 | 95.5 | 96.1 | 95.4 | 95.7 | 95.5 | 0.42 |
| C | 40 | 97.1 | 96.9 | 97.3 | 96.8 | 96.4 | 96.9 | 0.30 |
| D | 50 | 98.3 | 98.5 | 98.4 | 98.0 | 97.8 | 98.2 | 0.26 |
| E | 60 | 99.5 | 99.4 | 100.1 | 99.8 | 100.2 | 99.8 | 0.32 |
| F | 70 | 101.2 | 101.0 | 100.5 | 100.5 | 100.3 | 100.7 | 0.34 |
| G | 80 | 100.6 | 100.5 | 101.7 | 101.6 | 100.6 | 101.0 | 0.53 |
| H | 80 | 103.0 | 102.8 | 103.0 | 103.4 | 103.3 | 103.1 | 0.22 |
| I | 80 | 103.9 | 104.2 | 104.4 | 104.9 | 104.6 | 104.4 | 0.34 |
Appendix B
Table A5.
Detailed explanation of four activities.
References
- Daniel, E. Noise and Hearing Loss: A Review. J. Sch. Health 2007, 77, 225–231. [Google Scholar] [CrossRef] [PubMed]
- Fitness Industry UK: 2019 State of the UK Fitness Industry, David Minton, Health & Fitness, Gym Industry UK. Available online: https://www.leisuredb.com/publications (accessed on 1 February 2021).
- Yaremchuk, K.L.; Kaczor, J.C. Noise Levels in the Health Club Setting. Ear Nose Throat J. 1999, 78, 54–57. [Google Scholar] [CrossRef] [Green Version]
- Laroche, C.; Hétu, R.; Poirier, S. The growth of and recovery from TTS in human subjects exposed to impact noise. J. Acoust. Soc. Am. 1989, 85, 1681–1690. [Google Scholar] [CrossRef] [PubMed] [Green Version]
- National Institute for Occupational Safety and Health (NIOSH). Criteria for a Recommended Standard: Occupational Noise Exposure; National Institute for Occupational Safety and Health (NIOSH): Washington, DC, USA, 1998. [Google Scholar]
- Fink, D.J. What Is a Safe Noise Level for the Public? Am. J. Public Health 2017, 107, 44–45. [Google Scholar] [CrossRef] [PubMed]
- Fletcher, H. A method of calculating hearing loss for speech from the audiogram. Acta Oto-Laryngol. 1950, 90, 26–37. [Google Scholar] [CrossRef] [PubMed]
- Kaewunruen, S.; Lei, C. Smartphone Sensing and Identification of Shock Noise and Vibration Induced by Gym Activities. Acoust. Aust. 2020, 48, 349–361. [Google Scholar] [CrossRef]
- Siemens PLM Software: A Guide to Measuring Sound Power, an Overview of International Standards. 2016. Available online: https://community.plm.automation.siemens.com/siemensplm/attachments/siemensplm/Simcenter_Test_tkb/38/1/Siemens-PLM-A-Guide-to-Measuring-Sound-Power.pdf (accessed on 16 December 2018).
- National Institute on Deafness and Other Communication Disorders. Noise Induced Hearing Loss. Available online: https://www.nidcd.nih.gov/health/noise-induced-hearing-loss (accessed on 1 February 2021).
- Buen, A. Impulse Forces and Noise from Dropped Weights on Concrete Floors. ResearchGate 2021. [Google Scholar] [CrossRef]
- Audio, G.C. Decibel (Loudness) Comparison Chart. 14 March 2020. Available online: https://www.gcaudio.com/tips-tricks/decibel-loudness-comparison-chart/ (accessed on 14 March 2020).
- Stone, M.H.; Pierce, K.C.; Sands, W.A.; Stone, M.E. Weightlifting: A Brief Overview. Strength Cond. J. 2006, 28, 50–66. Available online: https://search.proquest.com/scholarly-journals/weightlifting-brief-overview/docview/212596136/se-2?accountid=8630 (accessed on 30 December 2020). [CrossRef]
- Hamill, B. Relative safety of weightlifting and weight training. J. Strength Cond. Res. 1994, 8, 53–57. [Google Scholar]
- Hodgetts, W.; Szarko, R.; Rieger, J. What is the influence of background noise and exercise on the listening levels of iPod users? Int. J. Audiol. 2009, 48, 825–832. [Google Scholar] [CrossRef] [PubMed]
- US Environmental Protection Agency. Information on Levels of Environmental Noise Requisite to Protect Public Health and Welfare with an Adequate Margin of Safety. 1974. Available online: http://www.nonoise.org./library/levels74/leve.s74.htm (accessed on 30 December 2020).
- Vaimann, T.; Sobra, J.; Belahcen, A.; Rassõlkin, A.; Rolak, M.; Kallaste, A. Induction machine fault detection using smartphone recorded audible noise. IET Sci. Meas. Technol. 2018, 12, 554–560. [Google Scholar] [CrossRef] [Green Version]
- Kaewunruen, S.; Huang, J.; Haslam, J. Insights into noise and vibration stemming from the gym’s heavy lifting. Sport Sci. Health 2021, 1–10. [Google Scholar] [CrossRef]
- Kaewunruen, S.; Qin, Z. Sustainability of Vibration Mitigation Methods Using Meta-Materials/Structures along Railway Corridors Exposed to Adverse Weather Conditions. Sustainability 2020, 12, 10236. [Google Scholar] [CrossRef]
- Kaewunruen, S.; Sussman, J.M.; Matsumoto, A. Grand Challenges in Transportation and Transit Systems. Front. Built Environ. 2016, 2, 4. [Google Scholar] [CrossRef] [Green Version]
| Publisher’s Note: MDPI stays neutral with regard to jurisdictional claims in published maps and institutional affiliations. |
© 2021 by the authors. Licensee MDPI, Basel, Switzerland. This article is an open access article distributed under the terms and conditions of the Creative Commons Attribution (CC BY) license (https://creativecommons.org/licenses/by/4.0/).


