1. Introduction
With the accelerated evolution of the development and utilization of electric vehicles, and with many constraints related to energy consumption and environmental pollution, there is more and more research being published related to electric vehicles, giving attention to various goals, such as: reducing energy consumption, improving efficiency for the electric motors, optimizing the auxiliary systems, improving the energy storage capacity, and developing charging system capabilities for the electric vehicles.
Along with these aspects, the thermal comfort of the passengers and drivers, even in extreme conditions, are being studied worldwide, from small electric cars to large electric vehicles, such as electric buses.
Electric buses have many benefits compared with their thermal engine counterparts: they have no emissions and do not pollute the air, they are low noise vehicles and have fewer vibrations, offering superior comfort for the passengers and, importantly, they can use locally produced (and renewable) electric energy.
To make the transition from the conventional engine buses to the electrical ones, authorities and public transport operators have to invest not only in the establishment and development of electric bus fleets but also in new infrastructure. Some countries are planning to ban vehicles with thermal engines, while in some cities there are areas considered to be low or zero emission zones. Some cities are part of the C40 Fossil Fuel Free Street Declaration, which promotes the use of only zero emission buses by 2025, asserting that most of the participating cities will use emission-free vehicles by 2030 [
1].
More than 1 million buses are used in Europe and around 690,000 buses are in use in the European Union, with the average age of the buses being about 12 years. Thermal engine buses account for more than 94% of the EU fleet, and less than 2% are battery electric or hybrid electric buses [
2].
Some limitations are still obstructing the expanding use of electric buses, as follows:
The limited range and power, as compared with conventional thermal buses.
The necessity of new infrastructures, such as the power grid and systems for battery charging.
The availability of personnel qualified in technologies different from conventional vehicles, for the maintenance of the electric buses.
There are various types of electric buses, which vary depending on whether electrical energy is generated or stored onboard. Hybrid electric, fuel cell electric, and full battery electric buses are currently being used around the world [
3].
Hybrid electric buses use both an internal combustion engine and an electric motor to power the vehicle. Because they have partially a similar technology as traditional engine buses, they are a convenient transition to electric vehicles; however, they raise the same issues as classical vehicles (air pollution and dependence on conventional fuel).
Fuel cells are based on a chemical reaction between stored hydrogen and ambient oxygen to generate electricity. They assure long range and low emissions but are expensive and require a special infrastructure to store the hydrogen and to refuel the vehicles.
Full battery electric buses store all the necessary energy in an onboard rechargeable battery pack. They have no emissions and are energy efficient but have limited distance range and require a charging infrastructure [
3].
Moreover, there are various charging systems, such as overnight charging (large size batteries are charged statically from the grid at the depot, mainly during the night, for up to 5–8 h); opportunity charging (medium size batteries are recharged at passenger stopping points or at the bus terminals); or a combination of depot charging and opportunity charging.
Irrespective of the types of electric bus and charging system, the energy from the power source is used for the traction needs and for the auxiliary systems on the vehicle (ventilation, heating, cooling, interior and exterior lights, passenger information devices, ticket vending machines, and others).
The energy required by the auxiliaries could reach up to 35% of the total energy consumption of the electric vehicle, and, depending on the environment conditions—especially the external temperature—the non-traction needs could consume up to 50% of the total energy on vehicles [
4], or even up to 70% in very cold days in winter, when the heating system is used at full power [
4,
5]. Thus, the reduction in energy used for non-traction needs is a main challenge in order to reduce the total energy demand on the electric buses. It is particularly important for battery vehicles, because the batteries—as the energy source—have a limited capacity and limited range [
4].
From all the auxiliaries, the heating and cooling consume the most energy—up to 35% [
6]. Moreover, the temperature inside the vehicles depends on the cabin volume: at the same driving conditions, a large vehicle has a different temperature than a small class one. The class of the vehicle, reflected in the quality of the equipment and materials, will also influence the warming and cooling of the vehicle [
7].
Conventional vehicles use internal combustion engines, which produce enough waste heat to heat up the vehicle, through the engine cooling circuit via a heat exchanger. Nevertheless, modern thermal engines are more efficient and produce less waste heat; therefore, supplementary electric heaters are necessary to heat the cabin in cold conditions [
8].
Electric vehicles use electric motors which generate low amount of waste heat [
8]. Even the heat released from the main battery pack is not enough to heat the interior of an electric bus, being needed for other heat sources. Therefore, the energy for the heating system is supplied by the power source, the battery pack, which is mainly used for driving and has limited capacity.
The heating has a significant influence over the range of the electric vehicle, reducing the range of the electric vehicle by half, or even more with an external air temperature of 0 °C [
5].
In order to decrease the energy consumption for the HVAC systems on electric buses, several solutions have been proposed, as follows [
8,
9,
10,
11]: using recovery heat from the traction batteries; an integrated air conditioning and heating system; improved control systems for the heating system; door air curtains/air screened doors to reduce the heat exchange between the inside and outside of the bus [
12]; heat pumps; thermal pre-conditioning; complex additional heating equipment. Infrared radiation heating in the vehicle cabin has also been studied for electric vehicles [
13,
14]. Solid media high-temperature thermal energy storage systems are also being researched for battery electric vehicles [
15].
However, many of the above solutions are based on well-known methods, combined with improved strategies for control and optimization.
Therefore, research aiming to improve the heating are in demand for electric vehicles, in order to consume less energy while maintaining passengers’ thermal comfort. Thus, new HVAC systems structures and advanced control will bring the best benefits, rather than using advanced cabin materials or increasing thermal isolation [
8].
Urban road transportation usually uses technologies adapted from the car industry. In public transportation, where the doors open frequently, allowing passengers to exit and enter the vehicle, it is difficult to ensure a high comfort level. The most common solution for the heating system involves the use of engine cooling water, along with electrical resistance heating [
12].
A combined heating configuration composed of zonal air flow and heated surfaces—driver seat, steering wheel, and floor mat—can reduce the heating energy by up to about 28%, while maintaining an equivalent thermal sensation. By simulation, [
16] found that the combination of zonal air and surface heating can lead to a 7–19% improvement of the bus range.
Cabin preheating could also increase an electric vehicle range from 4% to 10% for 20 min of pre-conditioning [
8]. There are basically two ways of reducing the power consumption for heating the electric vehicles, as follows: (1) reduction in heating loads and (2) improvement of the thermal system efficiency [
8].
The heated load for an electric vehicle includes ventilation load and ambient load. The ventilation load is necessary for two reasons, as follows: the first is to assure the air quality inside the cabin (to keep a low concentration of CO
2) and the second is to prevent fogging on the windshield and on the other windows [
9]. Using recirculated air is a method of reducing the ventilation load, along with using a low thermal conductivity glass for the windshield and windows.
The ambient load is a product of the temperature difference between the cabin air and the external environment, because the heat flows through the vehicle body structure. Some studies on using thermal isolation materials for vehicles showed up to 18% less heating load. On the other hand, thermal isolation does not always solve the issues, because it can lead to a strong greenhouse effect during the warm days in summer [
9].
Zonal heating and inner surface heating (heated seats) are also methods of reducing the heating loads requirements.
In this article, the main goal was to calculate the heat loss for a typical 12 m electric bus, considering the conditions of a harsh winter day in Romania. Heat loss components were calculated in order to determine the most affected zones of the bus. The analyzed vehicle was actually a trolley bus (supplied from the contact lines), which has been adapted to also operate independently on traction batteries during its route. Due to the limited onboard battery, the distance to be covered as an autonomous vehicle is quite limited, especially in cold weather in winter, when the heating system is in use and the necessary power for the heating system is very high (up to 30 kW). The goal of our work was to calculate the heat loads inside this specific electric vehicle, with the aim to find the possibilities for optimizing the energy consumption for this type of vehicle.
Thermal simulations were carried out in order to estimate the heat flux through the structure of the bus (windows, walls, roof, floor, and doors). The calculated data for the necessary energy to heat the bus were compared with the heating system data from a real electric bus.
3. Heat Load Estimation for an Electric Bus
The necessary power for heating the cabin of the electric buses is estimated in some studies, including [
4,
6,
21,
22]. According to [
6], the energy consumption for heating a bus can reach up to 35% of the main battery’s energy. In [
4], data is presented for 12 m electric buses, with the necessary heating power varying from 5 kW up to 25 kW in absolute value, depending on the weather conditions and the time of the day.
In case of resistance heating, the energy demand can, in a worst-case scenario, double or even almost triple the vehicle’s energy consumption. From measurements on a 12 m electric bus, it was estimated that the average electric power necessary to keep the cabin’s temperature at 17 °C on a cold winter day with a −10 °C environment temperature was about 24 kW [
21].
Another calculation estimates a heat loss of about 17.4 kW for a 12 m length bus, depending on the materials of the vehicle and considering only the thermal conduction through the structure of the bus and the heat loss through the open doors [
22].
In this article, for the heat loss estimation, a typical low floor electric bus, with the following characteristics, is considered [
23]: 12 m length, 100 passengers capacity, 150 kW electric motor, 3 doors, maximum speed 60km/h. The heating system of the bus has an installed power of 33 kW and is composed from 4 heaters of 6 kW each, used to heat the passengers’ cabin, and a 9 kW heater for the driver’s area. The vehicle is operating mainly as a trolley bus (supplied form the contact lines), and it is adapted to operate also independently on traction batteries during its route.
The estimation of the heating loads assumes difficult case conditions of a cold day in winter with a −10 °C temperature of the outside environment. Heat loads are calculated for continuous working conditions and the heat load required at first start of the bus was neglected at this stage.
The aim was to estimate the rate of heat to be added inside the vehicle by the heating system in order to maintain the desired conditions for thermal comfort, with a temperature of 20 °C being considered for the interior of the vehicle. Additionally, the heat loss by its component is to be determined in order to estimate the area consuming the most energy.
3.1. Metabolic Heat Load Generated by the Passengers, met
Because passengers of a bus sit and stand, the heat load can be estimated separately, as in [
18], with the metabolic heat production rates of 60 W/m
2 and 70 W/m
2, respectively, and with 120 W/m
2 for the driver of the bus. These values are related to the surface area of a person, of about 1.80 m
2 [
18]. Other authors [
24] consider, for the sitting passenger, 55 W/m
2 and 85 W/m
2 for the driver.
Taking into consideration that, during the cold days in winter, the heat released by the human body into the surroundings is limited because the people are dressed in thicker clothes—these thermal values are to be considered for their lower values. Thus, for the calculation, a medium value of 60 W/m2 is accepted, which, for a person, results in 60 × 1.8 m2 = 108 W.
Buses are rarely at their full capacity, the average occupancy of a city bus being less than 40%, or even about 30% [
25]; therefore, for the heat load generated by 40 passengers, a 4.32 kW value is estimated.
3.2. Solar Heat Loads—
3.2.1. Direct Radiation from the Sun
Heat gain, due to direct radiation, depends on the direct normal irradiance—the incident angle of the radiation—on the area and the transmissivity of the surface. The heat gain due to the direct radiation can be estimated as follows [
18]:
where
A is the surface area [m
2],
τ is the transmissivity of the material,
IDir is the direct normal solar radiation [W/m
2], and
θ is the incident angle of the solar radiation.
3.2.2. Diffused Radiation Due to the Dispersion in the Atmosphere
This is a heat gain due to the dispersion of the solar radiation on the atmosphere and has specific calculation formula [
18], as follows:
where
A is the surface area [m
2],
τ is the transmissivity of the material, and
IDif is the diffused solar radiation [W/m
2].
3.2.3. Reflected Radiation Due to the Ground
In this case, the heat gain is due to the radiation reflected by the ground. Taking into account the winter weather, when the roads are cold, this heat gain is to be considered as negligible for our calculation.
3.2.4. Solar Heat Gain Estimation for Romania
Romania is situated in the Central to East European continent area, between 43°37′ and 48°15′ latitude North, and 20°45′ and 29°41′ longitude East, having a temperate continental weather, with about 6 months of cold weather (from October to March). January and December are the coldest months of the year, with average temperatures of about −6 °C at midday, with lower temperatures (down to −10 °C) during mornings and evenings, and with minimum temperatures of down to −24 °C (based on the official data from the National Meteorological Administration from Romania [
26]). During this 6-month period, the solar irradiation to be considered is usually between 9.00 and 15.00 h of the day (direct radiation load decreases due to the decrease in the sun elevation angle for the simulation period, which happens after midday [
24]), having clear sky for about 40% of the day [
27].
The solar heat gain for a bus varies permanently because it depends on a multitude of factors: time of day, clear or covered sky, the angle of incidence of solar radiation, the variable position of the vehicle, the possibility of shading it depending on the route (especially in the urban areas, with boulevards sheltered by high buildings), varying surfaces, and the transparency of the windows, etc. Therefore, the estimation of heat gain from solar radiation can only be carried out roughly, considering several simplifying hypotheses.
Existent data about the solar irradiation in Bucharest, the Romanian capital, during December and January are summarized in
Table 1—global irradiation includes measurements for both direct and diffused solar radiation.
If
HA12 is the “Hourly average of Sun’s brightness, around 12 o’clock”, and
IglC and
IglO are the global solar irradiation for the clear sky, respectively, for the overcast sky, then the maximum solar irradiation of the bus happens at noon and can be calculated with the following relation:
With the data in
Table 1, the above relation shows
IMax = 197.7 W/m
2. However, the solar irradiation of the bus during these two winter months manifests for maximum of 6 h per day and not all is transformed into the heat. Factors that reduce solar heat inputs, such as the transmissivity of windows, exterior shading, and reflective surfaces, etc., must be taken into account.
The 12 m bus has a transparent window area of 29 m
2, and for a double pane window the transmissivity is
τ = 0.75 [
18]. Keeping the same hourly average of Sun’s brightness and applying Relation (7) for the daily average of solar irradiations, the average heat gain is given in
Table 2 for both of the winter months considered.
The presented calculation is a rough estimation of the heat gain and daily heat input. Contributions of the shading factor or reflected radiation, due to the ground, are neglected. Results showed that the most demanding month for the heating installation is December.
3.3. Heat Flow Due to the Fresh Air Supplied by Ventilation, Which Is Necessary for Passengers’ Needs—ven
Ventilation and ambient loads are functions of the temperature difference between the cabin and the ambient load. The air flow rate for the buses depends on the operating of the air conditioning system, with values between the 0.05 m
3/s and 0.3 m
3/s [
28]. For the city buses with frequently stops, the fresh air supplied by ventilation is dominated by the air flow through the open doors, and the ventilation can be used for the lower value, which is 0.05 m
3/s [
28]. Heat transfer due to the ventilation can be estimated with Formula (8) and depends on the temperature difference (Δ
T), the specific heat, the air density (
) and the air flow rate (
) [
29], as follows:
For an air flow rate of 0.05 m3/s, an air density of 1.27 kg/m3, a specific heat of 1009 J/kg*K, and a gradient of temperature of 30 °C, the heat transfer due to the ventilation is ven = 1.922 kW.
3.4. Heat Flow Changes with the Ambient Load Due to the Temperature Gradient between the Bus Structure and the Exterior Environment (Ambient Heat Load)—amb
Heat transfer takes place from warm bodies (areas) to colder bodies (areas). So, in the winter cold days, the heat transfer takes place from the heated bus cab to the cold outside environment Thus, a large amount of heat is loss into the atmosphere through the windows, walls, roof, floor, and doors. This heat loss depends on the area of the surfaces, on the heat transfer coefficient (for each material or an overall estimated coefficient), and on the inside and outside temperatures. The heat transfer is estimated considering the conduction through solid materials, the convection between the interior air in the bus and the inner surfaces, and the convection between the exterior air and the outer surfaces of the bus (
Figure 2).
For a wall composed by a single layer, the heat transfer is calculated with the following equation:
where
A is the cross-sectional area [m
2],
U is the heat transfer coefficient [W/m
2 K],
Ti is the inside temperature [°C], and
To is the outside temperature [°C],
The heat transfer coefficient is calculated as a combination of conductive and convective heat transfer, which is given by [
18]:
where
hi is convective heat transfer coefficient between the interior air and the inner surfaces of the wall [W/m
2 K],
ho is the convective heat transfer coefficient between the exterior air and the outer surfaces of the wall [W/m
2 K], L is the thickness of the wall [m], and
k is the conductive heat transfer coefficient of the wall [W/mK].
For the vehicles, the convection coefficients of the outer surfaces depend on the vehicle speed, and for the inner space, the coefficient depends on the air speed inside, relative to the inner surfaces [
18], as follows:
with
v as the relative air speed to the surface [m/s].
In order to estimate the heat loss as accurately as possible, for the walls composed by multiple layers, the thermal contact resistance between the layers of the bus structure will be considered also. Thus, knowing the heat loss on its components will be possible to estimate the possibilities to improve the bus structure to reduce the heat loss.
With limited information on the roughness profile, the density, and the radii of the contact spots, the estimation of the thermal contact resistance brings uncertainty into the calculation. Considering [
30,
31,
32], the thermal contact resistance of the interface between two layers is given by the ratio between the difference of temperatures along the interface and the heat,
[W], as follows:
where
is the difference of temperature along the layers’ interfaces.
Based on heat flux,
q = /A [W/m
2], related to the surface area, the resistance can be considered as follows:
Thus, for a multiple layered wall (with thicknesses (
Lj) and conductive heat transfer coefficient (
kj)), the overall heat transfer coefficient must be calculated, including the thermal contact resistances between the layers, as follows:
where
Lj, and
kj are the thickness and conductive heat transfer of the layer
j, and
rcj is the thermal resistance for the layer interfaces.
3.4.1. Heat Loss through the Windows of the Bus—w
The heat lost through the windows is estimated as heat loss due to conduction through the windows and due to the convection to the interior and exterior air. There are various types of windows used for the buses, differing by glass thickness, the quality of the glass (clearness), or by the types of the windows (one layer or two layers with inside air isolation). For this calculation, it was assumed that the windows have a single layer of 6 mm glass thickness and the area of the windows of the bus is 29.0 m2.
Using Formulas (8)–(10) and a vehicle speed of 40 km/h (11.1 m/s) (as the maximum speed for the city movement of the bus), the heat loss calculated for the all window area of the bus is w = 5612 W, for U value = 6.45 W/m2 K.
For the air inside the vehicle, the speed is assumed to be zero, so hi = 9 [W/m2 K], and k = 1.05 [W/mK] is the conductivity of the glass.
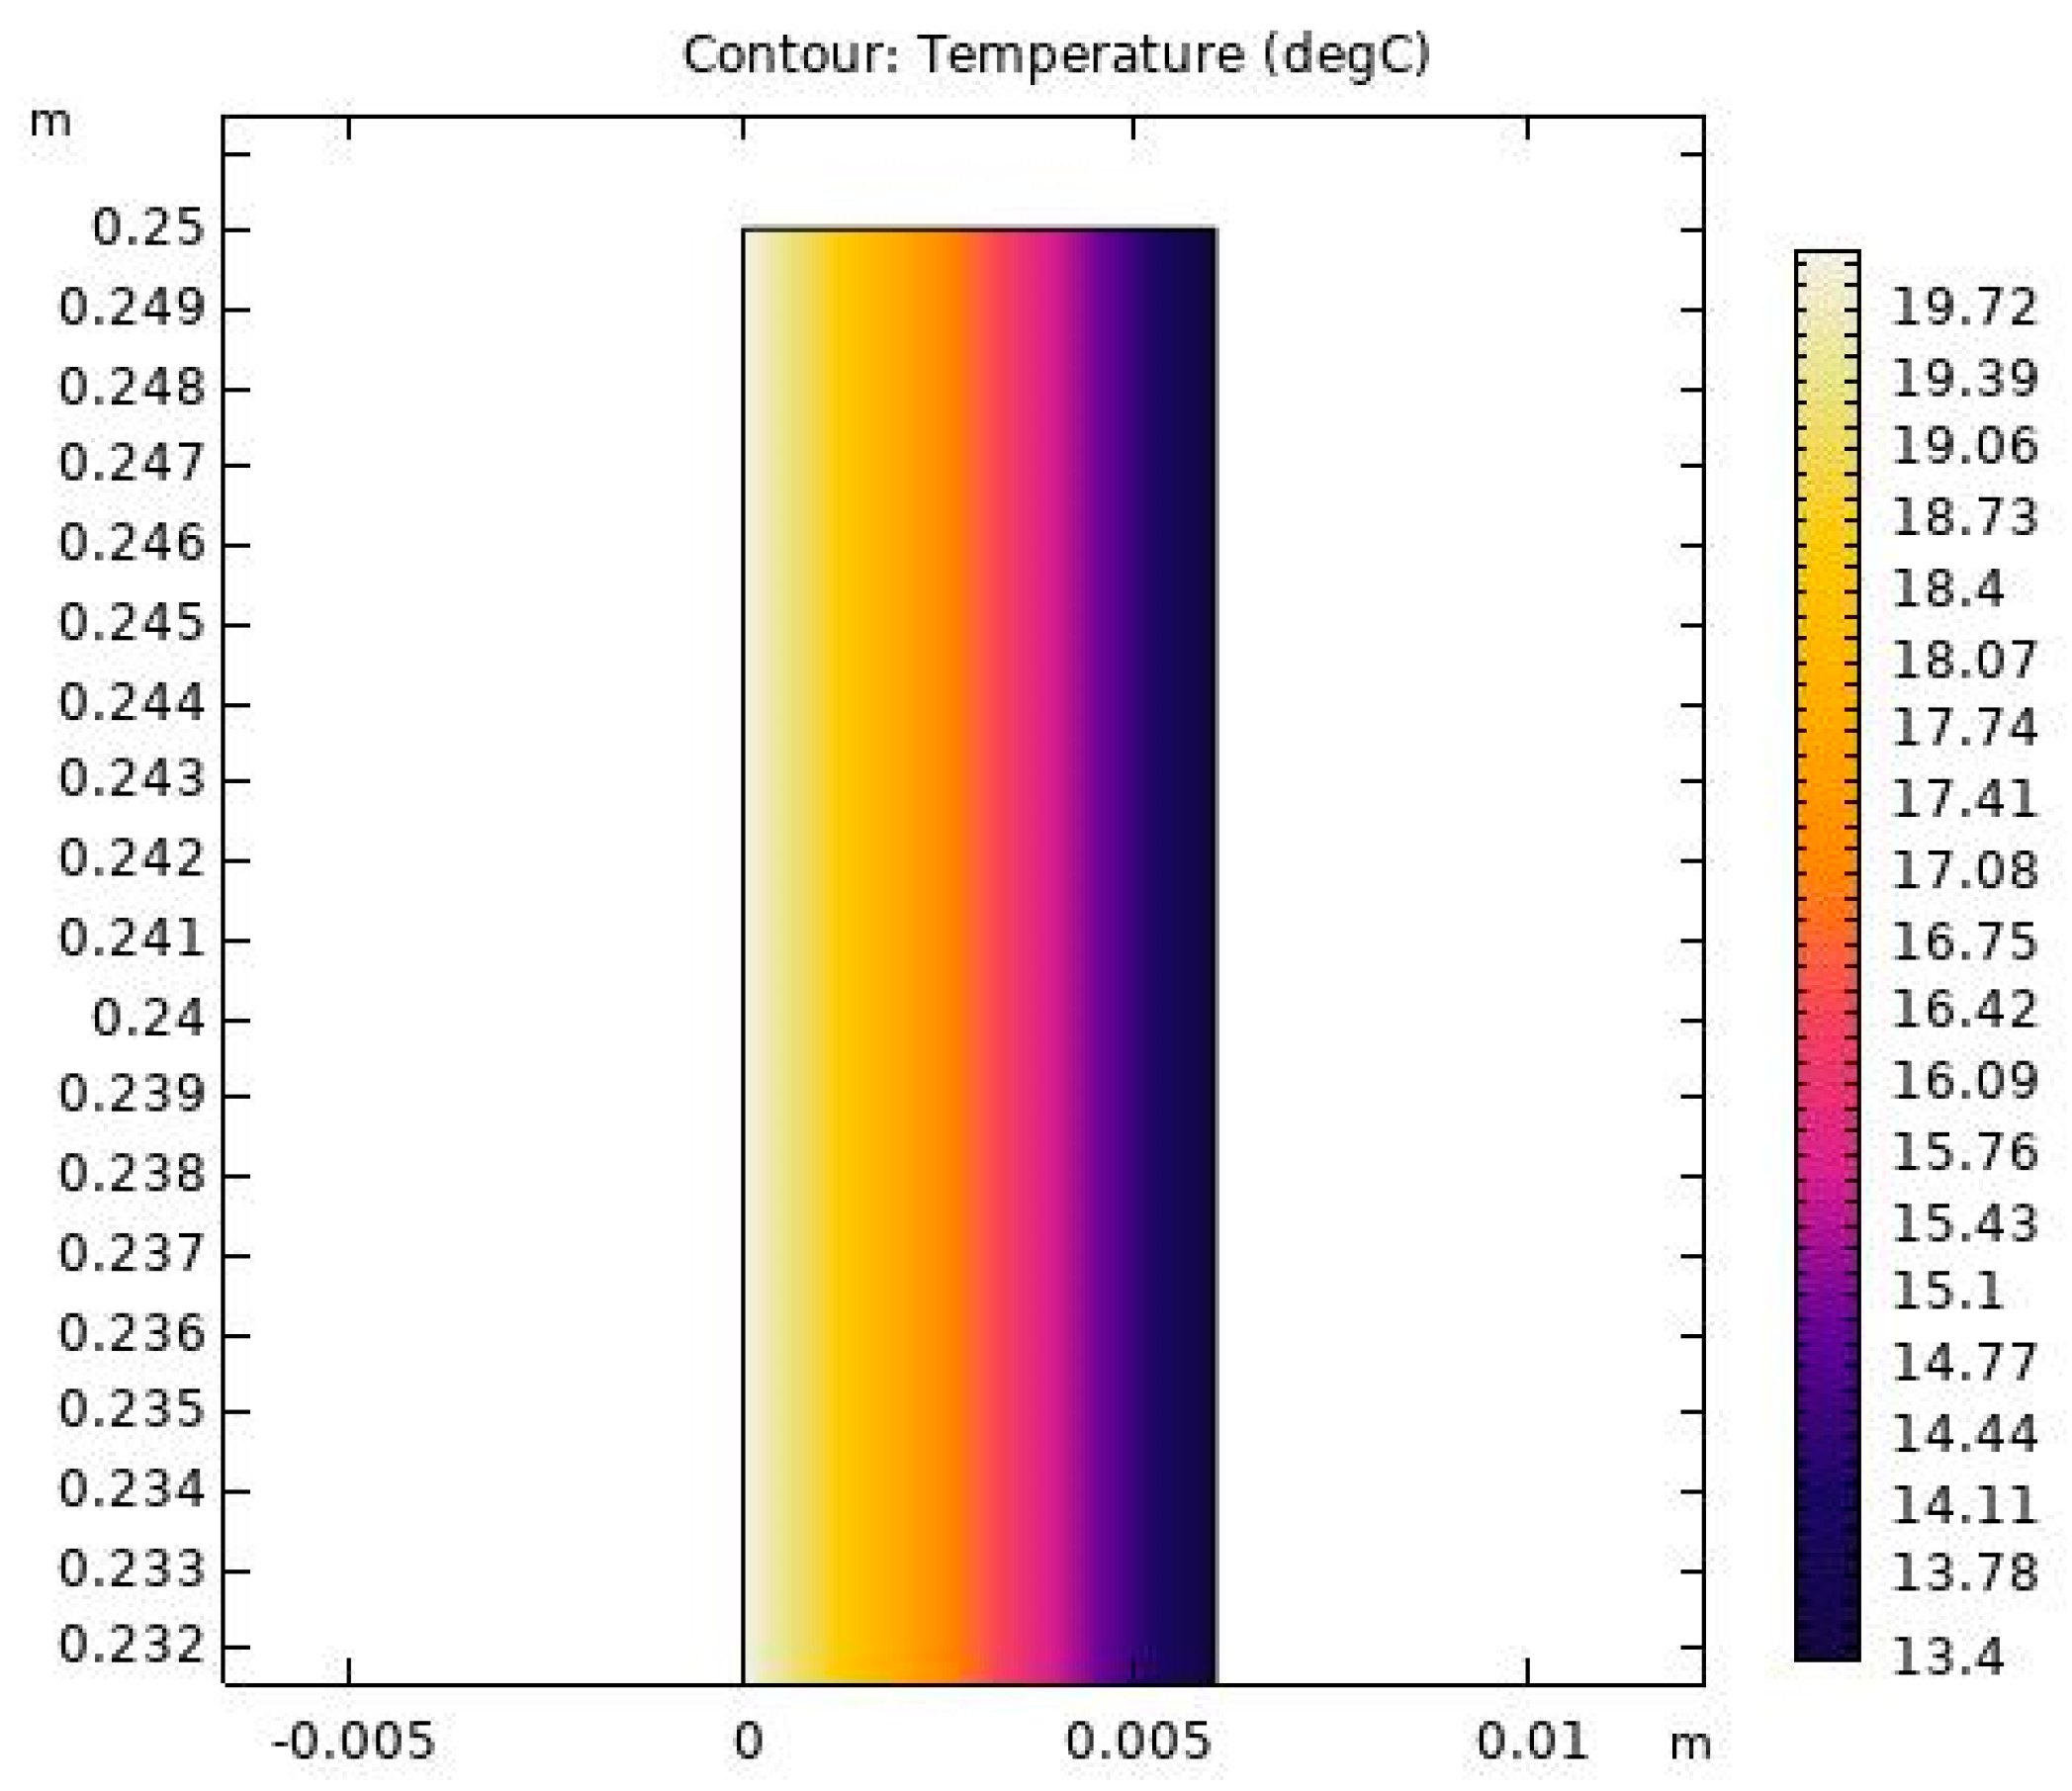
In order to estimate the real temperature on the surfaces of the windows, a simulation using Comsol Multiphysics software has been performed. The simulations were made for the steady-state regime by modeling the geometry of the bus structure and considering the actual values for the parameters of the materials.
Figure 3 shows the thermal simulation through a window of the bus considering an inside temperature of 20 °C (left side of the image) and an exterior temperature of −10 °C (on the right side of the image). The exterior temperature was chosen assuming a difficult case scenario for the month of December in Romania. As can be seen, the temperature on the external side of the glass is of 13.4 °C.
3.4.2. Heat Loss through the Walls of the Bus—wall
The walls of the bus are made from three materials, that is (from inside to outside): laminated wood (MDF), polyurethane foam, and a sheet of steel. Their thickness and thermal conductivities are presented in
Table 3.
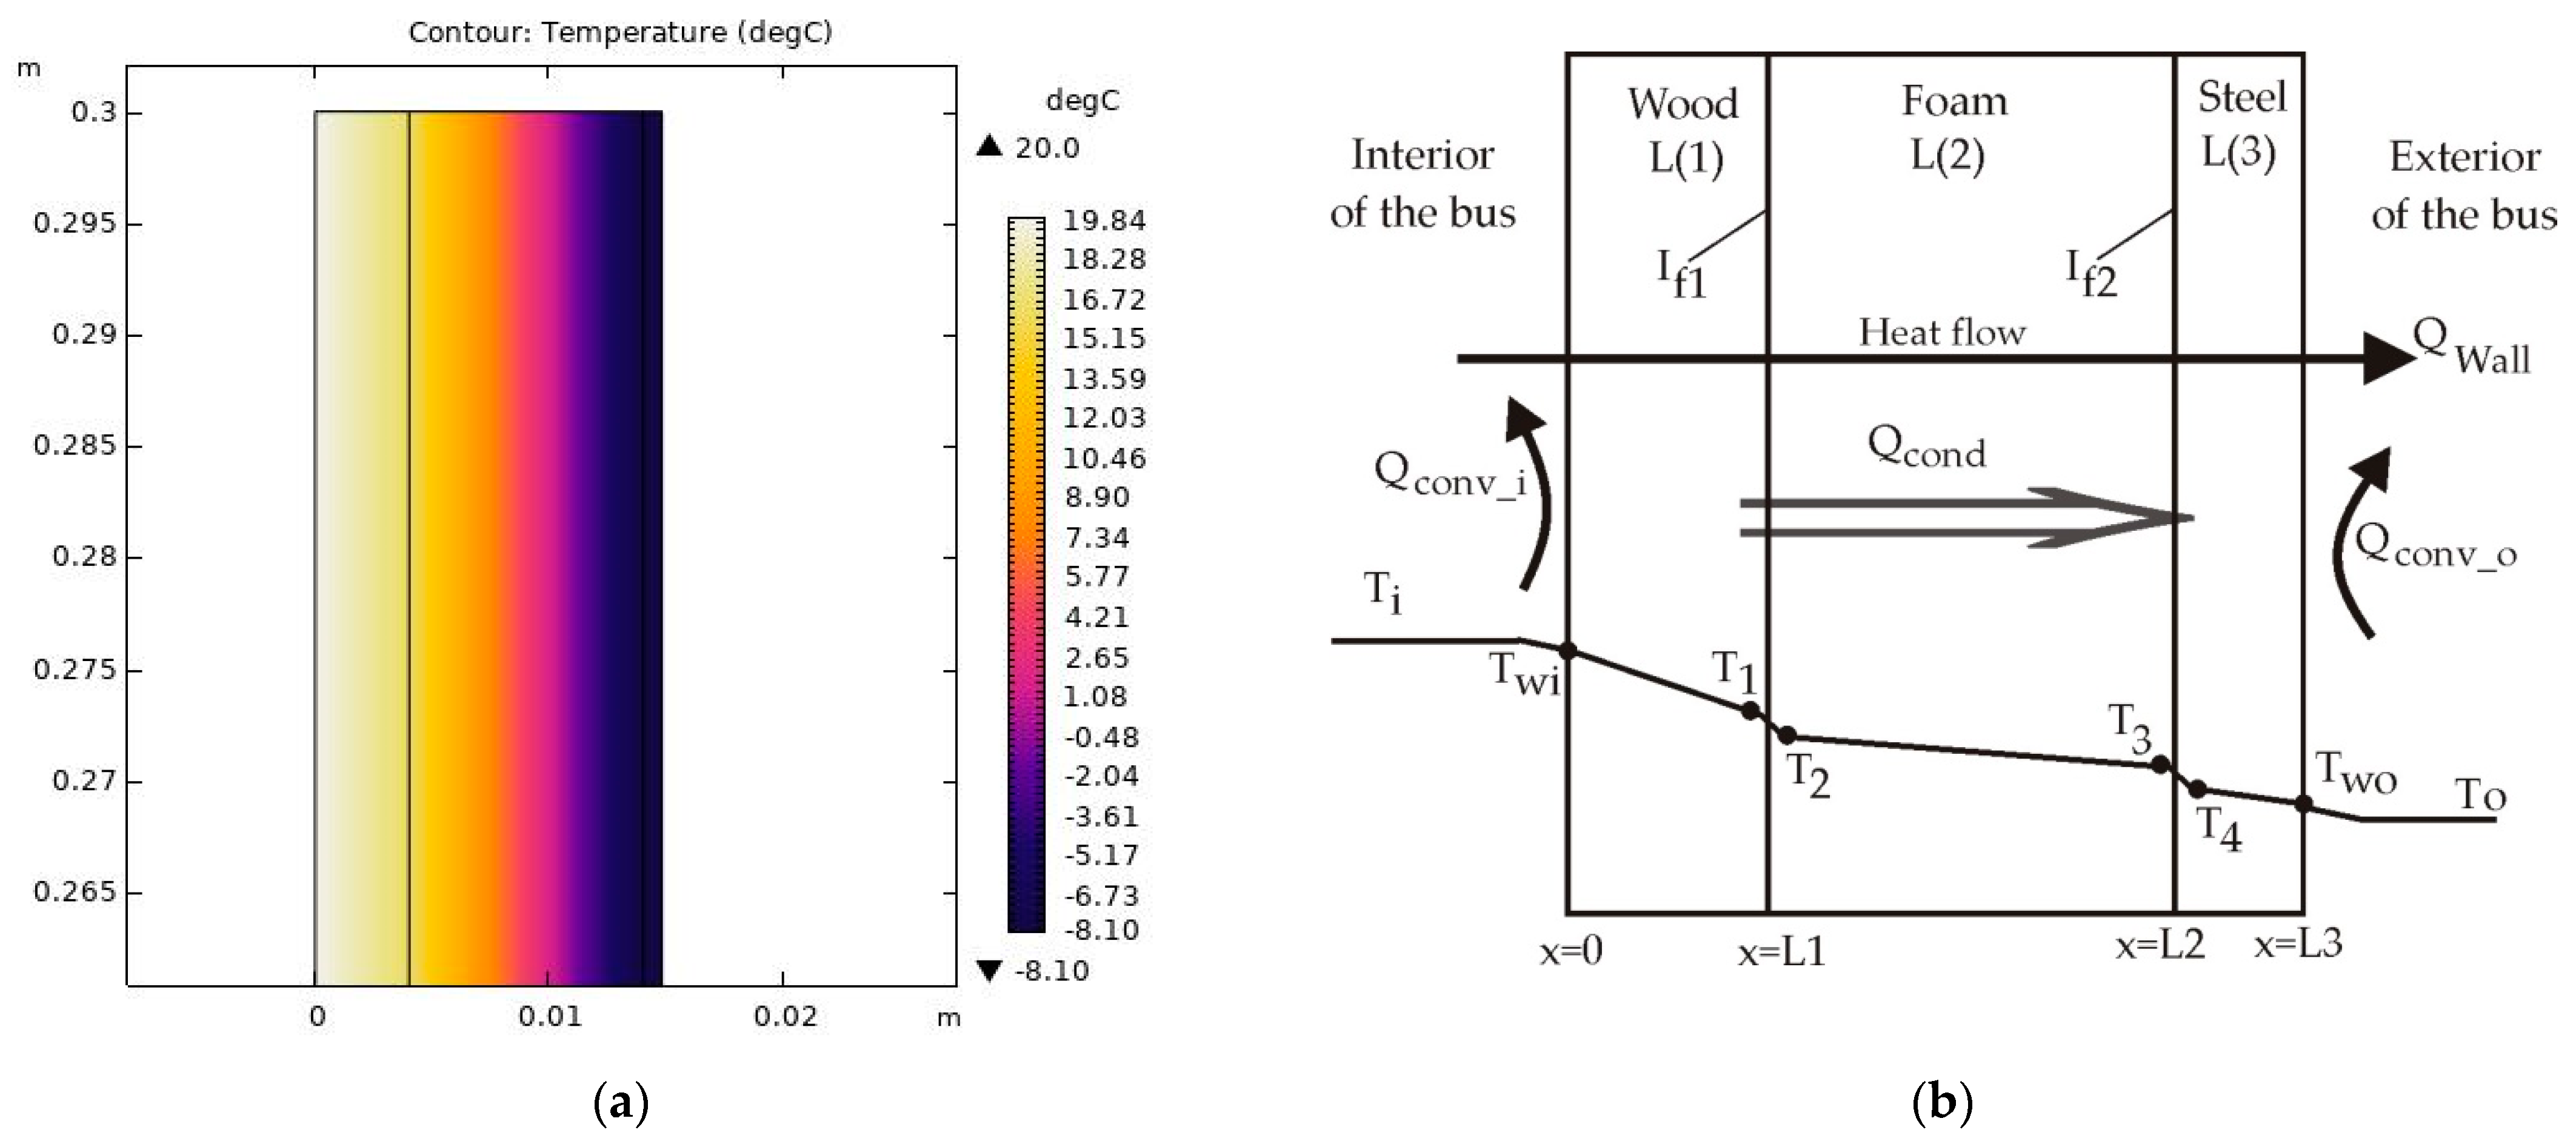
As for the simulation, in
Figure 4a, the model of the three layers of the wall is presented, with a temperature of about −8.1 °C on the exterior wall of the bus, with main thermal loss from the steel and the foam in the wall. The interior side of the vehicle is on the left side of the image (
Figure 4a). Vehicle speed is incorporated into the model as the velocity of the fluid (the exterior air).
For the triple layered wall of the bus (
Figure 4b), the overall heat transfer coefficient is calculated as follows:
The thermal contact resistance for the wall is the sum of the thermal resistance for the two interfaces I
f1 and I
f2 (
Figure 4b). For the first interface thermal resistance estimation (between the layer of wood, L(1), and foam, L(2)), we assumed that the heat transferred through the surface area of the wall is constant, and we can write the following:
where
[°C] is the difference of temperature along the layer, L(1).
For the interface zone (between the layers L(1) and L(2)):
[°C], with
T1 and
T2 indicating the temperatures on the interface of the layers L(1) and L(2), between wood and foam layers respectively (
Figure 4b).
The interface temperature
T1 and
T2 are estimated from the Comsol simulations (
Figure 4a), resulting
T1 = 16.27 °C and
T2 = 16.12 °C.
With these values, and using the Equations (16) and (17), the first interface shows = 0.002 [K/m2 W]. Similarly, but considering T3 = −8 °C and T4 = −8.14 °C, the second interface is calculated, between the second and the third layer, as follows: [K/m2 W], for the wall of the bus, is 0.00208 [K/m2 W].
For the speed of 40 km/h, with 20 °C inside and −10 °C outside temperatures, and for an area of the wall of the bus of Awall = 27 m2, the U value is determined as Uwall = 2.283 W/m2 K and the heat loss through the wall is wall = 1849 W.
3.4.3. Heat Loss through the Roof—roof—And the Floor of the Bus—floor
The roof of the bus is composed of a layer of iron sheet, a layer of polyurethane foam (as isolation), and a volume area filled with various equipment (air conditioning, pipes, power supply equipment, and power conductors from the power collecting system). These equipment elements are made mostly from metals and cover about 50% of the roof area. Due to this complex structure of the roof, in order to estimate the U value for the roof, including this complex area (composed of metals materials and air), we consider this area as composed of two parallel layers of metals and air.
The simulation of the heat transfer through the roof is presented in
Figure 5a, which shows the differences in temperatures between the metal area of the third layer (on the left) and the air area (on the right of the third layer).
For the speed of 40 km/h a U value for the roof of 1.87 W/m2 K, the heat loss is roof = 1632 W. This calculation include also the thermal resistance of the roof layers (rcroof = 0.008 [m2 K/W]).
The floor is composed of three layers: an iron sheet, a laminated wood layer, and a PVC layer for the intensive transport of people (
Table 4). The U value (at 40 km/h) for the floor (including thermal resistance
rcfloor = 0.0152 [m
2 K/W]) is 2.747 W/m
2 K and the heat loss is 2425 W.
The total heat loss through the windows, walls, roof, and floor of the bus, for a speed of 40 km/h, is determined as amb = 11,518 W.
The total ambient heat loss (heat loss through the windows, walls, roof, and floor of the bus) is presented in
Table 5 for the various speeds of the vehicle (0, 20, 40, and 60 km/h). These values show a significant variation of heat loss between the moment when the bus stops and when it is in motion. It is worth mentioning that the influence of the thermal resistances is less than 3%. Moreover, the differences of heat loss between various speeds are not too high: they are about 3–5%.
3.5. Heat Loss Due to the Doors Opening
Estimating the heat loss through the open doors of the bus when it is stopped in stations is quite difficult, due to the air flow complexity between the inside of the bus and the exterior air of the environment, which depends on the random process of the weather conditions and wind speed and direction. The air is assumed to be an ideal gas and is compressible.
When a pressure is applied to the interior air, the volume of the air is modified with a volume equal to the amount of the outside air, which is pressurized into the vehicle cabin, and therefore an air exchange is caused in the process. Some of the income air from outside is mixed with the inside air and is removed through the opening of the doors, due to the airflow direction change and due to the gradient of the temperature and the pressure, this is proportional to the surface area of the opening [
33].
The worst-case scenario is when the wind blows directly into the open door, as presented into the cross-section of the bus structure, showing an opened door (
Figure 6).
The heat loss through an open door of the bus is estimated with the following formula:
where
is the flow rate of the air [m
3/s],
is the air density 1.27 kg/m
3, and
c is specific heat of the air 1009 J/kg·K.
According to [
33], for a single opening enclosure (one open door), for a wind velocity of 10 m/s (a medium wind speed value during a cold day in winter), a flow rate of
= 0.4 m
3/s for a surface area of 1.44 m
2 is found. Thus, using Formula (17), heat losses result of
door = 15,377 W for a single open door and, respectively, of
3door = 46,131 W for all the three open doors of the bus,
Obviously, usually the doors do not stay open too frequently. The average stop time for a city bus is about 30 s [
21], with an average running time between stops of 4 min, resulting the doors being open for 1/9 h. As consequence, the hourly heat loss from the open doors is 5.125 kW. Depending on the route, the number of stops, and the number of passengers getting on and off the vehicle, this heat loss may have various values.
3.6. Heat Load Due to the Electric Motors and Heat Load Generated by the Traction Battery
The actual electric vehicles use high efficiency electric motors which generate low amount of waste heat [
8]. Even the heat released from the main battery pack is not enough to heat the interior of an electric bus, and for the present calculation of the heat inside the bus these heat losses are considered as negligible.
3.7. Heating System Load to Assure the Thermal Comfort for Passengers
Summarizing the heat loads on the bus, a heat gain of 5.72 kW (the sum of
met and
sun) and a loss of energy of 18.5 kW (the sum of
ven,
amb, and
doors) is found. As consequence, the necessary load for the heating system of the 12-m long bus is about 12.79 kW. For higher speeds (max. 60 km/h speed of the bus) and for even harsher winter conditions, this value grows up to 14 kW. This load has to be compensated by the heating system, regardless of the technology used to heat the bus [
31].
The analysed existent bus is equipped with 4 heaters of 6 kW in the passengers’ cabin and 1 heater of 9 kW in the driver’s area. This results in 33 kW of power installed for the electric bus heating system, which, compared with our model, is an oversized heating system [
34,
35]. The oversizing is only useful for more quickly obtaining the ambient comfort parameters in the bus.
4. Discussion
Research on heating in vehicles is of major importance, especially in cold weather zones, but it is not wide spread over all types of vehicles. Most studies are in the area of automobiles, with few on buses, due to the fact that analyzing and simulating a bus (which is significantly larger and has an intricate structure) is a more complex and time-consuming process.
This article aimed to respond to some of the thermal problems related to electric buses. Estimation of the necessary heat to assure thermal comfort during cold winter days is quite important due to the limited power of these types of electric vehicles. Additionally, along with the limits in energy stored onboard and the vehicles complexity, their particular operating regime results in a complex study due to the various numbers of passengers, doors frequently opening, and the necessity to operate throughout the day.
This study estimates the eight main heat load components on electric buses. Two of them were assumed to be negligible for our thermal model. Firstly, the heat load due to the electric traction motor, and secondly that due to the traction battery pack, as the actual elements are highly efficient.
Therefore, six heat loads were considered for our model: metabolic heat load, Sun heat load, ventilation heat load, ambient heat load, heat flow through the open doors, and the heat load generated by the heating system in the bus. These heat loads were calculated for a 12 m electric bus with the following characteristics: 100 passengers, 150 kW electric traction motor, 3 doors, and 33 kW installed power for the heating system. The calculation was estimated for a harsh winter cold day of December in Romania, with a median temperature of −10 °C. The thermal comfort of the passengers was calculated for a 20 °C temperature inside the bus, resulting a gradient of temperature of 30 °C.
The value of the metabolic heat load depends on the passenger numbers in the vehicle, and the Sun heat load depends strongly on the weather conditions. These heat loads are as a contribution (a heat gain) to the inside bus heating (considered as positive in the thermal model of the vehicle), and, for a harsh day in winter, these represent about 22% and less than 15%, respectively, of the necessary heat of the bus. The heat load from ventilation is an energy-consuming heat load (with energy supplied from the onboard storage system) and it represents less than 10% of the necessary heat for the bus. Being a mandatory system in the vehicle, its contribution to the vehicle heating can be considered to be a heat gain. Thus, these three heat loads assure an input of heat of about 23% of the necessary heat inside the bus.
Heat loss on the bus is composed of the ambient heat loss through the bus structure and the heat loss through the open doors at the stops, with an average value of energy demand of 12–14 kWh. Of these, through the bus structure the heat loss is the most significant, with its four components—the windows, the walls, the floor, and the roof—representing about 78% of the total heat loss. The main heat loss is through the windows (about 26%), while the other three heat loss components have almost the same contribution (about 8.1–8.3% each).
Heat loss through the open doors depends on the route of the bus, the number of stops, and the number of passengers getting on and off the vehicle, with an estimation of 22% of the total heat loss.
The heat load balance led to the conclusion that the heating system must supply a minimum heat load of 18.5 kW. This value is useful for more successfully designing the heating system and managing its operation. The thermal model used in this study allows optimization of the process, by using various less frequently studied heating solutions in order reduce the energy consumption for the heating, and implicitly reduce the CO2 footprint, while preserving the thermal comfort of the passengers and driver.


 ,
, 


