1. Introduction
Advances in new technologies are shifting away from personal computers and notebooks to mobile devices, which are more capable of fulfilling tasks than ever before. By 2021, it is predicted that approximately 3.8 billion people will own and use a smartphone, where the leading companies ship more than 200 million units [
1,
2]. However, there is still space to grow in a lot of countries, like China, Brazil, India, or Russia, where less than 70% of the population own a smartphone [
3]. Combined with the fact that users store a lot of sensitive personal data, like passwords, pictures, and even banking information on their mobile devices, it makes them an increasingly popular target for theft [
4]. To combat entrance to these highly personal devices, manufacturers have implemented mechanisms of different complexity.
It has already been shown that simple authentication mechanisms, like PIN or pattern-based authentication methods, can be easily observed by an adversary and do not provide sufficient security [
5]. However, even more sophisticated authentication mechanisms, like Apple’s FaceID [
6] have flaws, since they are built on the assumptions that it is sufficient to use a single verification mechanism and that a longer session is exclusively operated by a single user. Those aspects imply that if the device is stolen, or even if the user leaves it unattended for a short amount of time, access to the resources the system offers is still available and is no longer protected.
To mitigate these mentioned flaws, continuous biometric authentication systems are studied and developed, which provide an authentication mechanism that observes the whole session the user is working on the device, instead of a so-called “one-shot”, point-of-access process [
7]. A simple form for approximating the process of continuous authentication would be, for example, to have the user enter the password or lock screen pattern every minute, but such methods are not acceptable in most used scenarios [
7]. Our work describes possible implementations of continuous mobile user authentication, in contrast to single-point-of-entry authentication mechanisms. Furthermore, a continuous authentication system, based on a user’s dynamic biometric data, phone accelerations and time data was developed for Android smartphones.
A continuous authentication system could be used in conjunction with current single point of entry authentication to strengthen the overall security of a users mobile device. Moreover, it can be implemented as a standalone authentication mechanism to increase the usability of mobile devices by not depending on current authentication techniques, which require users to take active actions to access their device. With our approach, the authentication component can potentially be trained and configured offline on the device, without requiring the sending of sensitive data to a third party provider. Since mobile phones are constantly getting more involved in our everyday life, increasing the security and usability of such devices is one of our most important goals.
In
Section 2, current state of the art authentication systems, as well as efforts on continuous user authentication systems, are analyzed. This is followed by
Section 3, assessing already existing continuous mobile authentication systems using different classifiers for touch related data. Our used methodology for carrying out this research is outlined in
Section 4. The specific architecture and implementation of the created continuous mobile user authentication system is summarized in
Section 5. To compare the implemented system with related approaches, the result of the training process for different sets of features and configurations is discussed in
Section 6 in detail. Finally,
Section 8 concludes the work and states input for potential future ideas.
3. Related Research
Since this work is focusing on touch gesture-based authentication, related research was primarily done for those systems. Even though there are already at least 29 studies (according to [
24], which have evaluated all in 2020) touch gesture-based mobile authentication available, only the most relevant ones are explained in more detail in this chapter. Some of the proposed studies also incorporate features derived from motion sensors, alongside the gesture-based features. Distance-based classification models, like the k-Nearest Neighbors (k-NN), show that with those features, an accuracy of up to 99% can be reached, while still maintaining low EER. In addition to the modularities in data and extracted features, different classifiers are used for the task of authentication. A lot of the studies rely on Random Forest, k-NN, or Support Vector Machine (SVM) classifiers, but Neural Networks, Dynamic Time Warping, or HMMs are also used. The Random Forest model, utilized in [
25] is among the best performing and adopted classifiers. [
24]
Since there already exist many different studies about continuous mobile user authentication, this section focuses on touch-gesture based and multi-sensor approaches. Additionally, implementations using HMM based classifiers were evaluated, to compare them to our proposed methodology, whose foundation also relies on HMM.
3.1. Studies Relying on Standard Classifiers
The following subsection discusses continuous mobile user authentication systems relying on standard classifiers like SVM, k-NN, Decision Trees, Random Forests, or Naïve Bayes. All of the papers were capturing their own dataset and extracted the features used for training the classifier from it.
Frank et al. [
26] proposed a framework for classification in 2013 which researches the applicability of touch-based authentication based on human behavioral biometrics. The study researches usage scenarios for a continuous authentication mechanism based on a set of 30 features extracted from raw touchscreen input. For the research, the necessary data was acquired from 41 different participants. With the used classification methods an EER in the range of 0% and 4% was achieved. This value is dependent on the previously mentioned different usage scenarios of the system. The research suggests that the proposed techniques are applicable for different scenarios, utilizing authentication based on natural user navigation [
26]. The authentication process is split up into two different phases, the enrollment phase, and the authentication phase. In the enrollment phase, the touch input is captured as soon as a trigger action is detected. The two gestures, sliding horizontally and sliding vertically were considered as trigger actions. As classifiers, k-NN and a SVM utilizing an Radial Basis Function (RBF) kernel were chosen. Since the utilized classifiers rank every stroke individually, the authentication result is highly volatile. To circumvent this behavior, strokes are bundled and then classified together.
The SVM classifier performs better in every scenario than the k-NN classifier, where all scenarios achieve a median EER of 0% up to 4%. For short-term authentication, the median EER is 0%, but some outliers can reach a value of 10%. Inter-session authentication provides a median EER of 2% up to 3% and inter-week authentication achieves 0% to 4%. The study found that touchscreen interactions are feasible to distinguish different users.
As proposed in 2012 by Feng et al. [
1] the FAST (Fingergestures Authentication System using Touchscreen) system introduces a touchscreen-based system which makes user authentication after a regular login possible. In addition to the touchscreen data acquired from capable mobile devices, the solution also relys on a sensor glove to achieve continuous user authentication after the initial login phase. The system claims an FAR of 4.66% and an FRR of 0.13% with test data of 40 participants [
1]. It should be noted that while a relatively high value of False Rejection Rate (FRR) typically leads to a general decrease in user acceptance, increasing False Acceptance Rate (FAR) values tend to be extremely dangerous since these enable bogus or even malignant authentication attempts to be successful.
For model training, the three classification algorithms Bayes Net, Random Forest, and Decision Trees have been used. The utilized touch inputs on the mobile devices were characterized as either touch gestures, virtual typing, or touch-based drawing, and depending on the category features were extracted from the dataset. This dataset contains 53 features for each touch gesture the user makes. Six different gestures are considered and evaluated by the system, whereas every gesture is split up into three different states, the beginning of a touch event followed by a longer main motion and finally the ending of the event. Additionally, to the data obtained from the touch input, the system is utilizing multiple ITG3200/ADXL345 6DOF (
https://www.sparkfun.com/products/retired/10121, accessed 4 December 2021) sensors. Those are combined in a sensor glove to obtain 36 more features where each unit provides X, Y, and Z angular rate, pitch, roll, and yaw.
For single-touch gestures, without sensor glove information, the Bayes Net classifier achieves an FAR of 11.96% while maintaining an FRR of 8.53%. The resulting performance is improved when sensor glove information is present to an FAR of 2.15% and an FRR of 1.63%. The paper also proposes an authentication mechanism, which uses sequences of events to strengthen the authentication for data limited to touch-input only. The results show that a touch sequence length of seven results in the best FAR/FRR combination. Furthermore, an authentication threshold of three is determined to produce the best results while still maintaining a good FRR. This means with those final parameters, where from seven consecutive strokes three have to be recognized as valid inputs from the authenticated user, an FAR of 4.66% and an FRR of 0.13% is reached.
Zhang et al. presented an approach in [
27] of continuous user authentication, which is based on Touch Dynamics data. In comparison to the previously evaluated systems, this one is training four different classifiers. The results of the study are reported in terms of accuracy, where vertical gestures gave better results than horizontal swipes. A combination of horizontal and vertical swipes resulted in worse accuracy than only relying on horizontal or vertical data. The used models are a combination from those used in [
1,
26], except for the k-NN classifier. The study used a total of 15 participants where, for every user, an average of 180 strokes was recorded. As evaluation results, the accuracy of the classifiers and the EER of the system were reported. The best overall accuracy was achieved using the Random Forest classifier, where vertical strokes were scoring 96.7%, horizontal ones 96.36% and combined input resulted in 95.03%. Furthermore, the results show that, when using vertical swipe features from two-handed device usage, the EER is lower (0.0041) than using one-handed device data (0.0309).
3.2. Using Hidden Markov Model Based Classifiers
One key advantage of systems relying on HMM is that a successful model can potentially be trained with only data from the user, to whom it belongs. Because of this, the model can be trained offline and the user’s data does not have to be transmitted over the internet. Furthermore, the classifiers can be adapted continuously, since new input data can simply be retrained by fitting it to the existing model, without having to train the whole dataset again.
In 2017, Roy et al. [
28] proposed a continuous user authentication system, utilizing a left to right HMM as classifier for training behavioral templates of different users [
28]. The proposed method uses the Touchalytics database [
26], and therefore also works with horizontal and vertical touch patterns. The HMM used for training uses a number of hidden states
n. Every state
is then modeled by a mixture of Gaussians and a left to right topology is used to model the underlying continuous touch input. At first, the dataset is normalized and then used for training the parameters of the HMM, which describe the user’s touch input best, using the Baum–Welch expectation-maximization algorithm. Finding the optimum parameters is necessary since the number of hidden states and mixtures is dependent on the complexity and information of the training data. The number of states multiplied by mixtures should be significantly smaller than the average stroke length, so every Gaussian distribution has enough data. To make the training more robust, five-fold cross-validation is employed for finding the optimal model parameters. For every user, a behavioral model is created with the user’s dataset.
Short-term authentication can be made with a median Equal Error Rate (EER) of 0%, for inter-session authentication the median EER lies below 2% and for long-term authentication below 3%. The worst obtained EER values with 5%, 12%, and 28%, respectively, are also lower when using the HMM approach. [
28]
Roy et al. proposed another solution in 2015, which extends the previously presented implementation, by using a multi-sensor approach combined with a newly generated database, for continuous user authentication [
29]. Similar to [
28], the study utilizes a HMM based training approach for authentication. Instead of only using touch data, the proposed solution employs touch, accelerometer, and gyroscope data for modeling tap and stroke patterns with a continuous left to right HMM. Analysis of the proposal shows that when combining multi-sensor data with touch information, authentication accuracy can be improved.
The new dataset recorded for the study consists of multi-sensor data from 42 different users and includes unconstrained data, in contrast to [
26,
28] where only limited horizontal and vertical gestures were used. The paper focuses on tap and slide touch gestures, since they are done most frequently, and ignores multi finger gestures like pinch or zoom. From those gestures, six raw features (timestamp, position, pressure, rotation, touch size, vibration) are extracted and the obtained sequences are normalized in regard to the sampling rate. Sequences recorded from touch inputs contain distinct spatio-temporal characteristics. Therefore, for every gesture (tap and slide) a distinct classifier has to be trained. However, in contrast to [
28], where multiple classifiers are used for different slide directions, a single HMM is used for all directions by making the slide gestures rotation invariant. For every classifier, there are three HMM, where one is used for touch information and the other two for vibration and rotation data. The combined similarity score is calculated by averaging the likelihood scores of the models.
The results achieved by the proposed solution are comparable to the system developed in [
28], which requires eleven consecutive strokes (horizontal or vertical) to obtain a median EER of 0%. Since this solution utilizes a combination of tap and slide gestures, where tap gestures usually require less time to be performed, the total duration of the authentication process is similar to [
28]. The usage of the proposed methods is therefore applicable, for the task of continuous user authentication in different scenarios, using touch only or multi sensor data. [
29]
3.3. Comparison of Related Studies
As can be seen from the above evaluations, the results of the continuous authentication performance depend heavily on the used dataset. For example, the Touchalytics database (see [
26]) only considers horizontal and vertical features. However, it has to be taken into account how the system behaves, in case of usage scenarios not handled by the original developers. Since the device was only trained on horizontal and vertical swipe gestures, it remains undetermined how the system would behave when when using primarily single touch inputs.
While a lot of approaches use traditional classifiers, the studies presented in [
28,
29] rely on HMM based implementations. The advantage of training this classifier is that it utilizes only data of the person of interest. This means that the training process, as well as the authentication process, only requires data from one user. Other classifiers, such as the SVM, require data from multiple users to generate a working machine learning model. Another advantage, when the training process only relies on data from the correct user is, that the model can be retrained with new data, without relying on a connection to fetch data from other users to rebuild the model. The whole training process can be done offline, resulting in allowing the system to be privacy-preserving since usage data doesn’t need to be shared.
The authentication performance and used performance metrics also differ across the presented studies. While most of the studies rely on the EER metric to compare the performance of their approaches, some (for example [
1]) just report the FAR and FRR. The number of consecutively used inputs differs between the proposed solutions. A higher number of consecutive touch inputs usually decreases the EER of the system, but also extends the time it takes for the authentication to take place. Therefore, there is always a trade-off between security and usability.
Furthermore, none of the studies mention an implementation on Android devices for the authentication process, therefore it might have been done directly on the development machine, where the model was trained. In our study we are evaluating and implementing the recording as well as the evaluation process necessary, for continuous authentication to happen on mobile devices, running the Android operating system.
4. Research Methodology
The research was carried out as an experiment, and evaluated the applicability of HMM for employing a continuous user authentication system on Android systems.
4.1. Research Approach
For the data gathering process, a quantitative approach was employed, where biometric data was captured from both male and female subjects within the context of a case study. This paradigm was chosen so the trained model was not learning subjective information. Because of that, all recorded samples could be used for the evaluation process.
4.2. Data Collection Method and Tools
The participants were all using the same Android device and got identical instructions to ensure uniform boundary conditions. Data was captured using the getevent tool, to obtain kernel level data accuracy. The acquired data was stored in SQLite databases by the recording application in the form of stroke samples. Those contained touch locations, accelerometer values and timestamps for each data point. Finally they were loaded as pandas data-frames for further processing.
4.3. Data Analysis
As a next step, the samples were analysed. Those with missing or incomplete values were discarded and the used features normalized. This was done so the model did not overweight data from a particular feature or learn the noise generated from incomplete samples. Outliers, which consisted of samples with only one or too many touch inputs were also discarded, to achieve a better generalization of the model. Those samples can then be used for the training set as well as the test set of the classifier.
4.4. Research Limitations
The experiment was limited to candidates from Austria due to time constraints. For a continuous authentication system, which would be deployed world-wide, a bigger participant count from various countries would be necessary for the verification of the effectiveness of the implementation—the conducted experiment hence featured a non-probability sample. Since the proposed solution relies on a HMM using an unsupervised learning approach as the classifier, the experiment can be repeated with data from different participants without relying on our trained model. Furthermore, the training process was carried out on a desktop instead of the mobile device. This was done because an existing implementation of a HMM could be used and the research time was therefore shortened.
5. Architecture and Implementation
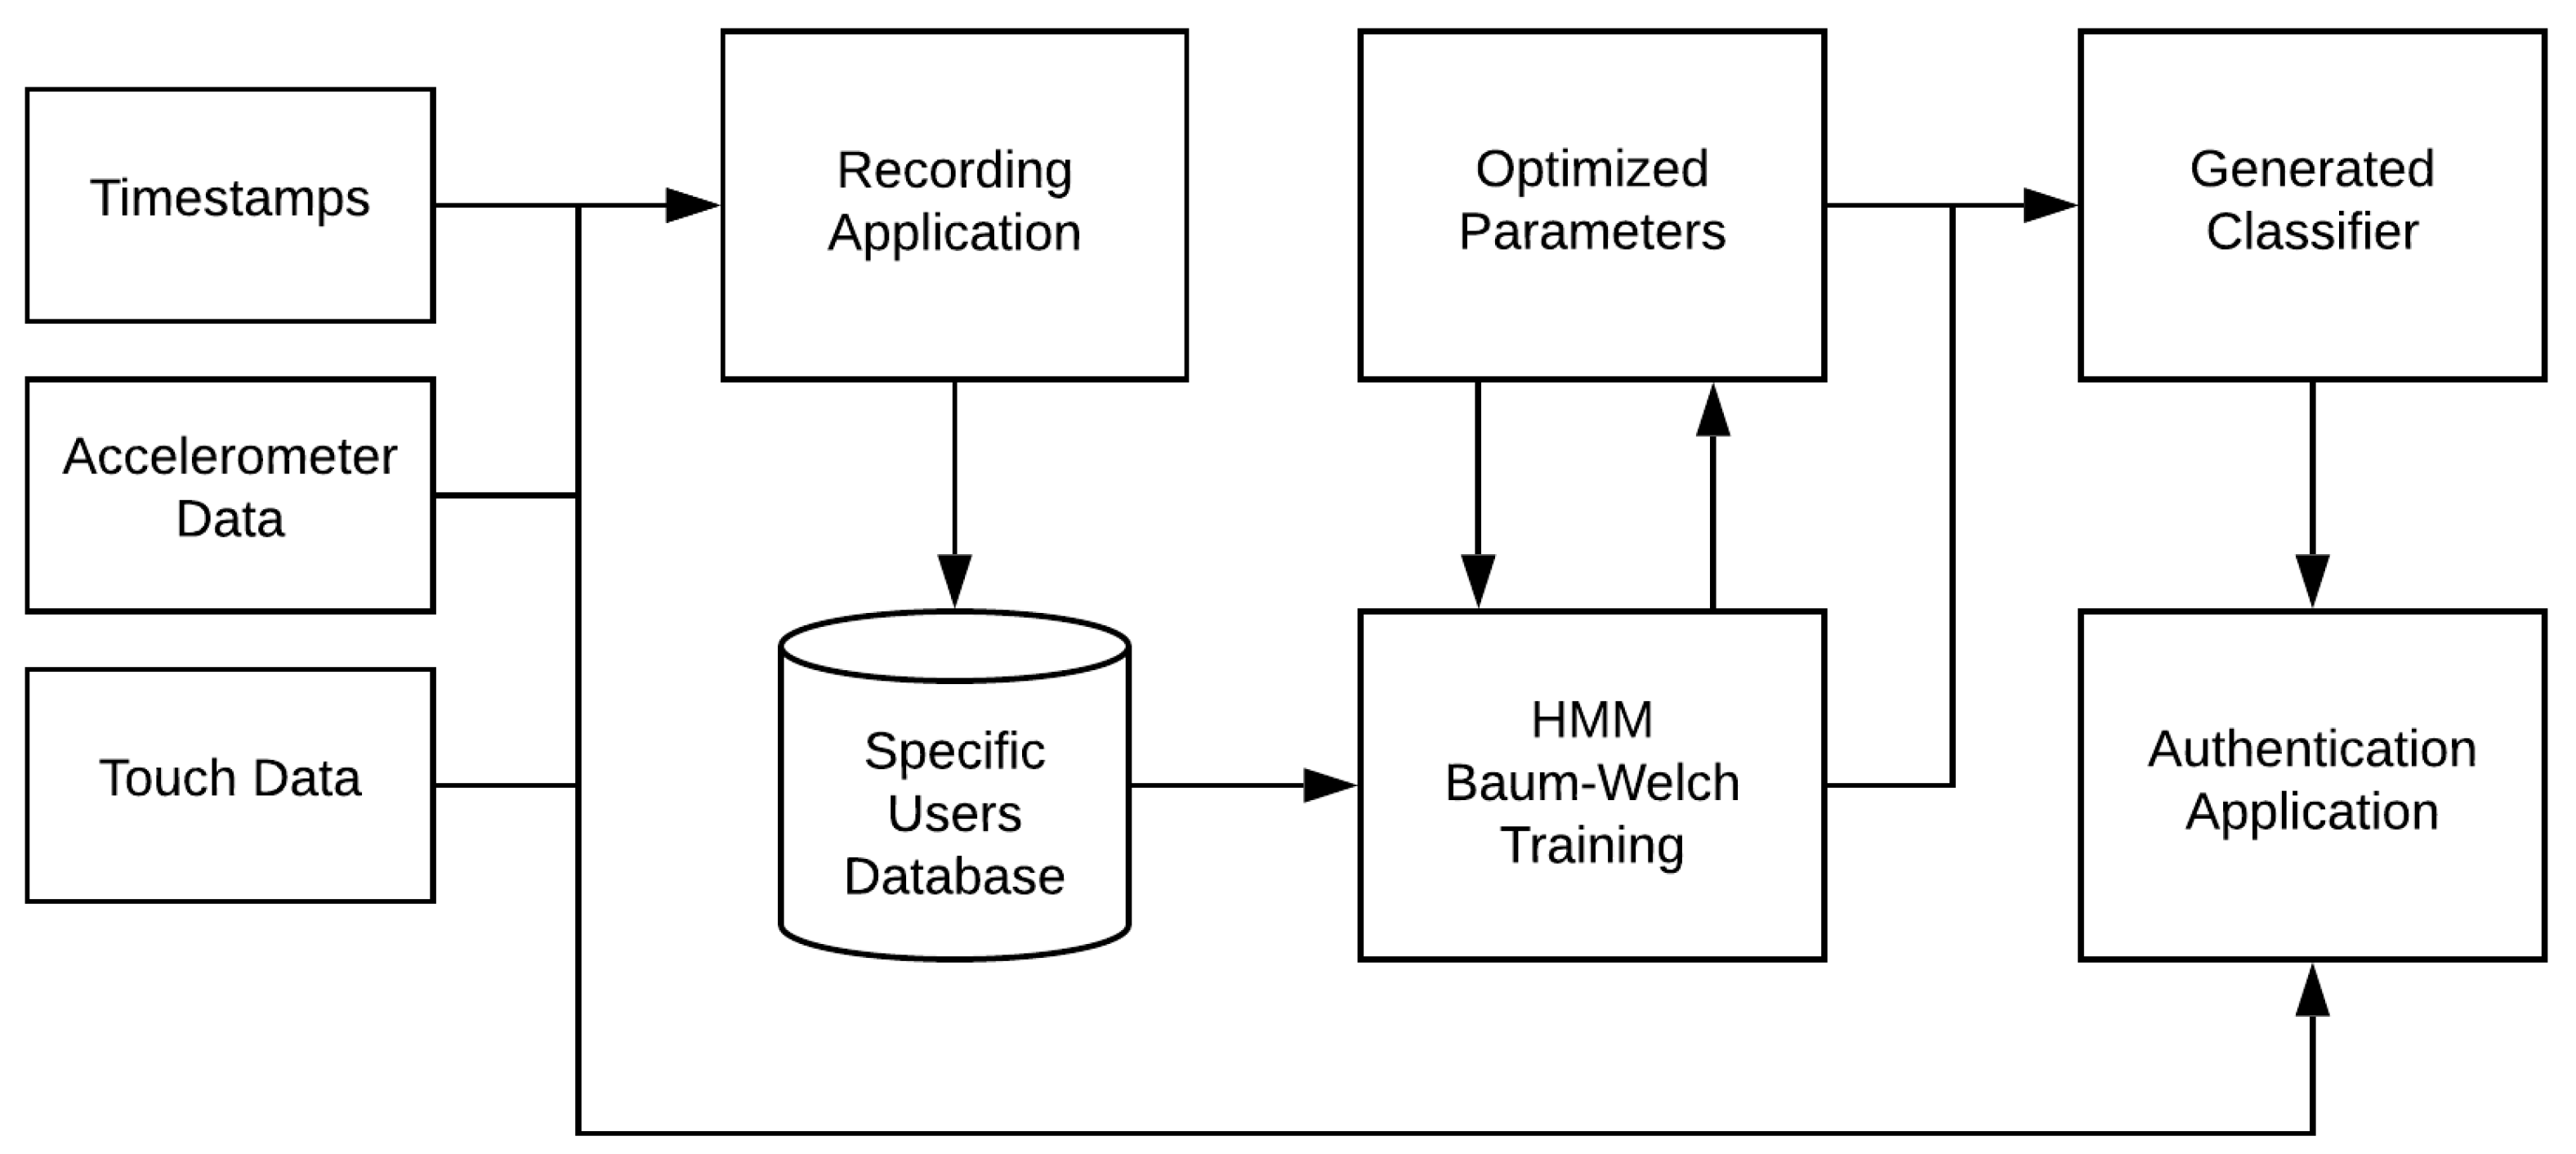
The architecture of the CMUA (Continuous Mobile User Authentication) framework framework can be split up into three main components. A recording subsystem is the first component utilized by the framework and is used to gather data from users for initial model training. When the data are gathered successfully, it will be transferred to the second system, which trains a specific classifier using various extracted features from the dataset. This trained model will then be employed in the third and final system of the framework, which is the authentication software used to make predictions on new data seen from the same device, as was used to record the training data in the first place. A general outline of the high level architecture can be seen in
Figure 1. The diagram shows the input of the user data to the recording application, which in turn saves it to an appropriate database. There it is used by the HMM to optimize the training parameters, and as a result the classifier is generated. New input data are then used in conjunction with the authentication application for making predictions on the users authentication state. The following chapter will explain every component in more detail.
5.1. Recording Component
The acquisition of the necessary data is not possible with a stock Android device, since the security features of the operating system restrict the collection of, for example, touch input data to the application, which is requesting the feature. To circumvent this issue, the recording software exploits the capabilities of rooted device access, by reading data made available through the getevent (
https://source.android.com/devices/input/getevent, accessed on 4 December 2021) kernel-level tool, which can provide live data of kernel input events from the corresponding input devices. The implemented application is recording timestamped touch information, as well as timestamped accelerometer data.
In order to use the getevent tool, the application has to issue manual shell commands, since no system library for accessing this information is available for the Android operating system. After acquiring the standard output produced by the tool, usable touch information can be obtained by parsing the event representations generated to a proper format. They consist of identifiers written in capital letters, and associated values. The ABS_MT_POSITION_X and ABS_MT_POSITION_Y events return the pixel coordinates of the corresponding input in hexadecimal format. A whole touch includes the data between two BTN_TOOL_FINGER events, starting with the tracking id obtained from ABS_MT_TRACKING_ID. Such a touch event can report a single, but also more than one, x and y position, resulting in a traceable swipe gesture. Combined data simultaneously generated by multiple fingers may allow even more precise predictions, but has not been considered in the given proposal yet for simplicity reasons.
5.2. Model Training Component
At first, the data are read into dataframes, labeled and cleaned. Duplicate x and y positions are discarded, since the getevent tool may have reported the same values for multiple events. Event values collected from the touch input stream are not considered for training the classifier. More complex touch gestures, which can be extracted using those event codes, are not in focus for the model training process. Therefore, the prediction performance from multi-touch gestures is not evaluated and the classifier is relying on the x_position, the y_position, timestamps, and the device orientation when performing single stroke inputs.
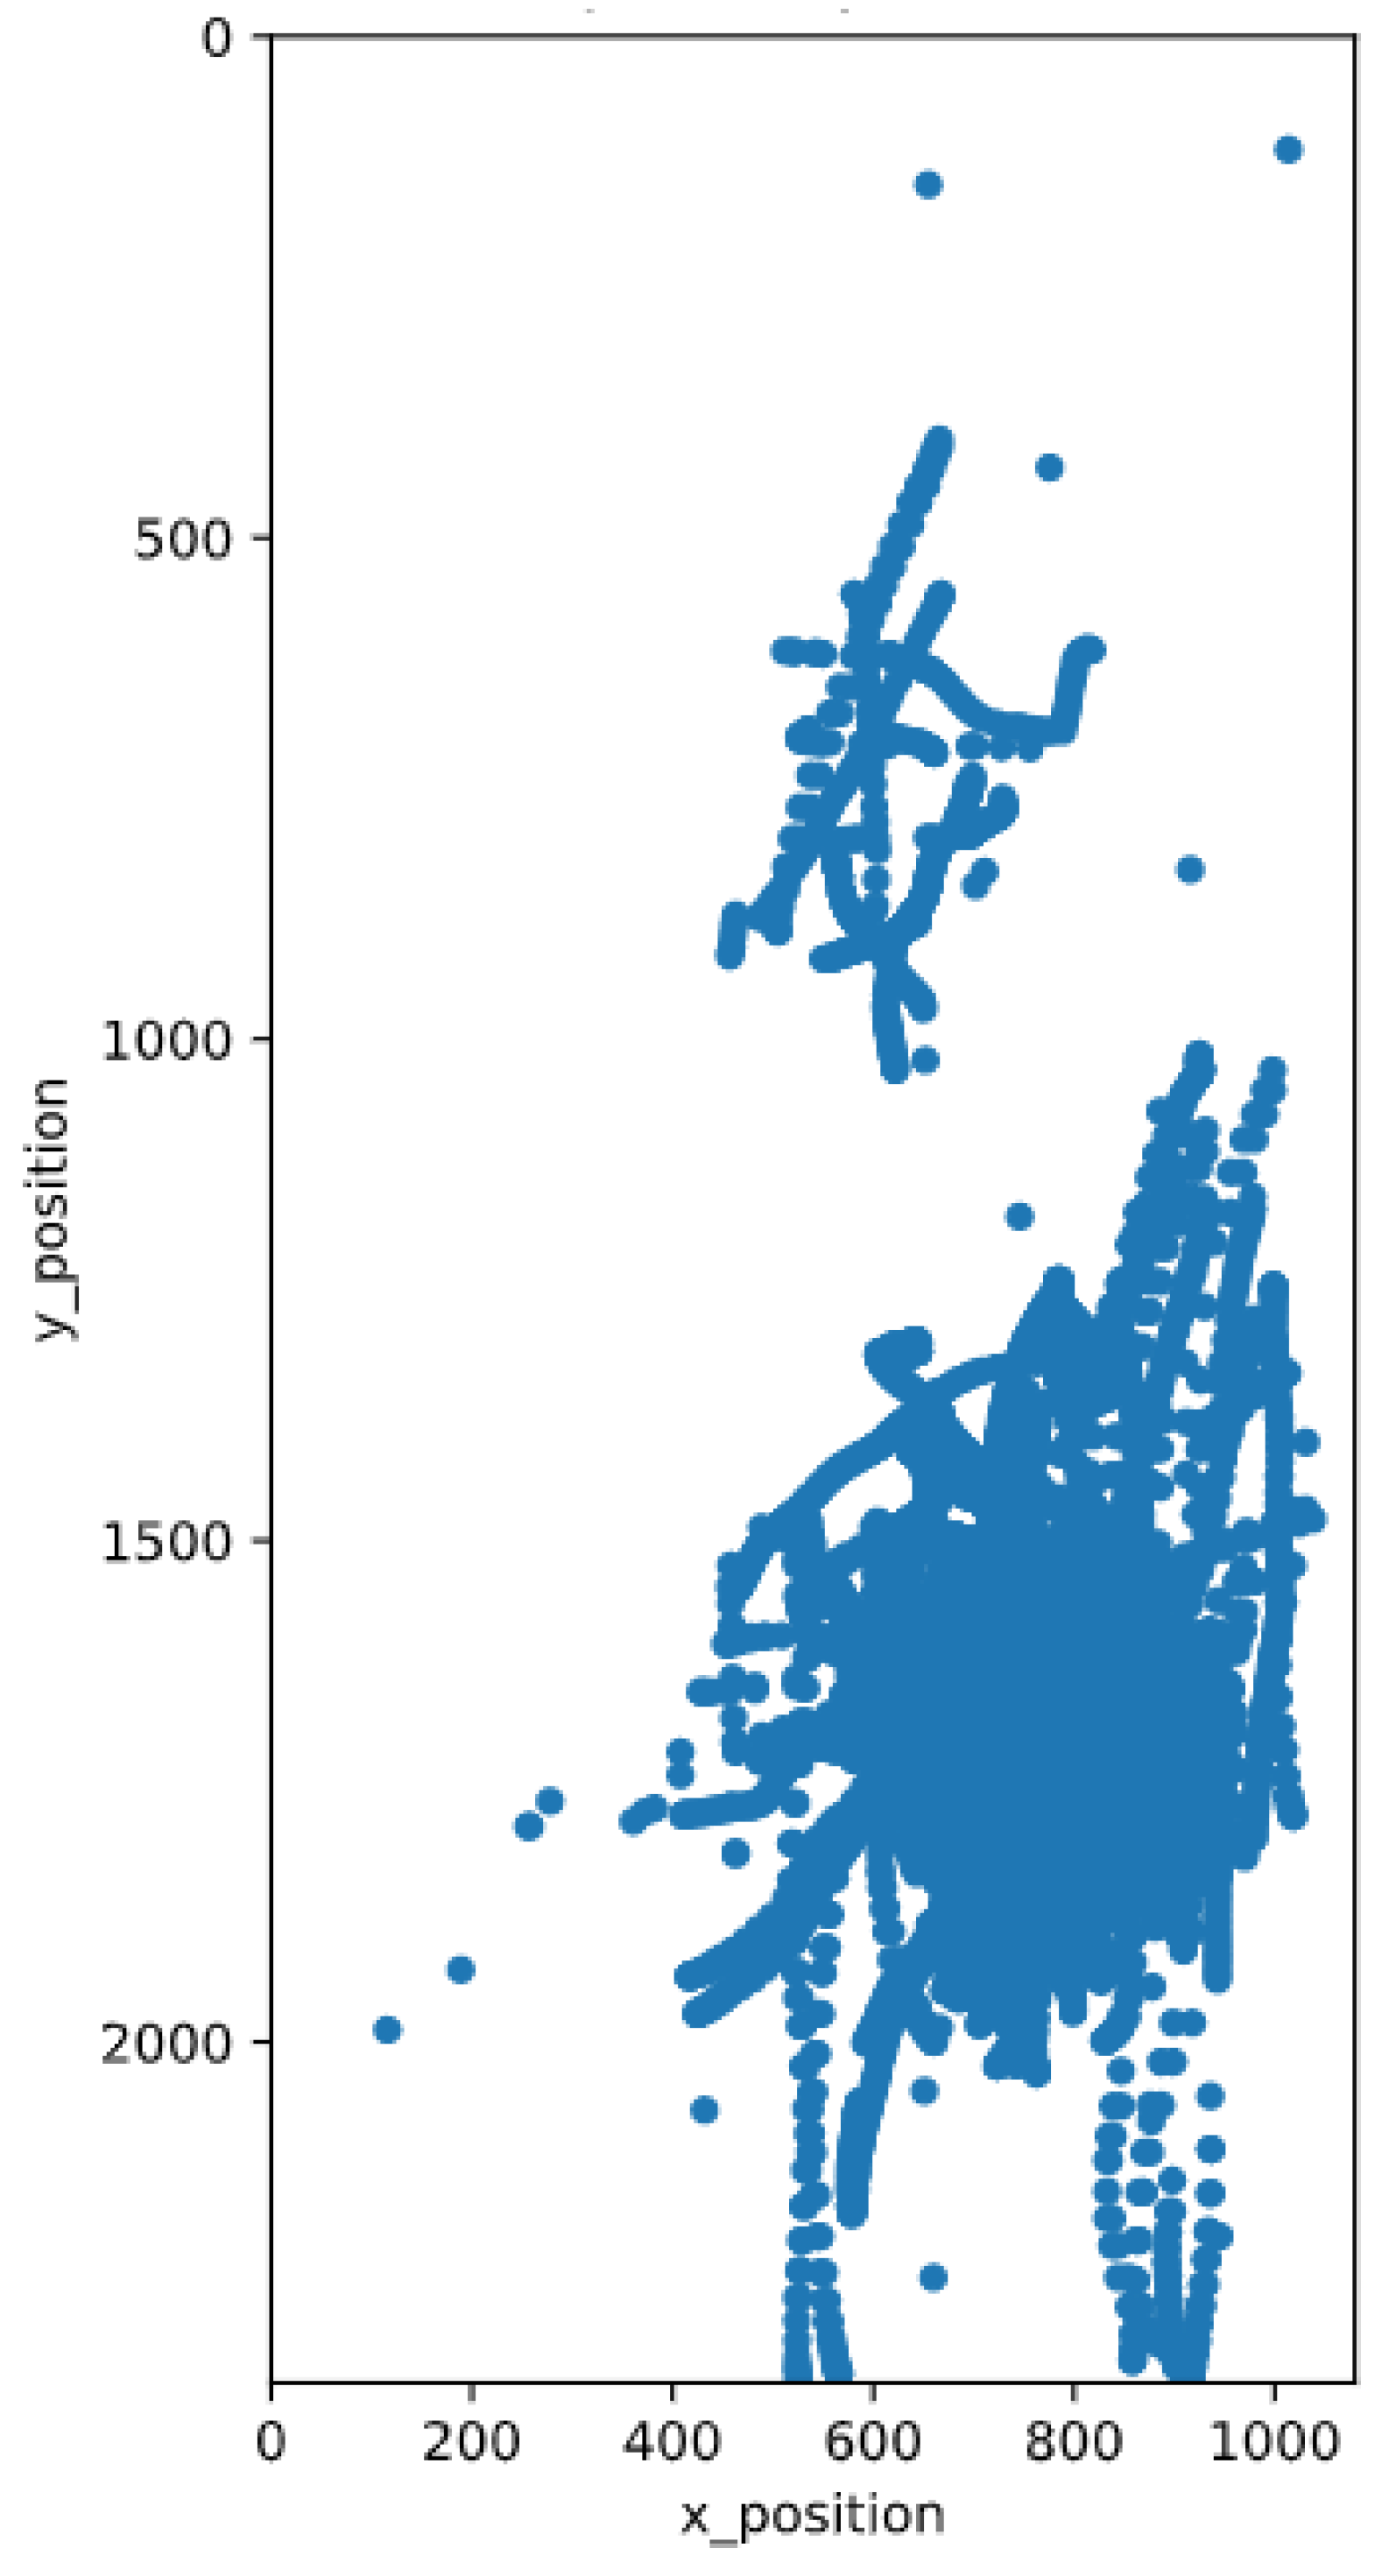
The x- and y positions of the user input are visualized onto a figure, which was stretched to the size of the display, used for capturing the data. When observing the figure illustrating multiple touch gestures, it can be seen that the user does only use a specific portion of the display, for most of their inputs. Therefore, this may also suggest that different users are using different areas of the display for input, depending on the length of their finger, how they hold their device, and other metrics.
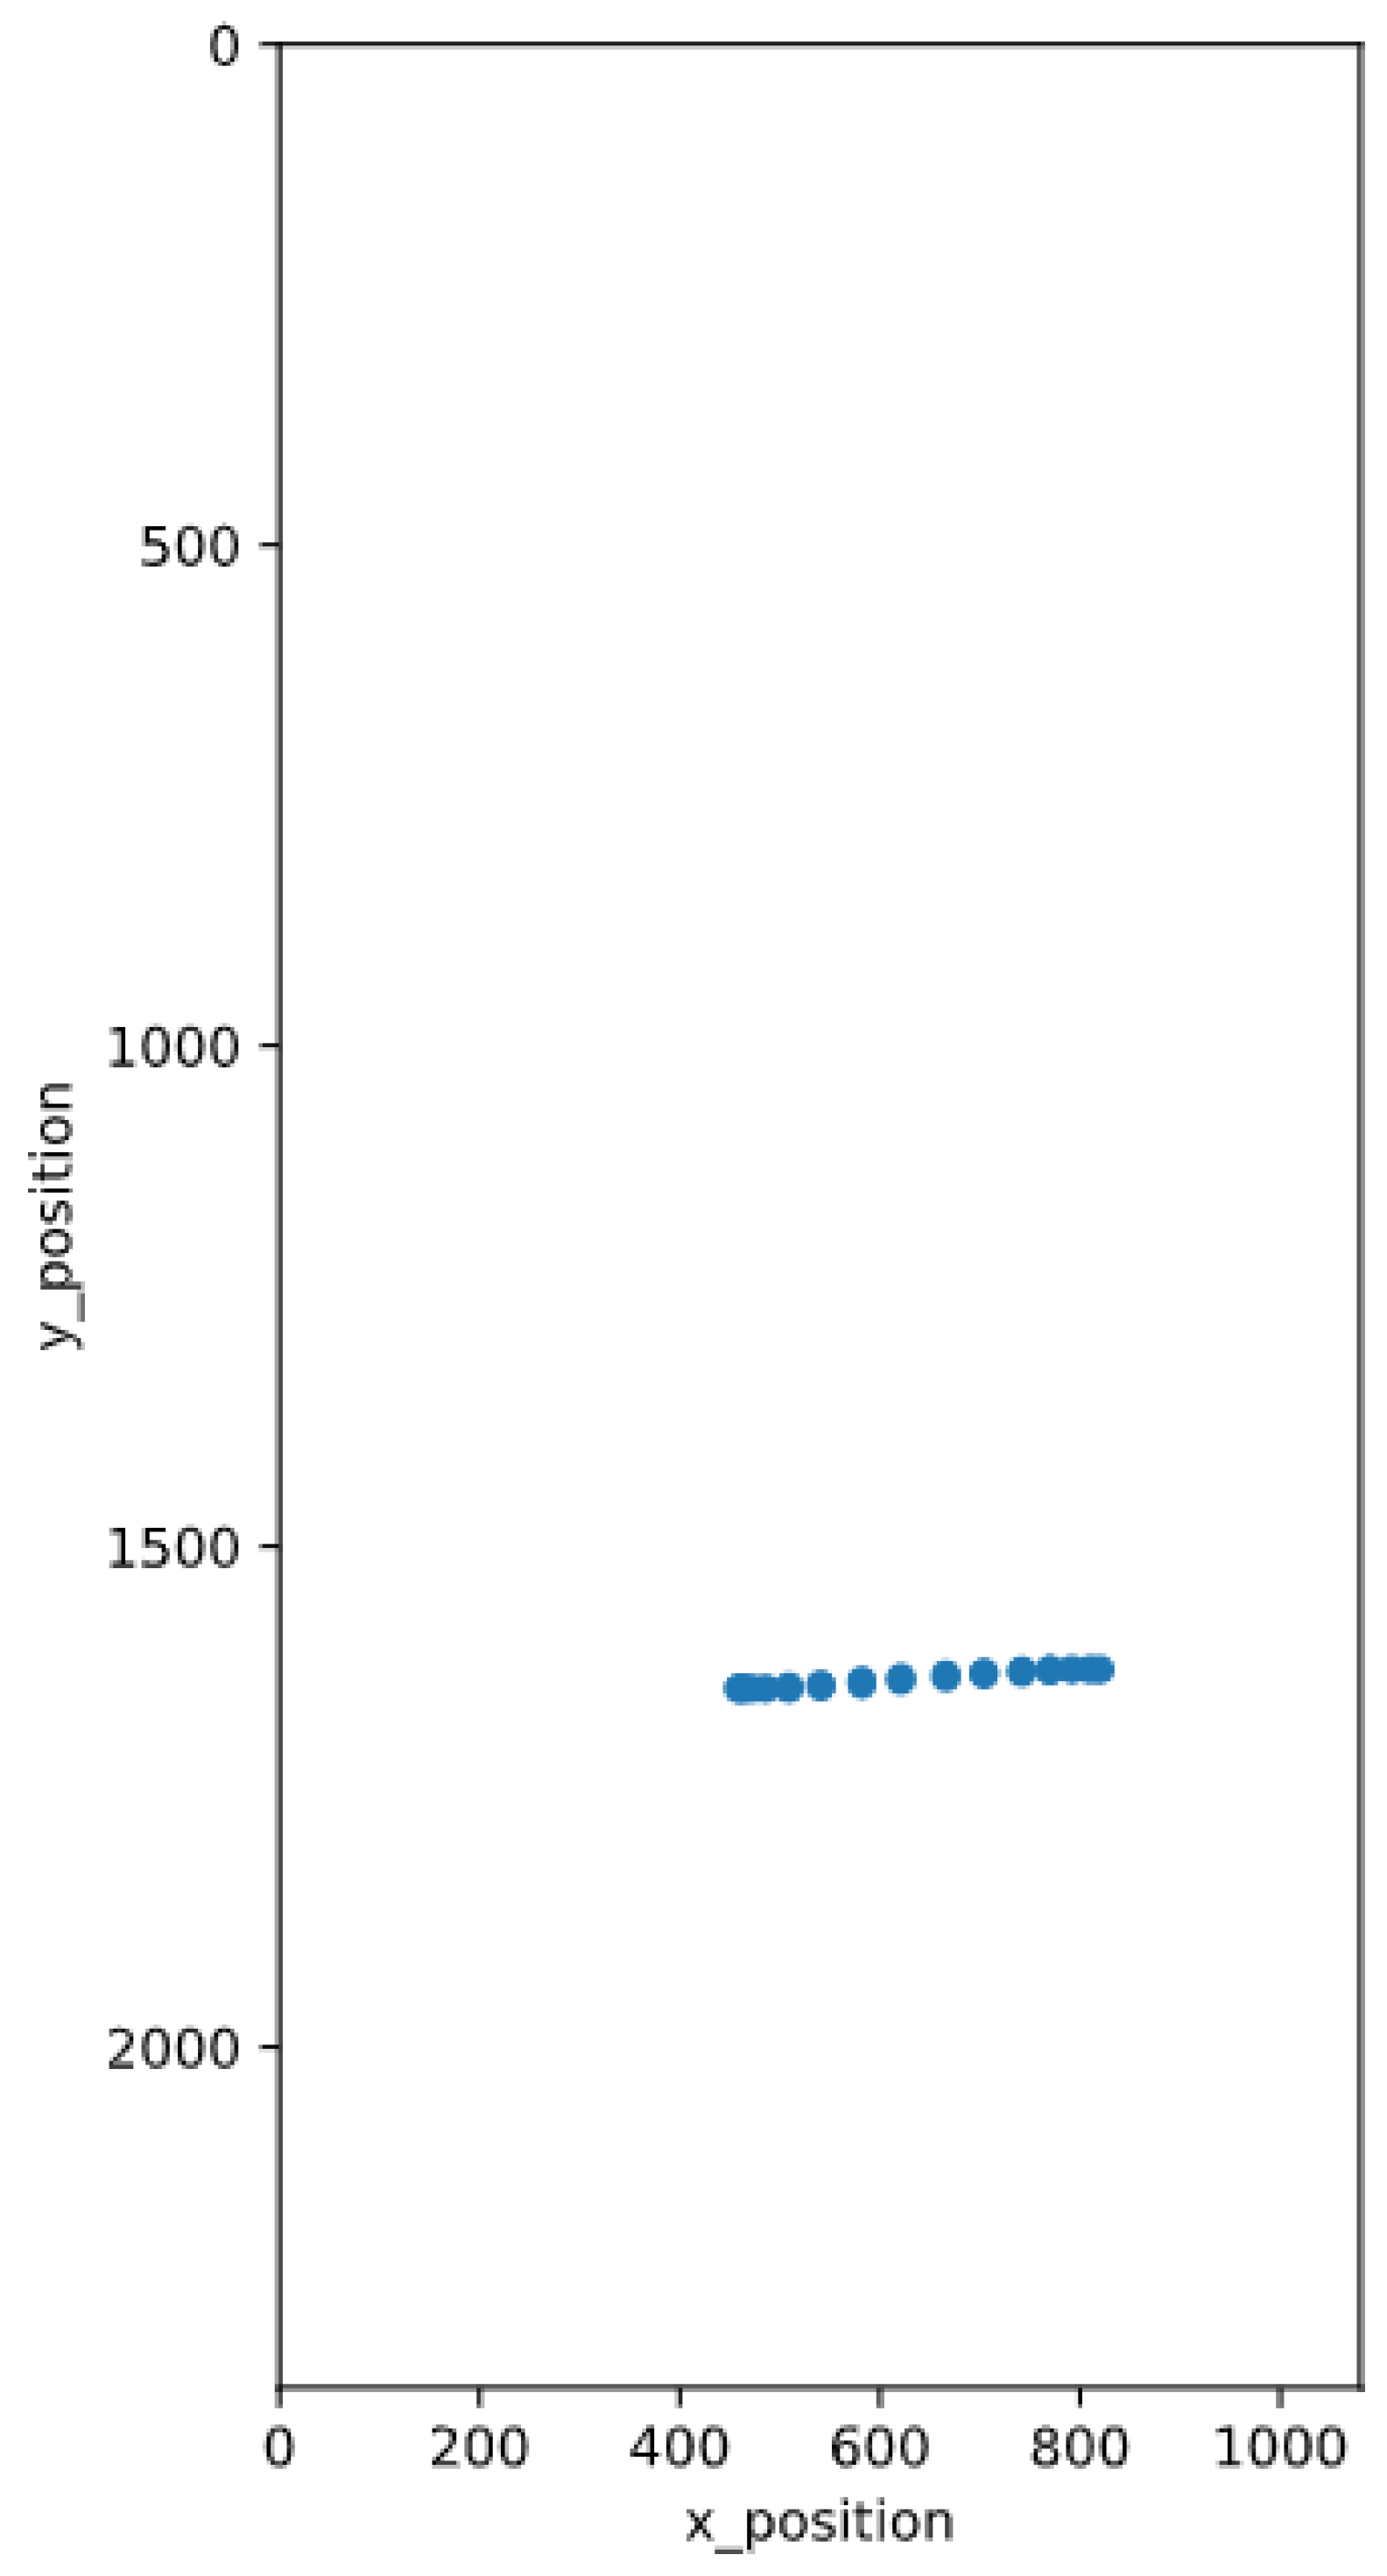
Furthermore, various single data point inputs can be observed, which may have an impact on prediction performance. In
Figure 2 and
Figure 3, it can be seen that for the beginning and the end of the single swipe gesture, more data points were captured than in between those points. This may indicate, that the beginning and the end of a swipe gesture, is carried out slower than the rest, because the finger first has to get into motion. However, this may not be the same for all users, thus different features can be extracted from the touch input alone. Some potentially viable features were already determined in [
26], together with the mutual information that can be gained from them.
5.2.1. Data Structure
The amount of input data from a single stroke is dependent on the duration and gesture length. For example, if a user just clicks a button with his finger, one position is reported, but if a scroll through a website occurs, multiple positions are reported for the specific event. A lot of gestures are made up of 1 to 100 data points, and a high percentage of them only contain a single position. On the other hand, gestures with significantly longer duration consisting of more than 200 data points are sparse. The inclusion of gestures with very little data points may significantly alter the prediction performance. For example, if gestures with five or fewer data points are left out because they contain too little information, there will be fewer usable gestures available for the training and verification process.
If we look for the
x_position, the
y_position or the
accelerometer_x values, we see that their distribution could be approximated by one or multiple Gaussian curves. This effect can be observed when looking at the distribution of multiple gestures. The more gestures are included, the more generalized the plot is going to look. Since we are using HMM as a classifier, the data distribution plays an important role, in selecting the correct parameters for the model. The
hmmlearn Python package (
https://github.com/hmmlearn/hmmlearn, accessed on 4 December 2021) offers models for different kinds of emissions to learn from. Emissions are the observable output values, that occur depending on the internal state of the model [
30].
Since the different features captured by the recording application do not have the same range, the data are normalized after being cleaned. This has to be done because, for example, when the display size is measured in pixels and the accelerometer data in m/s, the different value ranges may result in the display size being a far more significant feature (due to larger values and therefore substantial value changes) than the accelerometer data. As an example of our implementation, we use the min-max method, which normalizes data values to a range between zero and one.
5.2.2. Training the Gaussian Mixture HMM
In contrast to [
26] our implementation is not extracting features from a single touch event, but rather uses multiple sequences of available inputs, to train a HMM with an undetermined number of hidden states and Gaussian mixtures.
A HMM can be built based on different topologies which describe the structure of the inter-connected graph. Simple models may not be able to make predictions of the generated dataset with a high likelihood, while complex models may overfit and thus do not generalize the data well enough [
31], hence a balanced approach seems to be the most reasonable. For our use case we employ a left-to-right topology, which has a temporal structure, so a high number state can only occur after one with a lower number [
30]. We chose this topology because we are also considering touch gesture data as time-varying data, just like speech input. To create this topology for training the model, we have to define a start probabilities matrix
, where only state 0 has a 100% chance of occurring first. Furthermore, the used transition matrix has to be constructed as
A listed in Equation (
1). The example depicts a topology of a HMM using four hidden states.
The chosen model has different parameters characterizing the internal structure, like the number of hidden states or the start probabilities of starting in a specific state as explained previously, but also parameters that depend on the distribution describing the emissions of the model. The Gaussian Mixture HMM is also specified by its mixtures, which are the number of states in the Gaussian Mixture Model for each hidden state of the HMM. Since our touch input data can be approximated by a mixture of Gaussians, we use the
hmm.GMMHMM model from the
hmmlearn library. Furthermore, we use the Baum–Welch expectation-maximization algorithm to find the optimal parameters for a specific user’s model. This method utilizes the provided data to find the parameters of a distribution that maximize the likelihood of assigning all data to the distribution [
32].
The number of the HMMs hidden internal states and the number of the Gaussian Mixture Model (GMM) mixtures are defined before applying the Baum–Welch algorithm. The expectation-maximization algorithm then finds all internal parameters of the model. However, it has to be considered that the algorithm is mostly converging into a local maximum and does not guarantee that a global maximum will be found [
33]. Because of that, obtaining the perfect solution is hard, so we are aiming to look for one which satisfies our requirements.
5.2.3. Verifying the Results
Models are trained for a different number of states and mixtures. A test set is then used to calculate the performance of the model with the current parameters. This is done for all parameter combinations, and the best performing model generated from them is then chosen as the final model.
The performance is validated using a test set. The whole dataset available is split into training and test data, where the training data consists of approximately 70% and the test set of the remaining 30%. Additionally, when training the model with the training dataset, n-fold cross-validation is employed, to make use of all available data. Within the cross-validation process, the mean of all acquired scores for the training data is calculated. The
TimeSeriesSplit (
https://scikit-learn.org/stable/modules/cross_validation.html, accessed on 4 December 2021) is used to provide the indices for the train and test data. Furthermore, test indices have to be higher than before in each split, hence shuffling is inappropriate. This method delivered the best results for our implementation since we also work with time-dependent data that may not be shuffled arbitrarily.
Finally, the best performing parameters are transferred to the authenticating Android application.
5.3. Authentication Component
Just like the recording component, the authentication component relies on a rooted Android device, to gather information from the touchscreen sensor. The application includes a foreground service, which captures touch event inputs and sends them to the scoring algorithm. Before using the parameters imported from the trained model, they are checked for validity.
In our authentication implementation, we use the forward algorithm, which computes the probability that a particular observation sequence was generated by our model. Formally speaking, when we are looking at an input sequence
O and our model
, we want to determine the likelihood
that this observation sequence may come from our model [
34]. The longer the observation sequence, the smaller the likelihood that it was generated by the model. This aspect has to be considered in our implementation as well, since our touch inputs have different observation sizes. As an example of normalizing the score of the observation sequence, it could be divided by the length, which is also done in [
28]. The
hmmlearn package allows the user to choose between four different covariance types for the Gaussian distributions in the GMM model. Those types describe the length and direction of the distributions density contour. For our implementation, we use the default setting of a diagonal covariance type, which maps the contour axes the same direction as the coordinate axes, but allowing variable sizes.
6. Evaluation and Results
The following chapter evaluates the continuous authentication system, presents the found results, and compares them to existing systems. The usability of Hidden Markov Models in the context of continuous authentication, and the challenges coming with it, are put in contrast to the gained advantages and theoretical improvements.
6.1. Evaluation Metrics
For every user, a different HMM is generated individually. Those classifiers return a probability of how likely it is that a specific touch input was generated from this exact model with its internal hidden states and mixtures of the Gaussian distributions. Since a probability alone can not determine if a user’s input is valid or not, a threshold for this calculated probability also has to be introduced. This is the limit indicating if an input is authorized, where if the calculated value is below the limit the input is invalid, and if it is larger than the limit the gesture is recognized as being valid. Changing the threshold does have an effect on usability and, more importantly, on security. For example, if the limit is set too low, a lot of invalid gestures may be categorized as authorized input, making the system vulnerable to attacking parties. On the other hand, if the threshold for authentication is set too high, it will have an impact on the usability of the system, because gestures made from a legitimate user, with slight variations to the trained model, will be recognized as invalid input and therefore lock the user out incorrectly.
The trade-off between security and usability can be expressed with the help of the FAR and False Rejection Rate (FRR). It has to be noted, that the FAR is synonymously used as False Positive Rate (FPR) and also the FRR synonymously as False Negative Rate (FNR) in different papers. The FAR is used to determine the percentage of test samples, incorrectly classified as positive inputs, whereas the FRR describes the percentage of samples, which are incorrectly classified as negative inputs.
Those percentages are calculated for specific threshold values. To circumvent the need for calculating them for every possible threshold value, the Receiver Operating Characteristic (ROC) curve can be used to display the True Positive Rate (TPR) values against the FPR values for all threshold values in a plot. The is calculated by subtracting the percentage of the like . In order to make it easier to compare different models, we use the EER, which is just a special point on the ROC curve, where the FPR is equal to the FNR. The advantage of this final value is that it does not favor one type of error over the other.
The calculated score for an individual stroke is highly dependent on the length of the gesture sequence. The likelihood of such a gesture belonging to a trained model rises exponentially with respect to the length, as also discussed in [
28]. To circumvent this behavior and make all different inputs comparable, the calculated score is normalized according to the length of the sequence.
6.2. Participants and Data
For training the HMM classifier, data were collected from six different participants. The users ranged between 18 and 50 years with an equal amount of males and females. All of them stated that they regularly use their smartphones and are comfortable with the provided Android device. Basic navigation functionality was explained to each of them, in order to be able to, for example, move to the previous page or go to the home screen of the device. Those actions are achieved using hardware buttons. With our test device, an OnePlus 6T, those buttons were mapped to on-screen gestures. So, for example, to navigate back, the user has to swipe up from the right bottom corner of the device. Furthermore, all users were asked to use the device just as they would normally do when browsing the web. They were instructed to use the Chrome Web Browser (
https://play.google.com/store/apps/details?id=com.android.chrome, accessed on 4 December 2021) and do not interact with any other applications. Additionally, the recording software was started for them and the internet browser opened with an empty tab. Because of this fact, it had to be considered that for each user the first three gestures were discarded, because they were always done by the instructor and would distort the gained results.
The amount of gestures that were captured per user ranged between 195 and 1791 strokes. However, the dataset with 1791 entries is an outlier, since this is the one we are using to train the authentication classifier on, while the other datasets are primarily used for testing the performance of it. When only considering the datasets used for evaluation and testing, they are composed of about 375 gestures on average. Those numbers represent all gestures, except ones that only consist of a single position entry, because those would not represent a sequence of input. Additionally, gestures with really long sequences were discarded in some training instances as well, since maybe users keep their finger on the phone when cleaning the display which would be captured as an input gesture, but in fact, is none. How many gestures were finally used in the model training and verification process, as well as what inputs were discarded, is discussed in more detail later.
For every gesture, a sequence of variable length is captured, including an identifier to know which data points belong to each gesture, the position on the display, accelerometer sensor data, and a timestamp indicating when the position was captured. For the training of the authentication model, different combinations of those available features were used. This was done because some of the features may correlate with each other, meaning that they do not help in providing more information for the classifier. Furthermore, different forms of data normalization and feature extraction of existing data were done to improve the accuracy of the created classifier.
6.3. Training and Test Data
Our test set for the model trained for a specific user requires positive as well as negative samples. Negative samples can be obtained by predicting the performance of the classifier on samples created from different users. A ratio has to be defined on how many samples should be used for the training set and how many for the test set as positive samples. Our implementation uses a train test split of 85%, because then we still have as many test samples as some of the test sets for negative samples have to offer.
Because timeseries data has a high correlation for observations, in close temporal distance (
https://scikit-learn.org/stable/modules/cross_validation.html, accessed on 4 December 2021), normal cross-validation techniques are not suitable for our implementation. This is because they assume that all samples are independent of each other and distributed uniformly. For our implementation, we are using a so called
TimeSeriesSplit (
https://scikit-learn.org/stable/modules/cross_validation.html#time-series-split, accessed on 4 December 2021). This technique is using
k folds for the training set and the
th fold for testing. The method is a variation of the standard k-fold validation technique, but successive training sets are in fact supersets of the sets used an iteration before.
6.4. Training with Position Data Only
Our first approach was based on training a GMM HMM classifier with just x_position and y_position data. For the training process, different numbers of hidden states and components for the Gaussian mixture distribution were used. For different parameter combinations, the score is displayed in log scale because otherwise the number would be too small. After training, the best parameters are chosen for the final model selection.
After this step, we can use the trained model to make predictions on the test sets captured from the other users. We calculate the score for each individual gesture using the score method of the model and normalize it by the length of the input. When we have calculated all scores for the positive validation set and negative test sets, we can calculate the mean score for a dataset.
Apart from the ROC curve and the resulting AUC value, we are relying on the calculation of the EER for measuring the performance of our classifier, since this metric is used in a lot of papers focusing on continuous user authentication, for example, [
26] or [
28]. As already mentioned, the EER is the value, where the FPR is equal to the FNR under a certain threshold.
When examining the AUC of the trained classifier, we can see that it reaches a value of 0.66 which maps to a performance of 66%. Our AUC of 66% indicates that the classifier does indeed tend to predict in favor of the authenticated user, but the overall performance is much too low to make a usable continuous authentication system out of it. This may have several reasons which are discussed in more detail later. Similar to the performance of the AUC, the EER is rather high with a value of 35.99%. Therefore, the model trained with those parameters and features returns worse results when only predicting on single gestures, than the proposed systems presented in the related research.
6.4.1. Improving Performance
The performance of the classifier can be improved by either relying on more features extracted from the dataset, grouping multiple gestures together when scoring and using thresholds for the length of the gestures.
Grouping Gestures
The process for creating the grouped scores is formally described in Equation (
2). It must be noted that a score
can belong to multiple grouped scores. This means that when the individual scores are in the form of an array or a list, the grouped score is created by a kind of sliding window procedure. This ensures that all consecutive possible groups are considered and enough test scores are available for calculating the performance of the classifier.
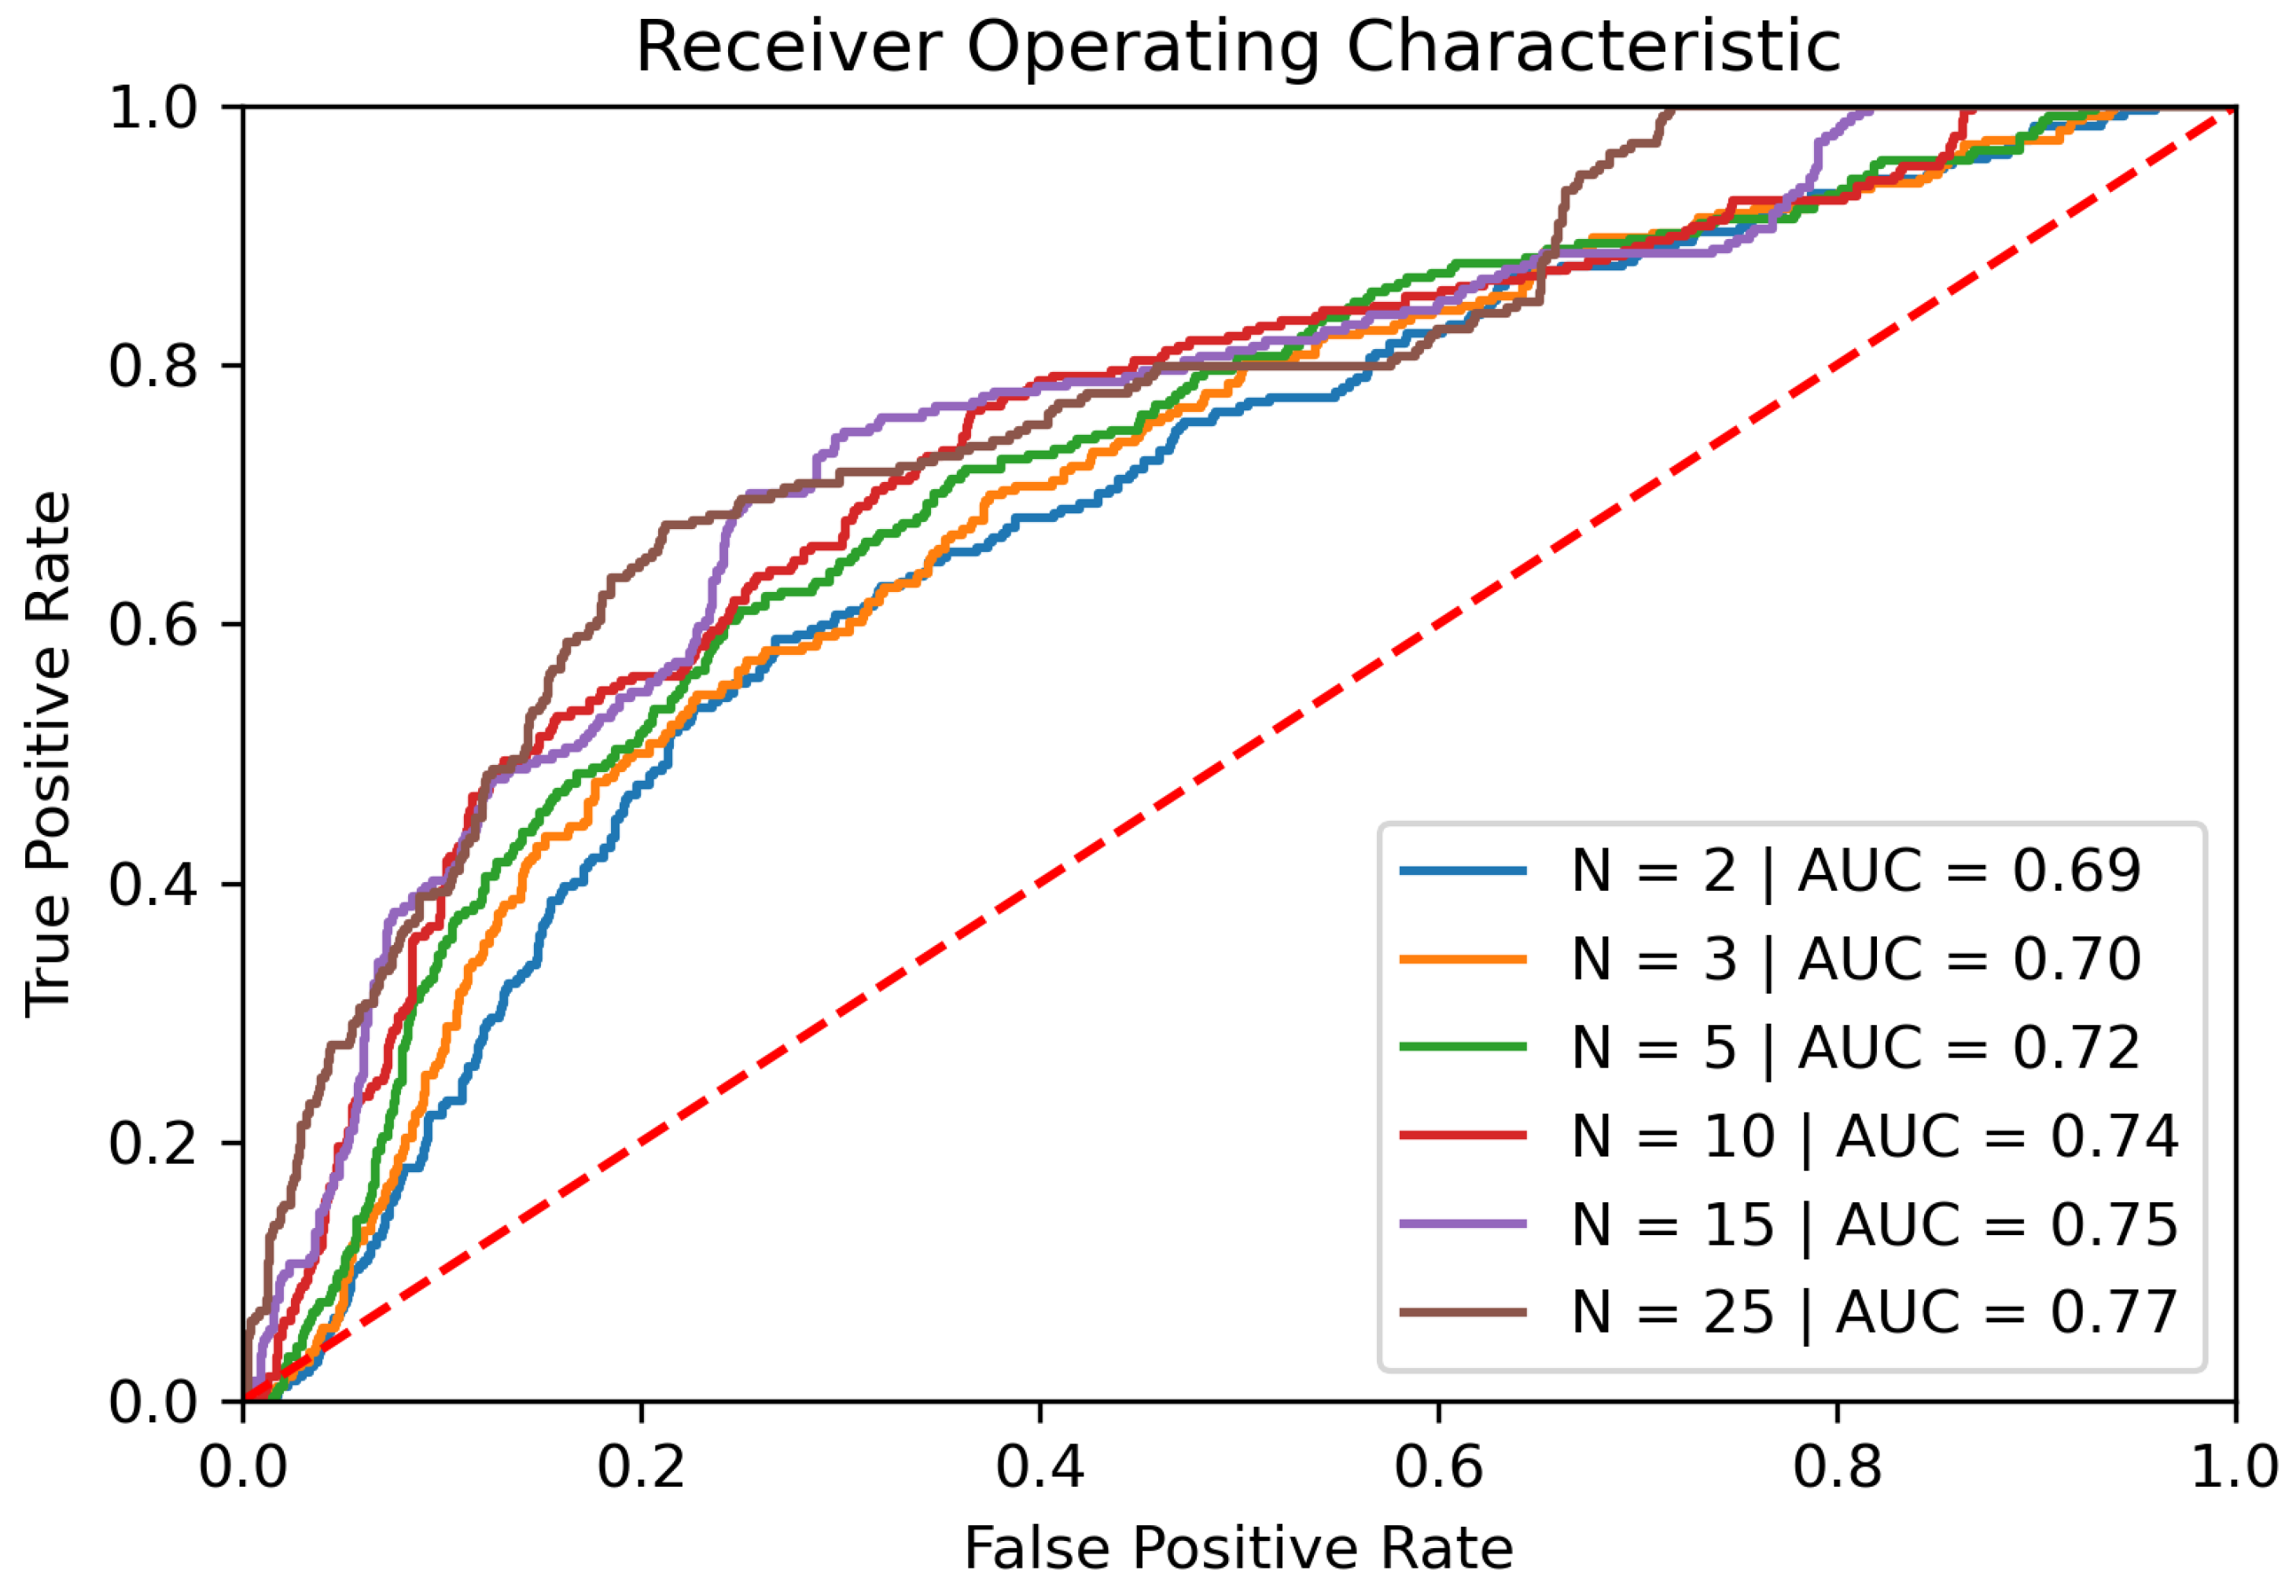
After grouping the individual scores, we can again compute the ROC curve and the AUC. The performance of the classifier rises when grouping multiple gestures and using them as a basis for further prediction. Our example is grouping multiple gestures and achieves an AUC of up to 77% with 25 gestures as seen in
Figure 4, which is an improvement of approximately 11% compared to the first implementation, relying on single gestures only. Additionally, the EER with the same configuration went down to roughly 30%. The performance increase is more significant when increasing the number of gestures in the lower spectrum, for example from two to three. When using a considerably high number for grouping a lot of gestures, the performance does not increase with further significance.
However, while the grouping of gestures shows considerable advantages in terms of prediction performance, the security of the continuous authentication system is threatened in other ways. First, the system has to wait for n stroke inputs before it can decide if the current user is legitimate or an adversary, which makes the system not fully continuous because some inputs could be made by either of those user groups.
Another important factor when considering grouping of input gestures is the fact that the high volatility of single stroke prediction is minimized. For example, if an authenticated and valid user is doing a gesture which is unusual, the HMM could not learn the behavior of it. However, due to the normalization between multiple inputs, the effect of the low resulting score from the unique input may not be enough to mark the input from the valid user as an intrusion of an adversary.
However, when the score of the unique gesture gets too low, the grouping of the inputs also does not help in this matter. The calculated score will be too low and a valid user could be marked as an adversary. To circumvent this, there may be other measurements, for example, dropping the worst score of the group of inputs.
Variable Gesture Lengths
Another approach for improving the performance of the classifier would be to generally remove input gestures, which do not hold enough information. Here the gesture length is crucial on whether the input will be used by the system or not. Gestures with only one data point are problematic, because the classifier needs at least two data points to infer the transition from one hidden state to another in our model. To circumvent this we would require an additional model to consider such data samples.
A drawback of limiting the gesture length for the authentication process is, that an adversary could potentially exploit this behavior by only issuing commands that are not in the considered gesture length.
6.4.2. Achieved Results
By relying on position data only and applying the previously mentioned improvements our implemented system is able to achieve an AUC of approximately 84% and an EER of about 25% using 25 consecutive strokes and gestures with more than 50 data points only as illustrated in
Figure 5. To further improve on those first results, the next sections are considering more features for the classification process.
6.5. Training with More Features
One of the most important aspects of training a classifier successfully is the selection of the correct features, which hold the data the model is trained on. If too few features are selected, there is not enough data for the training process. The created HMM will therefore not have enough information to generalize the datasets ideally.
Apart from position data, the recording framework also captured accelerometer data, when the user was performing input gestures and timestamps for the corresponding recording timeframes. When including those features as part of the model training process, it has to be considered that they also have to be brought into a normalized form. For example, the accelerometer value range differs largely from the range of the position input. Furthermore, we have to consider whether to use the same classifier for all features, or to create separate classifiers for each. Moreover, the number of hidden states and mixtures, which are utilized by the HMM may change depending on the number of used features since more complex inter-connections have to be handled by it. It is, however, also important to keep the number of hidden states and mixtures as low as possible. If a model with fewer states and mixtures achieves a similar or slightly worse result, it should be evaluated if the added complexity, of the model with the high amount of parameters, is worth it. This has to be done in order to prevent overfitting of the training data.
6.6. Potential Drawback of Accelerometer Data
Although the presented configuration, using position data combined with values from the accelerometer sensor, provides good theoretical performance in regard to AUC and EER this may not happen in a real-world scenario.
This may be because all the training data was captured solely in one sitting. This means that most probably every user who was asked to perform the recording of the touch input data, was capturing it in the same or similar position. For example, when a user was doing the recording while being a passenger of a car and was sitting all the time while doing so. Because of that, the classifier may know nothing about the behavior (regarding data captured by the accelerometer sensor), when the user would be walking or lying in a bed. Furthermore, when we were asking the participants to capture the data, we set no constraint on which posture they were allowed to take. This means that some of them were standing while others were sitting.
It is important to note that this fact is crucial for interpreting the prediction performance of the continuous user authentication system. It may be the case that the classifier is learning when a user is lying in bed, rather than the behavior when performing touch gestures on the screen of the device. One possibility of tackling this aspect would be to normalize the accelerometer by subtracting the initial position of every data point. However, we would still need a more sophisticated test set, containing information about the user’s position in the room.
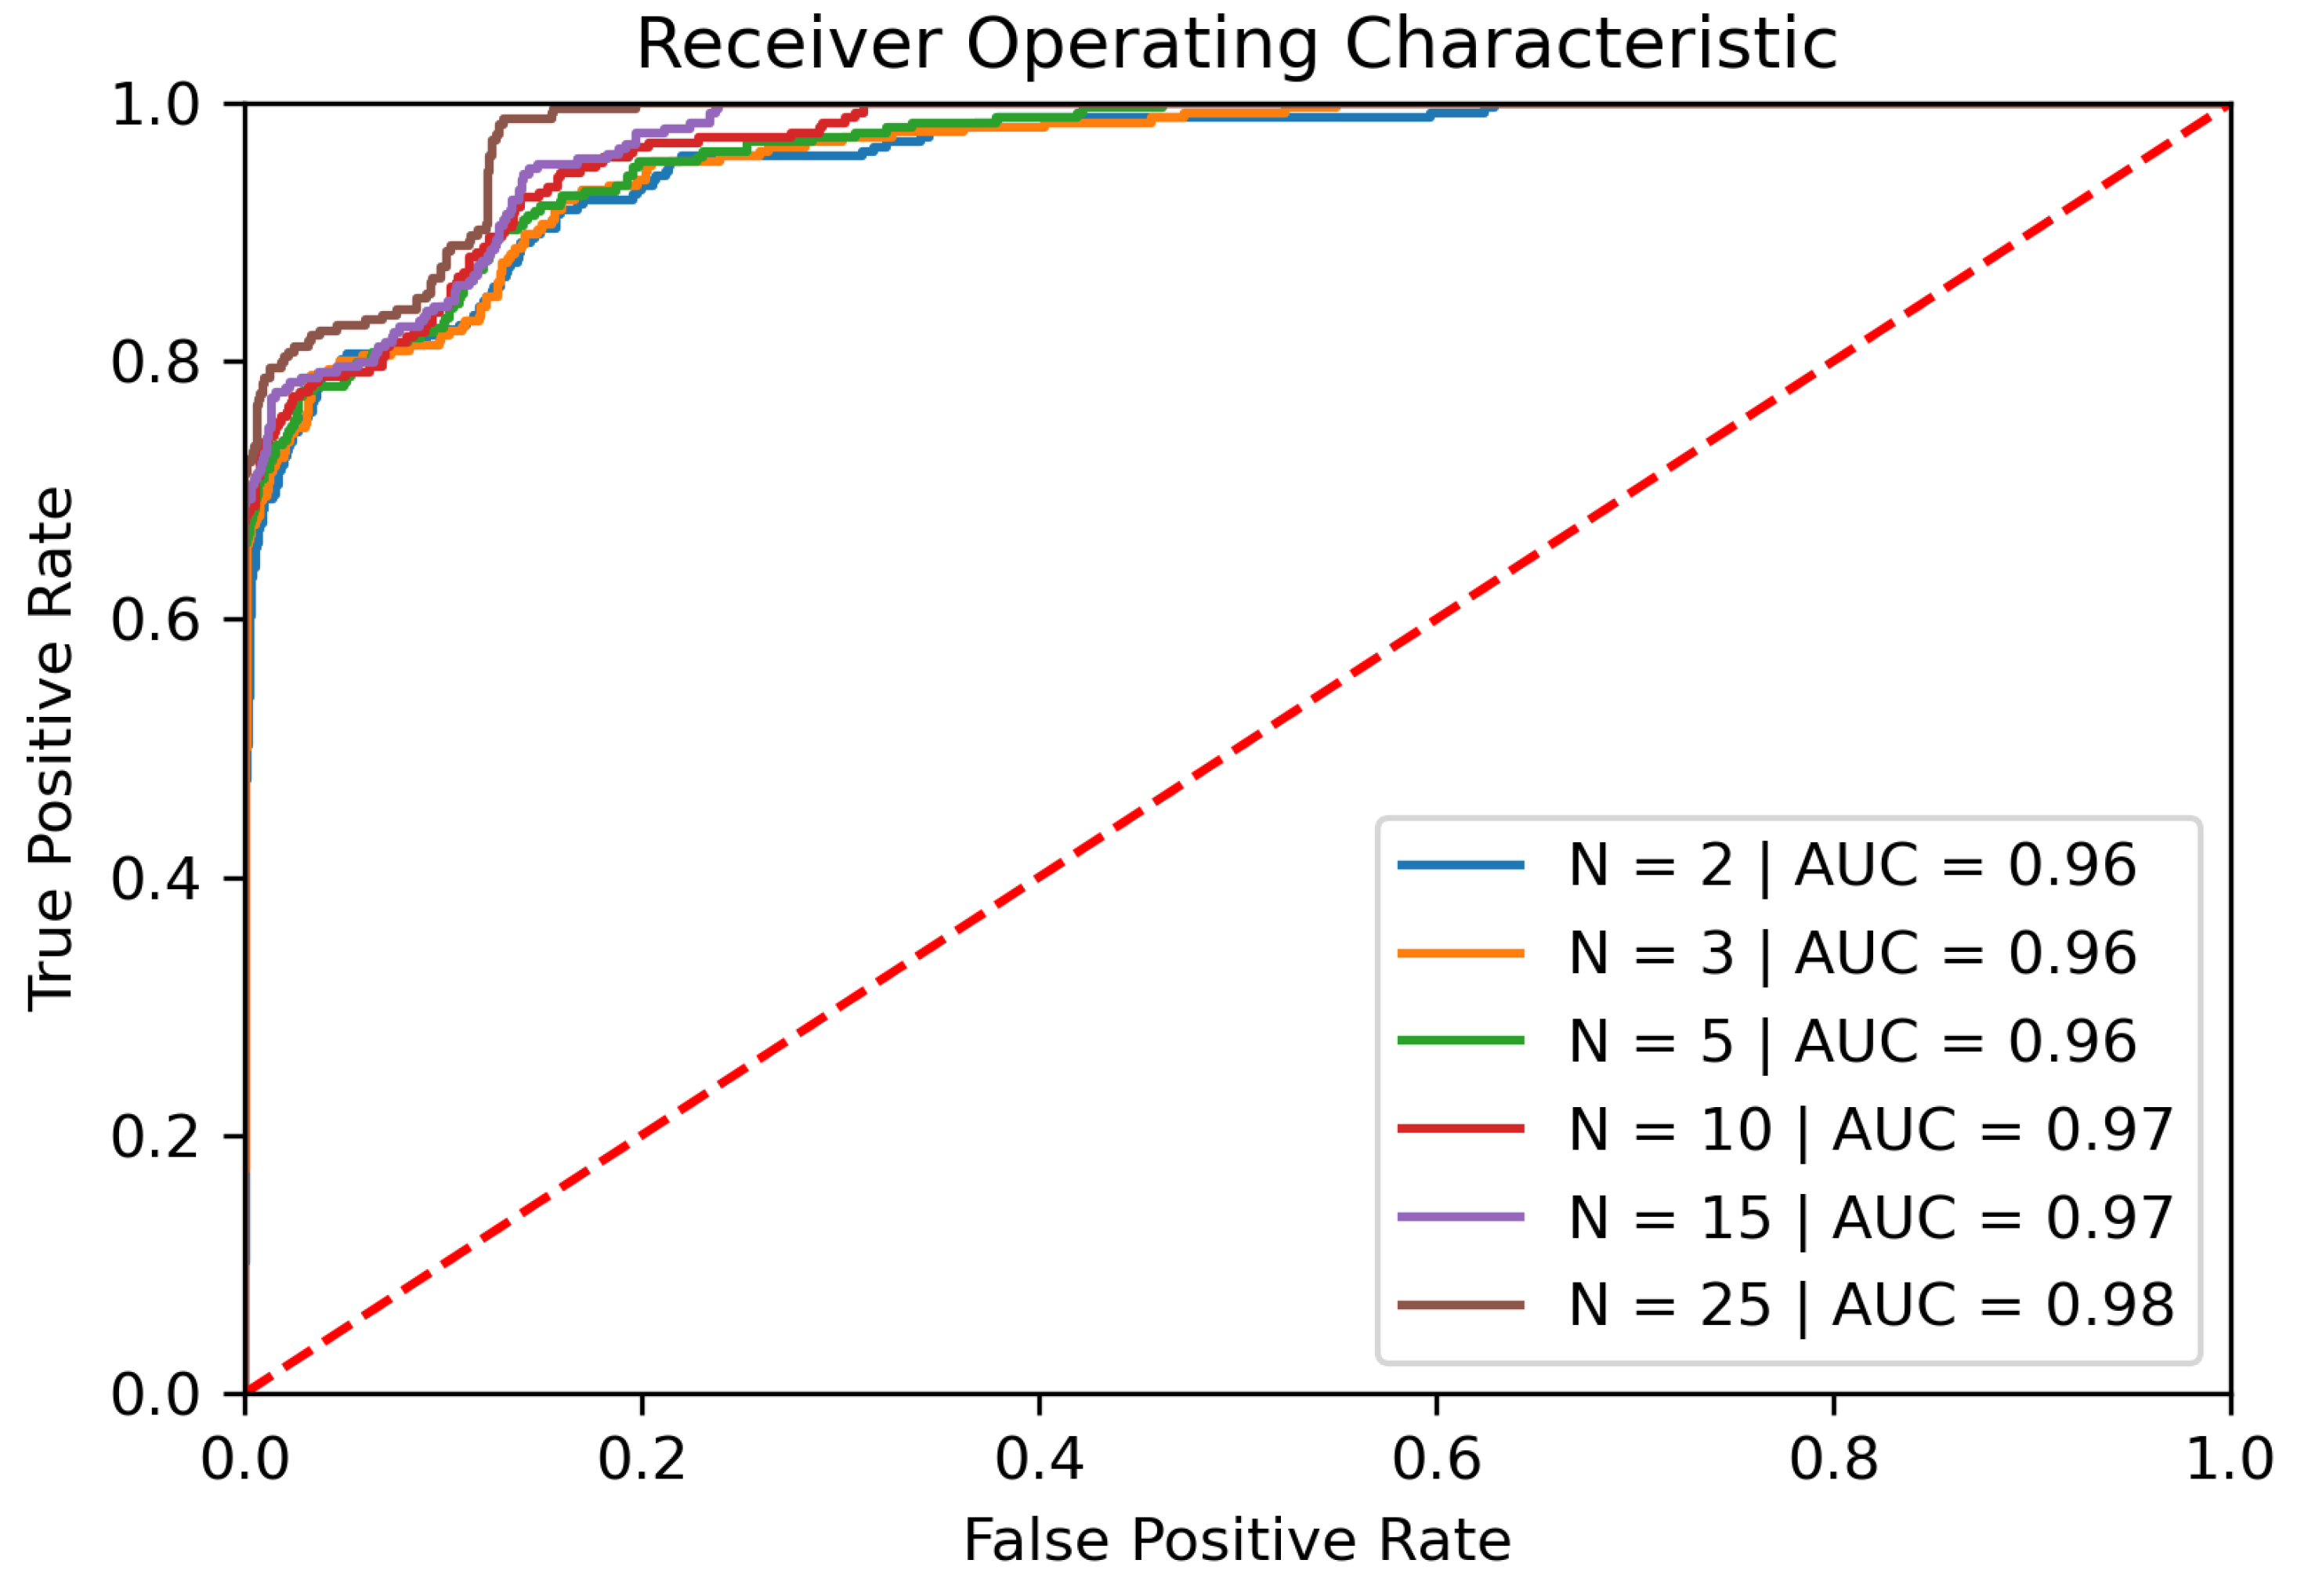
When we are comparing the performance of the classifier using single gestures versus grouping of multiple inputs, we can see that the AUC is only increasing slightly with a larger grouping factor. While the AUC rises from 93.9% up to 100%, the EER is falling more sharply from 12% when using single gestures to approximately 1.34% when combining 25 stroke inputs. Although grouping that many gestures together may raise problems, we can see in
Figure 6 that using position and accelerometer data for our training process resulted in acceptable performance regarding the EER of the classifier.
6.7. Adding Time Information
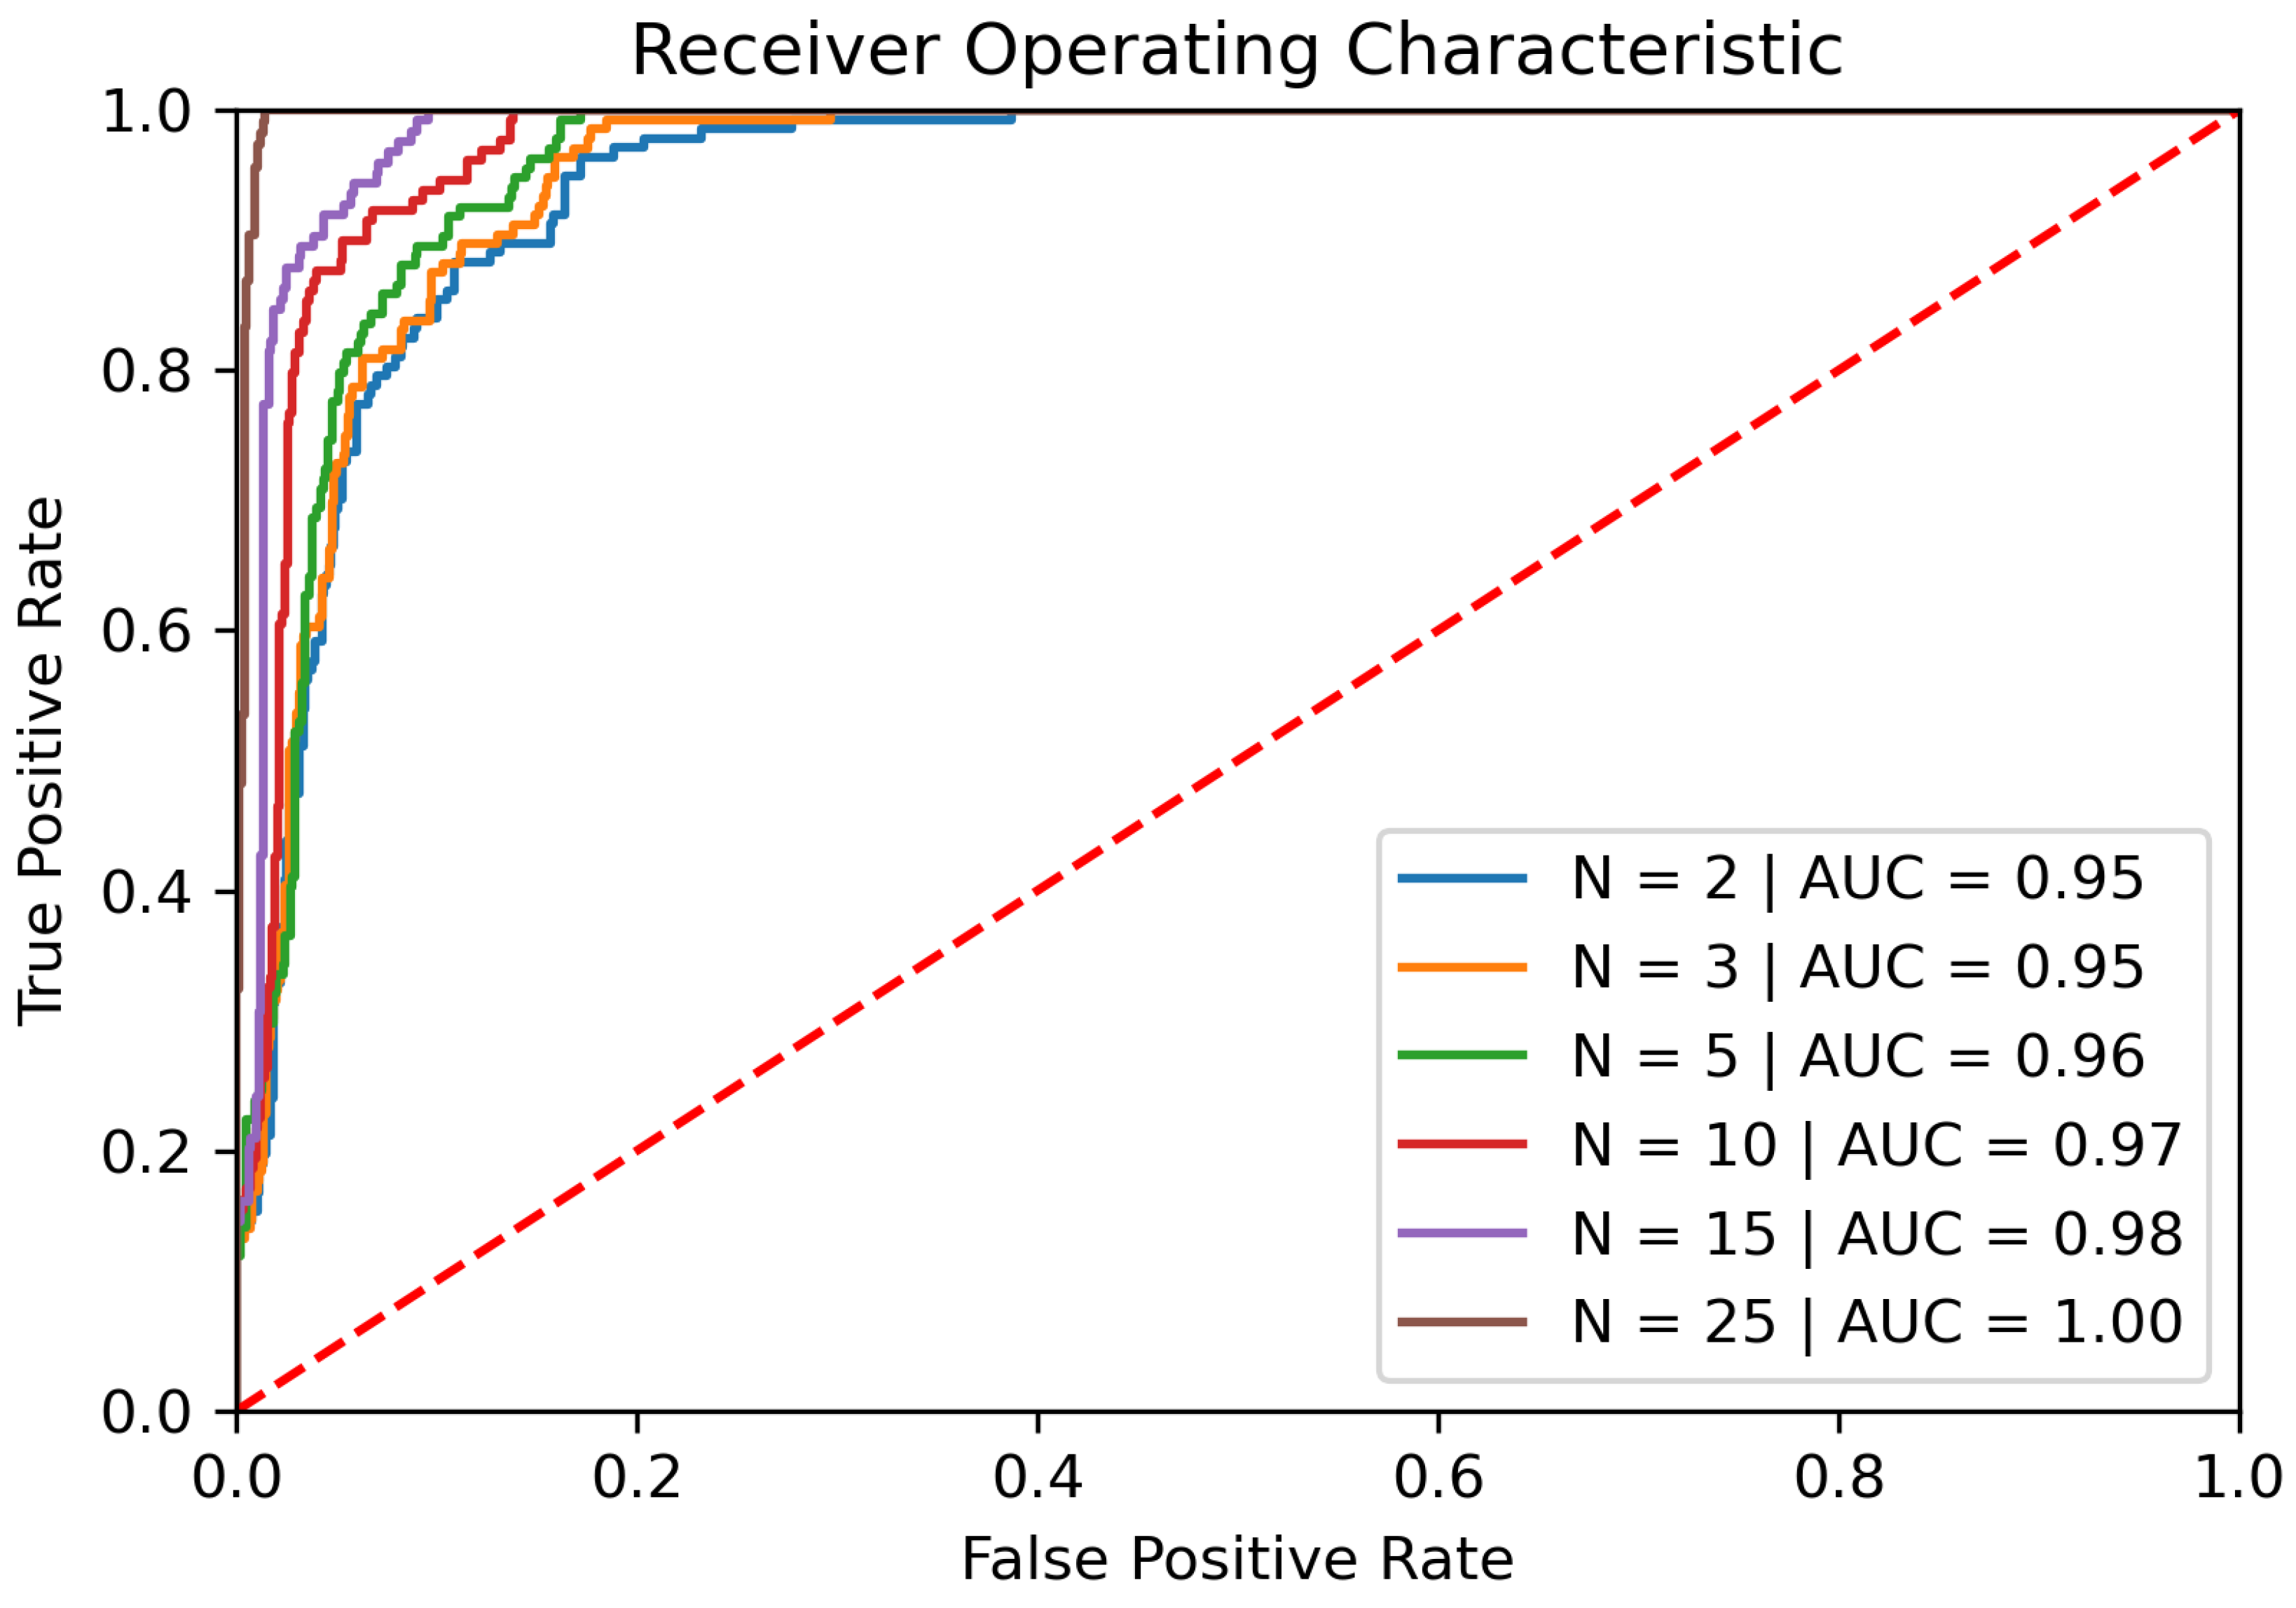
For the last tested configuration, we combine position, accelerometer, and time data to train the classifier. The AUC for a single gestures is about 95% and also the EER is the lowest for all evaluated single gesture configurations, with a value of 12.97% when considering gestures of lengths bigger than one.
When considering multiple gestures, with gesture lengths greater than one, the configuration using position, accelerometer, and timestamp features does also perform better than any other tested. The AUC reaches up to 98% with 25 consecutive gestures grouped as seen in
Figure 7. The EER of the classifier drops to about 11.4% when combining 25 gestures.
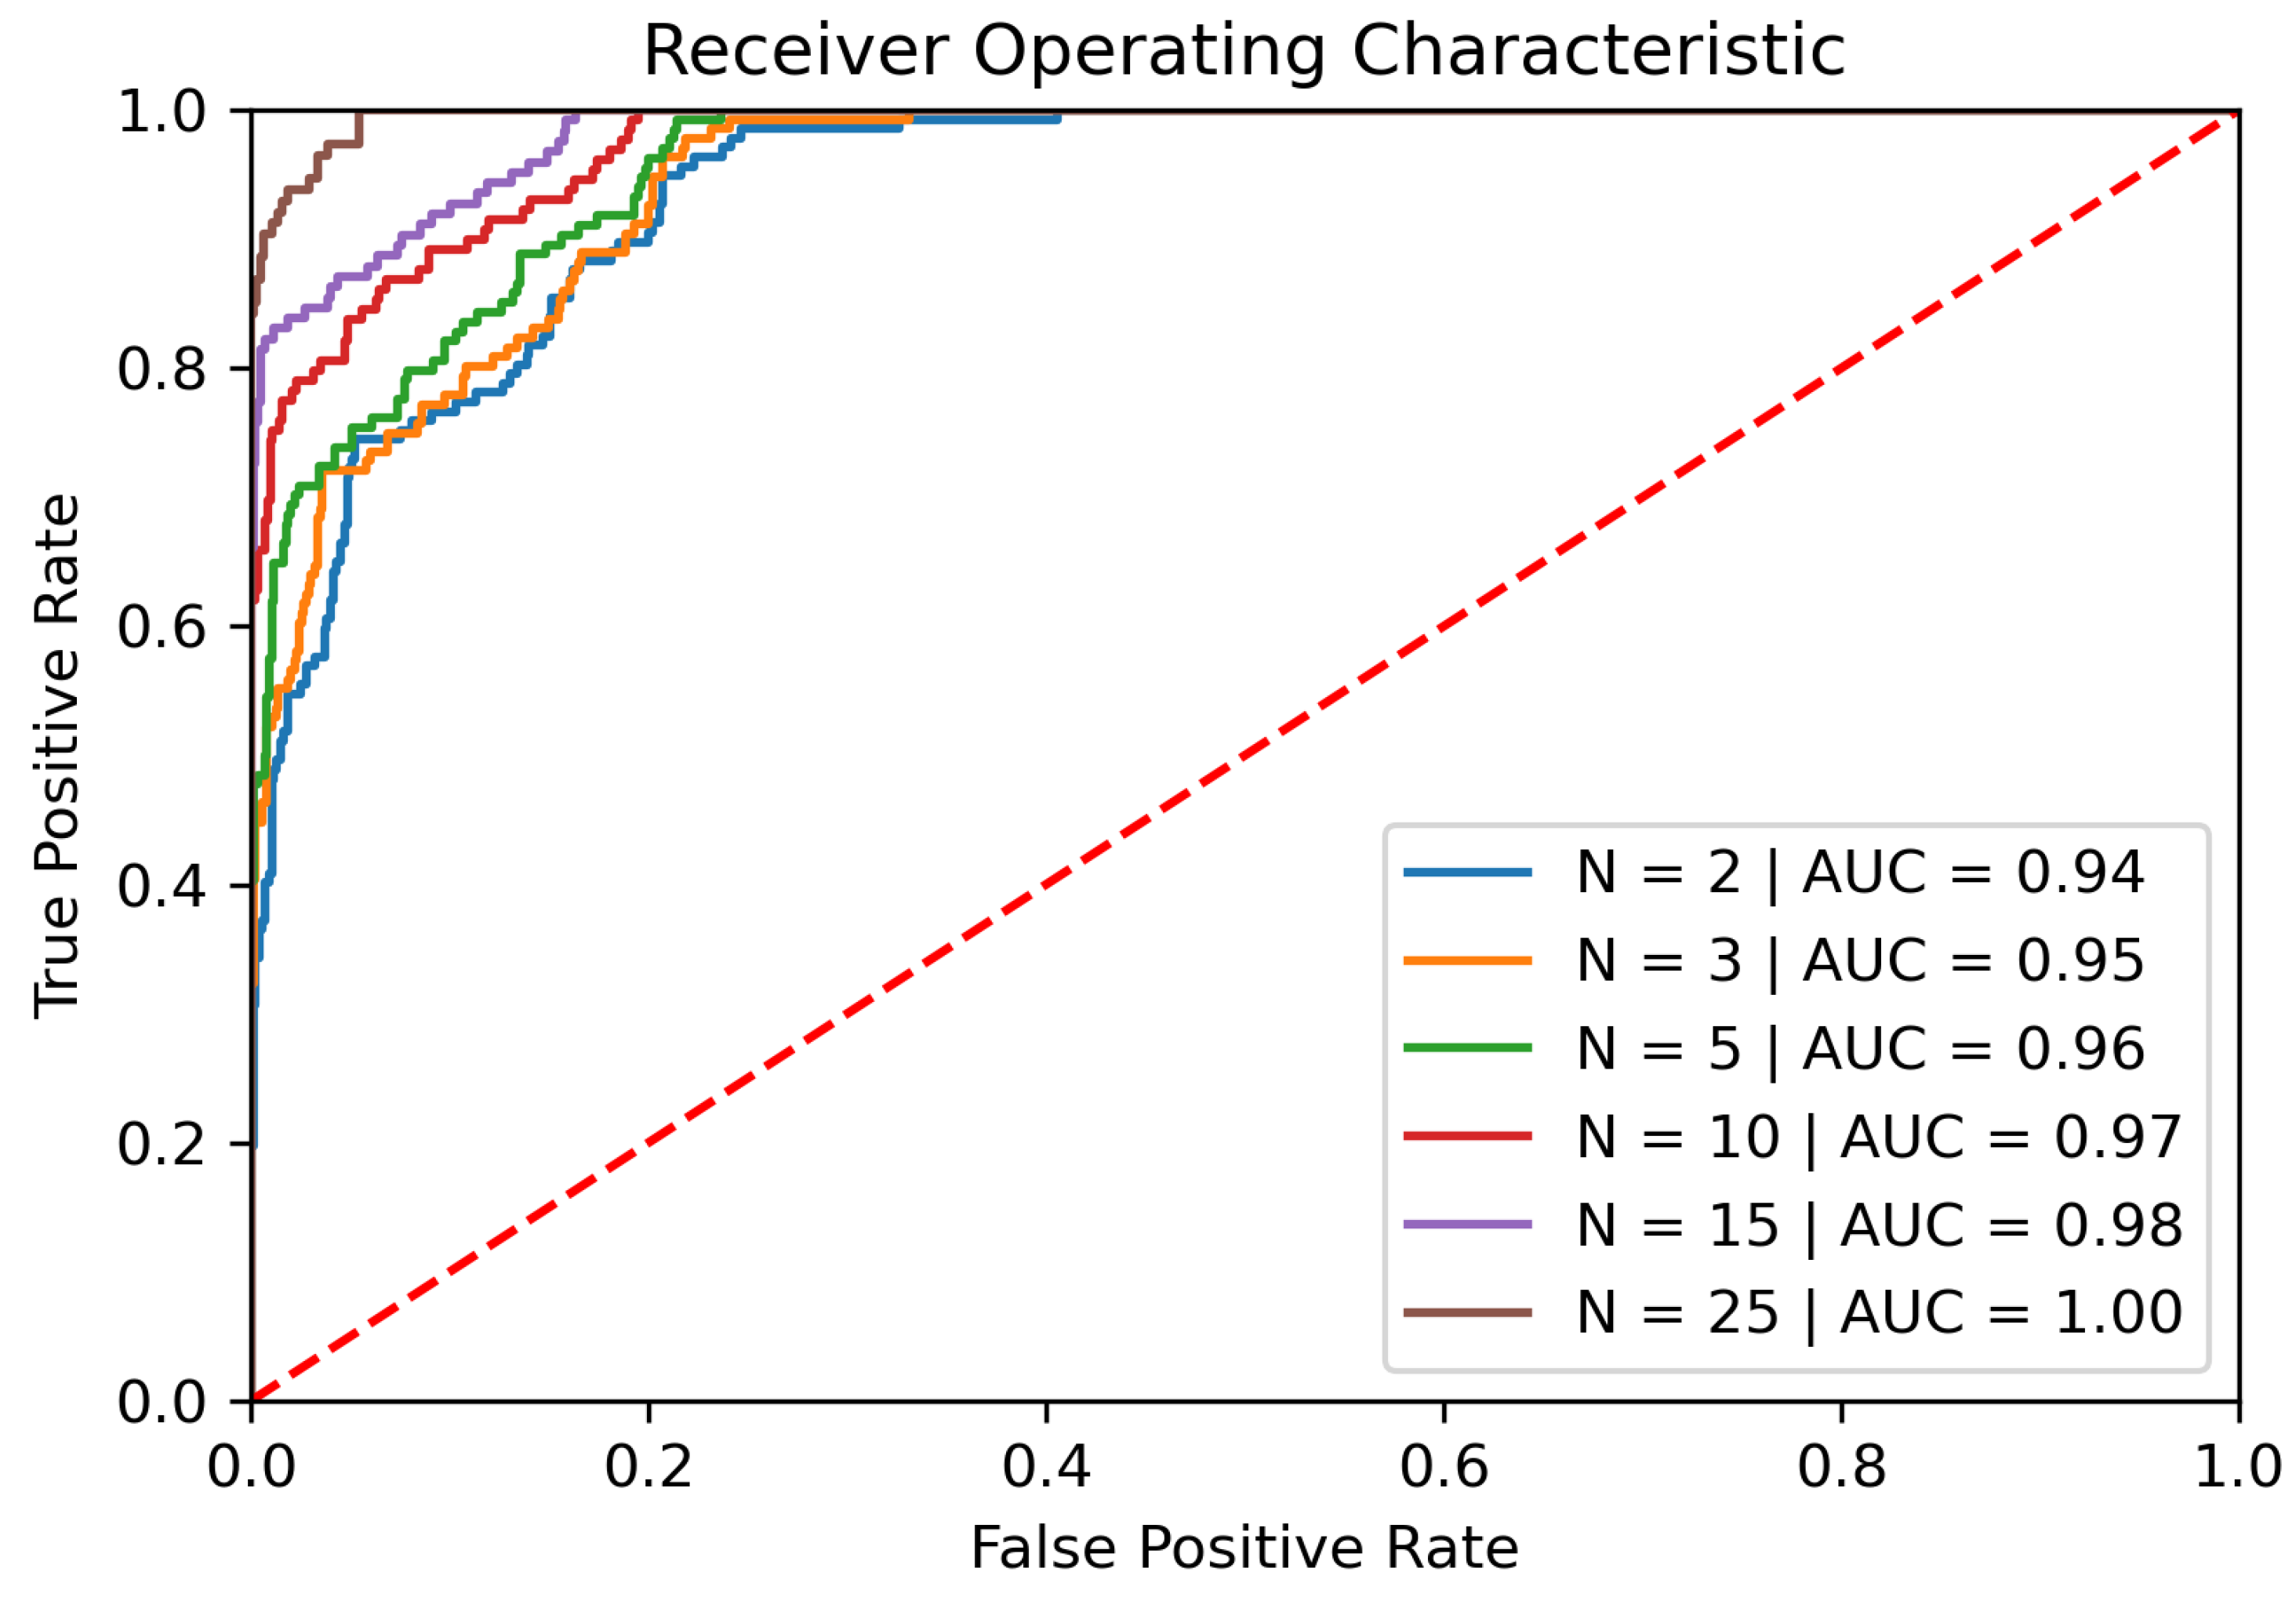
When we are considering a classifier (again with four hidden states and four mixtures), where the lengths of the gestures have to contain more than 50 data points, the AUC is with 94% for single gestures a little bit worse than when considering gestures of all length. Furthermore, the EER is about 3% higher with 16.2%.
As soon as the input gestures are grouped, the AUC rises up to 100% with 25 combined gestures as illustrated in
Figure 8. Furthermore, the EER drops to 3.6% when grouping that many gestures.
6.8. Comparison against Related Research
Our best classifier achieves an AUC of approximately 100% while maintaining an EER of 1.34%. This is done by combining position and accelerometer data using gestures with more than 50 data points and averaging the prediction result of 25 consecutive gestures. While there are other implementations, which reach better results with less grouped gestures, as for example [
28] where eleven consecutive inputs lead to an EER of 0.31%, in this section we also want to compare the details of the implementations compared to our system.
6.8.1. Dataset and Performance Metrics
The reported performances for the systems presented in the related research chapter are heavily dependent on the used dataset. Some of the used datasets, for instance, rely on horizontal and vertical touch inputs only, while others use a combination of tap and slide gestures. Our system, on the other hand, tries to use every possible form of touch input for the classification. Only inputs with a single data point are disregarded since they do not contain information for how the internal states would chance in the HMM. To also consider those inputs, another HMM classifier could be employed, which predicts on a sequence of such inputs, and is used together with the default model.
Furthermore, not every research paper uses the EER metric for comparing the performance of the created classifier. Some papers, for example, are only reporting FAR and FRR like [
1], while others measure the performance in regard to standard accuracy, but do not report the AUC which is considered a better measure for learning algorithms [
35]. Our implementation relies on the AUC and EER values of a classifier since most other work described in
Section 3 also relies on the AUC and the EER. Moreover, the EER can be calculated from the FAR and FRR, and gives a better insight over the actual performance since it combines the FAR and FRR into a single, easy to compare metric.
6.8.2. Grouping of Gestures
Another important aspect for comparing the different implementations is how many gestures are used for calculating the performance of the classifiers. Some of the papers are not reporting their metrics for different grouping sizes of gestures, even though this is also an important metric, regarding the overall security of the continuous authentication system. Standing out from other related research, Feng et al. in [
1] explains the consequences of grouping gestures and proposes techniques for circumventing the impact on security, by not calculating an average score. In their work, three out of seven consecutive gestures have to be recognized as valid input, with a timeout resetting the number of valid ones. In our work, we present the performance of each trained classifier with single gestures as well as with a number of multiple combined inputs and point out the pitfalls introduced with grouping gestures.
6.8.3. Used Classifiers
Most of the existing approaches on finding a mobile continuous user authentication system implement traditional classification models like k-NN, SVM, or similar. Examples would be [
26] or [
27]. Our system in comparison relies on the HMM, which in general is considered a statistical model, where through the forward algorithm, the likelihood of one input sequence belonging to the created model is calculated. The HMM classifier is also employed and researched in [
28] (where the dataset from [
26] was used), as well as [
29], whose authors also consider accelerometer and gyroscope data.
HMM Advantages
The main advantage of relying on them instead of the previously mentioned classifiers is that when training a HMM, only data of the authenticated user is necessary. This means that a user who wants to train such a system can do it offline without the need for remote data. This ensures that the user’s data is not unnecessarily transmitted over the network as well. Furthermore, the HMM is capable of online training. This means that, as soon as new touch gestures from the authenticated user are detected, the HMM can retrain itself with those, to better model the user’s input behavior. Therefore, the model trains the user’s ever-adapting input habits.
HMM Disadvantages
However, it has to be noted that using HMM as classifiers for these tasks does also come with several drawbacks. For example, the internal parameters, namely the hidden states and the mixtures used for configuring the classifier are not known to us. This is because for such complex sequences of data finding meaningful hidden states is a hard task, as opposed to a simple model, which for example does use the weather as hidden states, and models it as hot, mild, and cold. For finding the best number of states we are therefore relying on the Baum–Welch algorithm, where, from the available data, a model is fitted. This, however, does also introduce the problem that most of the time only local optimums are found. Furthermore, the model does generally tend to overfit when increasing the number of hidden states and mixtures. In our implementation, we use the configuration with the least amount of parameters, which does perform well enough, to select the number of hidden states and mixtures.
6.8.4. Architecture of the Implemented System
When evaluating the related systems, it can be seen that most of them do not describe their process of data acquisition and final implementation on the mobile device, but rather focus on the model training and evaluation part. What we know is that all researched papers were using devices running on the Android operating system, but the type of mechanism that was used for acquiring the necessary touch input data was not revealed. Our work implemented an Android application, which made it possible to use the generated HMM to make predictions on how likely inputs came from a user. However, the lock-out mechanism and a scientific study on the usability of our implementation were not carried out but could be subject of future research.
6.9. Performance with Test Data
When using the generated models to make predictions against the test datasets, the classifiers using more features gave better results than the ones only relying on position only or position and time data. If the position and accelerometer data were used the best results could be achieved, with an AUC of approximately 97% and an EER of 6.91% using a group of ten gestures, which are all longer than 50 input points. When increasing the number of grouped gestures to 25, the AUC could be pushed up to 100% with a corresponding EER of 1.34%. Additionally, using timestamp data did not improve the performance of the classifier, which may be due to the fact that time information did not get captured perfectly accurately. However the results achieved with all data combined are still better than with, for example, only position data. Single input gestures reach an AUC of 93.51%, while maintaining an EER of 16.23%. Those results can again be improved by combining multiple gestures. With 25 inputs combined, the AUC rises to 100% with an EER of 3.34%. However, even though we are reaching a low EER and a high AUC for our test sets, this does not necessarily mean that our classifier is working flawlessly.
7. Problems with Current Implementation and Future Work
Even though our implementation of the continuous mobile user authentication system seems to achieve good results, when training a HMM classifier using position and accelerometer data, there are still a few flaws impacting the performance and distorting the accomplished results. These problems are shortly summarized in the following section, and advice is given on how they might be circumvented.
7.1. Timestamp Accuracy
The timestamps used for training the HMM classifier were not captured perfectly. This happens because the Android recording application is obtaining them through a call to System.currentTimeMillis(), instead of also taking the timestamps provided by the getevent utility. We did this initially because the kernel utility was already producing a large amount of events per second. In order to make this process more performant, we decided to not include timestamps in the output and save time on the string parsing of the produced lines. Therefore, due to premature optimization, we cannot ensure that timestamps are perfectly accurate.
7.2. Dataset Recording
When we consulted our participants for recording the datasets, required for training and testing the implemented classifiers, we did not consider timeouts in between recording sessions or multiple different recording positions. Our recordings were made all in one sitting. Therefore, it is not possible for the evaluation, to test the performance of the classifiers, based on various time gaps, for example, when the data was recorded and trained one hour or one day prior to testing. When we think about this afterwards, it would have been wise to do so, in order to make similar comparisons as made in [
26] or [
28]. Additionally, the position in which the participant has to be when recording the test data was not determined and considered in our implementation.
Furthermore, currently the dataset consists of records from six different users. Although only data from a single user is necessary, for training a HMM based classifier, the more test data available, the more accurate the results in terms of performance and EER can be produced.
7.3. Grouping and Gesture Lengths
Currently, to achieve higher performance for the classification of gestures, we are grouping multiple gestures and averaging the results. Gestures of a certain length are discarded, and classification is only done with a predetermined range of input lengths. This has the downside that some gestures are not used by the system, making it less secure, since an attacker can potentially use those gestures to attack the target device. However, when we are using only single gestures with all possible gesture lengths, the results predicted by the continuous authentication system are rather random and the overall performance of the classifier would be bad. Because of that, it is necessary to find a trade-off between those two approaches.
8. Conclusions
The goal of the work was to experiment with continuous mobile user authentication for Android devices using HMM classifiers. As we can see from the results presented in
Section 6, the performance of the classifier is highly influenced by the features used for the training and verification process. The internal configuration of the generated model, which is determined using the Baum–Welch expectation maximization algorithm, also influences the prediction results. Because this algorithm converges to a local optimum, the outcome may differ after training with the same dataset. This also introduces a problem when the number of hidden states and mixtures is set too high, in overfitting the model to the trained dataset.
Since single gesture inputs result in a random outcome of the prediction algorithm, our work illustrates how the grouping of multiple gestures results in better performance but also introduces problems for the overall security of the system. Furthermore, the restriction of the gesture length used for classification was evaluated. This did also improve the performance of the classifier in some configurations, but did introduce similar problems as the approach of grouping gesture scores. Our model achieving the best results used six states and seven mixtures predicting on position and accelerometer data. With a group of ten gestures, limited to ones with more than 50 input points, the classifier reaches an AUC of 97% and an EER of 6.91%. If the number of grouped gestures is increased to 25, an AUC of 100% and an EER of 1.34% can be achieved. A comparison to already existing systems indicates that despite reaching good performance metrics, implementations based on other classifiers and a more diverse feature set achieve better results. On the other hand, our system provides more in-depth insight on a fully integrated system, from collecting the necessary data, to adapting the trained model and finally predicting on those values. For future work, an integration of the model training component into an Android application would be interesting. This would result in a fully integrated authentication framework, based on a single system, where studies on user acceptance or similar could be made.


