
Stress Level Detection and Evaluation from Phonation and PPG Signals Recorded in an Open-Air MRI Device †


Abstract
1. Introduction
2. Description of the Proposed Method
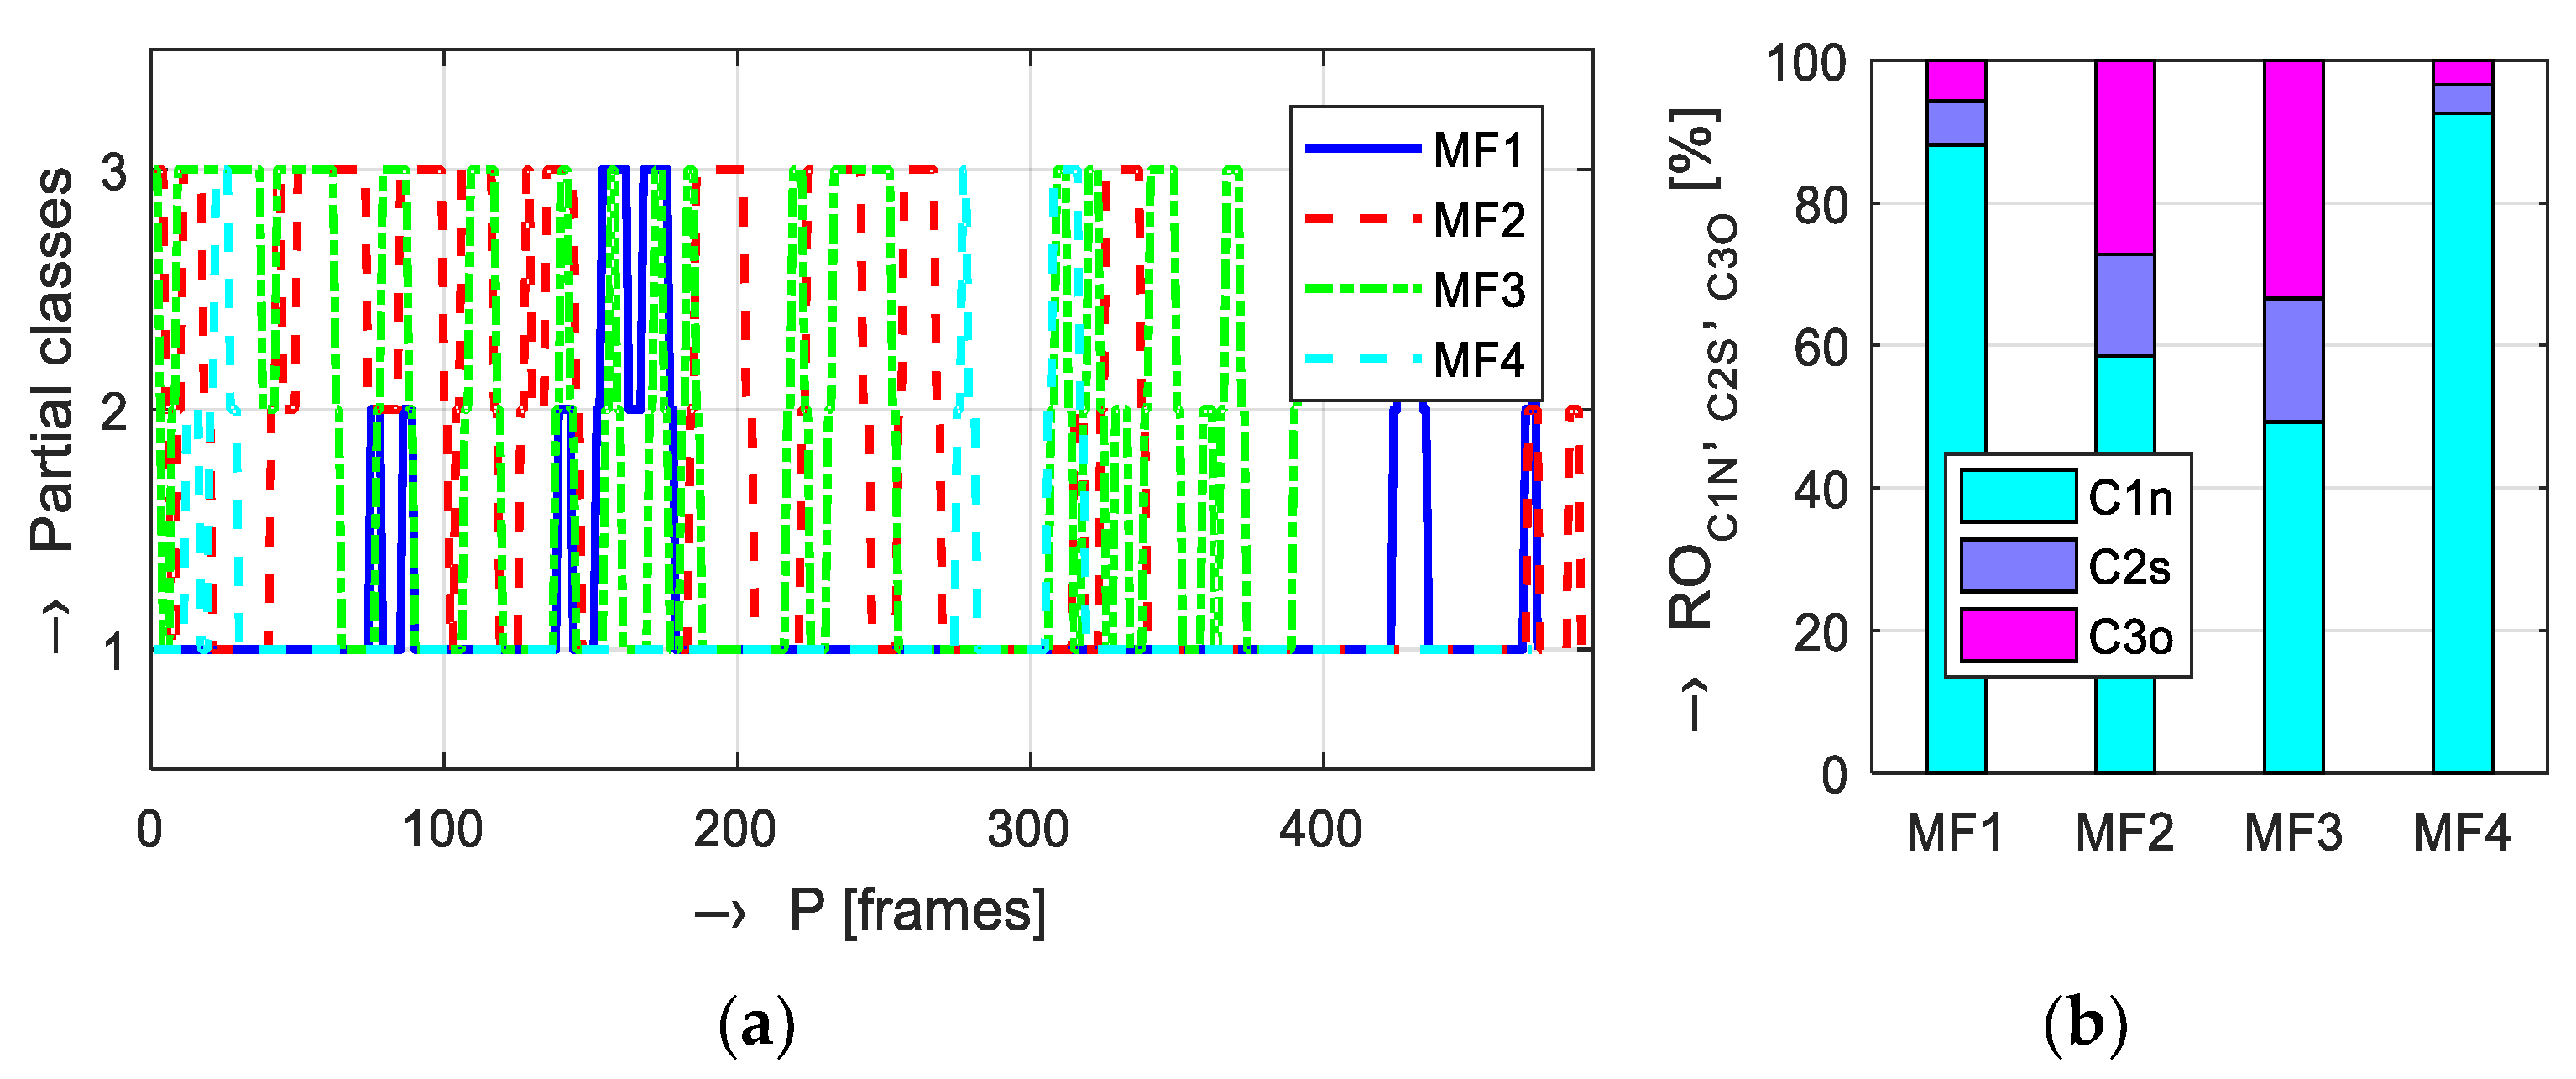
2.1. Detection and Evaluation of the Stress in the Phonation Signal Based on the GMM Classifier
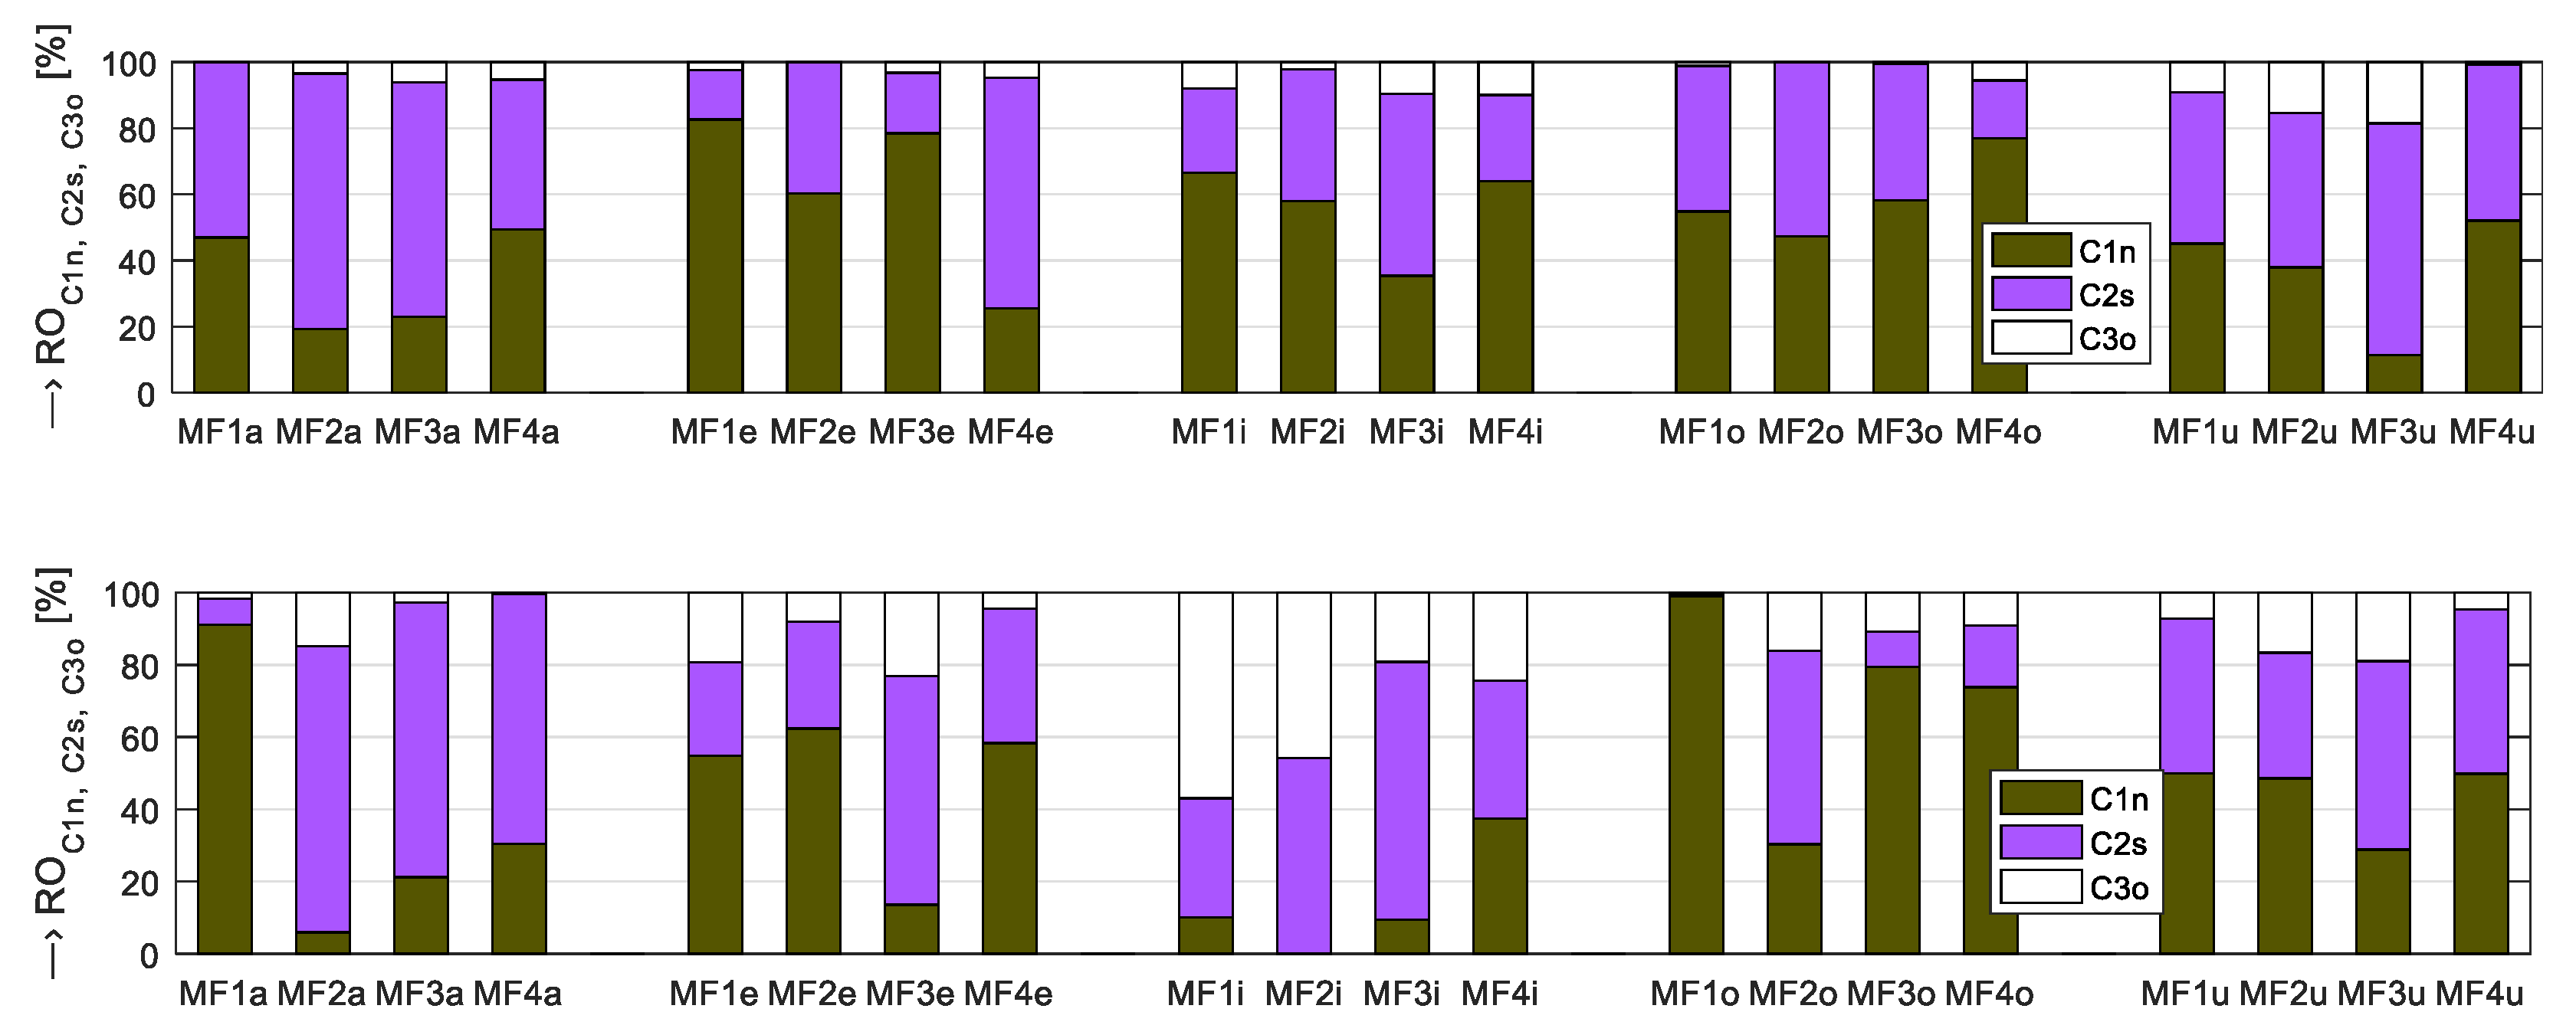
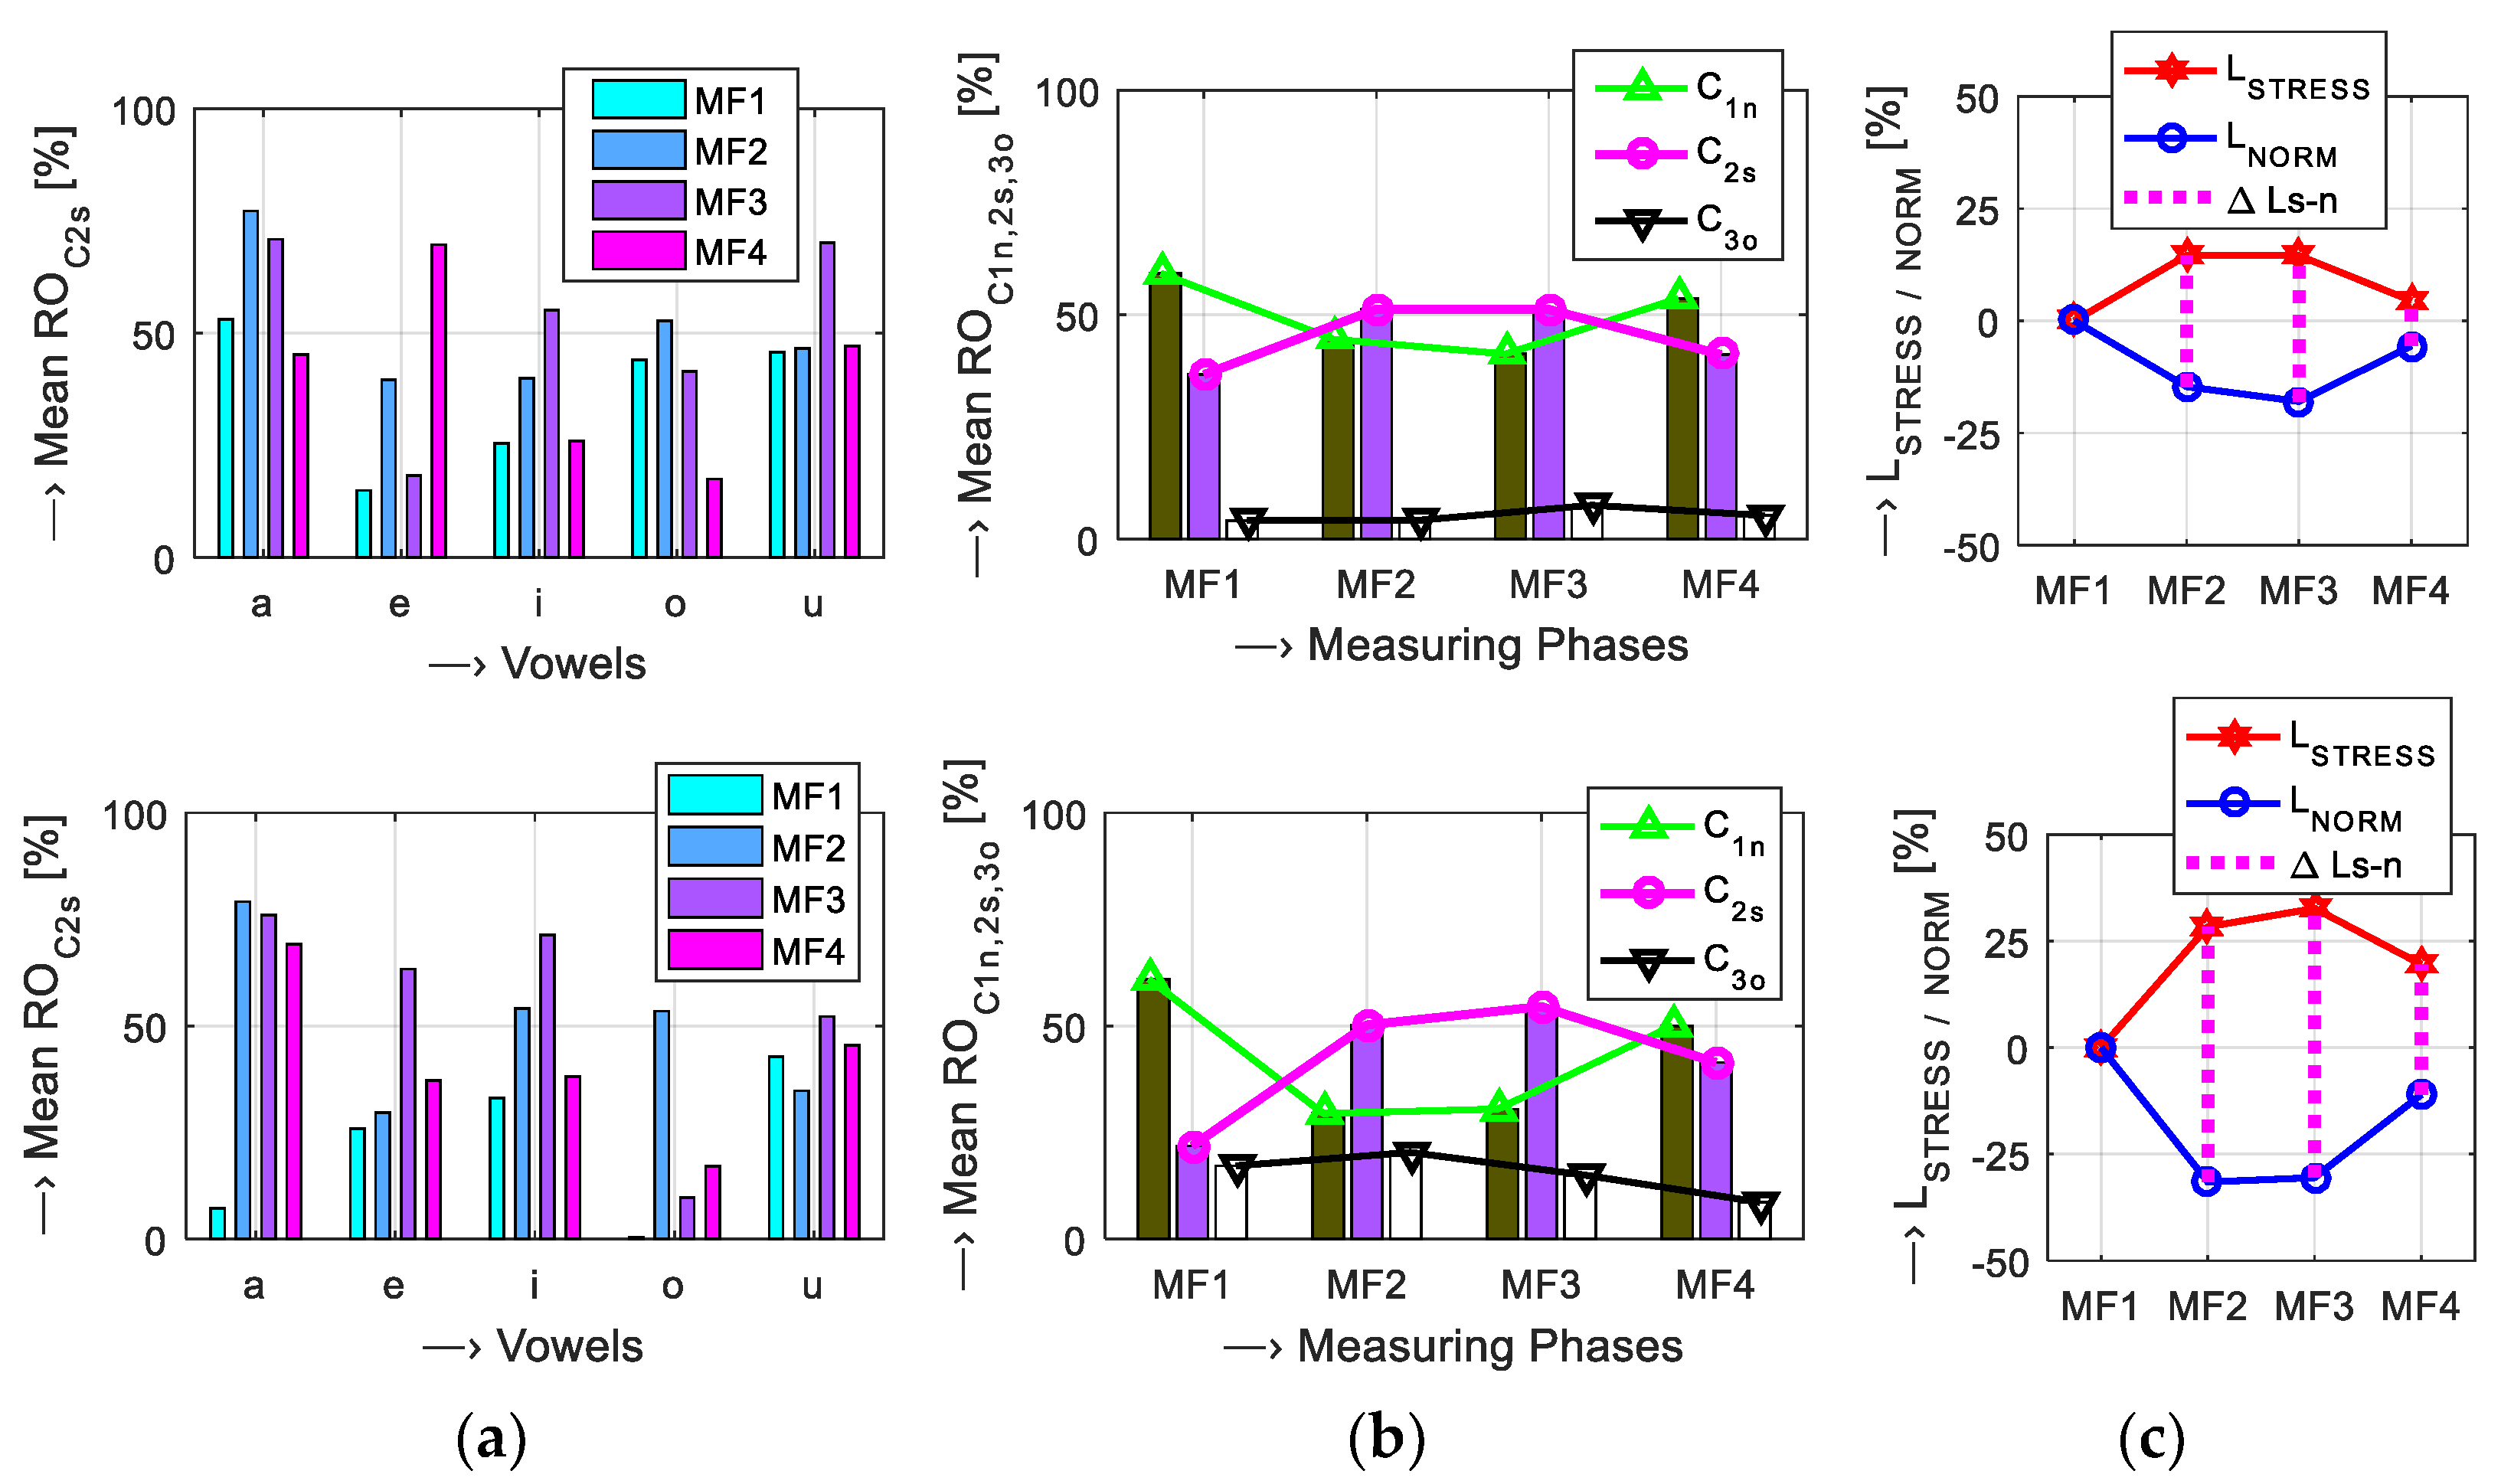
- C1N for the normal speech represented by a neutral state and emotions with positive valence and low arousal,
- C2S for the stressed speech modeled by emotions with negative pleasure and high arousal,
- C3O comprising the remaining two of six primary emotions (sadness having negative pleasure with low arousal and joy as a positive emotion with high arousal).
2.2. Determination of Phonation Features for Stress Detection
- Prosodic features containing micro-intonation components of the speech melody F0 given by a differential contour of a fundamental frequency F0DIFF, absolute jitter Jabs as an average absolute difference between consecutive pitch periods L measured in samples, shimmer as a relative amplitude perturbation APrel from peak amplitudes detected inside the nth signal frame, and signal energy EnTK for P processed frames calculated aswhere the Teager energy operator is defined as TEO = x(n)2 − x(n − 1)·x(n + 1).
- Basic spectral features comprising the first two formants (F1, F2), their ratio (F1/F2) and 3-dB bandwidth (B31, B32) calculated with the help of the Newton–Raphson formula or the Bairstow algorithm [33], and H1–H2 spectral tilt measure as a difference between F1 and F2 magnitudes.
- Supplementary spectral properties consisting of the center of spectral gravity, i.e., an average frequency weighted by the values of the normalized energy of each frequency component in the spectrum in [Hz], spectral flatness measure (SFM) determined as a ratio of the geometric and the arithmetic means of the power spectrum, and spectral entropy (SE) as a measure of spectral distribution quantifying a degree of randomness of spectral probability density represented by normalized frequency components of the spectrum.
- Statistical parameters that describe the spectrum: spectral spread parameter representing dispersion of the power spectrum around its mean value (SSPREAD = ∑2), spectral skewness as a 3rd order moment representing a measure of the asymmetry of the data around the sample mean (SSKEW = E(x − μ)3/σ3), and spectral kurtosis being a 4th order moment as a measure of peakiness or flatness of the shape of the spectrum relative to the normal distribution (SKURT = E(x − μ)4/σ4 − 3); in all cases μ is the first central moment and σ is the standard deviation of spectrum values x, and E(t) represents the expected value of the quantity t.
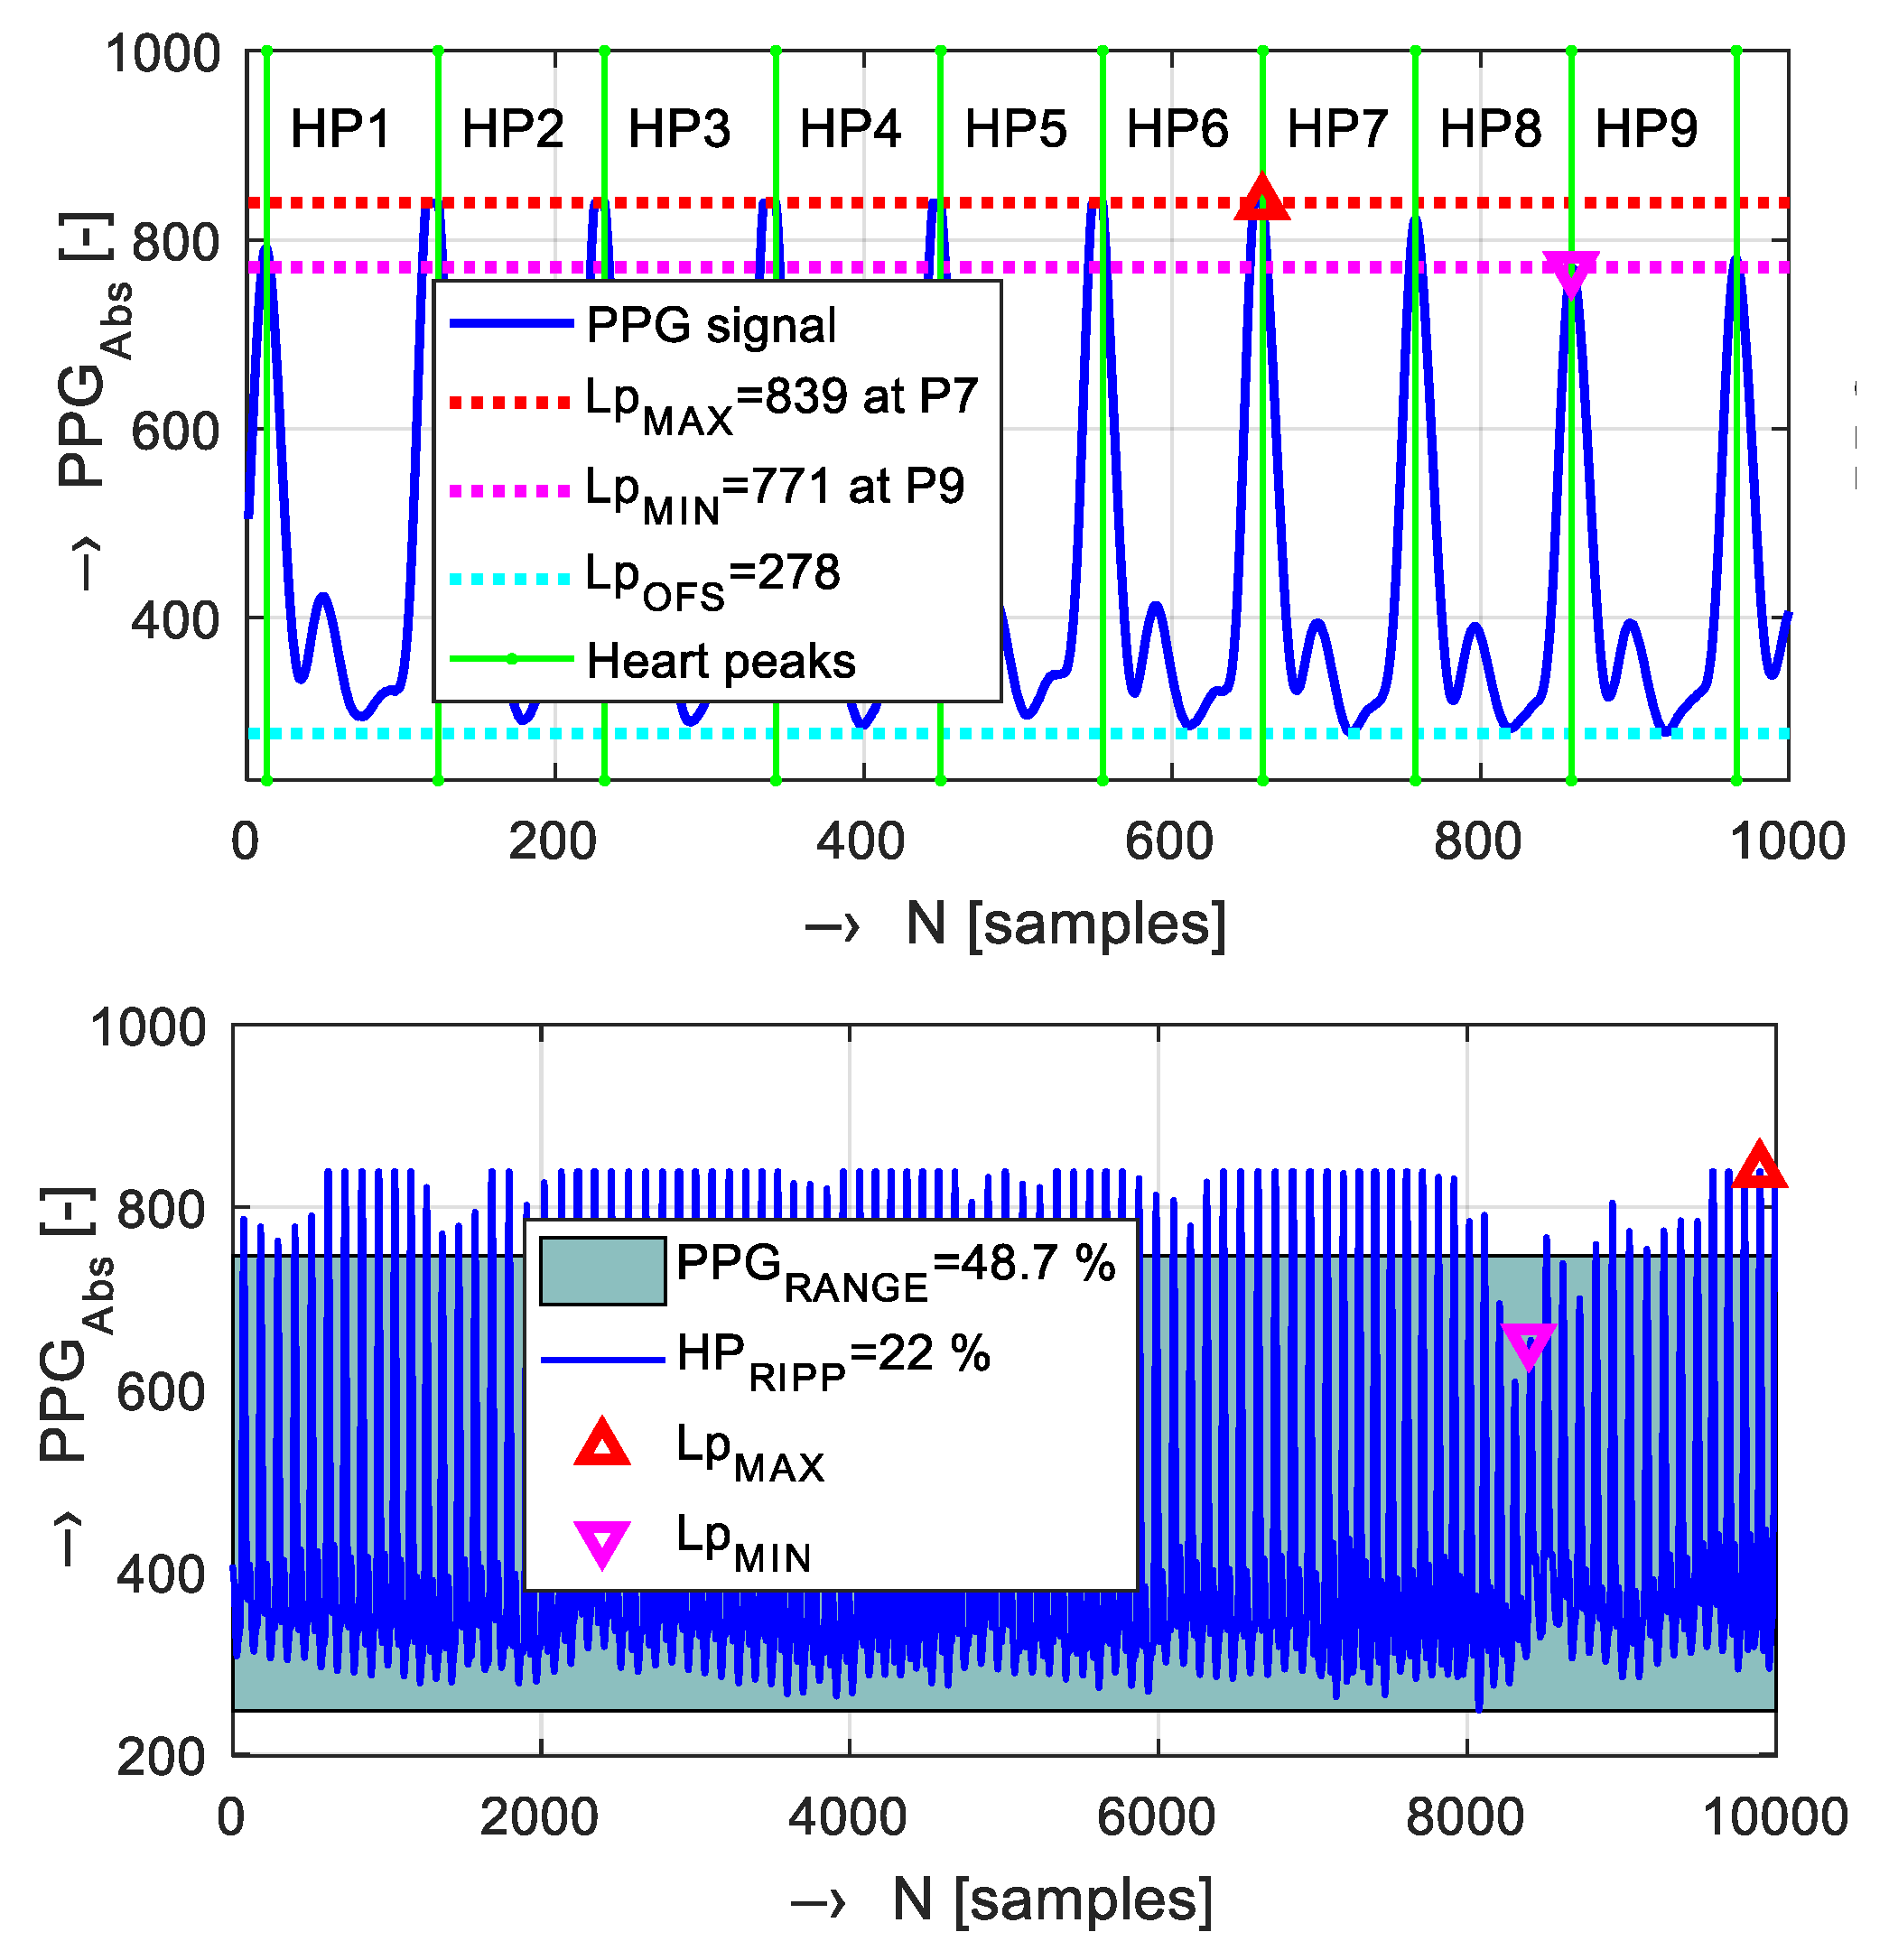
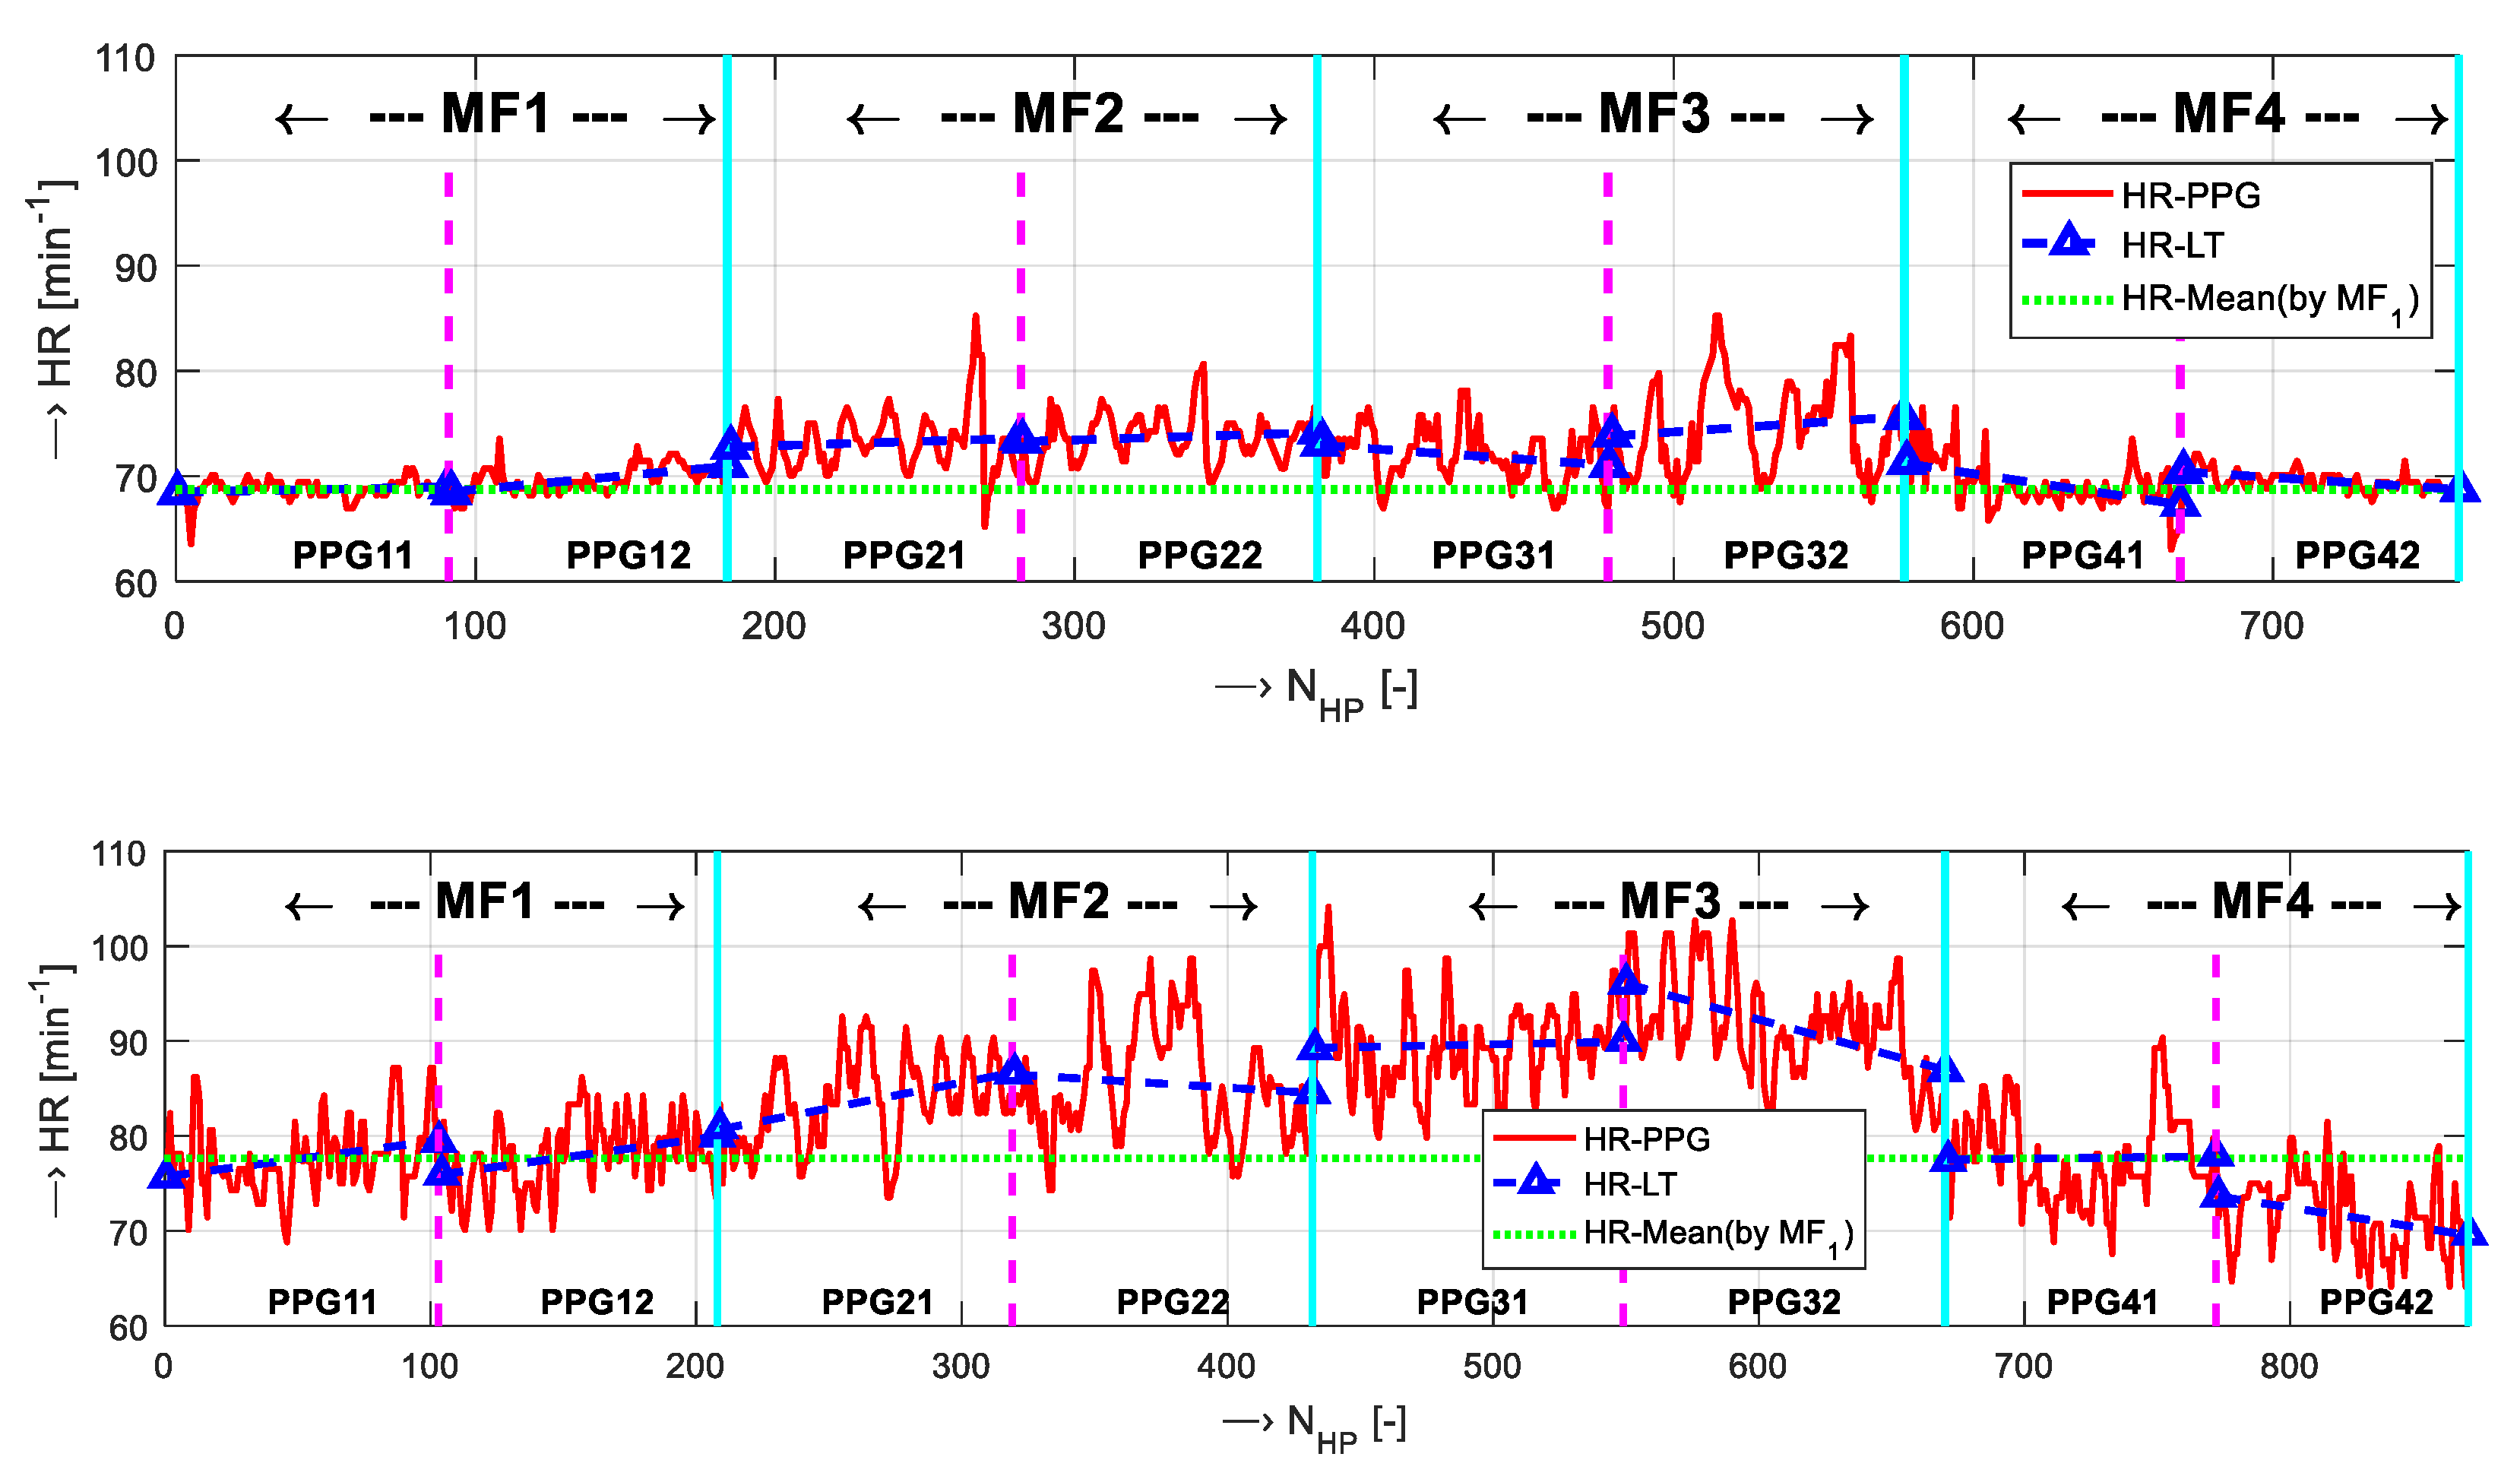
2.3. PPG Signal Decsription, Analysis, and Processing
3. Experiments
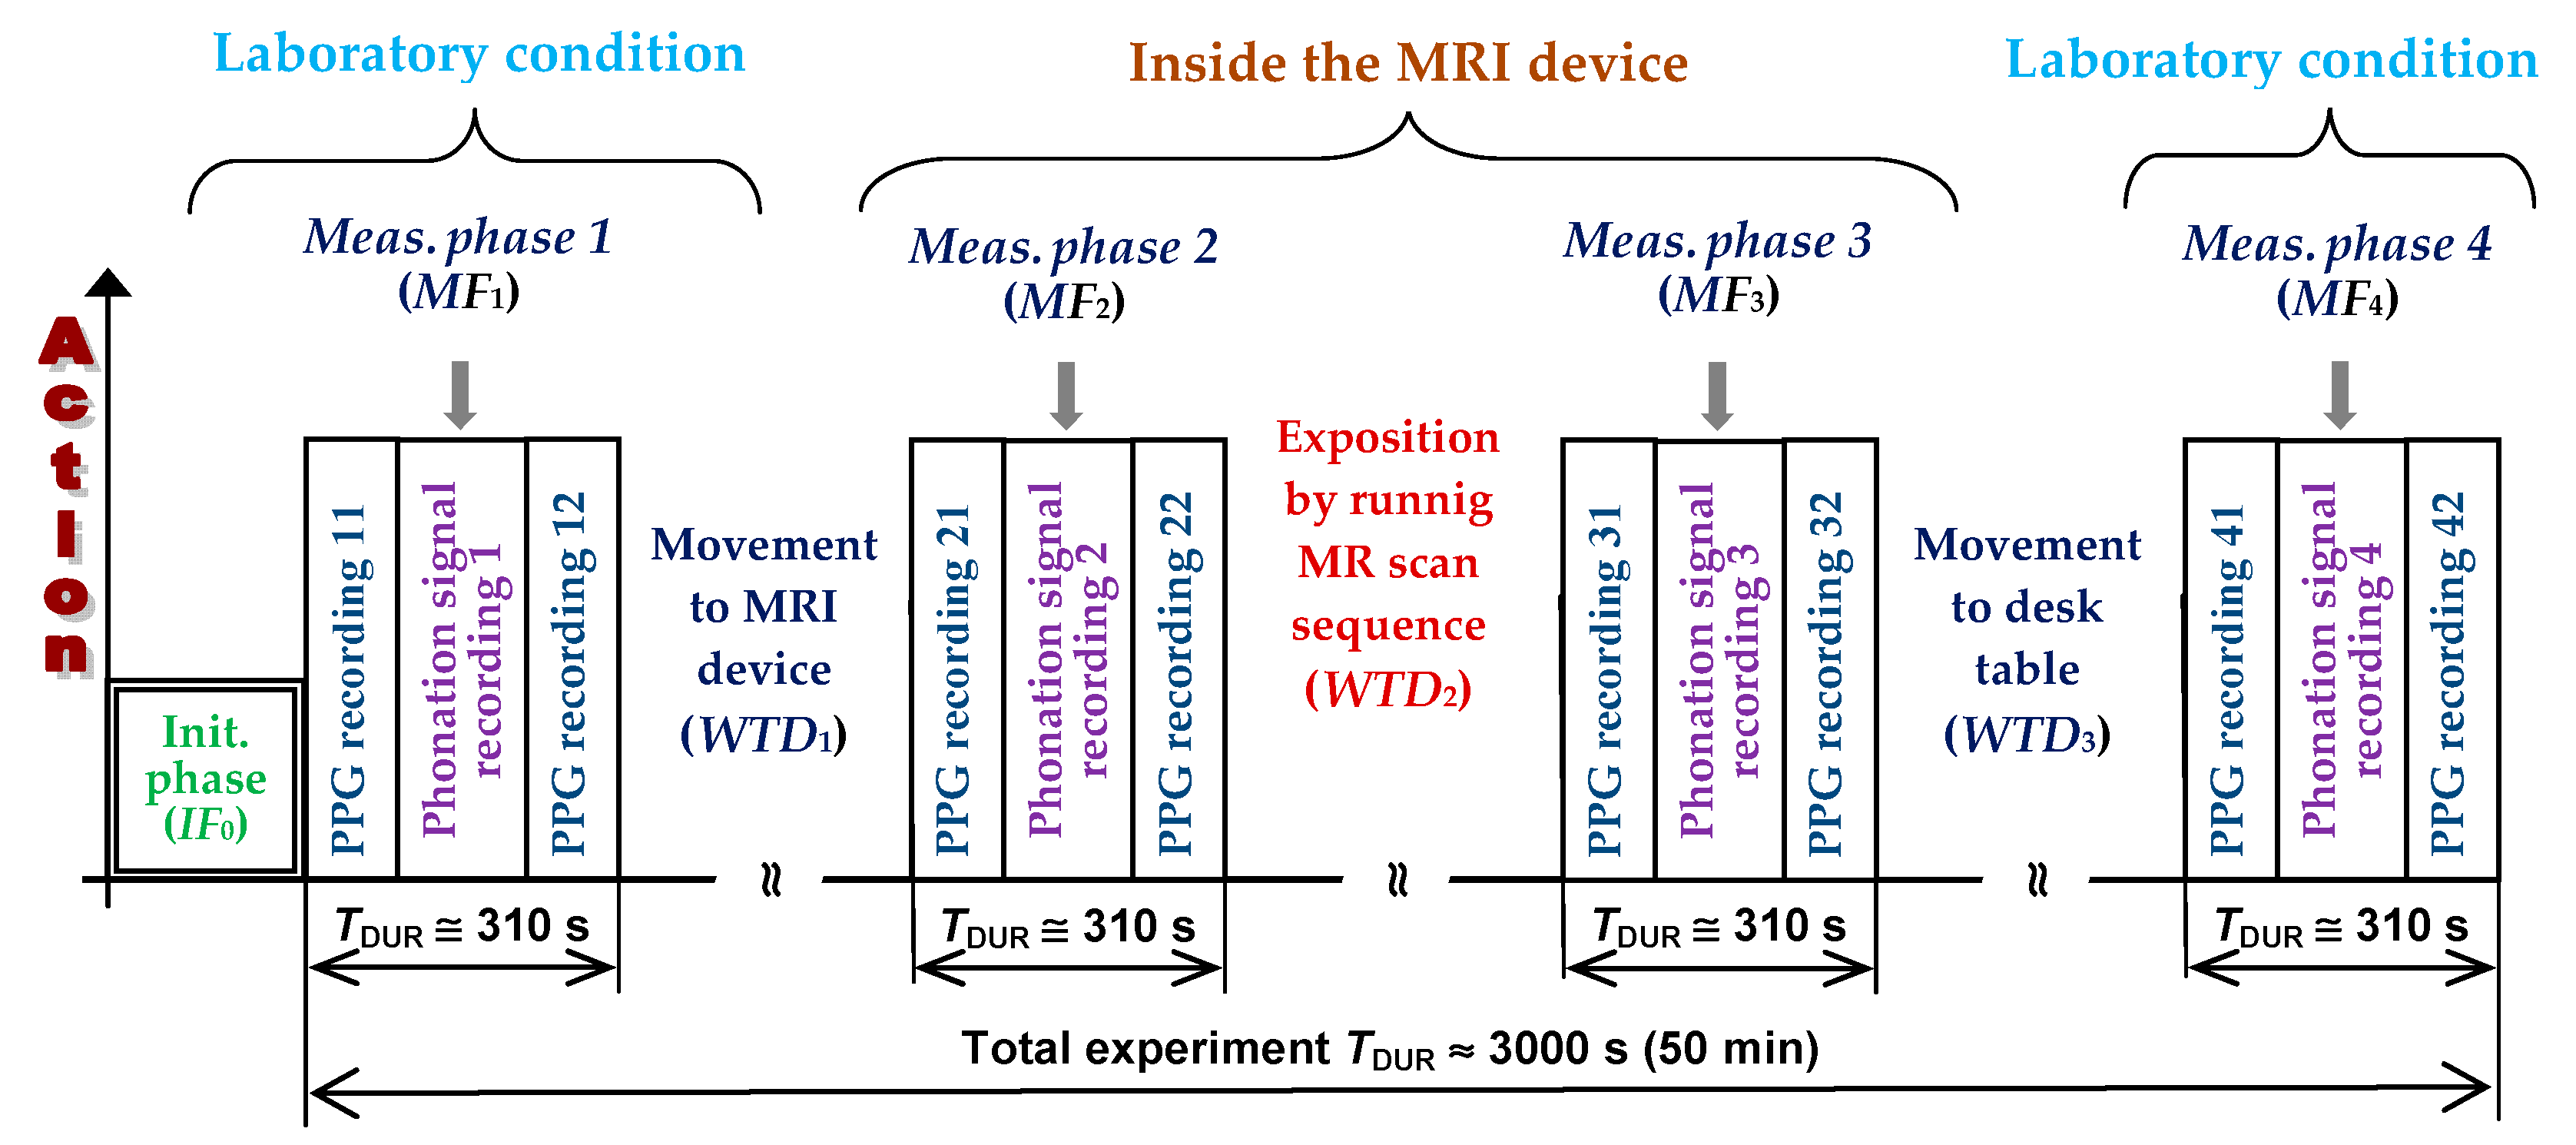
3.1. Basic Concept of the Whole Measurement Experiment
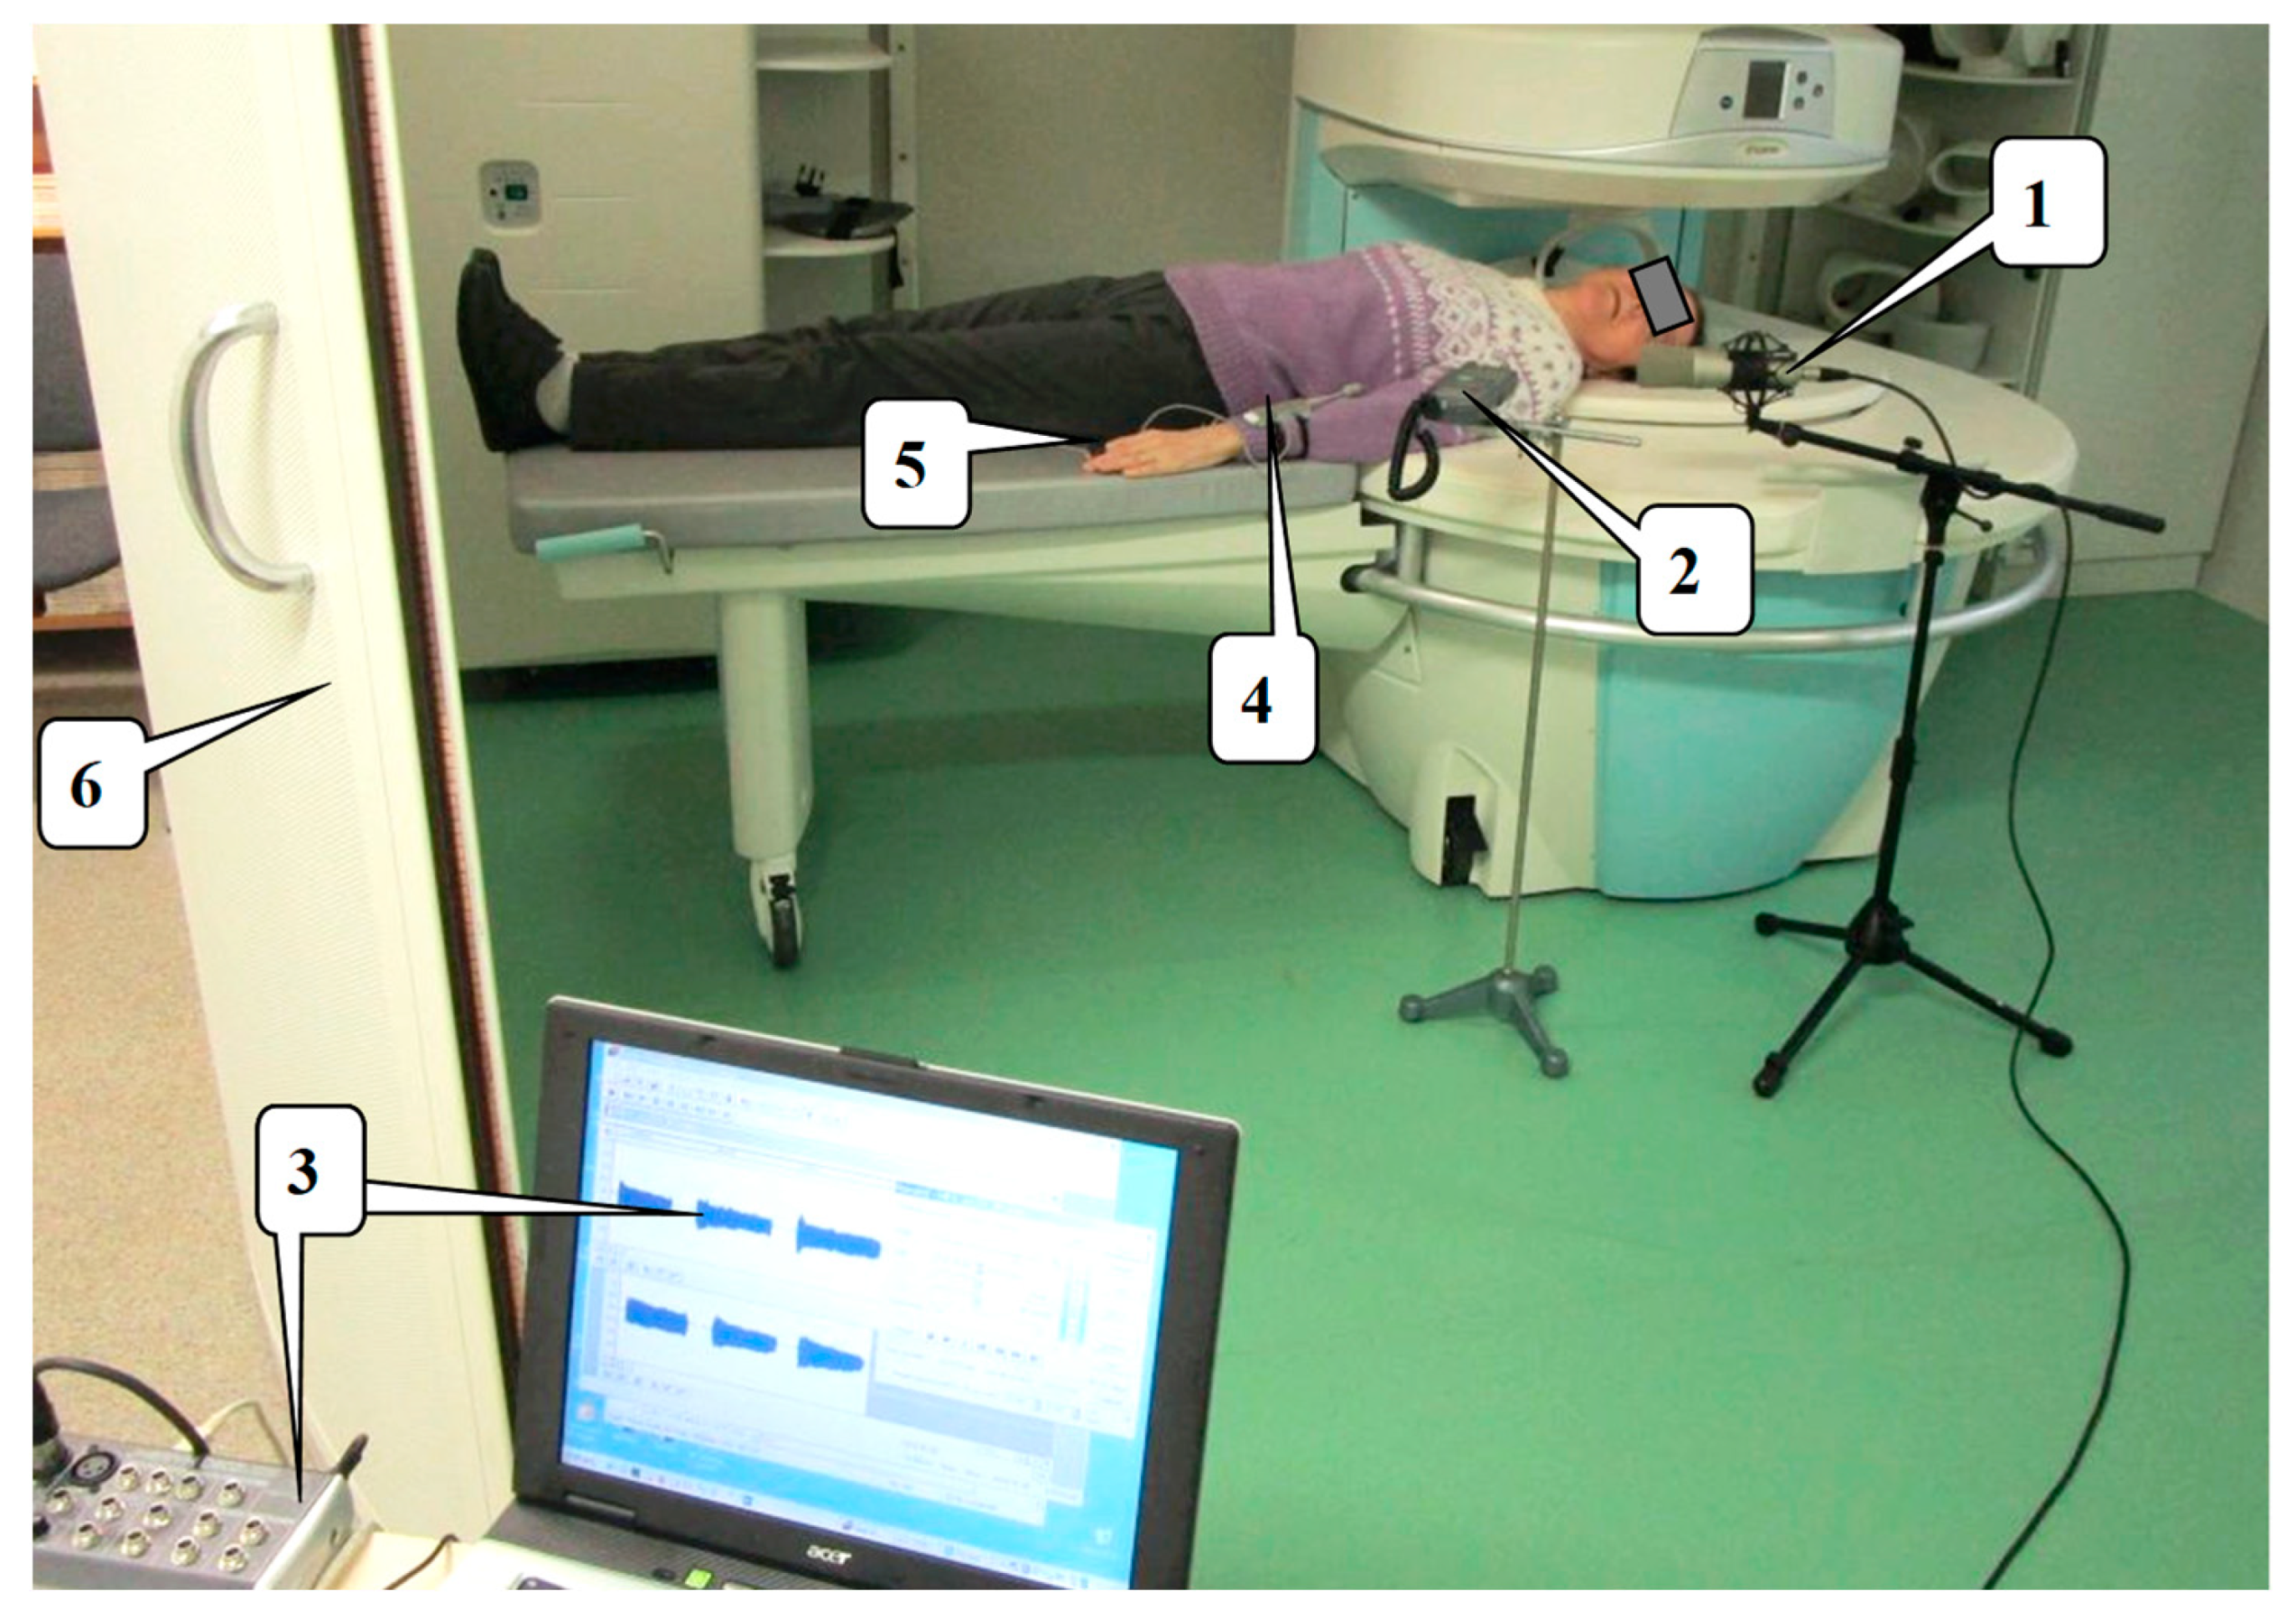
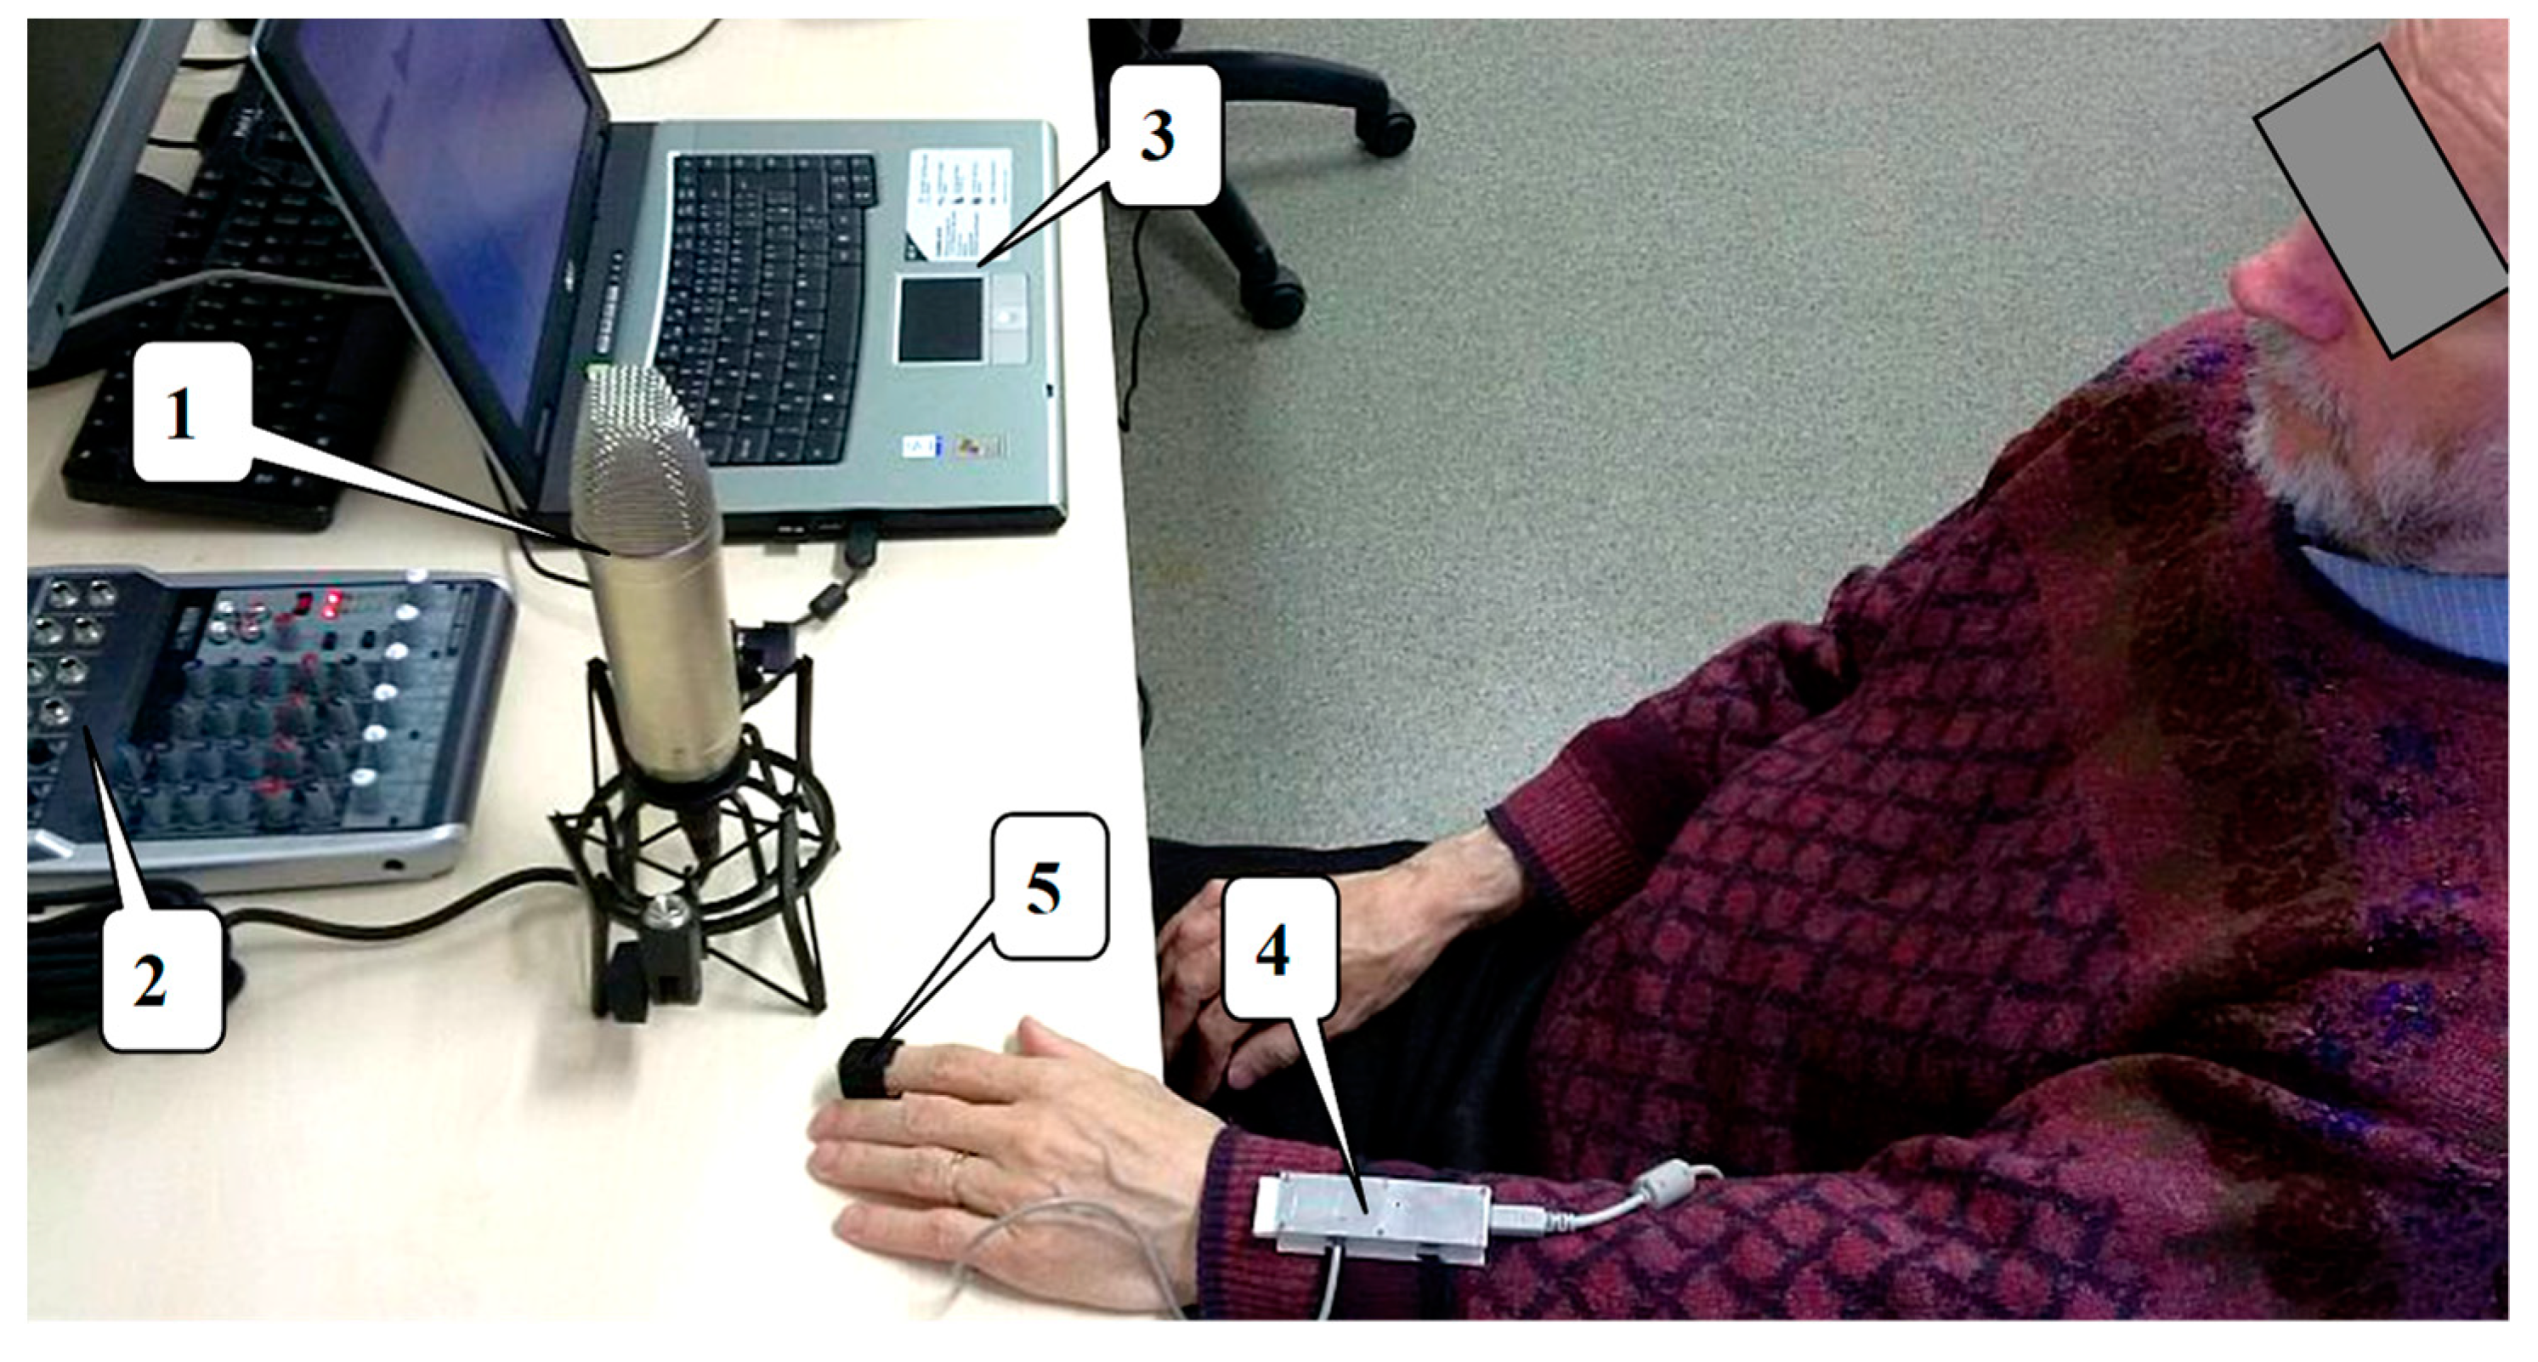
3.2. Used Instrumentation and Recording Arrangement
3.2.1. Phonation Signal Recording
3.2.2. PPG Signal Recording
3.3. Used Databases for GMM-Based Stress Detection and Evaluation in the Phonation Signal
4. Discussion of Obtained Results
5. Conclusions
Author Contributions
Funding
Informed Consent Statement
Acknowledgments
Conflicts of Interest
References
- Steckner, M.C. A review of MRI acoustic noise and its potential impact on patient and worker health. eMagRes 2020, 9, 21–38. [Google Scholar]
- Mainka, A.; Platzek, I.; Mattheus, W.; Fleischer, M.; Müller, A.-S.; Mürbe, D. Three-dimensional vocal tract morphology based on multiple magnetic resonance images is highly reproducible during sustained phonation. J. Voice 2017, 31, 504.e11–504.e20. [Google Scholar] [CrossRef]
- Hansen, J.H.L.; Patil, S. Speech under stress: Analysis, modeling and recognition. In Speaker Classification I, Lecture Notes in Artificial Intelligence; Müller, C., Ed.; Springer: Berlin, Germany, 2007; Volume 4343, pp. 108–137. [Google Scholar]
- Schickhofer, L.; Malinen, J.; Mihaescu, M. Compressible flow simulations of voiced speech using rigid vocal tract geometries acquired by MRI. J. Acoust. Soc. Am. 2019, 145, 2049–2061. [Google Scholar] [CrossRef] [PubMed]
- Pitha, J.; Pithova, P.; Roztocil, K.; Urbaniec, K. Oliva-Roztocil Index, Specific Parameter of Vascular Damage in Women Suffering from Diabetes Mellitus. Atherosclerosis 2017, 263, e275. [Google Scholar] [CrossRef]
- Celka, P.; Charlton, P.H.; Farukh, B.; Chowienczyk, P.; Alastruey, J. Influence of mental stress on the pulse wave features of photoplethysmograms. Healthc. Technol. Lett. 2020, 7, 7–12. [Google Scholar] [CrossRef]
- Rundo, F.; Conoci, S.; Ortis, A.; Battiato, S. An advanced bio-inspired photoplethysmography (PPG) and ECG pattern recognition system for medical assessment. Sensors 2018, 18, 405. [Google Scholar] [CrossRef] [PubMed]
- Allen, J. Photoplethysmography and its application in clinical physiological measurement. Physiol. Meas. 2007, 28, R1–R39. [Google Scholar] [CrossRef] [PubMed]
- Blazek, V.; Venema, B.; Leonhardt, S.; Blazek, P. Customized optoelectronic in-ear sensor approaches for unobtrusive continuous monitoring of cardiorespiratory vital signs. Int. J. Ind. Eng. Manag. 2018, 9, 197–203. [Google Scholar] [CrossRef]
- Charlton, P.H.; Marozas, V. Wearable photoplethysmography devices. In Photoplethysmography: Technology, Signal Analysis and Applications, 1st ed.; Kyriacou, P.A., Allen, J., Eds.; Elsevier: London, UK, 2022; pp. 401–438. [Google Scholar]
- Harmon-Jones, E.; Harmon-Jones, C.; Summerell, E. On the importance of both dimensional and discrete models of emotion. Behav. Sci. 2017, 7, 66. [Google Scholar] [CrossRef]
- Nicolaou, M.A.; Gunes, H.; Pantic, M. Continuous prediction of spontaneous affect from multiple cues and modalities in valence-arousal space. IEEE Trans. Affect. Comput. 2011, 2, 92–105. [Google Scholar] [CrossRef]
- Nwe, T.L.; Foo, S.W.; De Silva, L.C. Speech emotion recognition using hidden Markov models. Speech Commun. 2003, 41, 603–623. [Google Scholar] [CrossRef]
- Campbell, W.M.; Campbell, J.P.; Reynolds, D.A.; Singer, E.; Torres-Carrasquillo, P.A. Support vector machines for speaker and language recognition. Comput. Speech Lang. 2006, 20, 210–229. [Google Scholar] [CrossRef]
- Chandaka, S.; Chatterjee, A.; Munshi, S. Support vector machines employing cross-correlation for emotional speech recognition. Measurement 2009, 42, 611–618. [Google Scholar] [CrossRef]
- Nicholson, J.; Takahashi, K.; Nakatsu, R. Emotion recognition in speech using neural networks. Neural Comput. Appl. 2000, 9, 290–296. [Google Scholar] [CrossRef]
- Jahangir, R.; Teh, Y.W.; Hanif, F.; Mujtaba, G. Deep learning approaches for speech emotion recognition: State of the art and research challenges. Multimed. Tools Appl. 2021, 80, 23745–23812. [Google Scholar] [CrossRef]
- Andrade, G.; Rodrigues, M.; Novais, P. A Survey on the Semi Supervised Learning Paradigm in the Context of Speech Emotion Recognition. Lect. Notes Netw. Syst. 2022, 295, 771–792. [Google Scholar]
- Reynolds, D.A.; Rose, R.C. Robust text-independent speaker identification using Gaussian mixture speaker models. IEEE Trans. Speech Audio Process. 1995, 3, 72–83. [Google Scholar] [CrossRef]
- He, L.; Lech, M.; Maddage, N.C.; Allen, N.B. Study of empirical mode decomposition and spectral analysis for stress and emotion classification in natural speech. Biomed. Signal Process. 2011, 6, 139–146. [Google Scholar] [CrossRef]
- Zhang, G. Quality evaluation of English pronunciation based on artificial emotion recognition and Gaussian mixture model. J. Intell. Fuzzy Syst. 2021, 40, 7085–7095. [Google Scholar]
- Yucesoy, E.; Nabiyev, V. A new approach with score-level fusion for the classification of the speaker age and gender. Comput. Electr. Eng. 2016, 53, 29–39. [Google Scholar] [CrossRef]
- Asbai, N.; Amrouche, A. A novel scores fusion approach applied on speaker verification under noisy environments. Int. J. Speech Technol. 2017, 20, 417–429. [Google Scholar] [CrossRef]
- Al Dujaili, M.J.; Ebrahimi-Moghadam, A.; Fatlawi, A. Speech emotion recognition based on SVM and KNN classifications fusion. Int. J. Electr. Comput. Eng. 2021, 11, 1259–1264. [Google Scholar] [CrossRef]
- Araño, K.A.; Orsenigo, C.; Soto, M.; Vercellis, C. Multimodal sentiment and emotion recognition in hyperbolic space. Expert Syst. Appl. 2021, 184, 115507. [Google Scholar] [CrossRef]
- Přibil, J.; Přibilová, A.; Frollo, I. Experiment with stress detection in phonation signal recorded in open-air MRI device. In Proceedings of the 44th International Conference on Telecommunications and Signal Processing, TSP 2021, Virtual, 26–28 July 2021; pp. 38–41. [Google Scholar]
- Prince, D.L.; De Wilde, J.P.; Papadaki, A.M.; Curran, J.S.; Kitney, R.I. Investigation of acoustic noise on 15 MRI scanners from 0.2 T to 3 T. J. Magn. Reson. Imaging 2001, 13, 288–293. [Google Scholar] [CrossRef]
- Moelker, A.; Wielopolski, P.A.; Pattynama, P.M.T. Relationship between magnetic field strength and magnetic-resonance-related acoustic noise levels. Magn. Reson. Mater. Phys. Biol. Med. 2003, 16, 52–55. [Google Scholar] [CrossRef]
- Přibil, J.; Přibilová, A.; Frollo, I. Analysis of the influence of different settings of scan sequence parameters on vibration and voice generated in the open-air MRI scanning area. Sensors 2019, 19, 4198. [Google Scholar] [CrossRef] [PubMed]
- Přibil, J.; Přibilová, A.; Frollo, I. First-step PPG signal analysis for evaluation of stress induced during scanning in the open-air MRI device. Sensors 2020, 20, 3532. [Google Scholar] [CrossRef] [PubMed]
- Sigmund, M. Influence of psychological stress on formant structure of vowels. Elektron. Elektrotech 2012, 18, 45–48. [Google Scholar] [CrossRef][Green Version]
- Tomba, K.; Dumoulin, J.; Mugellini, E.; Khaled, O.A.; Hawila, S. Stress detection through speech analysis. In Proceedings of the 15th International Joint Conference on e-Business and Telecommunications, ICETE 2018, Porto, Portugal, 26–28 July 2018; pp. 394–398. [Google Scholar]
- Shah, N.H. Numerical Methods with C++ Programming; Prentice-Hall of India Learning Private Limited: New Delhi, India, 2009; p. 251. [Google Scholar]
- Korpas, D.; Halek, J.; Dolezal, L. Parameters Describing the Pulse Wave. Physiol. Res. 2009, 58, 473–479. [Google Scholar] [CrossRef]
- Oliva, I.; Roztocil, K. Toe Pulse Wave Analysis in Obliterating Atherosclerosis. Angiology 1983, 34, 610–619. [Google Scholar] [CrossRef] [PubMed]
- E-Scan Opera. Image Quality and Sequences Manual; 830023522 Rev. A; Esaote S.p.A.: Genoa, Italy, 2008. [Google Scholar]
- Jarchi, D.; Salvi, D.; Tarassenko, L.; Clifton, D.A. Validation of instantaneous respiratory rate using reflectance PPG from different body positions. Sensors 2018, 18, 3705. [Google Scholar] [CrossRef] [PubMed]
- Přibil, J.; Přibilová, A.; Frollo, I. Wearable PPG Sensor with Bluetooth Data Transmission for Continual Measurement in Low Magnetic Field Environment. In Proceedings of the 26th International Conference Applied Electronics 2021, Pilsen, Czech Republic, 7–8 September 2021; pp. 137–140. [Google Scholar]
- Pulse Sensor Amped Product (Adafruit 1093): World Famous Electronics LLC. Ecommerce Getting Starter Guide. Available online: https://pulsesensor.com/pages/code-and-guide (accessed on 16 July 2020).
- Bradley, M.M.; Lang, P.J. The International Affective Digitized Sounds (2nd Edition; IADS-2): Affective Ratings of Sounds and Instruction Manual; Technical Report B-3; University of Florida: Gainesville, FL, USA, 2007. [Google Scholar]
- Burkhardt, F.; Paeschke, A.; Rolfes, M.; Sendlmeier, W.; Weiss, B.A. Database of German emotional speech. In Proceedings of the Interspeech 2005, Lisbon, Portugal, 4–8 September 2005; pp. 1517–1520. [Google Scholar]
- Busso, C.; Parthasarathy, S.; Burmania, A.; AbdelWahab, M.; Sadoughi, N.; Provost, E.M. MSP-IMPROV: An acted corpus of dyadic interactions to study emotion perception. IEEE Trans. Affect. Comput. 2017, 8, 67–80. [Google Scholar] [CrossRef]
- Hansen, J.H.; Bou-Ghazale, S.E.; Sarikaya, R.; Pellom, B. Getting started with SUSAS: A speech under simulated and actual stress database. In Proceedings of the Eurospeech 1997, Rhodes, Greece, 22–25 September 1997; pp. 1743–1746. [Google Scholar]
- Sigmund, M. Introducing the database ExamStress for speech under stress. In Proceedings of the NORSIG 2006, Reykjavik, Iceland, 7–9 June 2006; pp. 290–293. [Google Scholar]


| Parameter | Stressed State | Normal Condition |
|---|---|---|
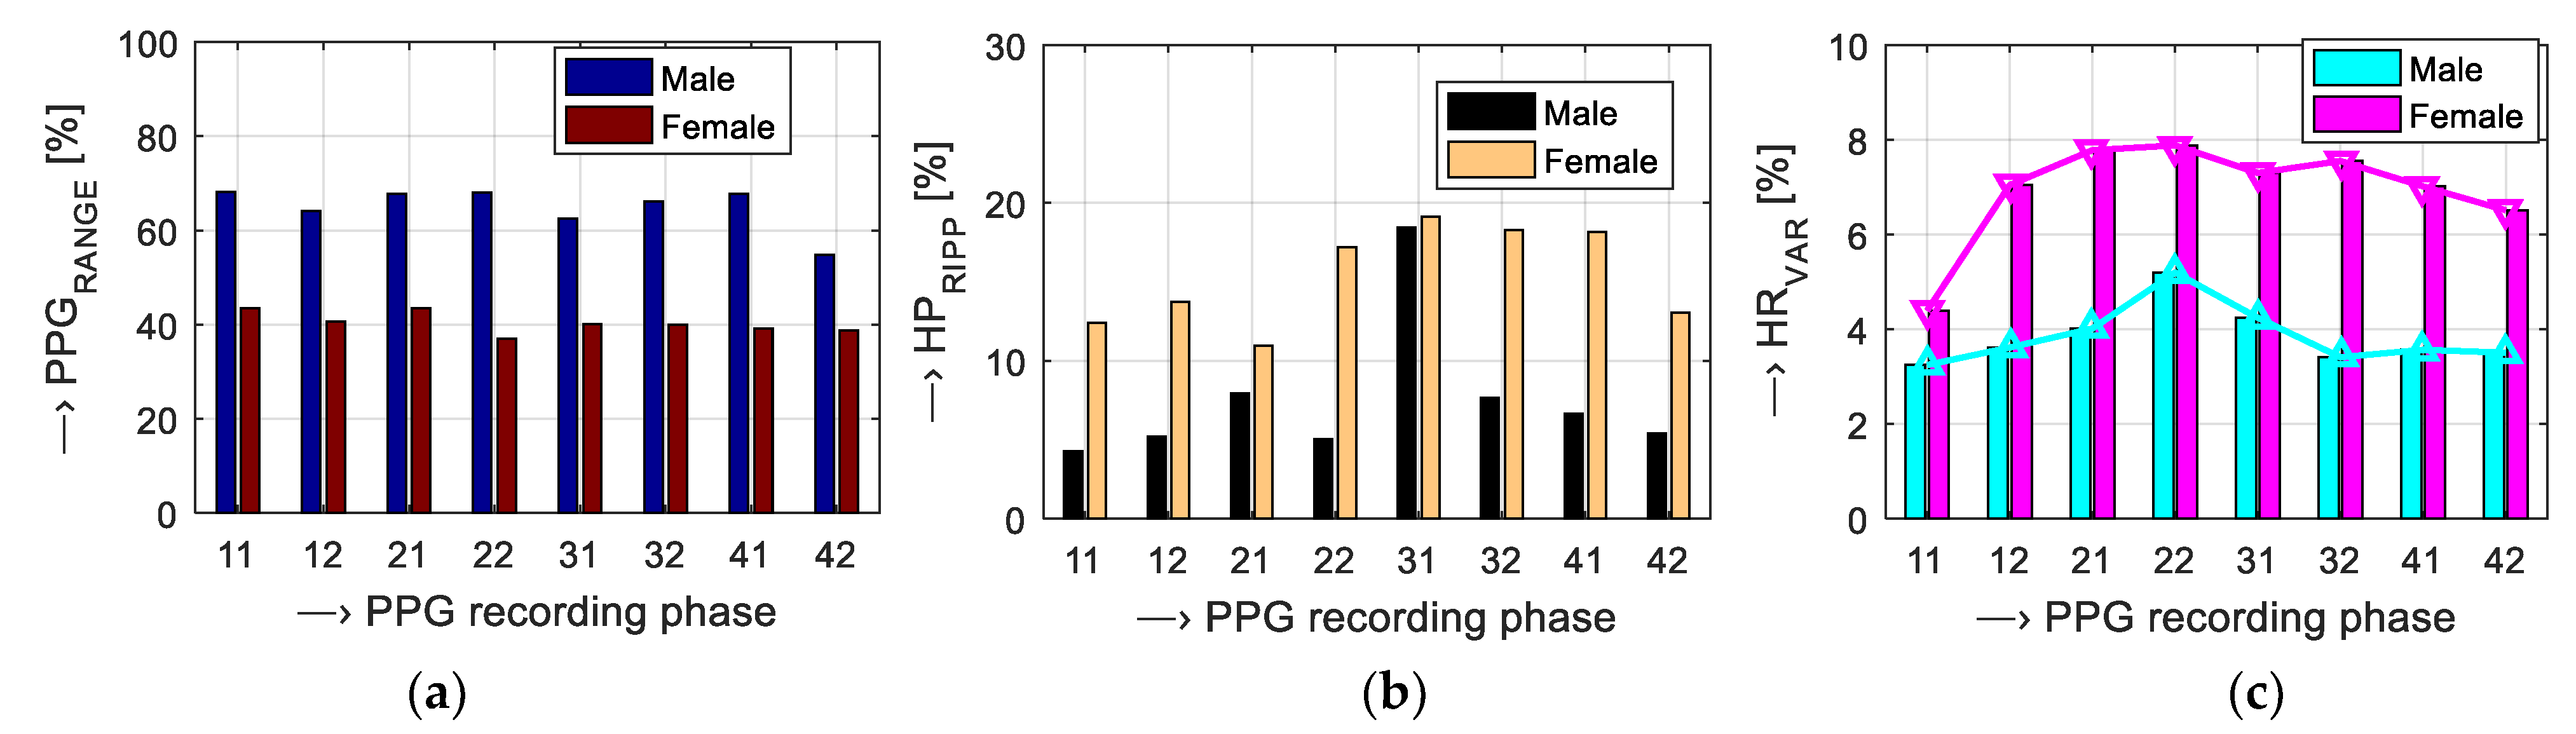
| PPGRANGE [%] | Increase | Decrease or constant |
| HPRIPP [%] | Increase | Decrease |
| HRφ REL [%] | Higher positive (+) | Negative (–) or small |
| HRVAR [%] | Higher | Smaller |
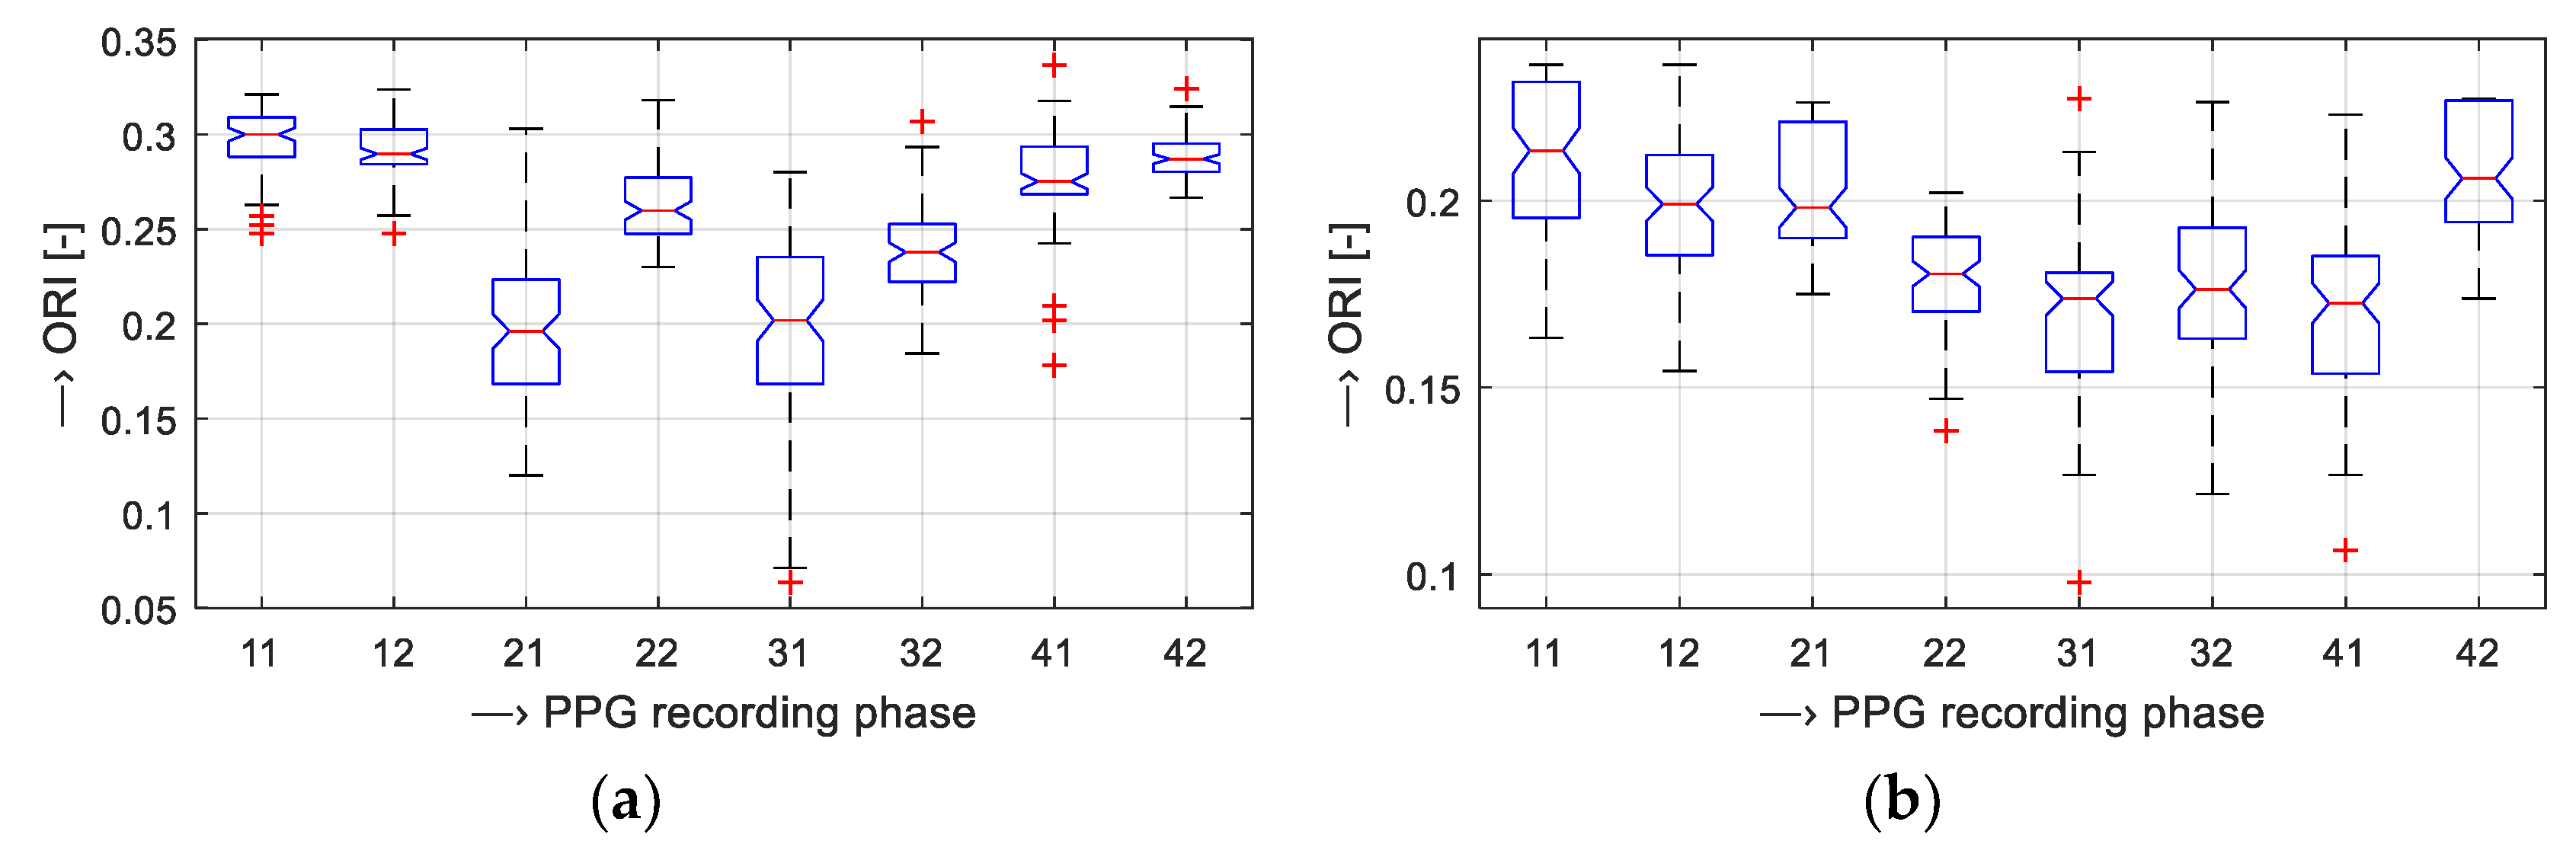
| ORIREL [%] | Smaller | Higher |
| Parameter No. | Phonation Type | Weight [-] | PPG Type | Weight [-] |
|---|---|---|---|---|
| 1 | LSTRESS | wGMM1 = 0.75 | PPGRANGE | wPPG1 = 0.25 |
| 2 | LNORMAL | wGMM2 = −0.5 | HPRIPP | wPPG2 = 0.5 |
| 3 | ΔLS-N | wGMM3 = 0.25 | HRφREL | wPPG3 = 0.5 |
| 4 | – | – | HRVAR | wPPG4 = 0.75 |
| 5 | – | – | ORIREL | wPPG5 = −1 |
| Parameter/Person | M1 | M2 | M3 | M4 | F1 | F2 | F3 | F4 |
|---|---|---|---|---|---|---|---|---|
| Age (years) | 59 | 53 | 42 | 36 | 59 | 20 | 30 | 58 |
| BMI (kg/m2) | 24.9 | 22.2 | 22.5 | 23.1 | 18.3 | 21.8 | 19.0 | 21.2 |
| Emotion | Pleasure Range/Mean | Arousal Range/Mean | Emotion Location in the P-A Space |
|---|---|---|---|
| Anger 2 | (1.0~ 3.0)/2.40 | (6.0~8.0)/6.04 |  |
| Disgust 2 | (3.0~4.5)/3.50 | (4.5~6.5)/5.73 | |
| Fear 2 | (1.5~3.5)/2.97 | (4.0~6.5)/5.72 | |
| Sadness 3 | (2.0~3.5)/3.04 | (3.0~5.0)/3.88 | |
| Neutral 1 | (4.0~6.0)/5.14 | (2.5~4.5)/3.45 | |
| Surprise 1 | (4.5~7.0)/5.67 | (4.5~7.0)/4.81 | |
| Joy 3 | (7.0~9.0)/8.44 | (4.5~8.0)/5.88 |
| Database Type | LSTRESS [%] 1 (MF2,3,4) | LNORMAL [%] 1 (MF2,3,4) | ΔLS-N [%] 1 (MF2,3,4) |
|---|---|---|---|
| DB1 (sounds-IADS-2) | 8.09, 11.2, −2.09 | −29.6, −38.9, 4.41 | 37.7, 50.1, −6.51 |
| DB2 (speech-Emo-DB) | 56.6, 75.2, −9.76 | −2.88, 13.9, 14.60 | 53.7, 89.1, 4.87 |
| DB3 (speech-MSP-IMPROV) | 15.4, 20.2, 2.23 | −30.3, −36.6, 0.08 | 45.7, 56.7, 2.15 |
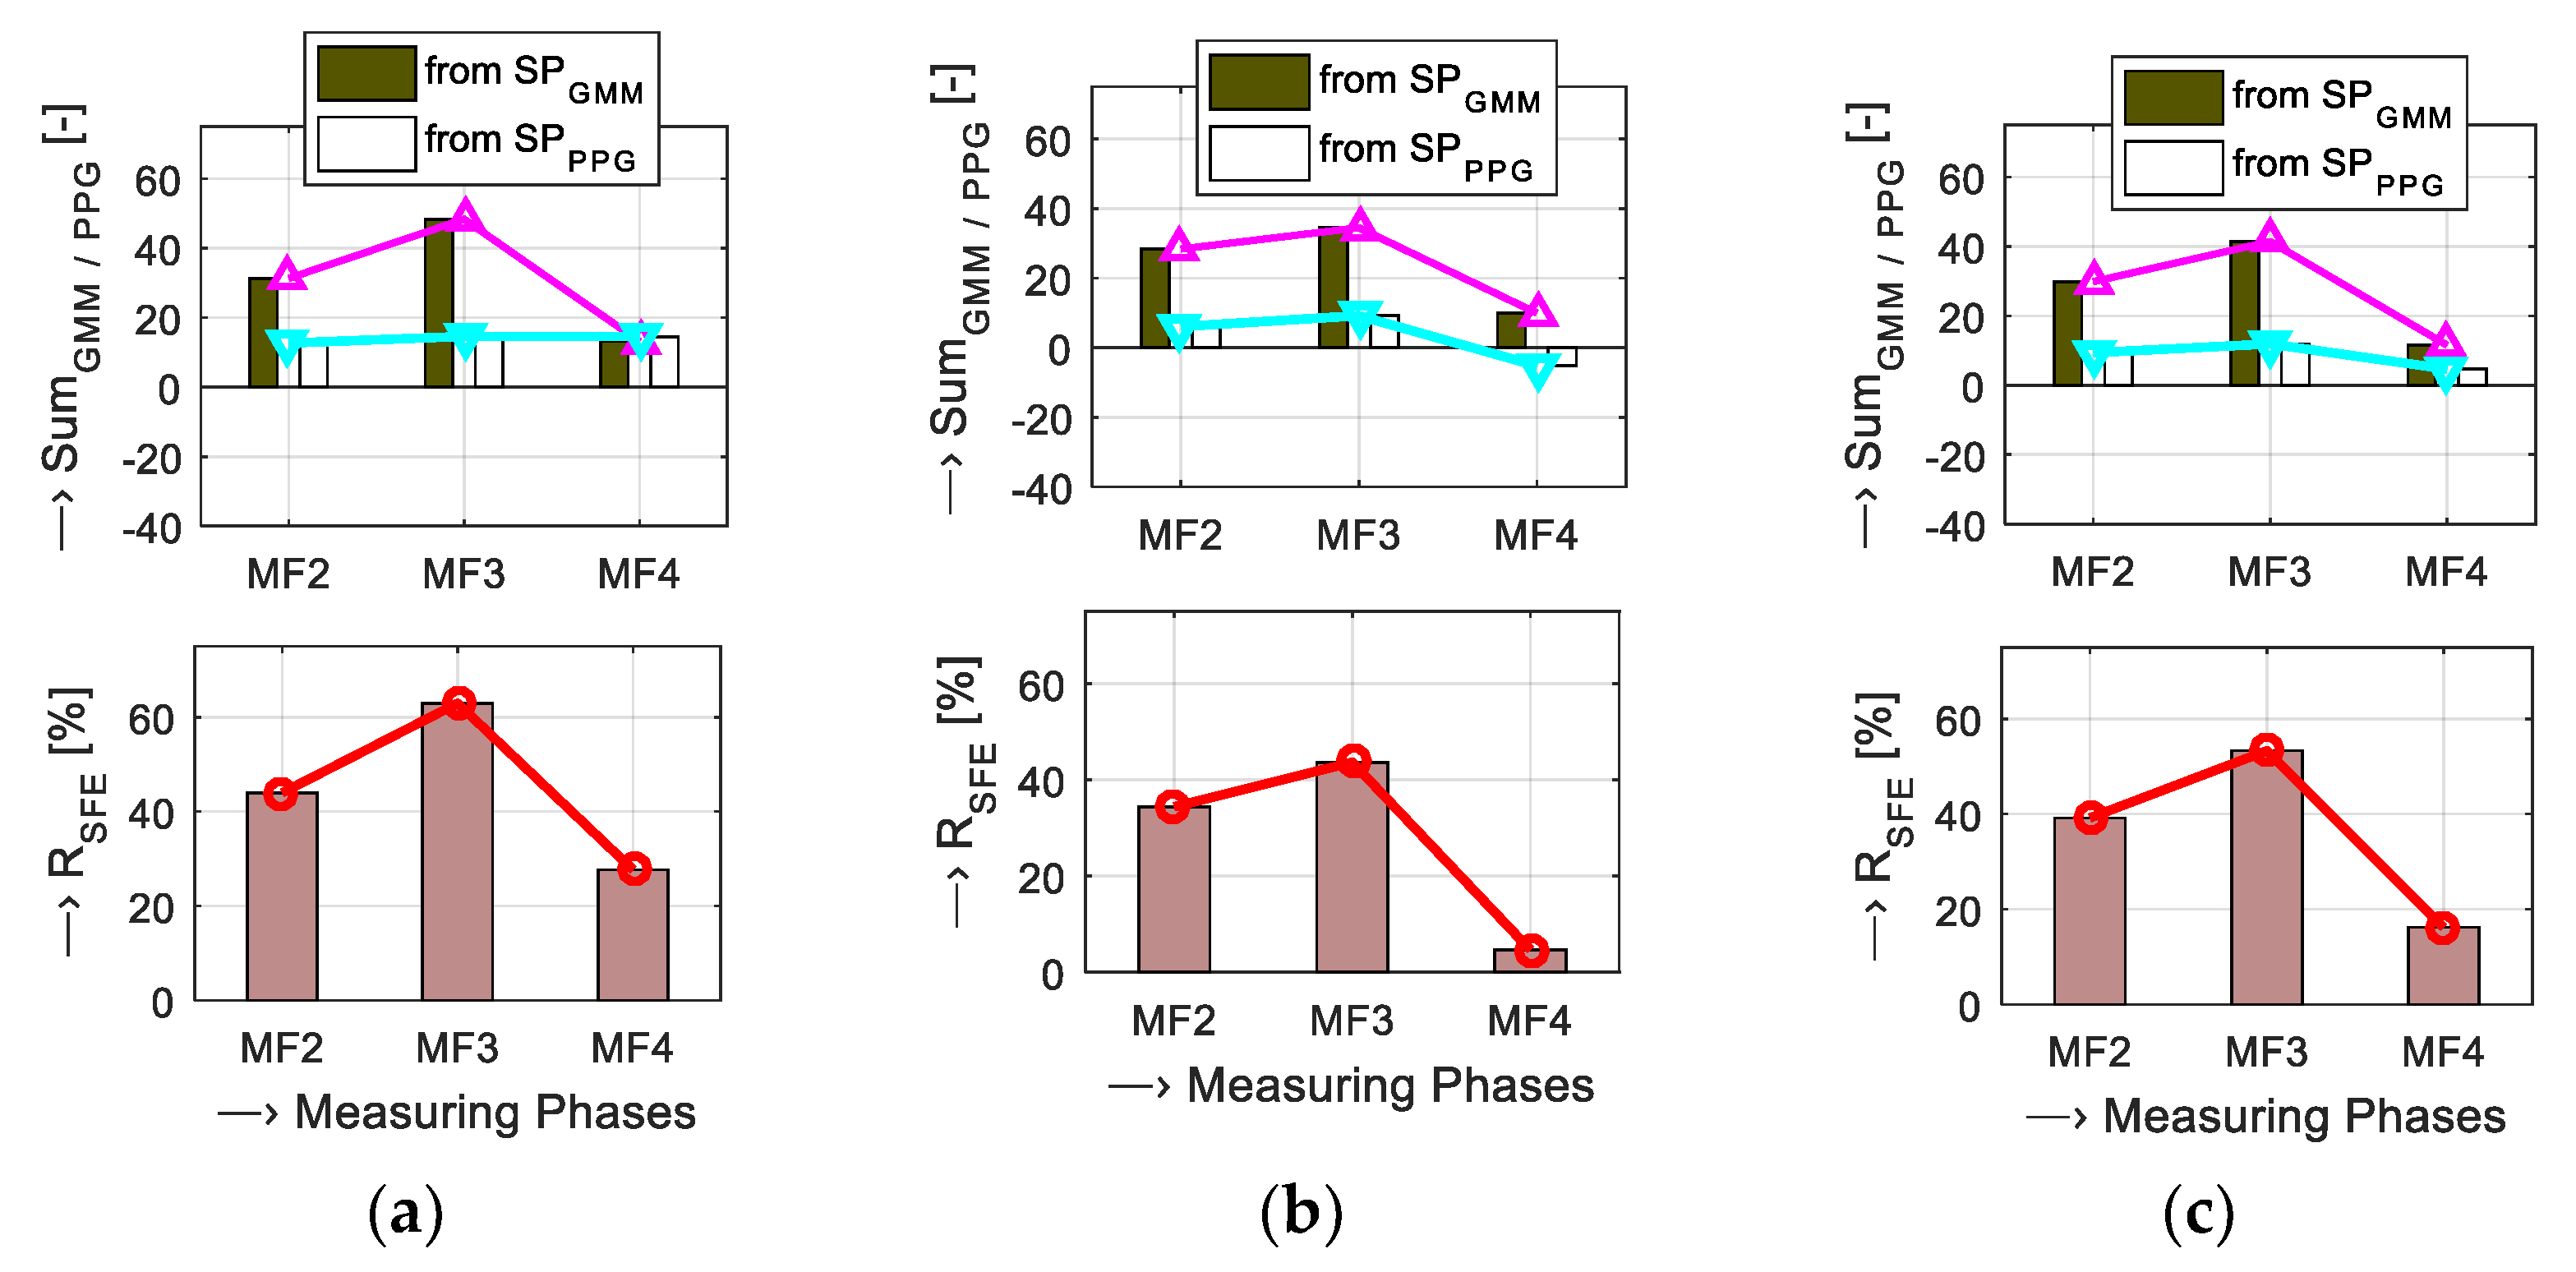
| Parameter Type | SPGMM/PPG (MF2,3,4) | Partial Sum (MF2,3,4) | Final RSFE (MF2,3,4) | |
|---|---|---|---|---|
| SPGMM1 | 8.1, 11.2, −2.1 |  | ||
| SPGMM2 | −29.6, −38.9, 1.4 | 30.3, 40.4, −3.4 | ||
| SPGMM3 | 37.7, 50.1 −4.5 | |||
| SPPPG1 | 7.3, −1.8, −4.8 | 27.1, 54.2, 8.8 | ||
| SPPPG2 | −1.9, 1.8, −5.7 | |||
| SPPPG3 | 4.4, −14.7, −5.5 | −3.2, 13.8, 12.2 | ||
| SPPPG4 | 1.2, 0.4, 0.1 | |||
| SPPPG5 | 6.8, −20.5, −18.9 |
Publisher’s Note: MDPI stays neutral with regard to jurisdictional claims in published maps and institutional affiliations. |
© 2021 by the authors. Licensee MDPI, Basel, Switzerland. This article is an open access article distributed under the terms and conditions of the Creative Commons Attribution (CC BY) license (https://creativecommons.org/licenses/by/4.0/).
Share and Cite
Přibil, J.; Přibilová, A.; Frollo, I. Stress Level Detection and Evaluation from Phonation and PPG Signals Recorded in an Open-Air MRI Device. Appl. Sci. 2021, 11, 11748. https://doi.org/10.3390/app112411748
Přibil J, Přibilová A, Frollo I. Stress Level Detection and Evaluation from Phonation and PPG Signals Recorded in an Open-Air MRI Device. Applied Sciences. 2021; 11(24):11748. https://doi.org/10.3390/app112411748
Chicago/Turabian StylePřibil, Jiří, Anna Přibilová, and Ivan Frollo. 2021. "Stress Level Detection and Evaluation from Phonation and PPG Signals Recorded in an Open-Air MRI Device" Applied Sciences 11, no. 24: 11748. https://doi.org/10.3390/app112411748
APA StylePřibil, J., Přibilová, A., & Frollo, I. (2021). Stress Level Detection and Evaluation from Phonation and PPG Signals Recorded in an Open-Air MRI Device. Applied Sciences, 11(24), 11748. https://doi.org/10.3390/app112411748