Article

Preparation and Properties of CO2 Micro-Nanobubble Water Based on Response Surface Methodology

1
College of Information and Electrical Engineering, China Agricultural University, Beijing 100083, China
2
Key Laboratory of Agricultural Information Standardization, Ministry of Agriculture and Rural Affairs, Beijing 100083, China
3
School of Computer Science and Engineering, Beijing Technology and Business University, Beijing 100048, China
4
National Engineering Laboratory for Agriproduct Quality Traceability, Beijing Technology and Business University, Beijing 100048, China
*
Authors to whom correspondence should be addressed.
Appl. Sci. 2021, 11(24), 11638; https://doi.org/10.3390/app112411638
Submission received: 26 October 2021 / Revised: 1 December 2021 / Accepted: 1 December 2021 / Published: 8 December 2021
(This article belongs to the Special Issue Nanotechnology in Agriculture: New Opportunities and Perspectives)

Abstract

:

Featured Application

This article discusses the preparation of CO2 micro-nanobubble water using the dissolved gas release method. Taking the CO2 content as the optimization target, micro-nanobubble water was prepared with the optimal content based on a mathematical model constructed using the response surface method. Meanwhile, the characteristics of the micro-nanobubbles in the water provided a theoretical reference for applying CO2 in agriculture, which will assist in achieving a quantitative increase in the CO2 enrichment of crops.

Abstract

Carbon dioxide (CO2) enrichment in an agricultural environment has been shown to enhance the efficiency of crop photosynthesis, increasing crop yield and product quality. There is a problem of the excessive use of CO2 gas when the CO2 is enriched for crops, such as soybean and other field crops. Given the application of micro-nanobubbles (MNBs) in agricultural production, this research takes CO2 as the gas source to prepare the micro-nanobubble water by the dissolved gas release method, and the response surface methodology is used to optimize the preparation process. The results show that the optimum parameters, which are the gas–liquid ratio, generator running time, and inlet water temperature for the preparation of CO2 micro-nanobubble water, are 2.87%, 28.47 min, and 25.52 °C, respectively. The CO2 content in the MNB water prepared under the optimum parameters is 7.64 mg/L, and the pH is 4.08. Furthermore, the particle size of the bubbles is mostly 255.5 nm. With the extension of the storage time, some of the bubbles polymerize and spill out, but there is still a certain amount of nanoscale bubbles during a certain period. This research provides a new idea for using MNB technology to increase the content and lifespan of CO2 in water, which will slow the release and increase the utilization of CO2 when using CO2 enrichment in agriculture.

1. Introduction

CO2 is the primary substrate for photosynthesis, and it plays an essential role in crop growth, development, and productivity. Using an anthropogenic method to increase the CO2 concentration in an enclosed greenhouse called CO2 fertilization [1,2] increases the growth and yield of the crop plants [3]. As an essential gas fertilizer, CO2 has been widely used in greenhouses for the last century [4,5]. Because of the characteristics of CO2 diffusion, CO2 fertilizer has mainly been used in protected cultivation facilities. However, many research findings have indicated that elevated CO2 concentrations have appropriate positive effects on field crops such as soybeans, rice, and maize [6,7,8]. Ainsworth et al. [9] summarized the results of the published observations 30 years under free-air CO2 enrichment (FACE), which indicate that long-term CO2 enrichment has different impacts between the C3 and C4 crops. There is an urgent need to conduct studies on the implementation of CO2 enrichment for field crops in open fields.
Micro-nanobubbles (MNBs) are bubbles with sizes smaller than 50 μm, giving them diameters between those of microbubbles and nanobubbles (NBs) [10]. In comparison to normal bubbles, MNBs have many specific characteristics, such as a long storage time, strong gas solubility, strong adsorption [11], a relatively large specific surface area, and a large pressure [12,13]. In recent years, MNBs have been of great value in water treatment, medical and health care, precision chemical reactions, and agricultural activities [14,15,16,17]. Ahmed et al. [18] reported that air, oxygen (O2), nitrogen (N2), and CO2 could be used as reactive oxygen species (ROS) in nanobubbles and influence seed germination and plant growth. In addition, the oxygation by air and the O2 MNBs in water, which can increase the oxygen content, have been shown to increase the yield and quality of crops, as well as the irrigation water use efficiency [19,20]. Zhang et al. [21] conducted contrast tests to prove that water with CO2 MNBs and air MNBs could positively impact vegetable growth. However, the formation mechanism and propensity of CO2 MNBs in water remain unclear.
Therefore, this work presents the preparation process and characteristics of CO2 MNB water, in which CO2 is injected into a generator by utilizing the dissolved gas release method to produce large amounts of CO2 MNBs. The influences of the vapor–liquid ratio, MNB generator running time, and water temperature on the CO2 content in the MNB water were studied. Primarily, the optimization experiments were conducted to obtain the optimal range of CO2 in the MNB water. Additional research was conducted on the particle size distribution, pH changes, life cycle, and content changes of the CO2 MNB water, which will assist in better understanding the CO2 MNB water.

2. Materials and Methods

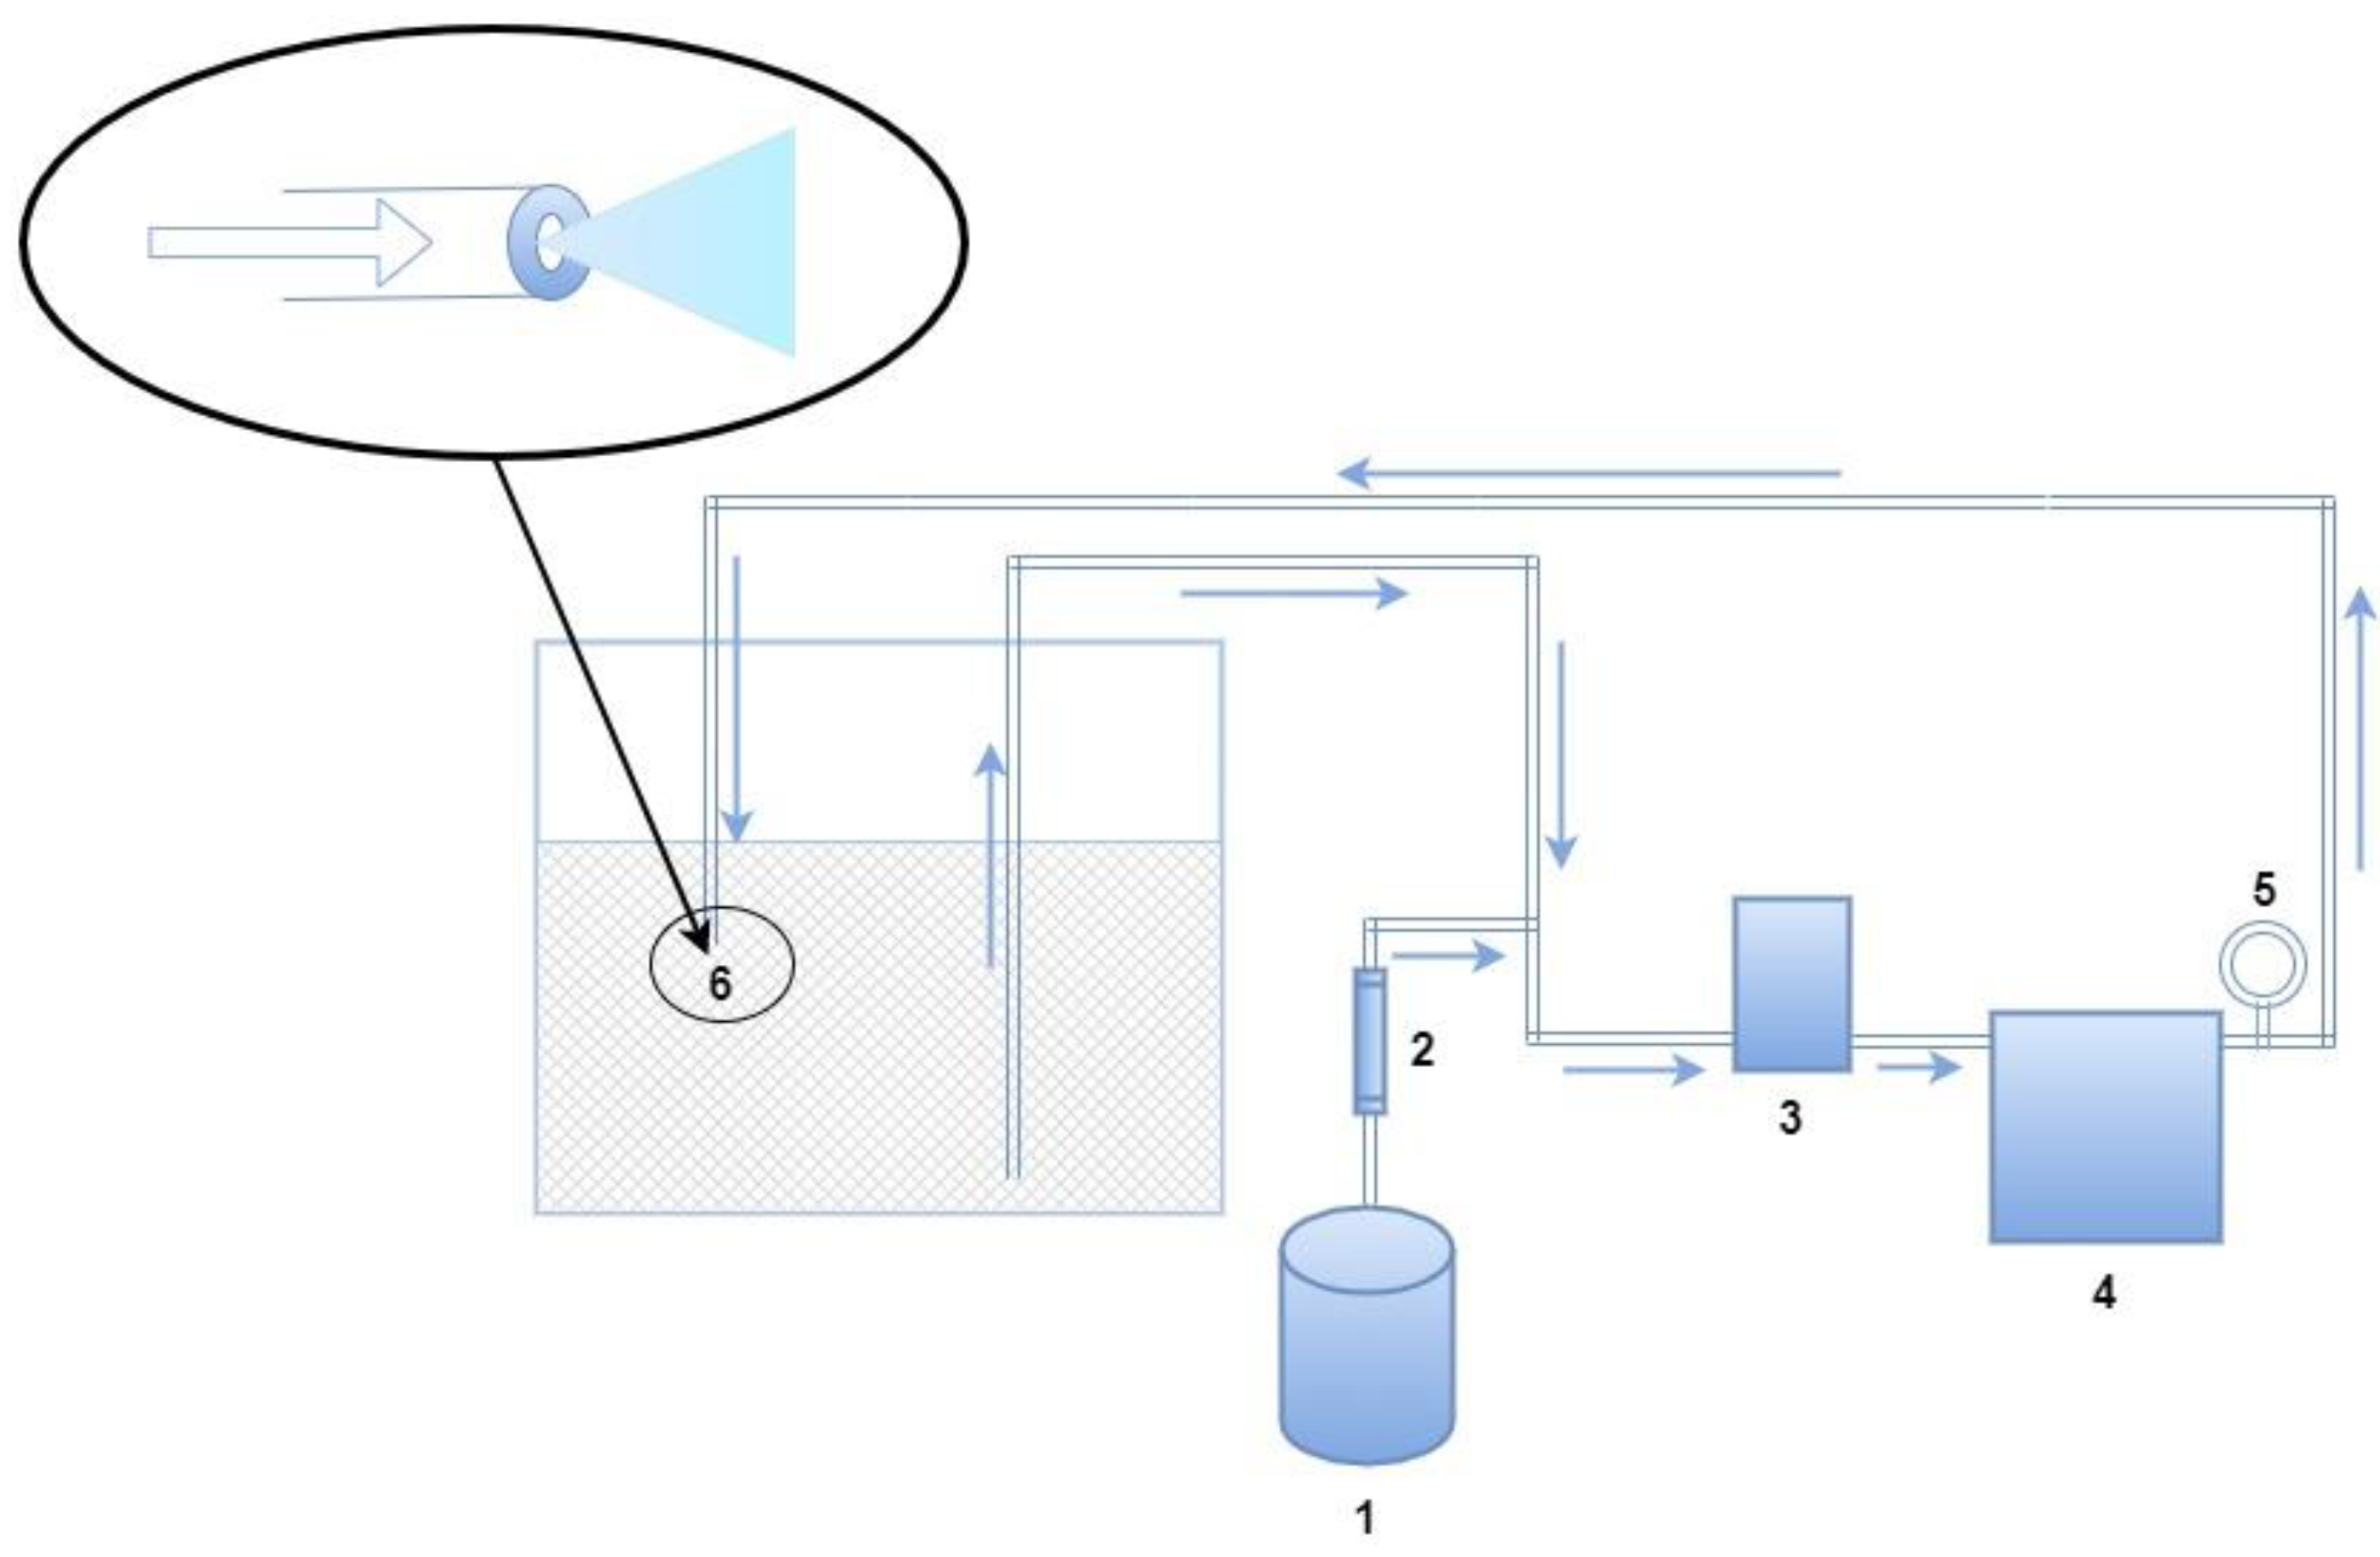
2.1. Experiment Material and Equipment

The MNBs were produced using a self-suction MNB generator developed by Hangzhou Xiyue New Material Technology Co., Ltd. (Hangzhou, China). This MNB generator is based on the principle of adding pressure to dissolve a gas and then releasing the pressure to release the gas (the dissolved gas release method). More specific details of this principle are shown in Figure 1.
This device comprises a high-pressure pump, dissolved gas cylinder, throttle-type releaser, gas flow meter, pressure gauge, etc. The MNB generator uses a high-pressure self-priming air pump and gas flow meter to control the gas flow. When the gas reaches the high-pressure pump impeller, the impeller first mechanically breaks up the gas to form tiny bubbles. The large gas bubbles dissolve in the water in the dissolved gas cylinder because of the high back pressure developed by the throttle-type releaser hole. Finally, when passing through the throttle-type releaser, the gas dissolved in the water is released in large amounts as a result of the increased flow velocity and sudden decrease in pressure, forming the MNBs.
In this study, the source of the gas was a CO2 cylinder connected to the generator. The other experimental materials and reagents and the main instruments used for the data measurement are listed in Table 1 and Table 2, respectively.

2.2. Experiment Design and Methods

2.2.1. Single-Factor Experiment on CO2 MNB Water Preparation

In this experiment, the CO2 MNB water was prepared using the dissolved gas release method. The effects of the gas–liquid ratio (v/v, %), generator running time (min), and inlet water temperature (°C) on the content of the CO2 gas in the MNB water were found to determine the optimal MNB water preparation technique.
(1)
Impact of Gas–liquid Ratio on CO2 Content
When preparing the CO2 MNB water, the MNB generator running time (30 min) and inlet water temperature (25 °C) were made constant. At the same time, the gas-liquid ratio (v/v, %) was adjusted to values of 1.3%, 2%, 2.7%, 3.4%, and 4.1%. The best CO2 gas–liquid ratio was determined based on the CO2 content measured by the carbon dioxide meter.
(2)
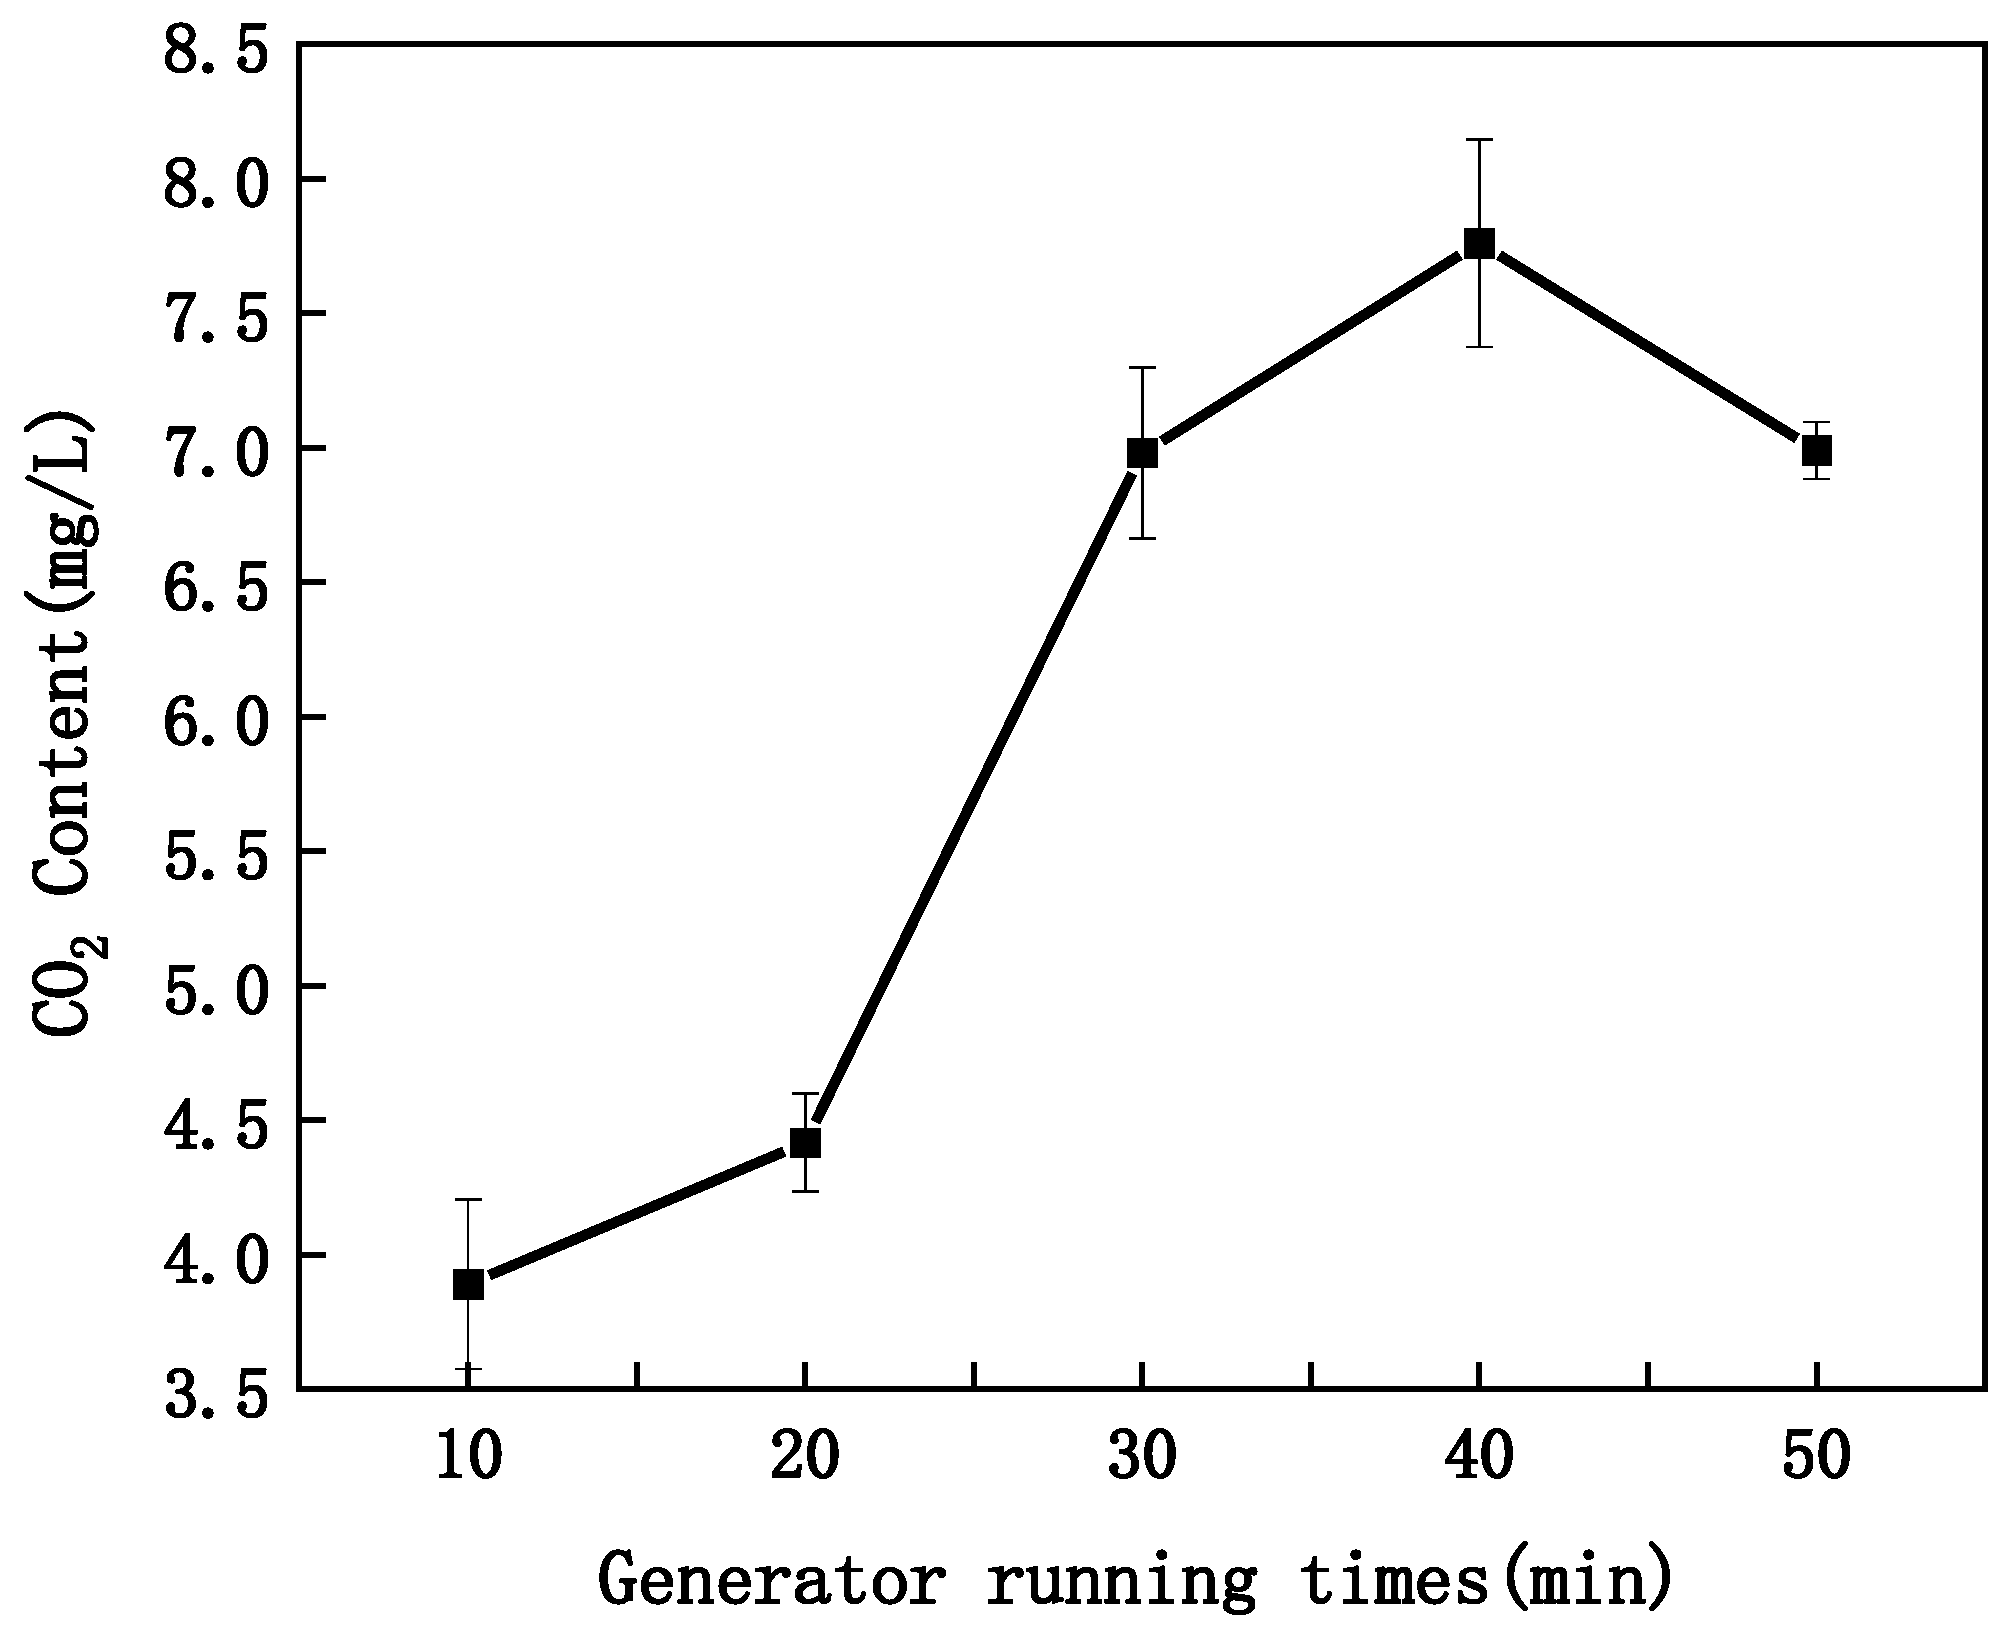
Impact of Equipment Running Time on CO2 Content
By fixing the gas–liquid ratio (2.7%) of the MNB generator and inlet water temperature (25 °C), the CO2 contents of the MNB water were measured for generator running times of 10, 20, 30, 40, and 50 min, and used to define the optimal range of generator running times.
(3)
Impact of Inlet Temperature of Water on CO2 Content
By fixing the generator running time and gas–liquid ratio at 30 min and 2.7%, respectively, the CO2 contents of the MNB water with different inlet temperatures (25, 30, 35, 40, and 45 °C) were measured to define the optimal range of inlet water temperatures.

2.2.2. Optimal CO2 MNB Water Preparation Based on Response Surface Methodology

Based on the single-factor experimental results, the gas–liquid ratio (%, A), generator running time (min, B), and inlet water temperature (°C, C) were selected as independent variables, and the CO2 content of the MNB water was the dependent variable. Design-Expert software was used for a three-level Box–Behnken experimental design (BBD) [22] with three factors to optimize the response values (mg/L, R). The design factor levels are listed in Table 3.

2.2.3. Measurement of CO2 Content in MNB Water

(1)
Standard Solution Preparation
The standard solution 1 (0.2 M NaCl + 0.01 M NaHCO3) was prepared by first weighing 1.68 g of NaHCO3 and 11.69 g of NaCl, and they were then added to purified water not containing CO2 to obtain a constant volume of 1000 mL.
Standard solution 2 (0.2 M NaCl + 0.002 M NaHCO3) was prepared by weighing 10.52 g of NaCl, mixing it into 100 mL of standard solution 1, and using purified water not containing CO2 to dilute it to obtain 1000 mL.
(2)
Standard Sample Calibration
First, 50 mL of standard solution 1 was transferred to a flask, and five drops of phosphoric acid were added. While mixing at 300 rpm, the carbon dioxide measuring device was used to calibrate standard solution 1. Standard solution 2 was calibrated using a similar procedure.
(3)
Sample Measurement
The sample being tested was placed on the magnetic stirrer. At a moderate mixing speed, the calibrated electrode was used for measurements. The measured value was recorded as the concentration of CO2 in the sample being tested.

2.2.4. Characterization of CO2 MNB Water

(1)
Particle Size and Distribution of CO2 MNBs Based on Dissolved Gas Release Method
In this experiment, the CO2 MNB water was prepared under the optimal preparation parameters based on the response surface methodology. It used dynamic light scattering (DLS, Zetasizer Nano ZS, Malvern), performed at a scattering angle of 173°, and a temperature of 25 °C to analyze the size and distribution of the MNBs in the test sample. The refractive index of the material was fixed at 1 to correspond to air, and the refractive index of the water was 1.33 [23,24]. All the samples were analyzed in triplicate, and the results were averaged.
(2)
Stability of CO2 MNBs
The stability of the CO2 MNBs was measured based on the changes in the CO2 content of the MNB water. In this experiment, 2 L of CO2 MNB water was prepared under the optimal preparation parameters based on the response surface methodology. Then, the lid was opened, it was left for 48 h at room temperature, and the CO2 content was measured every 4 h. The average results of the multiple measurements were used to reduce the error in the experiment and finally obtain the variation curve for the CO2 in the MNB water.
(3)
pH of CO2 MNB Water
When preparing CO2 MNB water under the optimal preparation parameters based on the response surface methodology, the pH value of CO2 MNB water was measured every 3 min during the generator running time. Measurements of the samples were performed five times, and the average value was obtained. The variation curve for the pH of the MNB water under the optimal preparation conditions could present the property of CO2 MNB water.

2.3. Statistical Analysis

The results of the single-factor experiments for researching the properties of CO2 MNBs were used in Origin 2021b for the plot analysis of the experimental data. We used Design-Expert 8.0.6 to design the orthogonal experiment, along with ANOVA analyses and drew an interactive three-dimensional surface plot and contour diagram of the responses and input variables [25].

3. Results and Discussion

3.1. Single-Factor Experimental Result Analysis

(1)
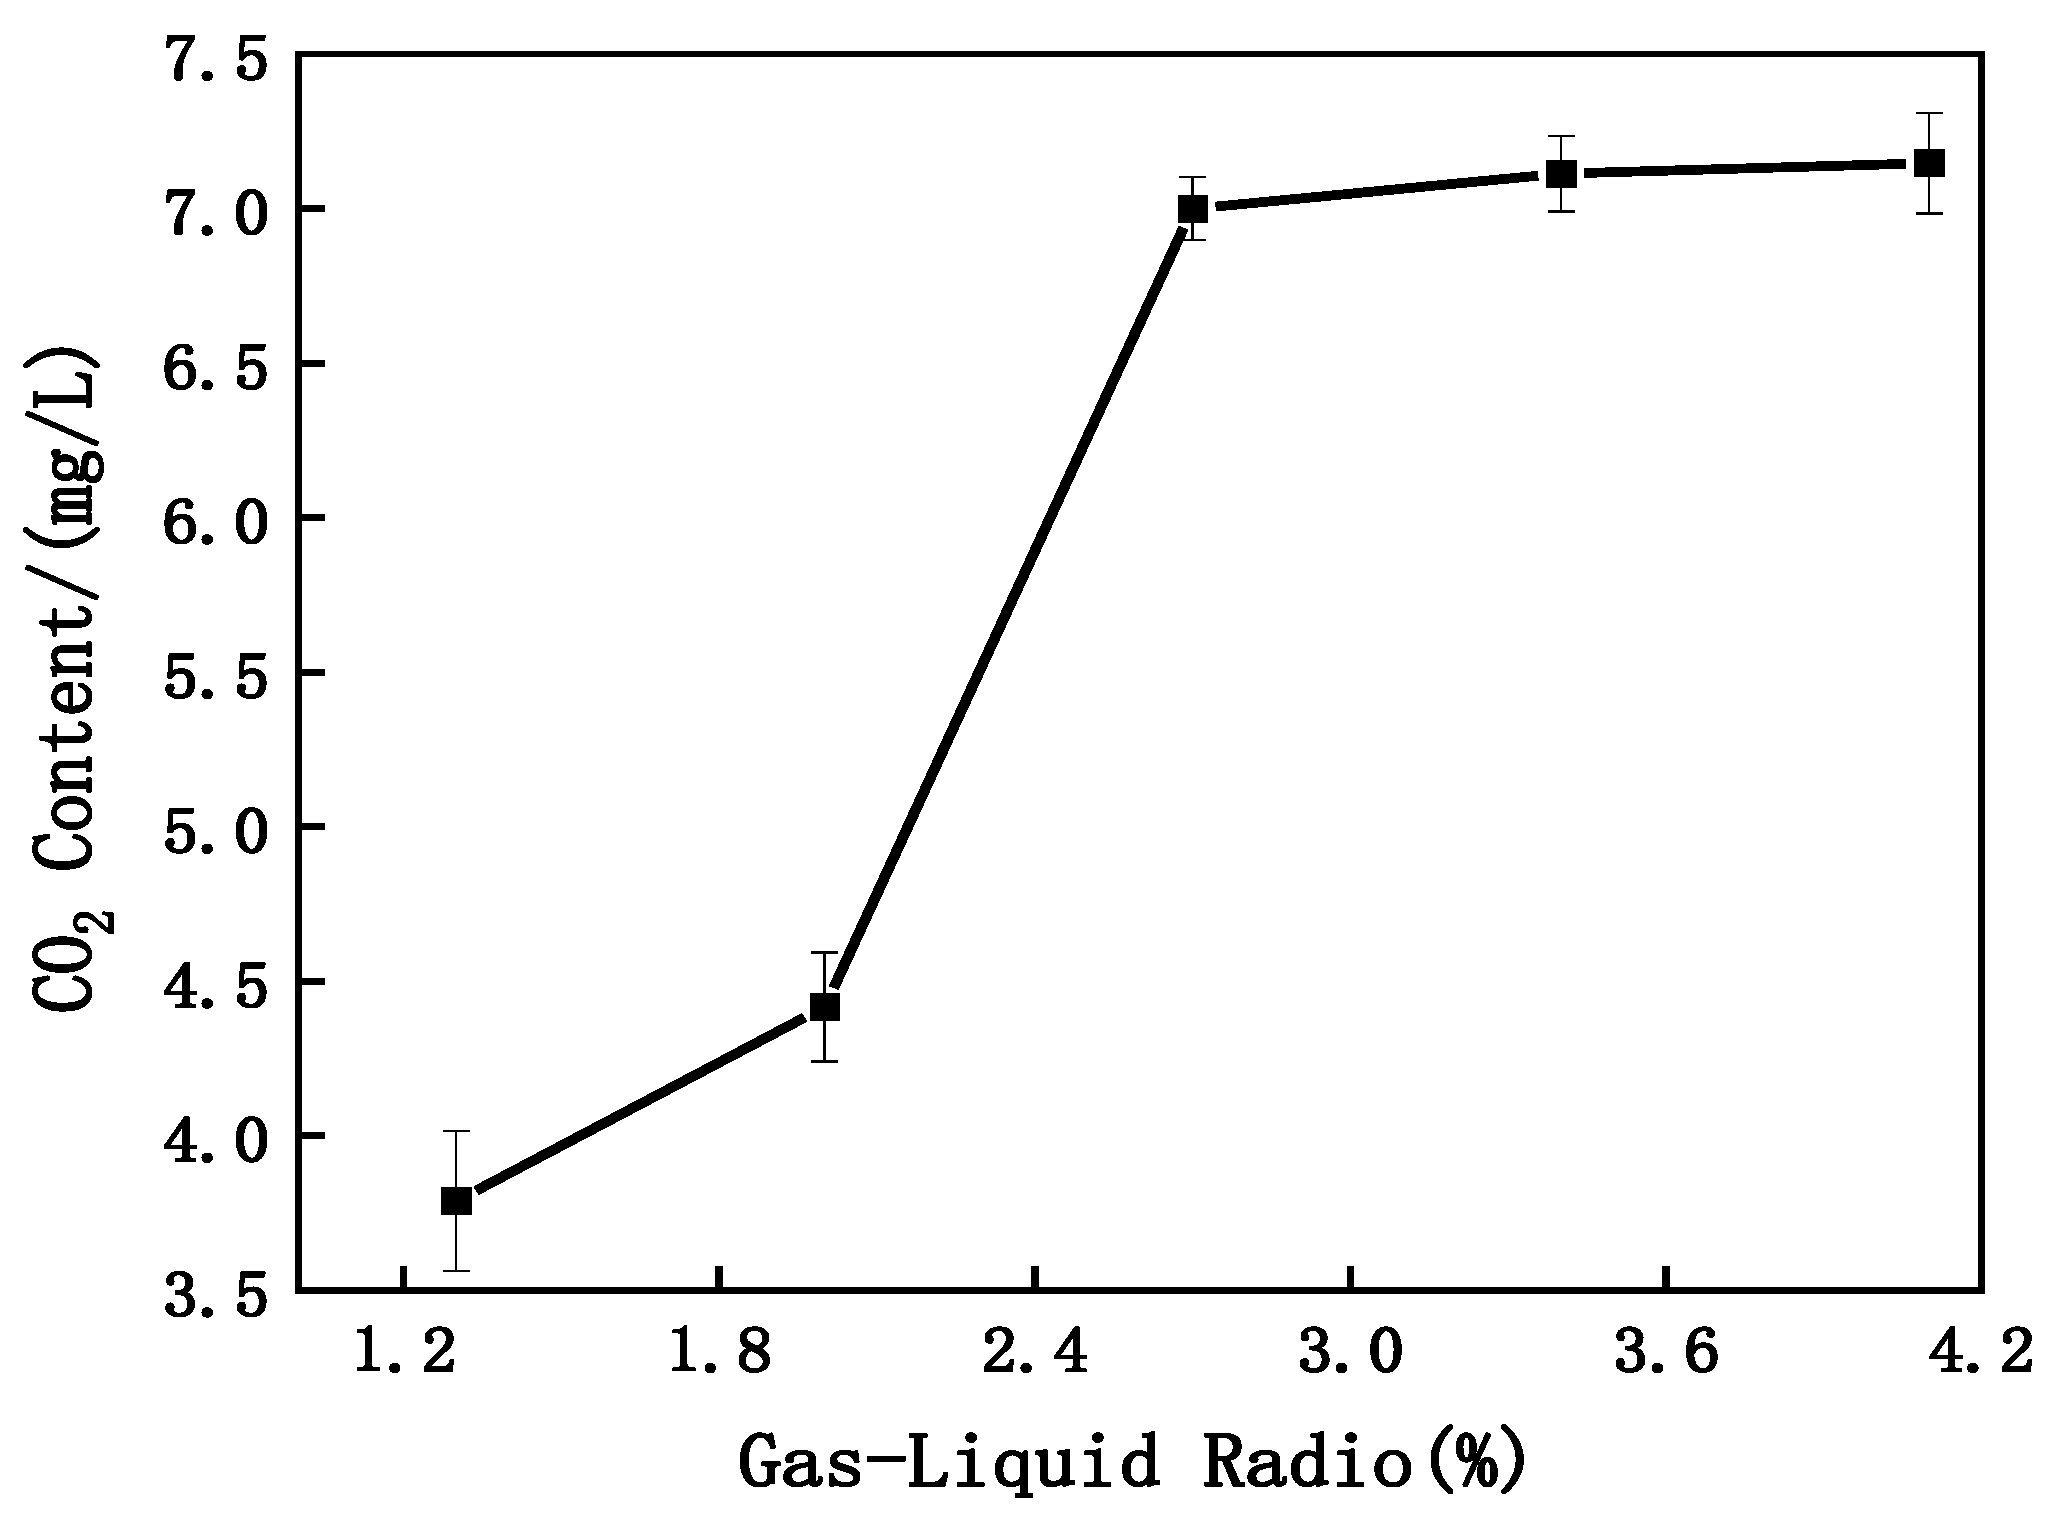
Analysis of Gas–Liquid Ratio Effect on CO2 Concentration in MNB Water
Figure 2 shows the change curve for the CO2 content in the MNB water under different gas–liquid ratios. As shown in Figure 2, the CO2 content in the MNB water gradually increased with the gas–liquid ratio. The CO2 content in the MNB water tended to be stable when the gas–liquid ratio reached 2.7%, which showed that the CO2 in the water has reached the saturation level.
(2)
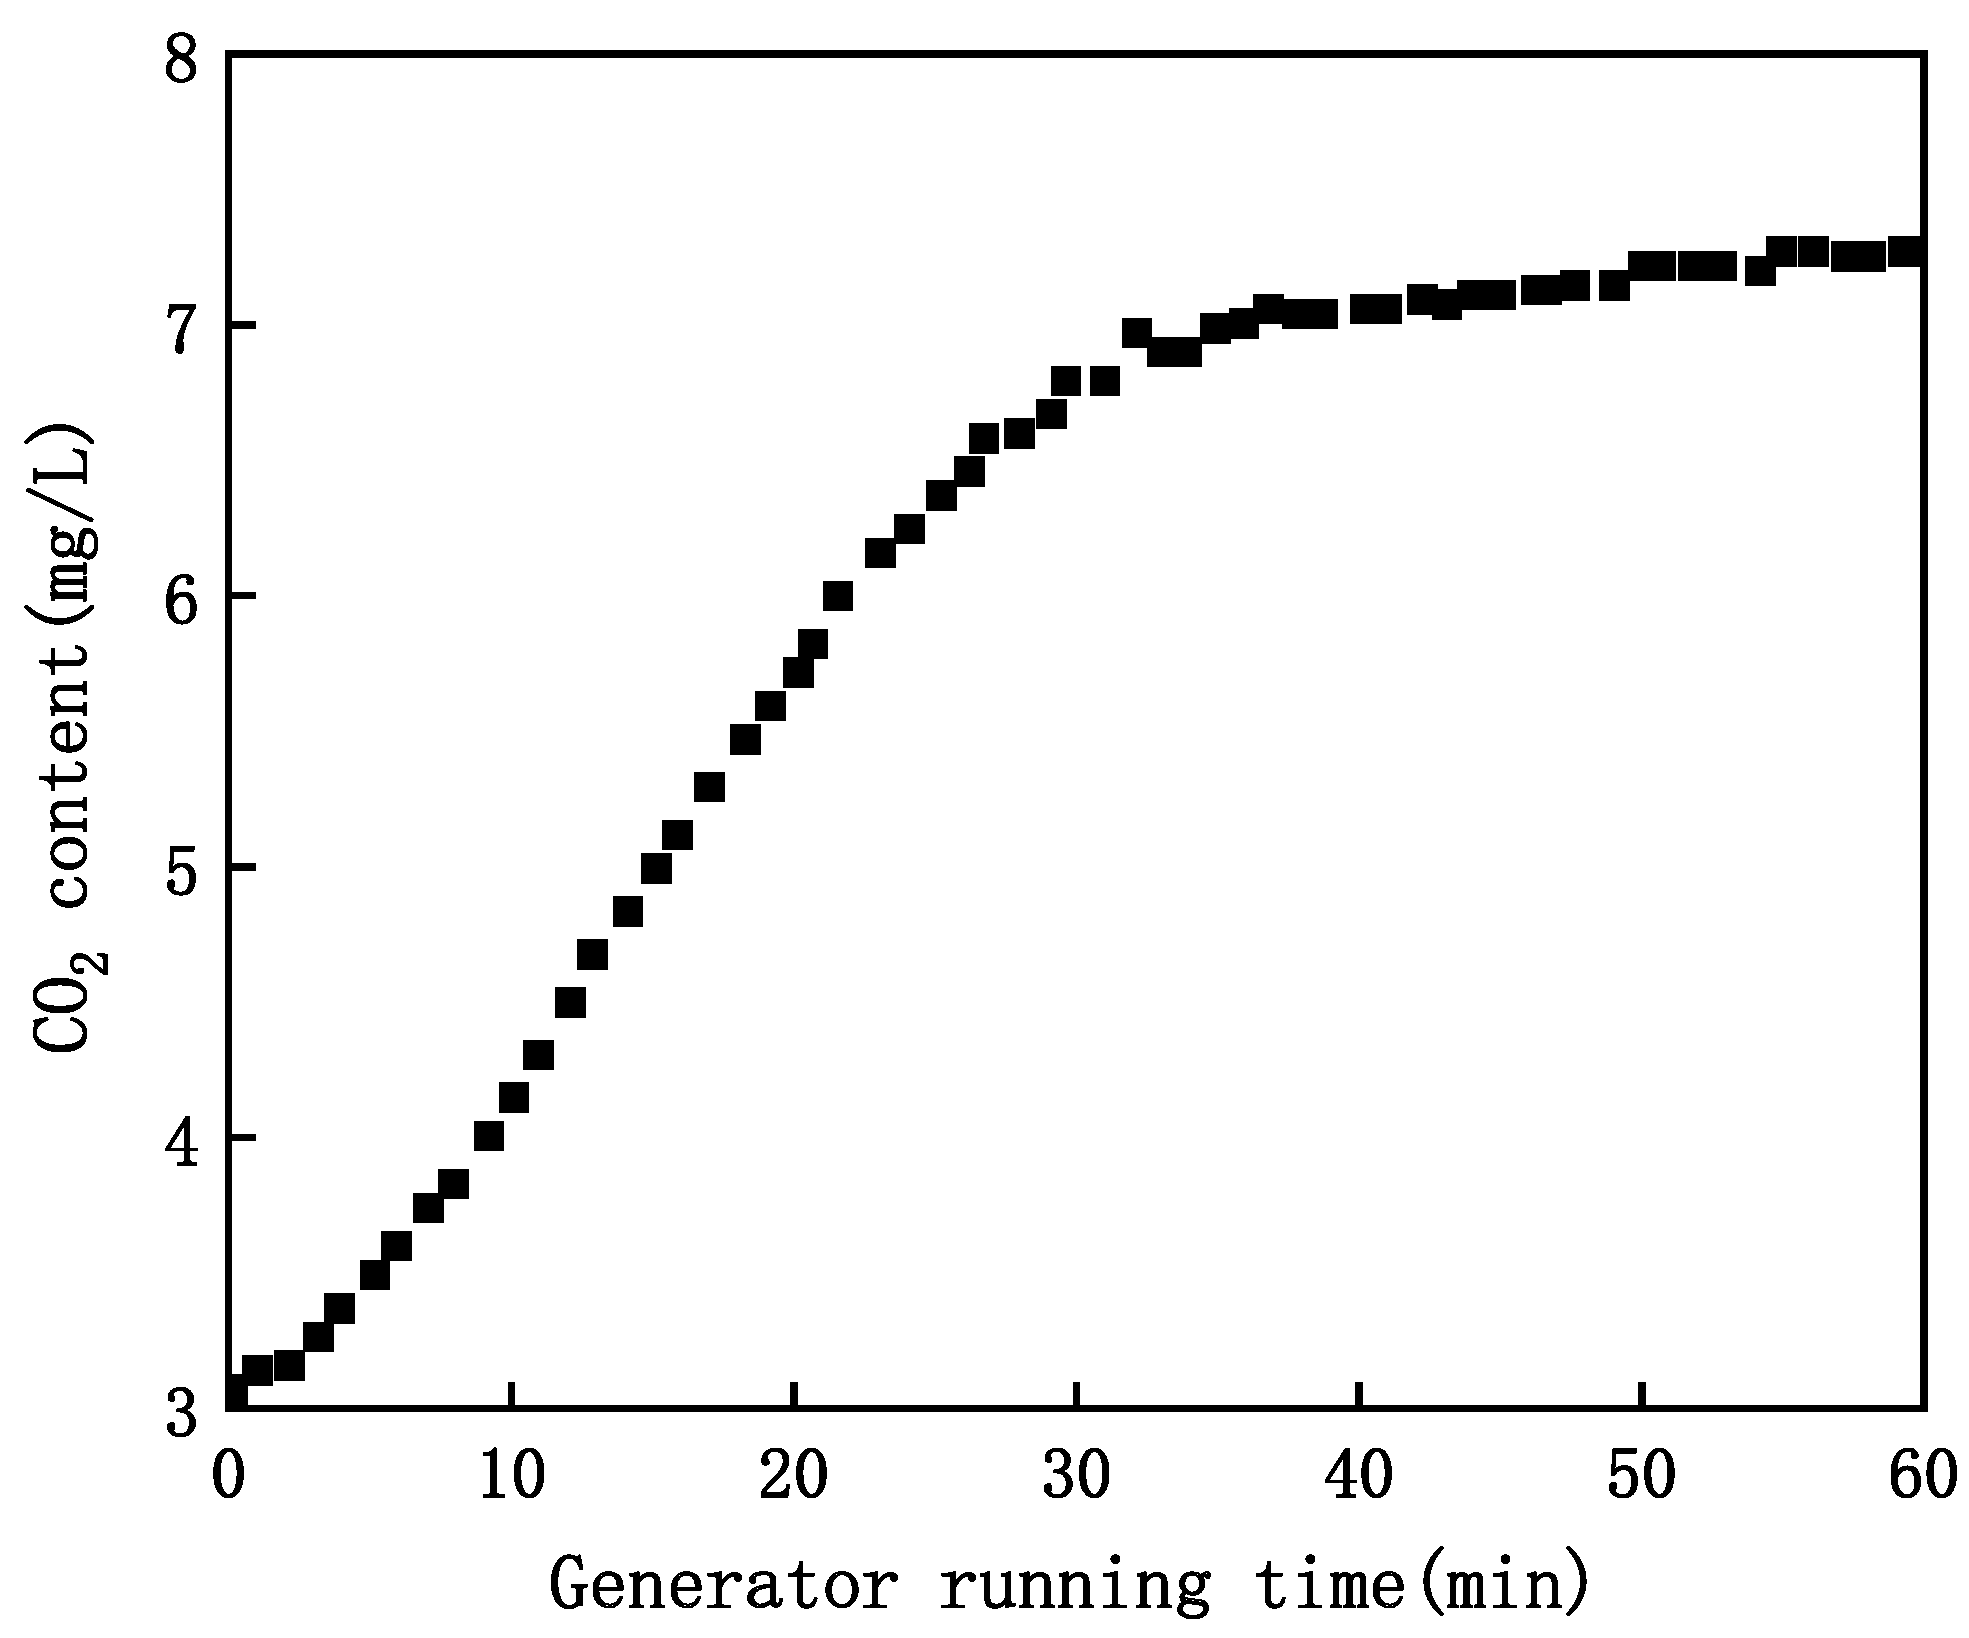
Impact of Generator Running Time on CO2 content in MNB Water
As the running time of the generator increased, the quantity of CO2 MNBs in the reaction vessel gradually increased, which became a suspension of the CO2 MNBs. Therefore, the generator cycle running time is an essential factor influencing the CO2 content in the MNB water. Figure 3 shows the resulting change in the CO2 content in the MNB water under a fixed gas–liquid ratio and inlet water temperature. The results show that the CO2 content gradually increased with the generator cycle running time. In particular, the trend of the changes in the CO2 content became smaller when the time reached 30 min. When the running time was 40 min, the CO2 content was at its maximum value and subsequently decreased as a result of some MNBs bursting and escaping from the water. Therefore, the optimal cycle running time for CO2 MNB water is 30–40 min. The experimental results are shown in Figure 3.
(3)
Impact of Inlet Water Temperature on CO2 MNB content
The solubility of gas has an impact on the gas–liquid equilibrium balance inside the reaction vessel. Furthermore, temperature is an important factor influencing gas solubility [26,27]. As a result, an investigation of the effect of the inlet water temperature was required. Figure 4 depicts the effect of the inlet water temperature on the CO2 content of the MNB water. The amount of CO2 dissolved in the water gradually decreased as the incoming water temperature increased, as seen in the results.

3.2. Response Surface Methodology Results and Analysis

(1)
Orthogonal Experimental Design and Results
The orthogonal experimental design was conducted based on the single-factor experiment results, taking the gas–liquid ratio (A), generator running time (B), and inlet water temperature (C) as independent variables, and the CO2 content (R) in the MNB water as the response value. The results are listed in Table S1.
(2)
Response Surface Model Fitting and Analysis
This research compared the fitting results of the first-order model and second-order model. Table S2 lists the ANOVA results of these two types of models. We can observe that the second-order model fits the experimental data better than the first-order model. In addition, a regression model with the CO2 content (R) as the response value was established using a second-order model, as shown in Formula 1.
R = 15.42268 + 13.65714 * A + 0.59759 * B 0.33596 * C 0.082857 * A B + 0.042857 A C 0.00715 * B C 2.16071 * A 2 0.0024125 * B 2 + 0.00615 * C 2
The ANOVA results of the regression model are listed in Table S3. From these results, this regression model’s F-value was 284.30, and the p-value that was less than 0.05 indicates a high significance. Therefore, this model was statistically significant. In this model, the p-value associated with the partial regression coefficient of A, B, and C was lower than 0.05, indicating that the gas–liquid ratio, generator cycle time, and temperature significantly impacted the CO2 content in the MNB water. Within the selected factor level ranges, the degrees of influence of the three had the following order: A > B > C. The interaction between two of the three influencing factors significantly impacted the CO2 content in the MNBs in the significance tests of AB, AC, and BC (p < 0.05). The quadratic terms A2, B2, and C2 had extremely significant effects on the response value (p < 0.05). Further error statistical analyses were performed on the regression model, and the results are listed in Table 4.
The R2 value was 0.9973, which is close to 1, indicating that the stage two model had an excellent fitting effect. The signal-to-noise ratio of 65.718 was much greater than 4. For the same reason, the reliability and accuracy of the model were high. A comparison between the model’s predicted values and the actual values is shown in Figure 5.
The results showed that the values predicted by the model were very close to the actual measured values and contained only minor errors, which further confirmed that the model had a high degree of fit and was the ideal model.
(3)
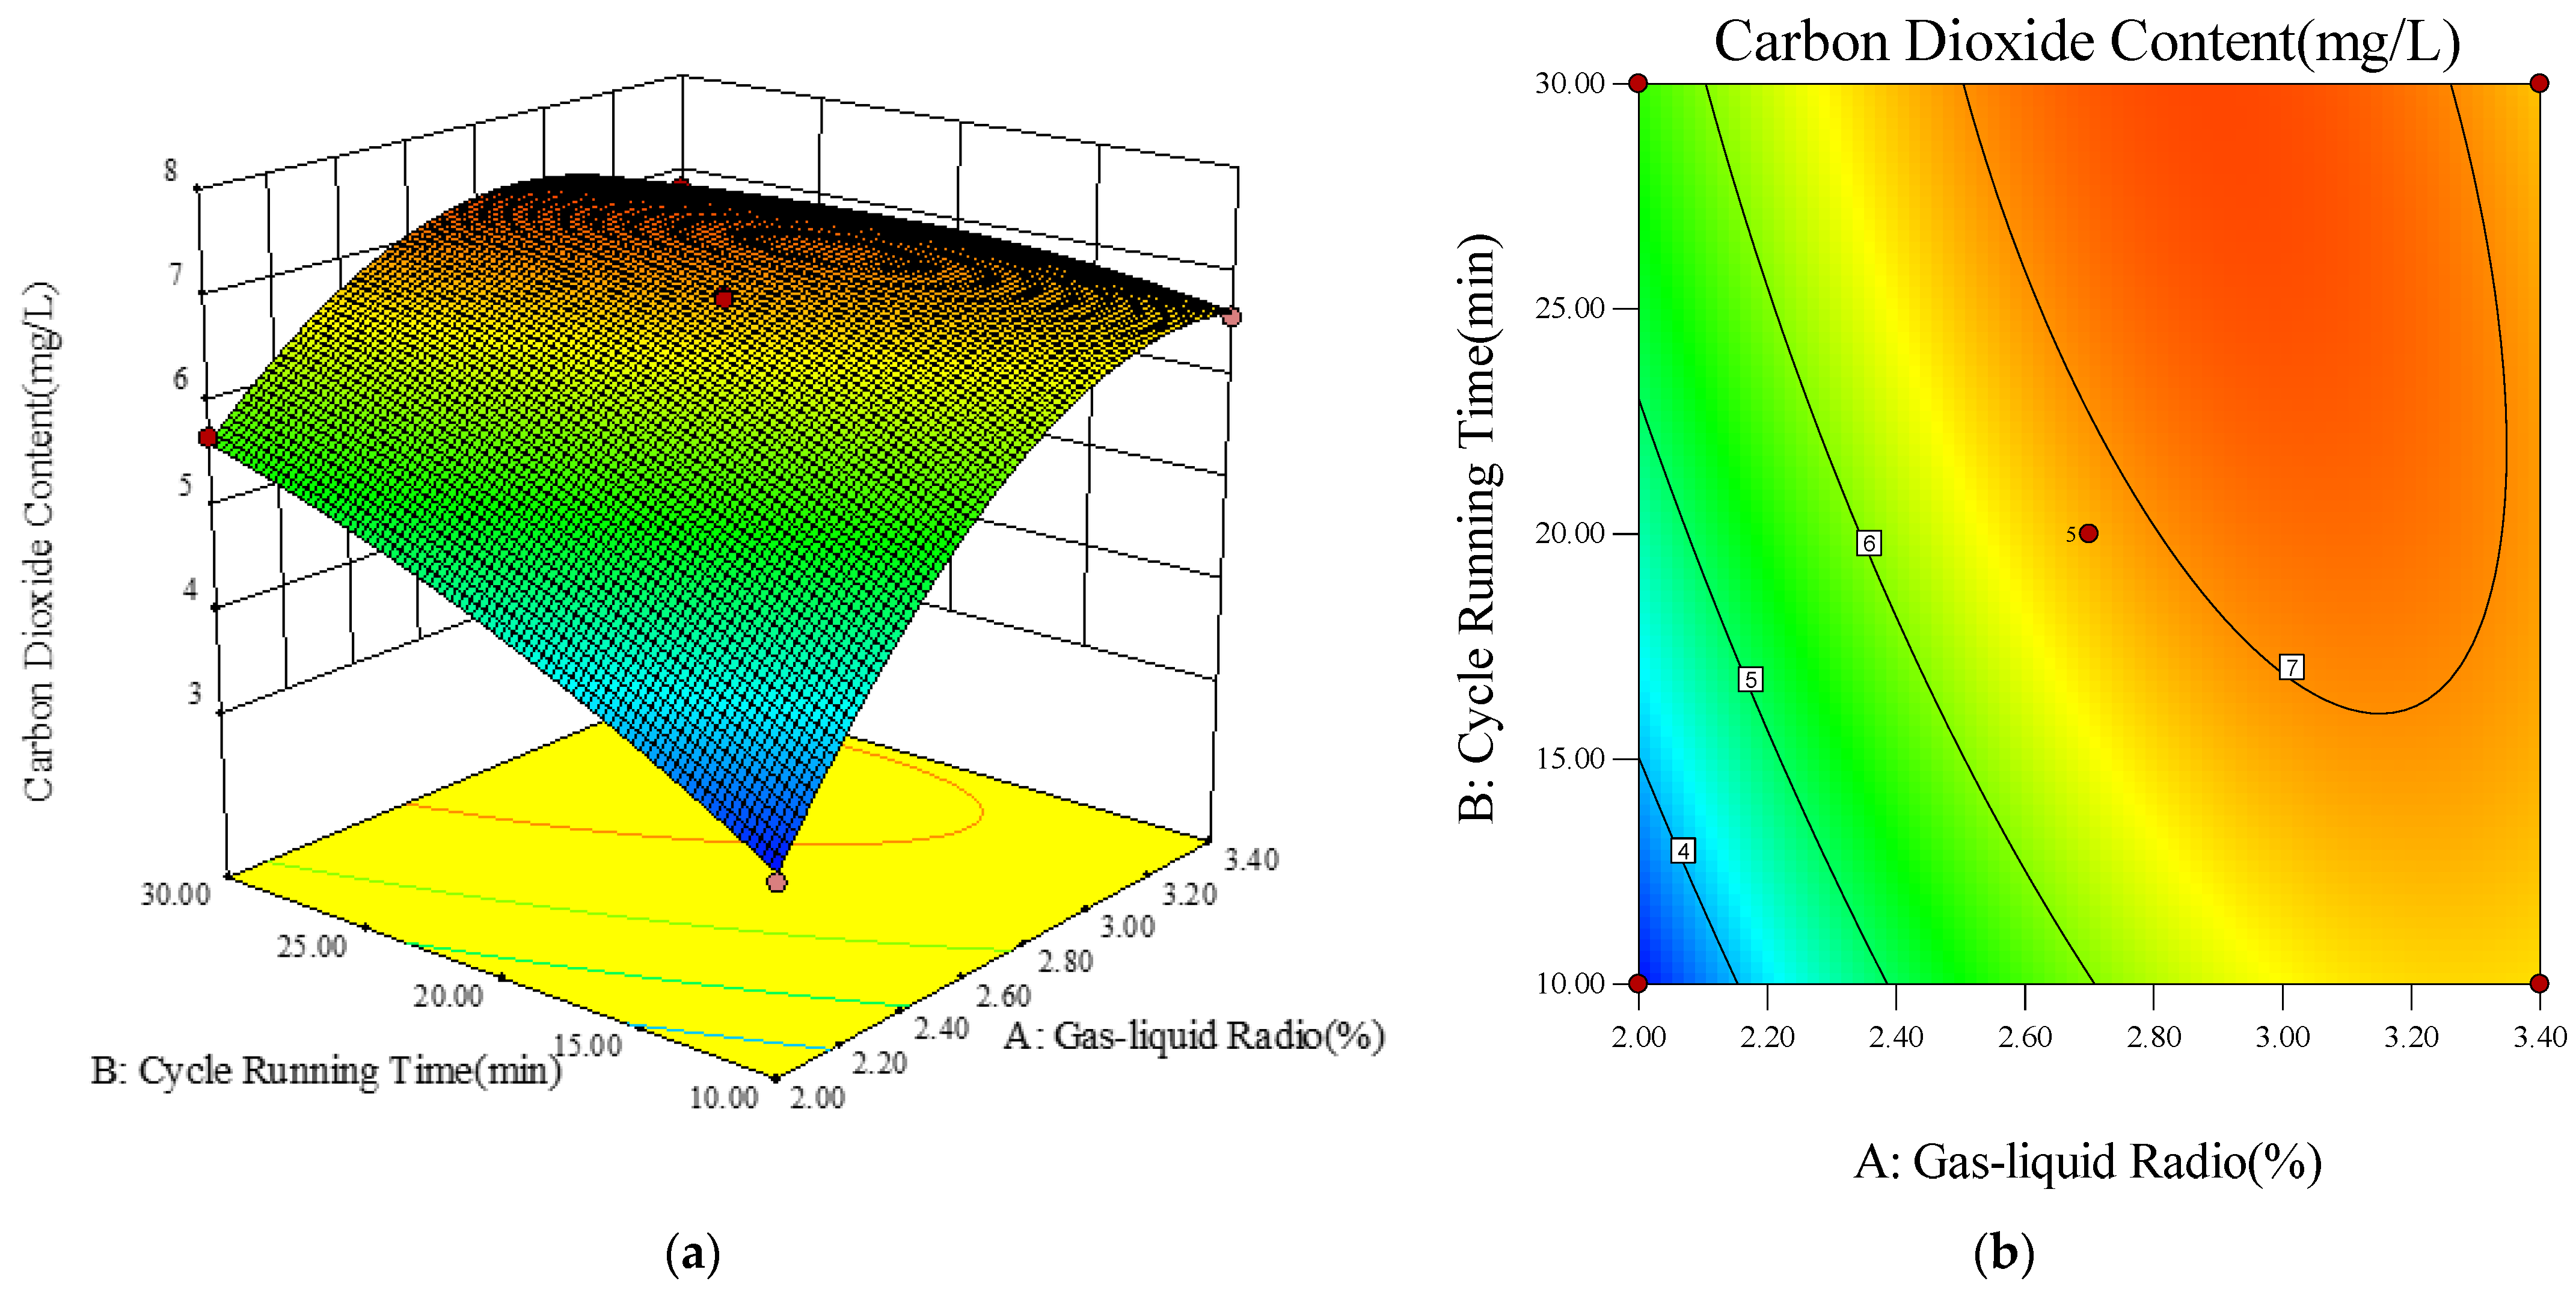
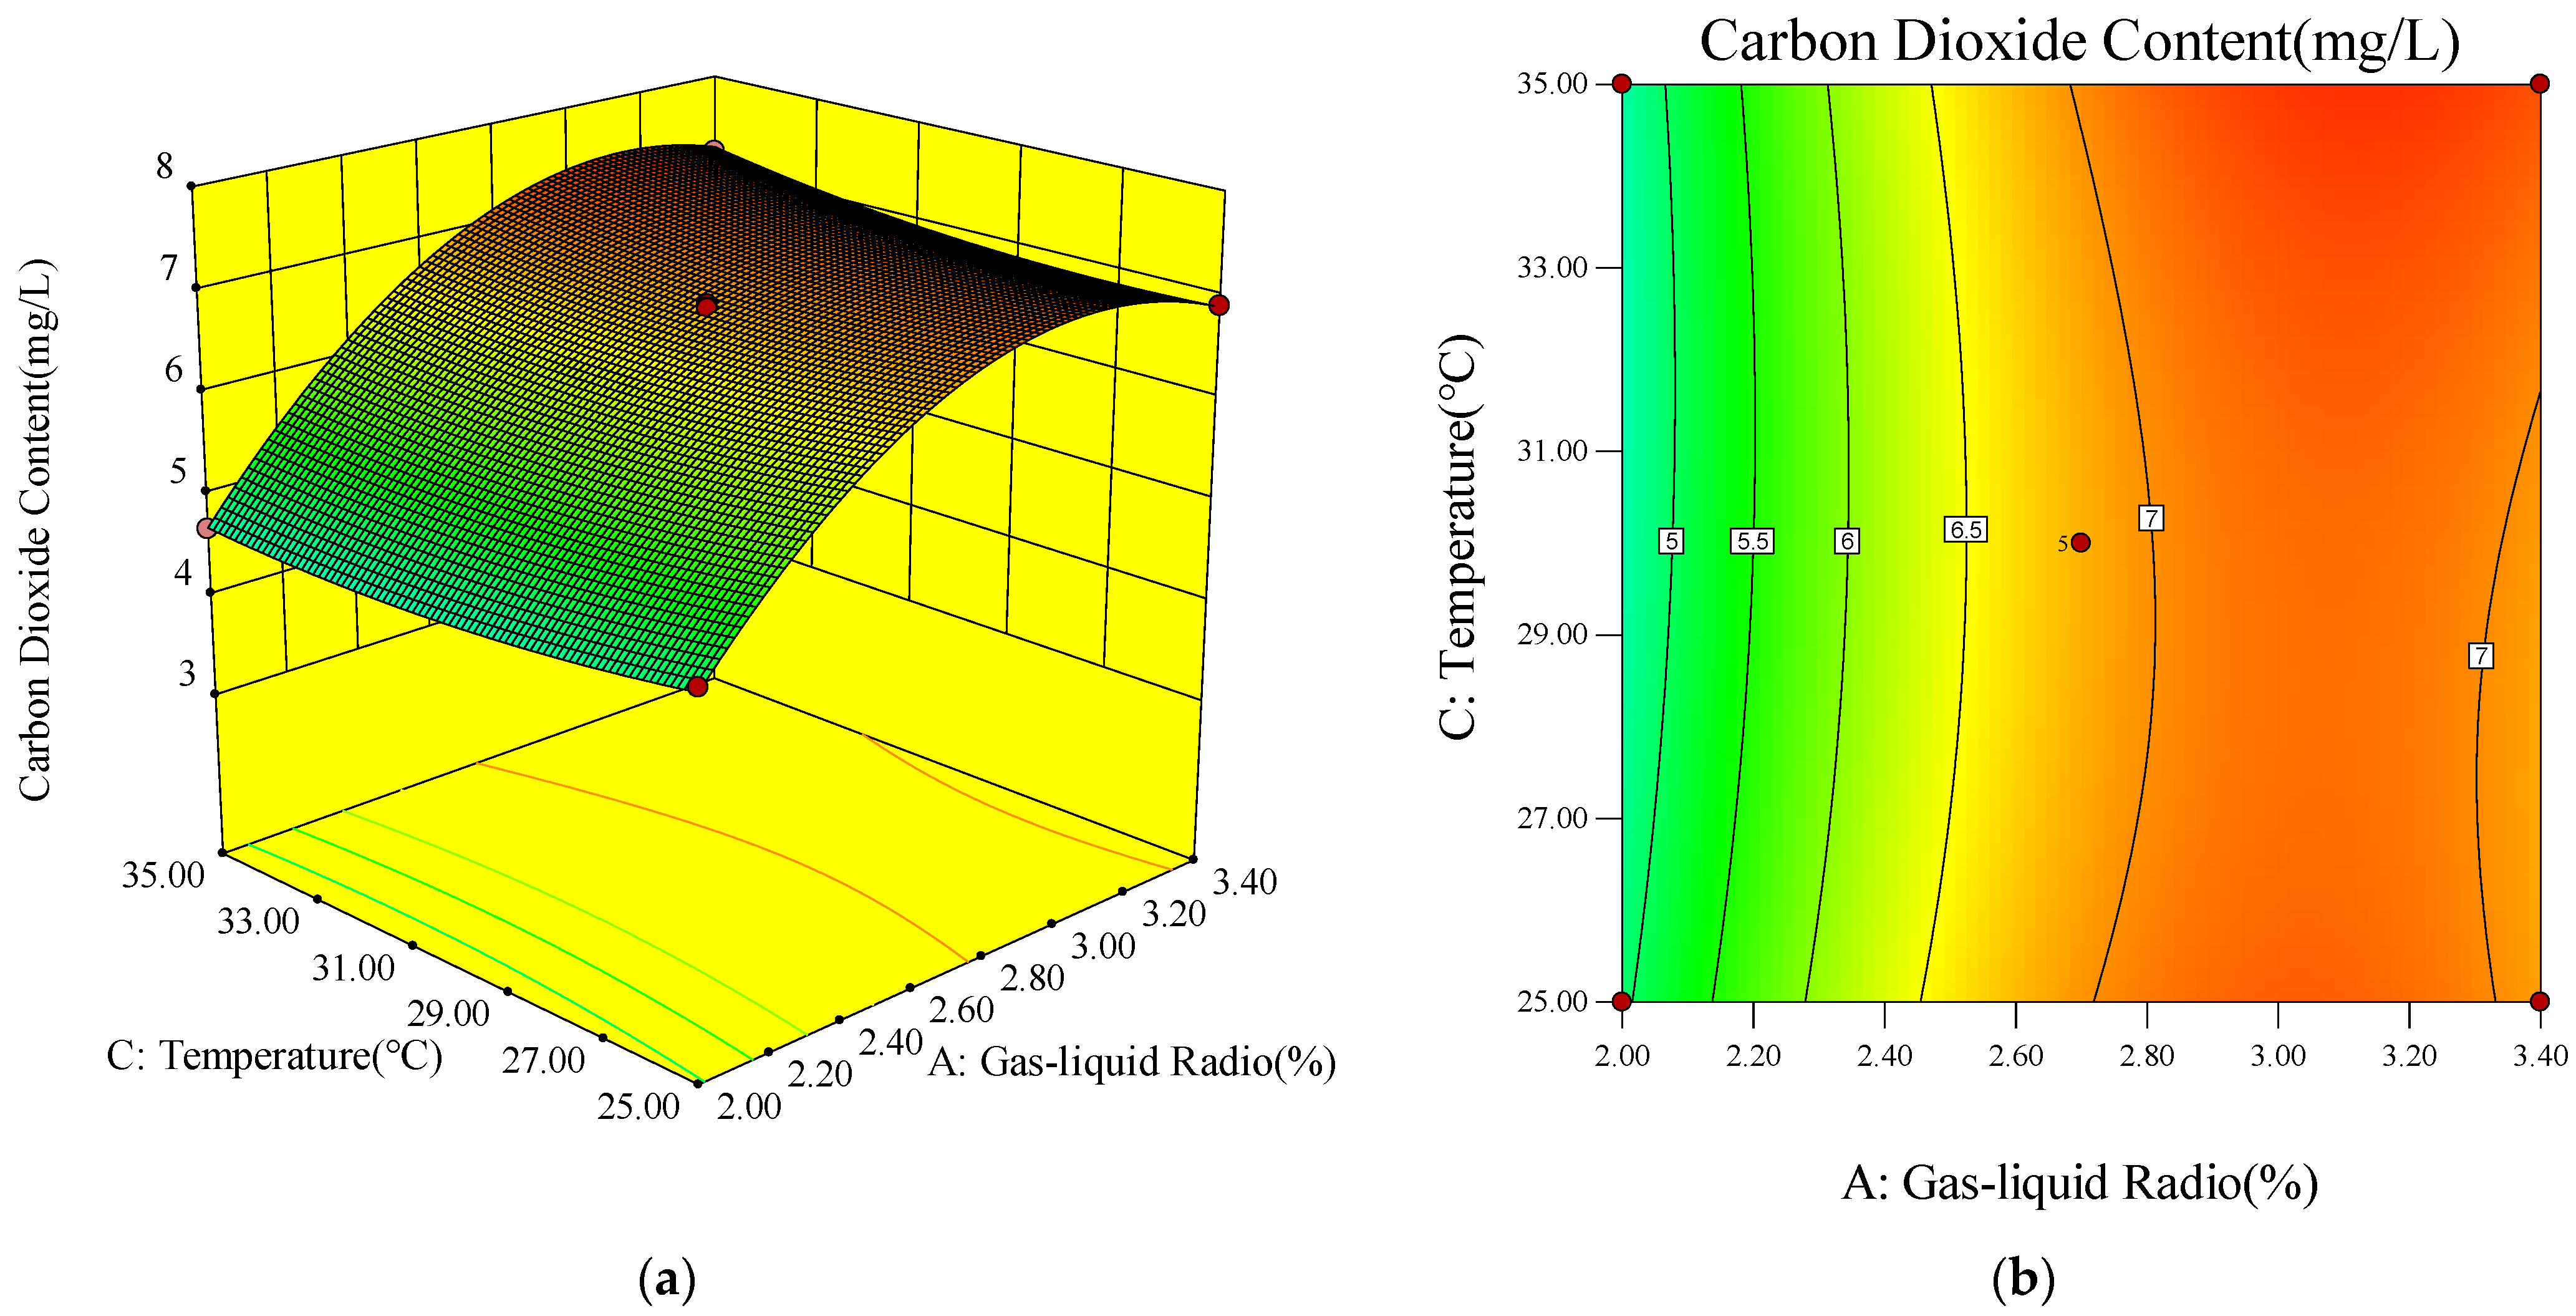
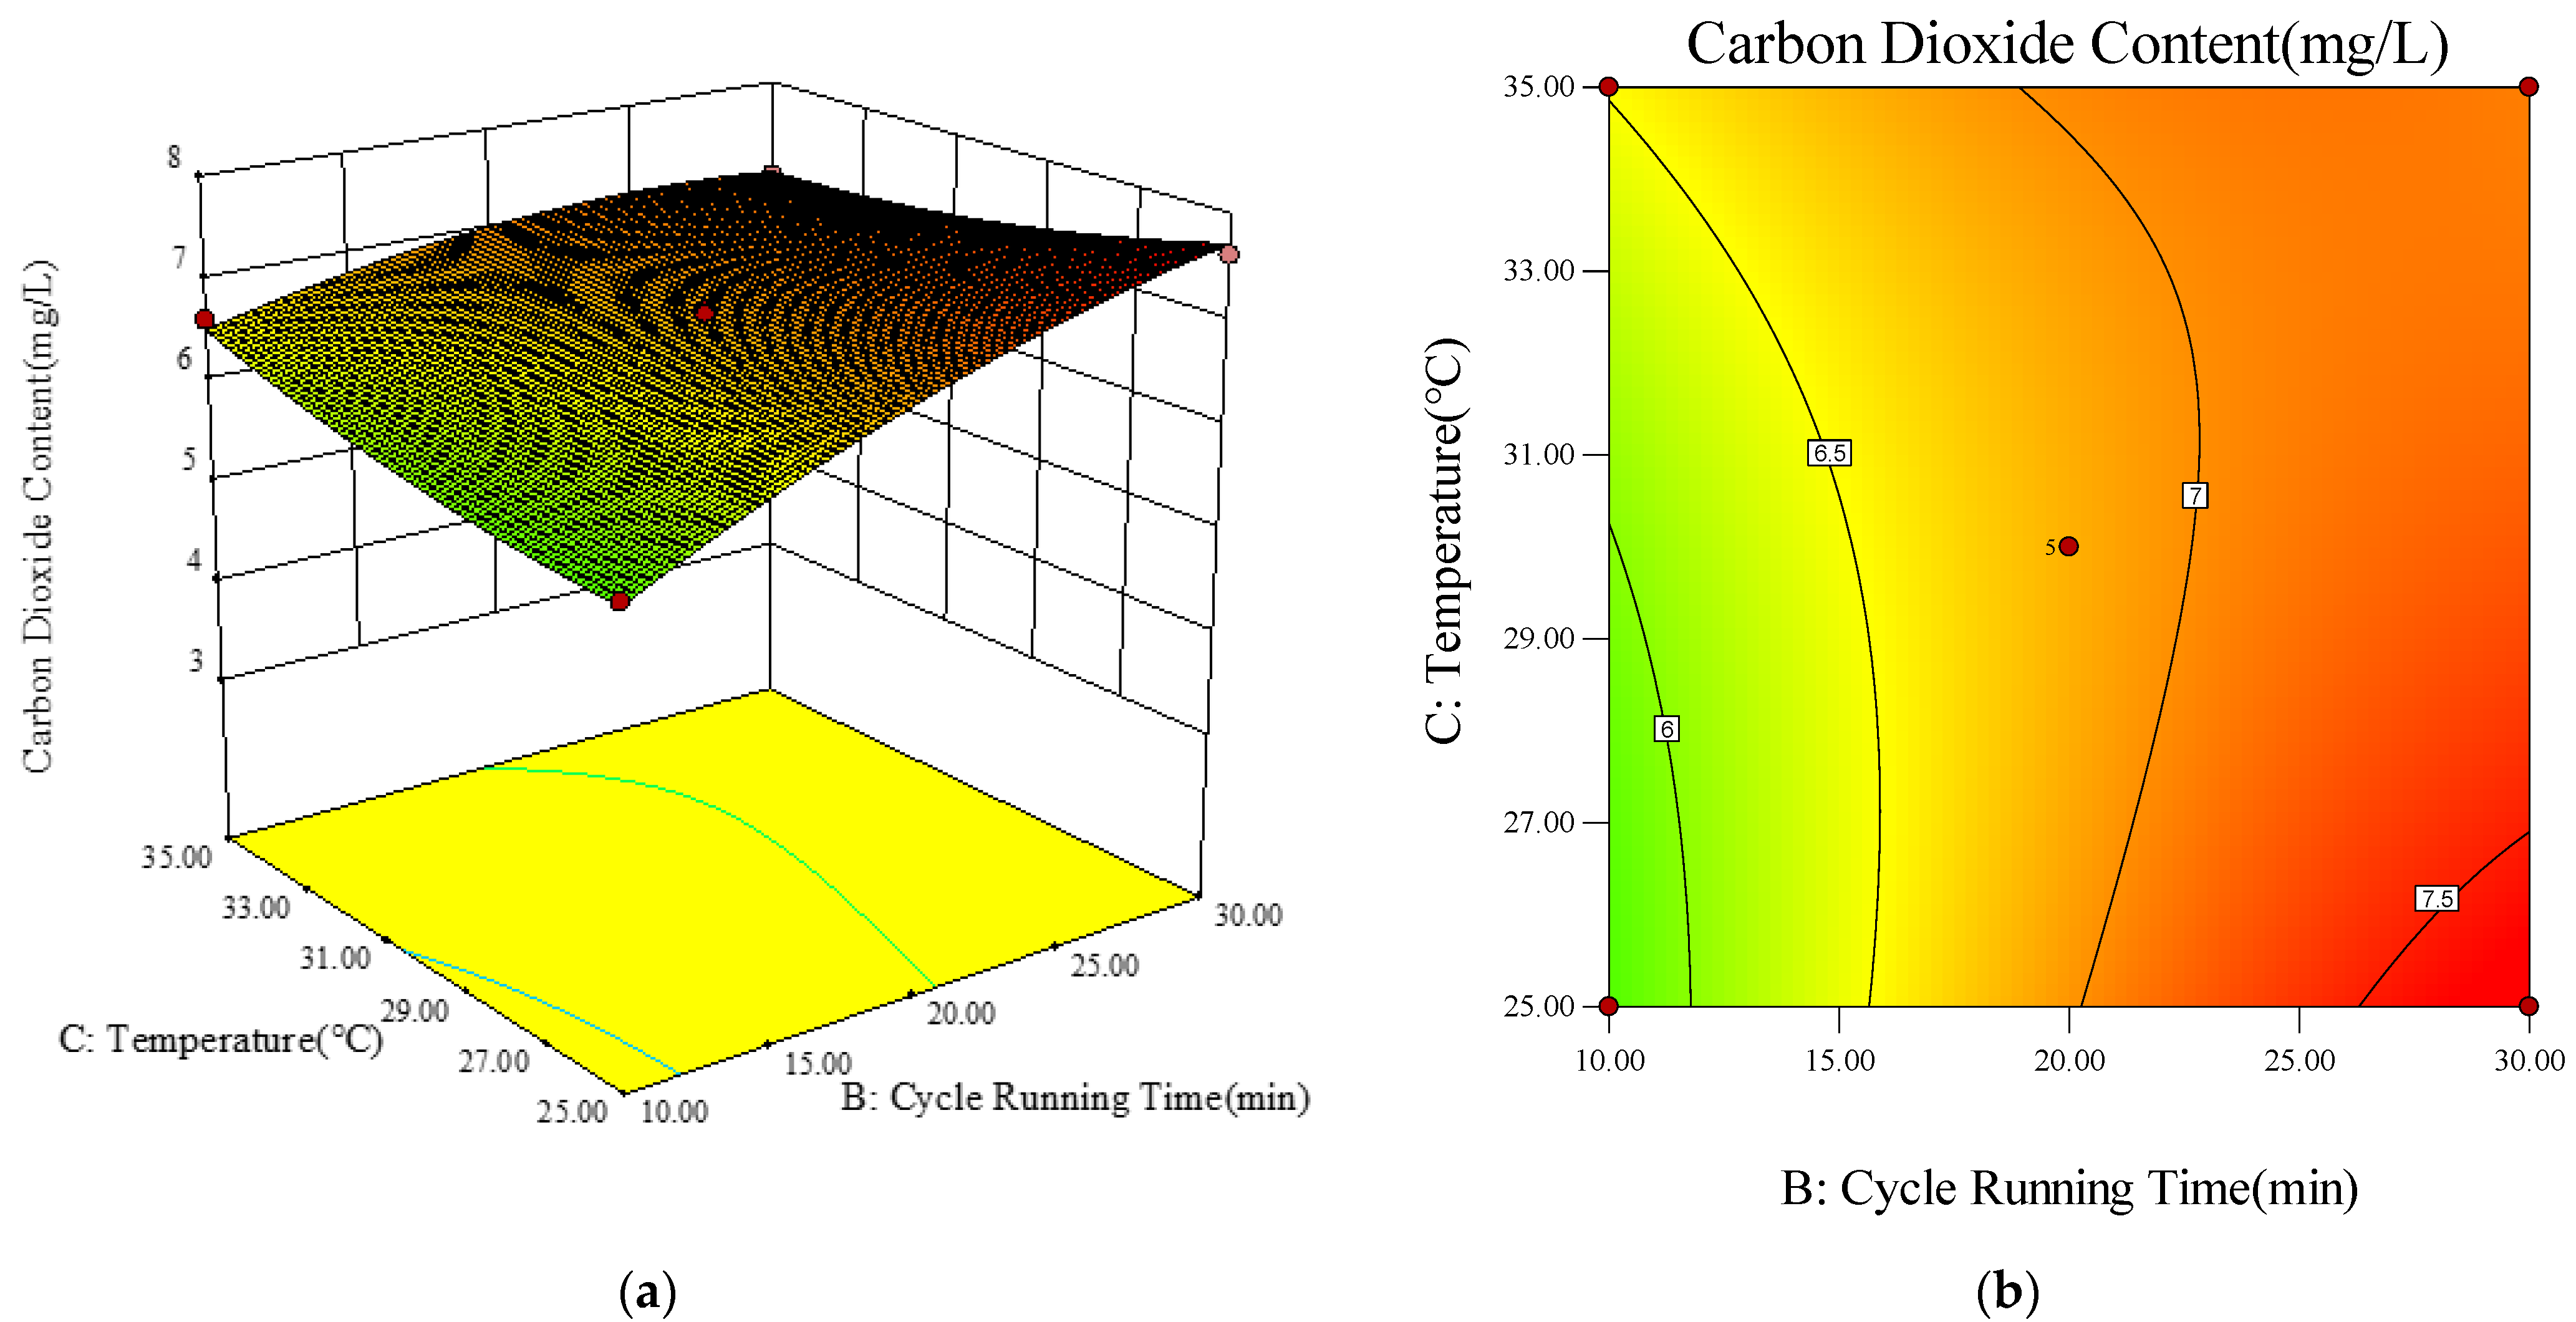
Response Surface and Contour Diagram Analysis
The three-dimensional response surface diagram and the corresponding contour diagram were established to better understand the impact of the influencing factor variables and their interactions with each other. The results are shown in Figure 6, Figure 7 and Figure 8.
The interaction between the gas–liquid ratio and the generator cycle running time had a more apparent impact on the CO2 content in the MNB water than the other two factors. The gas–liquid ratio had the most significant influence on the CO2 content. The interaction between the gas–liquid ratio and the water temperature had a weaker impact on the CO2 content. Figure 7 shows that the effect of the water temperature was smaller than that of the gas–liquid ratio, which was consistent with the previous single-factor experimental results. Figure 8 illustrates the effect of the interaction between the water temperature and the generator cycle running time. Compared with the interaction between the water temperature and the gas–liquid ratio, the water temperature and cycle time had a more significant effect on the CO2 content.
(4)
Model Optimization and Validation Results
In this study, the Design-Expert software was used to select the maximum response value, R, as the optimal condition from the range of experimental factor values. The optimal preparation parameters obtained from the optimization were a gas–liquid ratio of 2.87%, a generator cycle running time of 28.47 min, and an inlet water temperature of 25.52 °C, which resulted in a CO2 content of 7.64 mg/L in the MNB water.
According to the optimal experimental conditions obtained above, the existing experimental platform was controlled to meet the aforementioned optimal parameter conditions to conduct a verification experiment. Finally, the average value of CO2 content in the MNB water under the optimized conditions was 7.76 mg/L, and the relative error was 1.3%, which was within a reasonable error range. This showed that the optimization method for the CO2 MNB water preparation process based on the response surface method was feasible. The model constructed in this study has significance because it provides guidance for optimizing the CO2 content in MNB water.

3.3. Particle Size and Distribution Properties of CO2 MNBs from Dissolved Gas Release Method

The measurements of the particle size and concentration distribution of the MNBs produced under different cycle running times in this experiment are shown in Figure 9. The preparation of the MNBs using the dissolved gas release method can be divided into two processes: the pressurization to dissolve the gas and the decompression to release it [28]. According to the results, the sizes of the MNBs showed two peaks, with peak particle size ranges of 70–80 nm and 700–900 nm. The size of the bubbles tended to decrease with an increase in the generator circulation time, which was consistent with the conclusion of Wang et al. [21]. According to the understanding of the generation mechanism for MNBs, it can be concluded that the size of the generated MNBs was determined by a range of factors, including the physicochemical qualities of the gas, the pressure at which the MNBs were formed, and the duration of the reaction.
The particle size distribution and concentration information of the CO2 MNBs under the optimized conditions are listed in Table S4 and shown in Figure S1. The average particle size of the bubbles was 134.9 nm, and the bubble diameters corresponding to cumulative distributions of 10%, 50%, and 90% were 33.8 nm, 105.6 nm, and 255.5 nm, respectively. The concentration was 6.8 × 10⁶ pieces/mL.

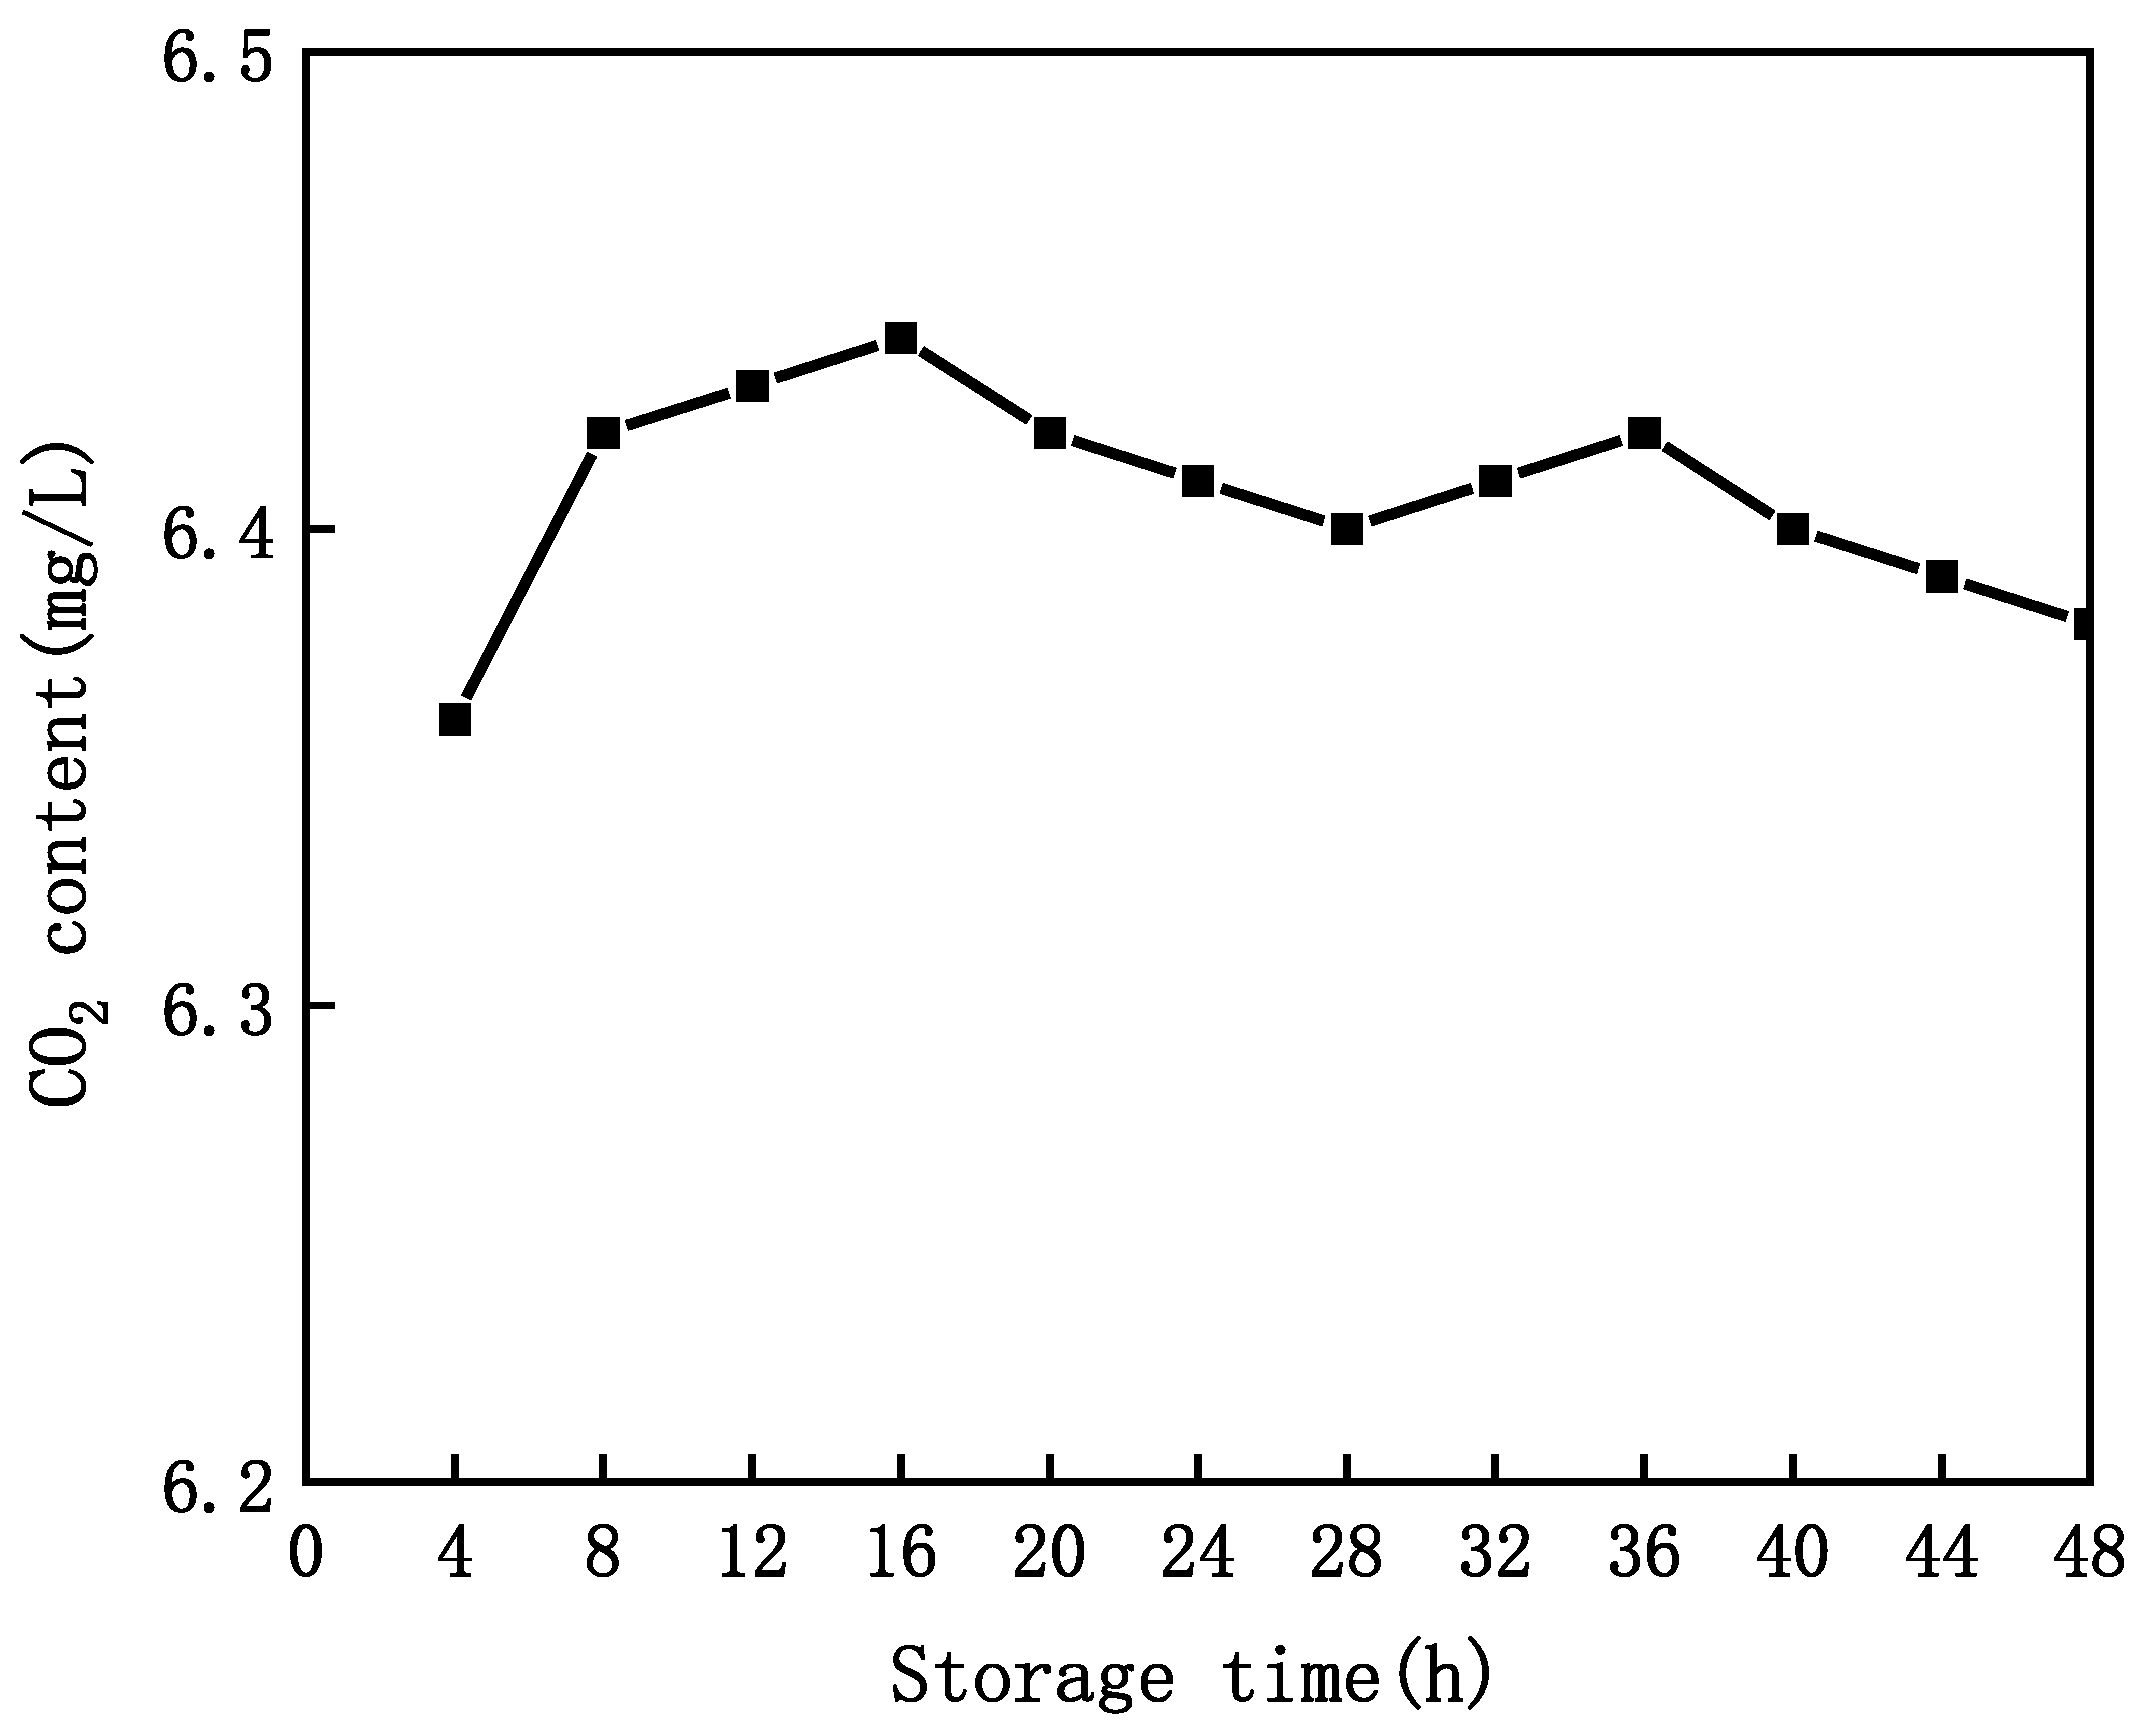
3.4. Properties of CO2 Content and Lifetime in MNB Water

The CO2 content in the MNB water changed with the generator cycle running time and the storage time at room temperature, as shown in Figure 10. This shows that the CO2 content in the water increased with the cycle time and then increased in a stable linear fashion. The CO2 content in the water reached the maximum value of approximately 6.5 mg/L in the linear increase stage when the generator running time was 30–40 min. After that, the CO2 content in the water was basically in a stable state. This result was consistent with the variation of the dissolved oxygen content in the MNB water in [29], which verified that MNB technology can increase the solubility of gas in water.
After the 60 min experiment, the MNB water sample was stored at room temperature to investigate the storage property of CO2 MNBs. The change in the CO2 content in the MNB water with the storage time is shown in Figure 11. It shows that the CO2 content had no obvious decrease within 48 h, which indicates that the lifespan of the MNBs prepared by the generator was longer. The CO2 content fluctuated in the range of 6.3–6.6 mg/L. This proved that the MNBs increased the CO2 content in the water.

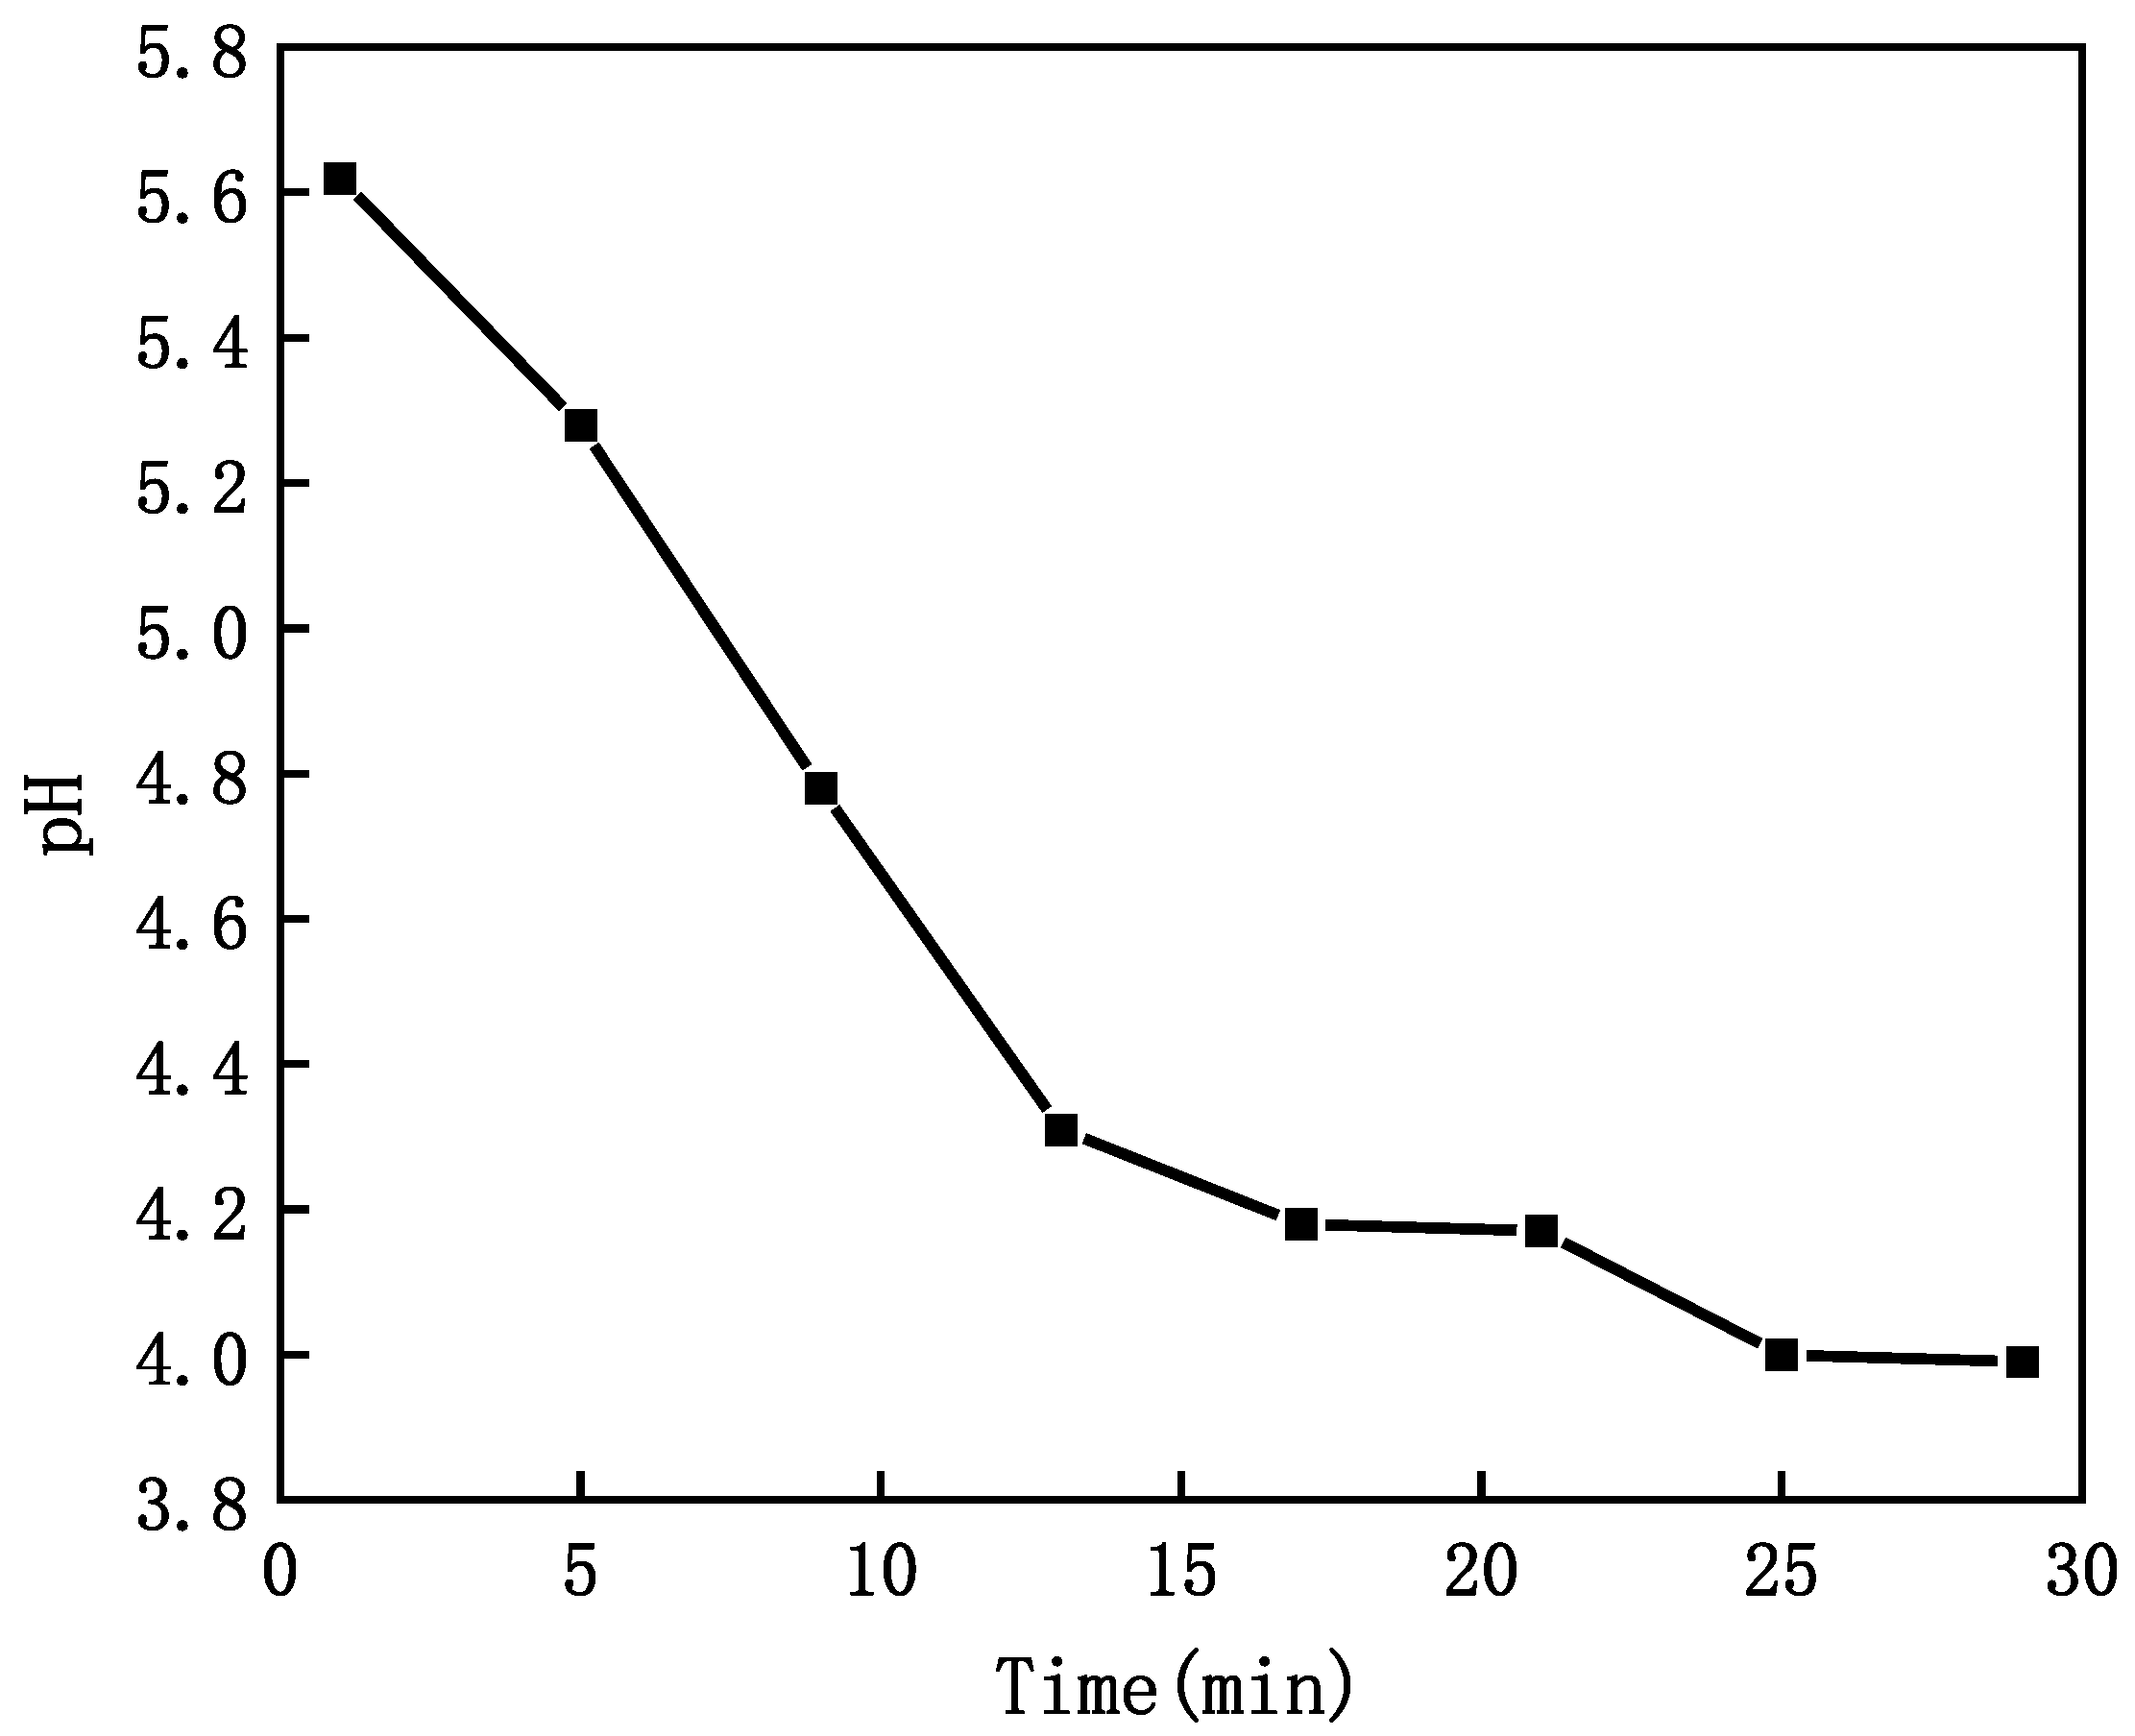
3.5. pH Property of CO2 MNB Water

Figure 12 shows the pH change of the CO2 MNB water prepared under the optimal preparation conditions. CO2 is a slightly soluble gas in water [30]. It readily reacts with water to produce carbonic acid. Thus, the pH of the MNB water decreased when the generator ran longer because a portion of the CO2 was dissolved in the water. Furthermore, when the temperature and pressure remained constant at normal levels, the solubility of the CO2 in the water did not change. As a result, the pH of the MNB water remained essentially stable as the cycle duration increased. Figure 12 shows the experimental results.
The MNB generator increased the quantity of CO2 dissolved in the water relative to normal conditions, and the pH value was considerably lowered during the early stage of the cycle. When the water achieved saturation, the CO2 in the MNB water was mainly free CO2 hydrate, H2CO3, and bubbles in the water [31]. At the end of the experiment, the pH of the deionized water used had dropped from 5.62 to 3.99, or approximately by 29%.

4. Conclusions

The dissolved gas release method was utilized in this work to create MNB water with CO2 gas. The procedure for preparing and characterizing the CO2 MNB water was detailed, and the optimum parameters were also obtained using the response surface methodology. According to these results, the method proposed in this paper is feasible for quantifying the content of CO2 in micro-nanobubble water. Therefore, this method provides new theoretical support for the application of micro-nanobubble technology in agriculture. However, the application scope of the optimization model proposed in this paper is limited to some extent due to the limitations of experimental conditions and equipment. In the following research, different MNB generation principles will be considered. At the same time, the method will be applied to actual agricultural planting, which is the best way to verify the importance of the research results.

Supplementary Materials

The following are available online at https://www.mdpi.com/article/10.3390/app112411638/s1. Table S1: Orthogonal experiment design and results; Table S2: Results of statistical models; Table S3. Regression model statistical analysis results; Table S4, The result of particle distribution of CO2-MNBs under optimal conditions; Figure S1, The particle size distribution of the CO2 MNBs under the optimized conditions.

Author Contributions

Data curation, B.W. and S.T.; methodology, B.W.; software, Y.R.; validation, X.L. (Xiangjie Lu); formal analysis, B.W.; writing—original draft preparation, B.W.; writing—review and editing, S.T. and B.W.; supervision, W.G.; project administration, B.Y.; funding acquisition, X.L. (Xinliang Liu). All authors have read and agreed to the published version of the manuscript.

Funding

This research was funded by the grant program of the Study on the Standard of On-line Monitoring Technology and System for Field Planting (No. 2018YFF0213602) and the Open Project Program of National Engineering Laboratory for Agri-product Quality Traceability, Beijing Technology and Business University (BTBU, No. AQT-2020-YB7).

Institutional Review Board Statement

Not applicable.

Informed Consent Statement

Not applicable.

Data Availability Statement

Not applicable.

Acknowledgments

In addition, we would like to thank the College of Engineering, China Agricultural University for providing the related experiment equipment for this work.

Conflicts of Interest

The authors declare no conflict of interest.

References

  1. Donohue, R.J.; Roderick, M.L.; McVicar, T.R.; Farquhar, G.D. Impact of CO2 fertilization on maximum foliage cover across the globe’s warm, arid environments. Geophys. Res. Lett. 2013, 40, 3031–3035. [Google Scholar] [CrossRef] [Green Version]
  2. Li, Y.; Ding, Y.; Li, D.; Miao, Z. Automatic carbon dioxide enrichment strategies in the greenhouse: A review. Biosyst. Eng. 2018, 171, 101–119. [Google Scholar] [CrossRef]
  3. Jin, C.; Du, S.; Wang, Y.; Condon, J.; Lin, X.; Zhang, Y. Carbon dioxide enrichment by composting in greenhouses and its effect on vegetable production. J. Plant Nutr. Soil Sci. 2009, 172, 418–424. [Google Scholar] [CrossRef]
  4. Wang, X.; Xu, S.; Liang, H. Experimental study of the effects of CO2 enrichment on growth, development and yield of C3 and C4 crops. Sci. Agric. Sin. 1998, 31, 55–61. [Google Scholar]
  5. Martzopoulou, A.; Vafiadis, D.; Fragos, V. Energy Gain in Passive Solar Greenhouses Due to CO2 Enrichment. Energies 2020, 13, 1242. [Google Scholar] [CrossRef] [Green Version]
  6. Pingale, B.N.; Singh, S.D.; Yadav, A. Potential impacts of increasing atmospheric carbon dioxide on yield and plant growth of rice (Oryza sativa) and maize (Zea mays) crops. Indian J. Agric. Sci. 2017, 87, 1041–1044. [Google Scholar]
  7. Ksiksi, T.S.; Thruppoyil, S.B.; Palakkott, A.R. CO2 enrichment affects eco-physiological growth of maize and alfalfa under different water stress regimes in the UAE. Physiol. Mol. Biol. Plants 2018, 24, 251–259. [Google Scholar] [CrossRef] [PubMed]
  8. Fu, T.; Ha, B.; Ko, J. Simulation of CO2 enrichment and climate change impacts on soybean production. Int. Agrophys. 2016, 30, 25–37. [Google Scholar] [CrossRef]
  9. Ainsworth, E.A.; Long, S.P. 30 years of free-air carbon dioxide enrichment (FACE): What have we learned about future crop productivity and its potential for adaptation? Glob. Chang. Biol. 2021, 27, 27–49. [Google Scholar] [CrossRef] [PubMed]
  10. Temesgen, T.; Bui, T.T.; Han, M.; Kim, T.-I.; Park, H. Micro and nanobubble technologies as a new horizon for water-treatment techniques: A review. Adv. Colloid Interface Sci. 2017, 246, 40–51. [Google Scholar] [CrossRef]
  11. Agarwal, A.; Ng, W.J.; Liu, Y. Principle and applications of microbubble and nanobubble technology for water treatment. Chemosphere 2011, 84, 1175–1180. [Google Scholar] [CrossRef]
  12. Haris, S.; Qiu, X.; Klammler, H.; Mohamed, M.M. The use of micro-nano bubbles in groundwater remediation: A comprehensive review. Groundw. Sustain. Dev. 2020, 11, 100463. [Google Scholar] [CrossRef]
  13. Grzegorczyk-Frańczak, M.; Barnat-Hunek, D.; Andrzejuk, W.; Zaburko, J.; Zalewska, M.; Łagód, G. Physical Properties and Durability of Lime-Cement Mortars Prepared with Water Containing Micro-Nano Bubbles of Various Gases. Materials 2021, 14, 1902. [Google Scholar] [CrossRef]
  14. Patel, A.K.; Singhania, R.R.; Chen, C.-W.; Tseng, Y.-S.; Kuo, C.-H.; Wu, C.-H.; Dong, C.D. Advances in micro- and nano bubbles technology for application in biochemical processes. Environ. Technol. Innov. 2021, 23, 101729. [Google Scholar] [CrossRef]
  15. Takahashi, M.; Chiba, K.; Li, P. Free-Radical Generation from Collapsing Microbubbles in the Absence of a Dynamic Stimulus. J. Phys. Chem. B 2007, 111, 1343–1347. [Google Scholar] [CrossRef] [PubMed]
  16. Duan, L.; Yang, L.; Jin, J.; Yang, F.; Liu, D.; Hu, K.; Wang, Q.; Yue, Y.; Gu, N. Micro/nano-bubble-assisted ultrasound to enhance the EPR effect and potential theranostic applications. Theranostics 2020, 10, 462–483. [Google Scholar] [CrossRef] [PubMed]
  17. Tsuge, H. Micro- and Nanobubbles: Fundamentals and Applications; Pan Stanford: Singapore, 2019; p. 219. [Google Scholar]
  18. Ahmed, A.K.A.; Shi, X.; Hua, L.; Manzueta, L.; Qing, W.; Marhaba, T.; Zhang, W. Influences of Air, Oxygen, Nitrogen, and Carbon Dioxide Nanobubbles on Seed Germination and Plant Growth. J. Agric. Food Chem. 2018, 66, 5117–5124. [Google Scholar] [CrossRef] [PubMed]
  19. Liu, Y.; Zhou, Y.; Wang, T.; Pan, J.; Zhou, B.; Muhammad, T.; Zhou, C.; Li, Y. Micro-nano bubble water oxygation: Synergis-tically improving irrigation water use efficiency, crop yield and quality. J. Clean Prod. 2019, 222, 835–843. [Google Scholar] [CrossRef]
  20. Zhou, Y.; Zhou, B.; Xu, F.; Muhammad, T.; Li, Y. Appropriate dissolved oxygen concentration and application stage of micro-nano bubble water oxygation in greenhouse crop plantation. Agric. Water Manag. 2019, 223, 105713. [Google Scholar] [CrossRef]
  21. Zhang, M.; Qiu, L.; Liu, G. Basic characteristics and application of micro-nano bubbles in water treatment. IOP Conf. Ser. Earth Environ. Sci. 2020, 510, 42050. [Google Scholar] [CrossRef]
  22. Mäkelä, M. Experimental design and response surface methodology in energy applications: A tutorial review. Energy Convers. Manag. 2017, 151, 630–640. [Google Scholar] [CrossRef]
  23. Wang, Q.; Zhao, H.; Qi, N.; Qin, Y.; Zhang, X.; Li, Y. Generation and Stability of Size-Adjustable Bulk Nanobubbles Based on Periodic Pressure Change. Sci. Rep. 2019, 9, 1118. [Google Scholar] [CrossRef] [PubMed] [Green Version]
  24. Ushikubo, F.Y.; Furukawa, T.; Nakagawa, R.; Enari, M.; Makino, Y.; Kawagoe, Y.; Shiina, T.; Oshita, S. Evidence of the existence and the stability of nano-bubbles in water. Coll. Surf. A Physicochem. Eng. Asp. 2010, 361, 31–37. [Google Scholar] [CrossRef]
  25. Karimifard, S.; Moghaddam, M.R.A. Application of response surface methodology in physicochemical removal of dyes from wastewater: A critical review. Sci. Total Environ. 2018, 640, 772–797. [Google Scholar] [CrossRef]
  26. Cunico, L.P.; Acosta, M.C.; Turner, C. Experimental measurements and modeling of curcumin solubility in CO2-expanded ethanol. J. Supercrit. Fluids 2017, 130, 381–388. [Google Scholar] [CrossRef]
  27. Zubeir, L.F.; van Osch, D.J.; Rocha, M.A.; Banat, F.; Kroon, M.C. Carbon dioxide solubilities in decanoic acid-based hydro-phobic deep eutectic solvents. J. Chem. Eng. Data 2018, 63, 913–919. [Google Scholar] [CrossRef] [PubMed] [Green Version]
  28. Zhou, Y.; Li, Y.; Liu, X.; Wang, K.; Muhammad, T. Synergistic improvement in spring maize yield and quality with mi-cro/nanobubbles water oxygation. Sci. Rep. 2019, 9, 1–10. [Google Scholar]
  29. Khan, P.; Khan, P.; Zhu, W.; Huang, F.; Gao, W.; Khan, N.A. Micro-nanobubble technology and water-related application. Water Supply 2020, 20, 2021–2035. [Google Scholar] [CrossRef]
  30. Yu, D.S.; Sun, X.R.; Gao, X.H.; Li, Y.; Xing, K. Measurement of CO2 solubility in water based on conductivity method. Chem. Reag. 2021, 43, 954–958. [Google Scholar] [CrossRef]
  31. Maghami, S.; Mehrabani-Zeinabad, A.; Sadeghi, M.; Sánchez-Laínez, J.; Zornoza, B.; Téllez, C.; Coronas, J. Mathematical modeling of temperature and pressure effects on permeability, diffusivity and solubility in polymeric and mixed matrix membranes. Chem. Eng. Sci. 2019, 205, 58–73. [Google Scholar] [CrossRef]
Figure 1. Schematic illustration of the MNB generator, where 1 represents the gas supply (CO2 cylinders); 2 represents the gas flow meter; 3 represents the diaphragm pump; 4 represents the dissolved gas tank; 5 represents the hydraulic pressure gauge; 6 represents the throttling nozzle for the released gas.
Applsci 11 11638 g001
Figure 2. Line chart of the CO2 content variation at different gas–liquid ratios.
Applsci 11 11638 g002
Figure 3. Line graph of the CO2 content changes at different running times.
Applsci 11 11638 g003
Figure 4. Line chart of the CO2 content variation at different temperatures.
Applsci 11 11638 g004
Figure 5. Comparison diagram of the predicted values and the actual values.
Applsci 11 11638 g005
Figure 6. The interaction between the gas–liquid ratio and the generator running time: (a) response surface and (b) contour lines.
Applsci 11 11638 g006
Figure 7. The interaction between the gas–liquid ratio and the inlet water temperature: (a) response surface and (b) contour lines.
Applsci 11 11638 g007
Figure 8. The interaction between the inlet water temperature and the generator running time: (a) response surface and (b) contour lines.
Applsci 11 11638 g008
Figure 9. Particle size distribution of the CO2 MNBs under different circulation times for the generator.
Applsci 11 11638 g009
Figure 10. Variation trend of the CO2 content in the MNB water.
Applsci 11 11638 g010
Figure 11. Line chart showing the variation of the CO2 content in the MNB water.
Applsci 11 11638 g011
Figure 12. Line chart for the changes in the pH of the CO2 MNB water over time.
Applsci 11 11638 g012
Table 1. Materials and reagents.
MaterialSpecificationManufacturer
Carbon dioxide gasPurity of 99.9%Beijing Aokang Shuangquan Energy Technologies Co., Ltd. (Beijing, China)
Deionized waterAnalytical reagentBeijing Kefeng Zhengye Business Center (Beijing, China)
NaClAnalytical reagentShanghai Maclin Biochemical Technology Co., Ltd. (Shanghai, China)
NaHCO3Analytical reagentShanghai Maclin Biochemical Technology Co., Ltd.
H3PO4Analytical reagentShanghai Maclin Biochemical Technology Co., Ltd.
NaOHAnalytical reagentShanghai Maclin Biochemical Technology Co., Ltd.
Table 2. Major instruments and devices.
Instrument Name and ModelManufacturer
Carbon dioxide meter (multifunctional analytical FC-100 model + pCO2-1 carbon dioxide gas sending electrode)Beijing Zhongxihuada Technology Co., Ltd. (Beijing, China)
pH meterMettler Toledo International Trading (Shanghai) Co., Ltd. (Shanghai, China)
Magnetic stirrerScilogex (Connecticut, CT, USA)
Electronic balanceOhaus Instrument (Shanghai) Co., Ltd. (Shanghai, China)
Table 3. Chart of factors and levels used in the Box–Behnken design.
FactorEncoded Level
−101
A Gas-liquid ratio (v/v, %)2.02.73.4
B Running time (min)102030
C Water temperature (°C)253035
Table 4. Statistical analysis results for the regression model errors.
ItemValue
Std. Dev.0.090
Mean6.31
C.V.%1.42
PRESS0.80
R20.9973
Adj R20.9938
Pred R20.9608
Adeq Precision65.718
Publisher’s Note: MDPI stays neutral with regard to jurisdictional claims in published maps and institutional affiliations.

