1. Introduction
In the shallow water environment, offshore structures, such as breakwater, offshore turbines, and oil platforms, generally are directly constructed on the seabed foundation. However, there is an inescapable truth that the seabed soil layers newly deposited in the Quaternary are widely distributed in offshore areas. Under the application of cyclic loadings, such as ocean waves and seismic waves, these loose seabed soil layers are easily liquefied or softened under cyclic loading, such as ocean waves and seismic waves, which poses an enormous threat to the stability of offshore structures constructed on it. After a comprehensive analysis of the failure reasons for some typical breakwater projects that occurred since the 1930s, Oumeraci (1994) [
1] pointed out that the ocean wave-induced liquefaction in seabed foundations is one of the factors causing the failure of offshore breakwaters. Cavallaro et al. (2018) [
2] and Idriss et al. (2004) [
3] investigated the liquefaction phenomena on seismic waves by laboratory tests and numerical simulations of saturated cohesive soils. Therefore, it has important research significance in science and engineering to study the dynamic characteristics and the liquefaction process of a loosely deposited seabed floor under the loading of extreme waves in a shallow water environment.
About the ocean wave-induced dynamics of a seabed floor, there have been a great number of works done previously. Before 2000, analytical derivation was the main research method. According to Biot’s consolidation theory, a series of analytical solutions are proposed, in which the seabed can be finite [
4,
5] or infinite [
6,
7] in depth; the seabed can also be isotropic or anisotropic. After 2000, the analytical derivation was further developed. Some new analytical solutions were proposed either considering the stratification of the seabed or adopting the ‘u-p’ form/‘u-w’ form of Biot’s equation as the governing equation; a detailed brief review can be found in Yang and Ye (2017) [
8]. However, these analytical solutions are only applicable to the very dense seabed soil, which can be described by the poroelastic soil model.
For loosely deposited seabed soil, a poro-elastoplastic soil model must be utilized. As a result, numerical modeling would be the only reliable way to study the dynamics. On this aspect, typical works were conducted by Oka (1994) [
9] and Dunn et al. (2006) [
10] before 2010. Several works have been conducted in the past decade. Liao et al. (2015) [
11] and Xu and Dong (2011) [
12] numerically studied the accumulation of pore pressure in a loose seabed floor by extending Sassa’s model [
13] from 1D to 2D under the action of a random wave. Recently, Yang and Ye (2017, 2018) [
8,
14] comprehensively studied the dynamics of a loose seabed floor as well as the progressive liquefaction process by utilizing the integrated model FSSI-CAS 2D. However, the Stokes wave theory is used in their works. Actually, the Stokes wave theory is not applicable in offshore shallow water. The cnoidal wave should be used.
On the aspect of cnoidal wave-induced dynamics of the seabed floor, there are also a few works available in the recent decade. For example, Zhou et al. (2014) [
15] numerically investigated the dynamics of a dense seabed floor under the action of the cnoidal wave, taking a COMSOL-based numerical model. Xu et al. (2013) [
16] and Hsu et al. (2019, 2021) [
17,
18] analytically investigated the cnoidal wave-induced dynamics of the dense seabed and the momentary liquefaction. However, the above studies are all limited to the poroelastic soil model, which is only applicable to very dense seabed soil. Currently, there is still a lack of research work on the cnoidal wave-induced dynamics of a loosely deposited seabed floor and on the residual liquefaction in it in a shallow water environment.
In this study, the integrated numerical model FSSI-CAS 2D is used as the calculation platform to comprehensively study the dynamic characteristics and progressive process of the residual liquefaction of the loose seabed under the action of cnoidal waves in a shallow water environment. At the same time, this study improves the understanding and knowledge of its liquefaction process and provides valuable references for academic and practical communities.
2. Numerical Model and Constitutive Model
In this study, the integrated numerical model FSSI-CAS 2D developed by Ye et al. (2013) [
19] and Jeng et al. (2013) [
20] is utilized as the computational platform. FSSI-CAS 2D is an integrated numerical model especially for the problem of fluid–structure–seabed interaction (FSSI) in the field of offshore geotechnics, in which the VARANS equation is used to govern the hydrodynamics of seabed water, and the Biot ‘u-p’ equation is used to govern the dynamics of an offshore structure and its seabed foundation under external dynamic loading. A one-way coupling algorithm based on the time unmatched and mesh unmatched conception was first proposed by Ye et al. (2013) [
19] and Jeng et al. (2013) [
20] to integrate the VARANS equation and the Biot ‘u-p’ equation, finally forming the model FSSI-CAS 2D. The validation of FSSI-CAS 2D for the FSSI problem has been widely verified by taking analytical solutions, a series of laboratory wave flume tests, and centrifuge geotechnical tests (for detailed information, please see Ye et al. (2013)) [
19]. This integrated model also has been successfully utilized to investigate the interaction between the offshore breakwater and various ocean waves, such as regular waves, breaking waves, and tsunami waves. Furthermore, FSSI-CAS 2D has been further extended to study the seismic dynamics and failure process of offshore breakwater built on a loosely deposited seabed foundation (see Ye and Wang (2015)) [
21]. Overall, FSSI-CAS 2D is an excellent computational platform for FSSI problems in the field of offshore geotechnics.
It has been widely recognized that the poroelastic soil model can be only applicable when the seabed soil is in a very dense state. For loose seabed soil, elastoplastic soil constitutive models must be used due to its complicated and nonlinear mechanical behavior. In this study, the soil model Pastor–Zienkiewicz Mark III (PZIII) is utilized to describe the nonlinear behavior of the loosely deposited seabed under the action of the cnoidal wave. PZIII is already available in FSSI-CAS 2D, which was first incorporated into the numerical model by Chan (1988) [
22]. PZIII was established by Zienkiewicz and Mroz (1984) [
23] based on the generalized plasticity theory, where there is no need to explicitly give the specific form of the functions describing the yield surface
f and the plastic potential surface
g in stress space. The unit normal vector of the yield and plastic potential surfaces in the
p–
q coordinates and the plastic modulus
A are directly and explicitly given out. According to the plasticity theory, the elastoplastic matrix
Dep can be formulated as
where
De is the 6 × 6 elastic matrix, relating to elastic parameters of soil.
and
are the unit normal vector of the yield and plastic potential surfaces in stress space.
A is the plastic modulus. In PZIII,
and
are directly given out in
p–
q coordinates as
in which
, and
.
is the slope of the critical state line (CSL), and
=
q/
p is the stress ratio.
,
,
are parameters characterizing the deformation of soil. Among them,
is closely related to the density and
. It is suggested that
/
, where
is the relative density of soil.
In a traditional plastic theory, the plastic modulus
A of soil must be determined according to the following equation:
where
K is the hardening parameter, and
is the plastic strain of soil. The precondition for determining the value of
A is that the formulations describing how the yield surface
f varies with the hardening parameter
K and how the hardening parameter
K develops with the plastic strain
must be known. Actually, it is very difficult to know the above two relationships. However, this problem is solved from a completely different perspective in the generalized plasticity theory. The formulation of the plastic modulus
H is directly given out in PZIII based on the recognition of the soil deformation obtained through a series of laboratory tests:
in which
,
, and
.
,
,
, and
are four parameters.
is the initial plastic modulus at loading,
is the initial plastic modulus at unloading.
is the stress ratio when unloading. PZIII is an excellent constitutive model for describing the behaviors of clay and sandy soils. Its reliability was validated based on a series of laboratory tests involving monotonic and cyclic loading [
24]. This model is one of the heritages of Olek Zienkiewicz [
25].
3. Boundary Conditions and Hydrodynamic Loading
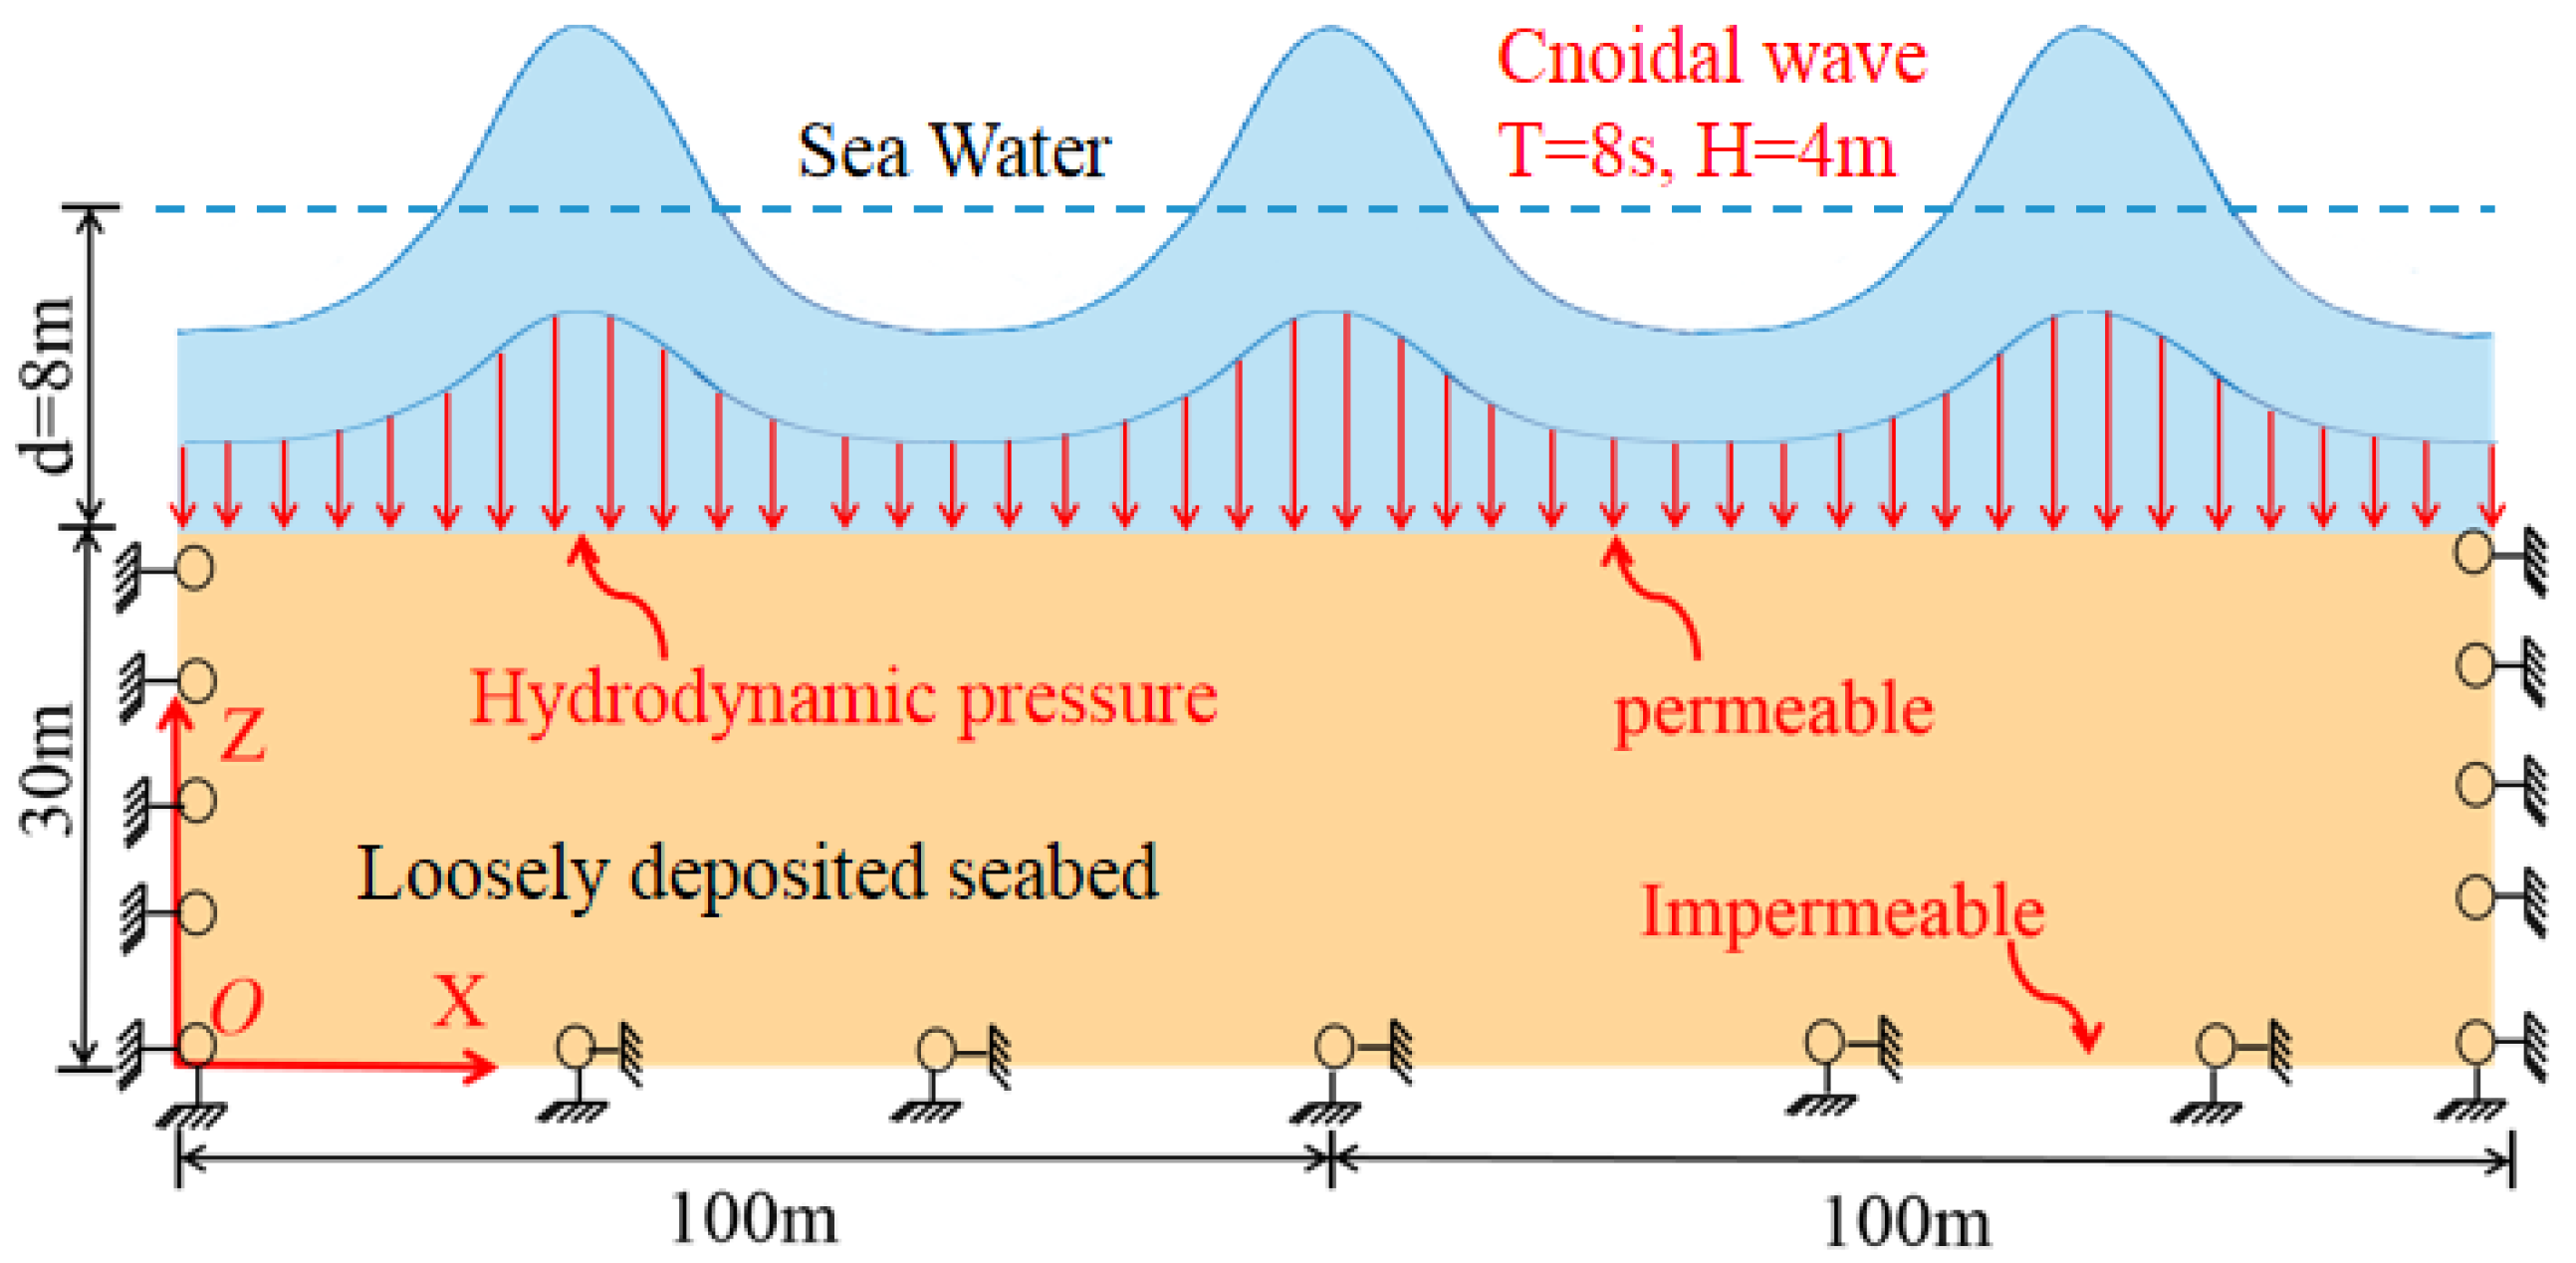
The length and thickness of the seabed floor used in the computation are 200 and 30 m, respectively, as illustrated in
Figure 1. In total, 12,190 four-node elements are utilized to discretize the computation domain. The maximum size of the elements is 0.87 m horizontally and 0.6 m vertically. At the bottom of the seabed floor, the horizontal and vertical displacements are all fixed as 0, and only the horizontal displacement is fixed along the two lateral sides of the computational domain. On the surface of the seabed floor, the hydrodynamic loading and the hydrostatic pressure are jointly applied. However, it is worthy to note that the effective stresses on the surface of the seabed floor must always be kept zero all the time in the computation.
According to Isobe and Kraus (1983) [
26], the profile of the cnoidal wave is expressed as
where
d is the water depth,
H is the wave height, and
T is the wave period.
cn(∙) is the Jacobi elliptic function.
m ∈ (0, 1) is the modulus of the cnoidal wave.
K(
m) and
E(
m) are the complete ellipse integral of the first kind and the second kind, respectively:
L is the length of the cnoidal wave, formulated as
The cnoidal wave-induced hydrodynamic loading on the surface of the seabed floor is expressed as
where
is the density of seawater and
g is the gravity. It has been well known that when the Ursell parameter
U =
> 25, the hydrodynamic loading determined by cnoidal wave theory will be much more accurate than that by Stokes wave theory [
27].
In fact, it is inconvenient for us to compute the complete ellipse integral of the first kind and second kind
K(
m) and
E(
m), as formulated in Equations (7) and (8). To solve this problem, Abramowitz and Stegun [
28] proposed the following formulations containing an infinite series to approach the real value of
K(
m) and
E(
m).
Since it is also not easy to get the value of the Jacobi elliptic function
in Equation (10), Isaacson (1977) [
29] proposed the following Fourier series approximation to reliably estimate the value of
.
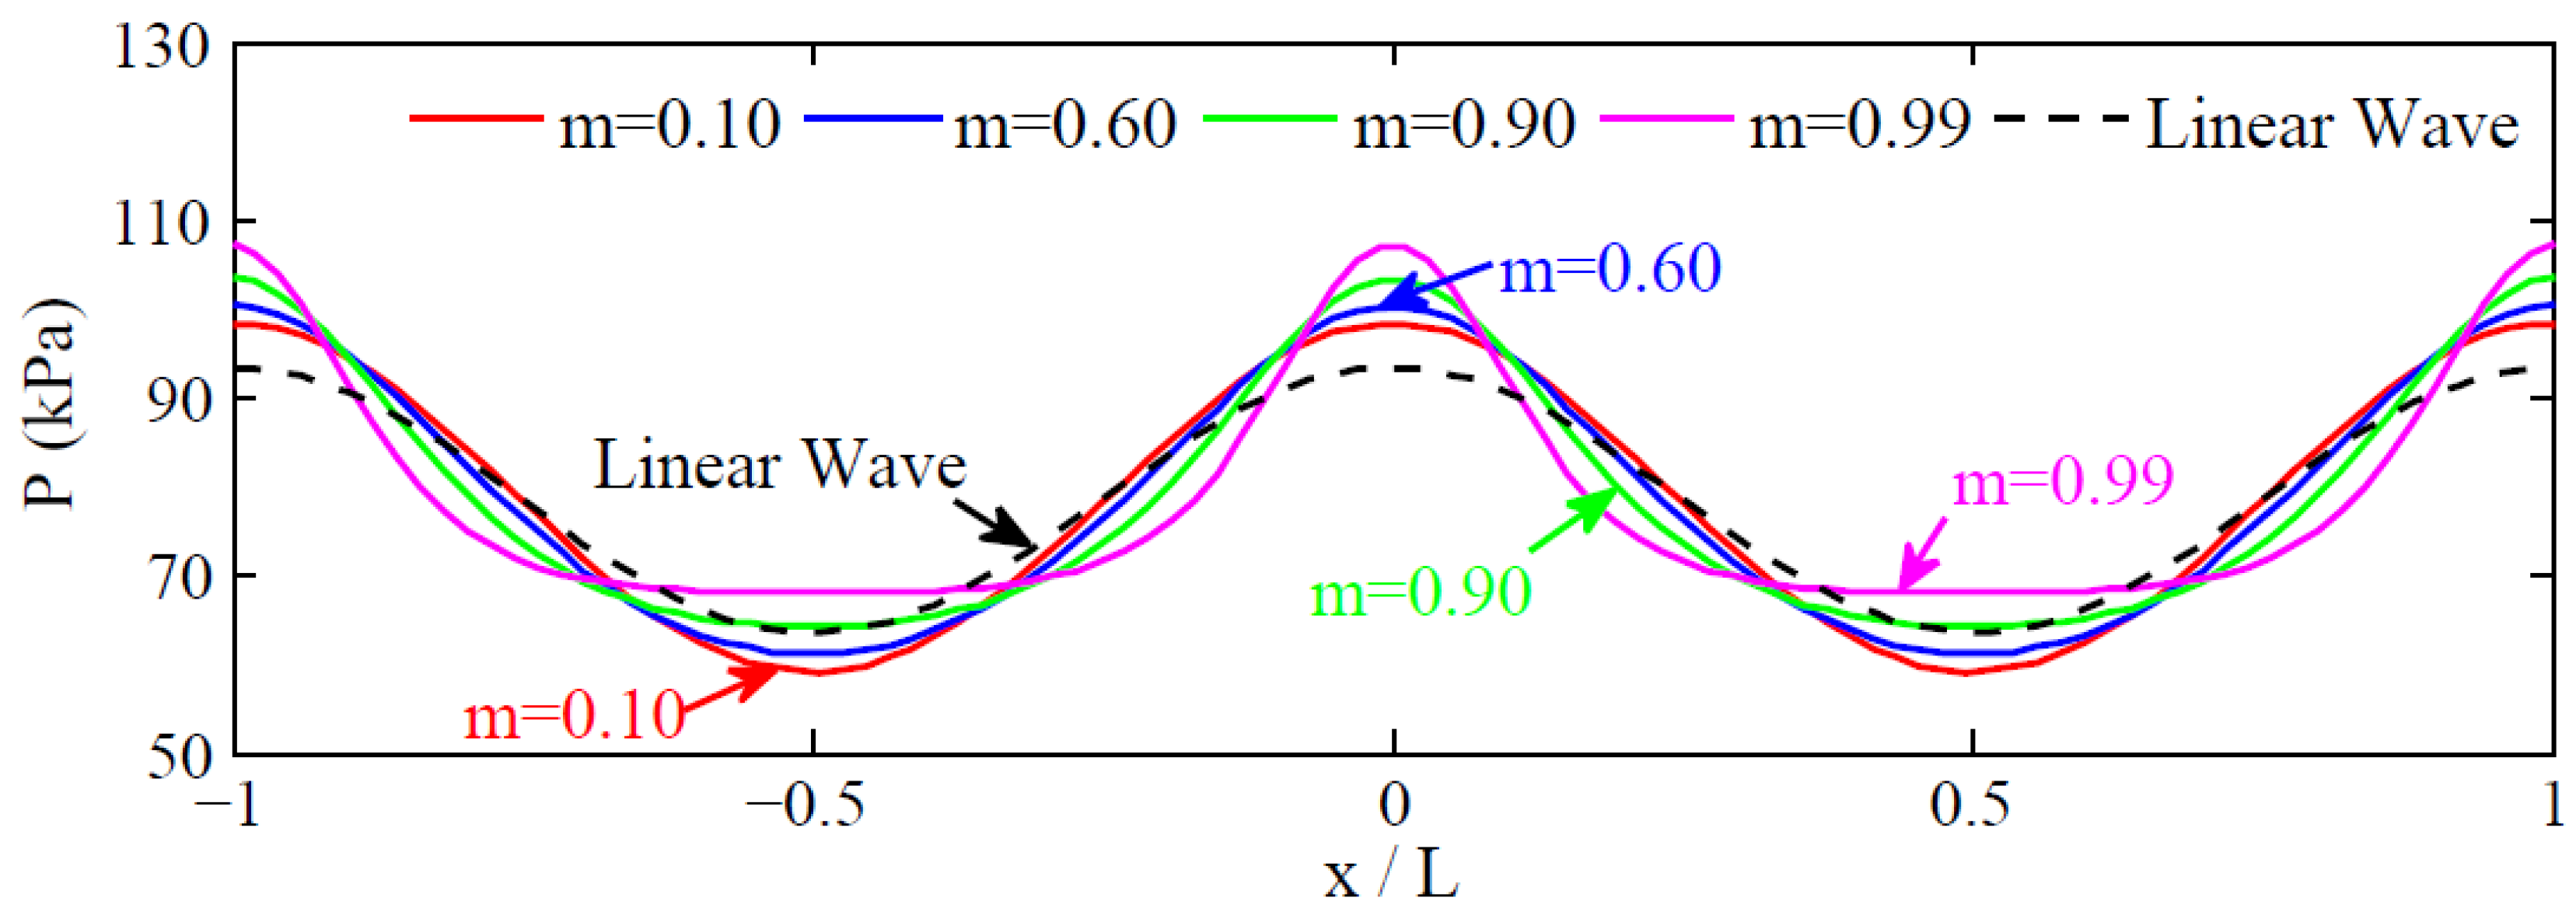
It is found that the modulus of the cnoidal wave
m ∈ (0, 1) is the key parameter determining the waveform of the wave-induced pressure applied on the surface of the seabed floor. This effect is clearly illustrated in
Figure 2. It is observed that the waveforms of the cnoidal wave-induced hydrodynamic loading on the surface of the seabed floor are highly dependent on the value of
m. When
m ≤ 0.1, it is a little approach to the linear Stokes wave. When 1 >
m > 0.9, the nonlinearity is very significant. In this study,
m = 0.99 is used in the computation.
4. Result Analysis
The model parameters of the loosely deposited seabed soil for the PZIII model used in the computation are listed in
Table 1. These values were calibrated by Zienkiewicz et al. (1999) [
24] for Nevada sand when attending the VELACS project based on a series of laboratory triaxial tests. Their reliability in describing the mechanical behavior of loose sandy soil is acceptable. The initial void ratio
e0 and saturation
Sr are set as 0.68 and 98%, respectively. Correspondingly, the initial permeability
k0 is set as
m/s. The parameters of the cnoidal wave are:
H = 4.0 m,
d = 8.0 m, and
T = 8.0 s.
Before the cnoidal wave application, there are two initial fields of effective stresses and pore pressure in the loosely deposited seabed floor. The two initial state fields must be taken as the initial conditions for the subsequent dynamic analysis. Therefore, the two initial fields need to be numerically determined first before applying the cnoidal wave. Because there have been some previous works about the determination of the initial state of the seabed foundation (please see Yang and Ye (2018) [
14]; Zhang et al. (2019) [
30]), the analysis about the distribution of the initial effective stresses and pore pressure in a loose seabed floor is not presented anymore in this study.
4.1. Displacement
The cnoidal wave-induced displacement and the variation of the void ratio in the seabed floor at a typical position (
x = 100 m,
z = 28.32 m) are shown in
Figure 3. It is observed that there is a significant horizontal lateral spreading to the right side and significant vertical subsidence occurring in the seabed floor under the continuous action of the cnoidal wave. At
t = 500 s, the residual horizontal lateral spreading reaches up 45 cm, and the residual subsidence reaches up to about 7 cm (note: the initial subsidence under gravity at 5.5 cm was excluded). This significant lateral spreading is a type of the resultant phenomenon of the liquefaction or softening, which has occurred in the seabed floor caused by the pore pressure build-up. It is also interesting to find that the displacement amplitude horizontally is much less than that vertically.
The time history of the vertical displacement indicates that the loose seabed soil is continuously subsiding under the cnoidal wave continuous loading. In the meantime, the oscillatory amplitude becomes greater and greater. The phenomenon indicates that the stiffness of the soil skeleton is lost due to the reduction of effective stress between soil particles. This phenomenon is also a result of the liquefaction or softening of the seabed.
The increasing residual subsidence of seabed soil is attributed to the process where some pore water is gradually drained out through the surface of the seabed floor driven by the upward pressure gradient in the seabed floor. It has been well known that the pore pressure will be accumulated in loosely deposited seabed floors under ocean wave loading. Meanwhile, the water pressure applied on the surface of the seabed floor does not accumulate. As a consequence, an upward pore pressure gradient is formed in the upper seabed floor. The pore water in the seabed floor will be drained out, driven by this upward pore pressure gradient. Once some pore water is drained out, the space previously occupied by this pore water will be occupied by the surrounding soil particles, leading to the reduction of the void ratio of soil, as illustrated in
Figure 3. Overall, there are four types of simultaneous processes in the loosely deposited seabed floor under wave loading in total: (1) process of pore pressure buildup, (2) process of effective stress reduction, (3) process of pore water drained out, and (4) process of void ratio reduction. This mechanism is the reason why there are dense sand soils in nature. Dense sand could be evolved from loose sand in nature under dynamic loadings, such as ocean waves and seismic waves.
4.2. Effective Stress and Pore Pressure
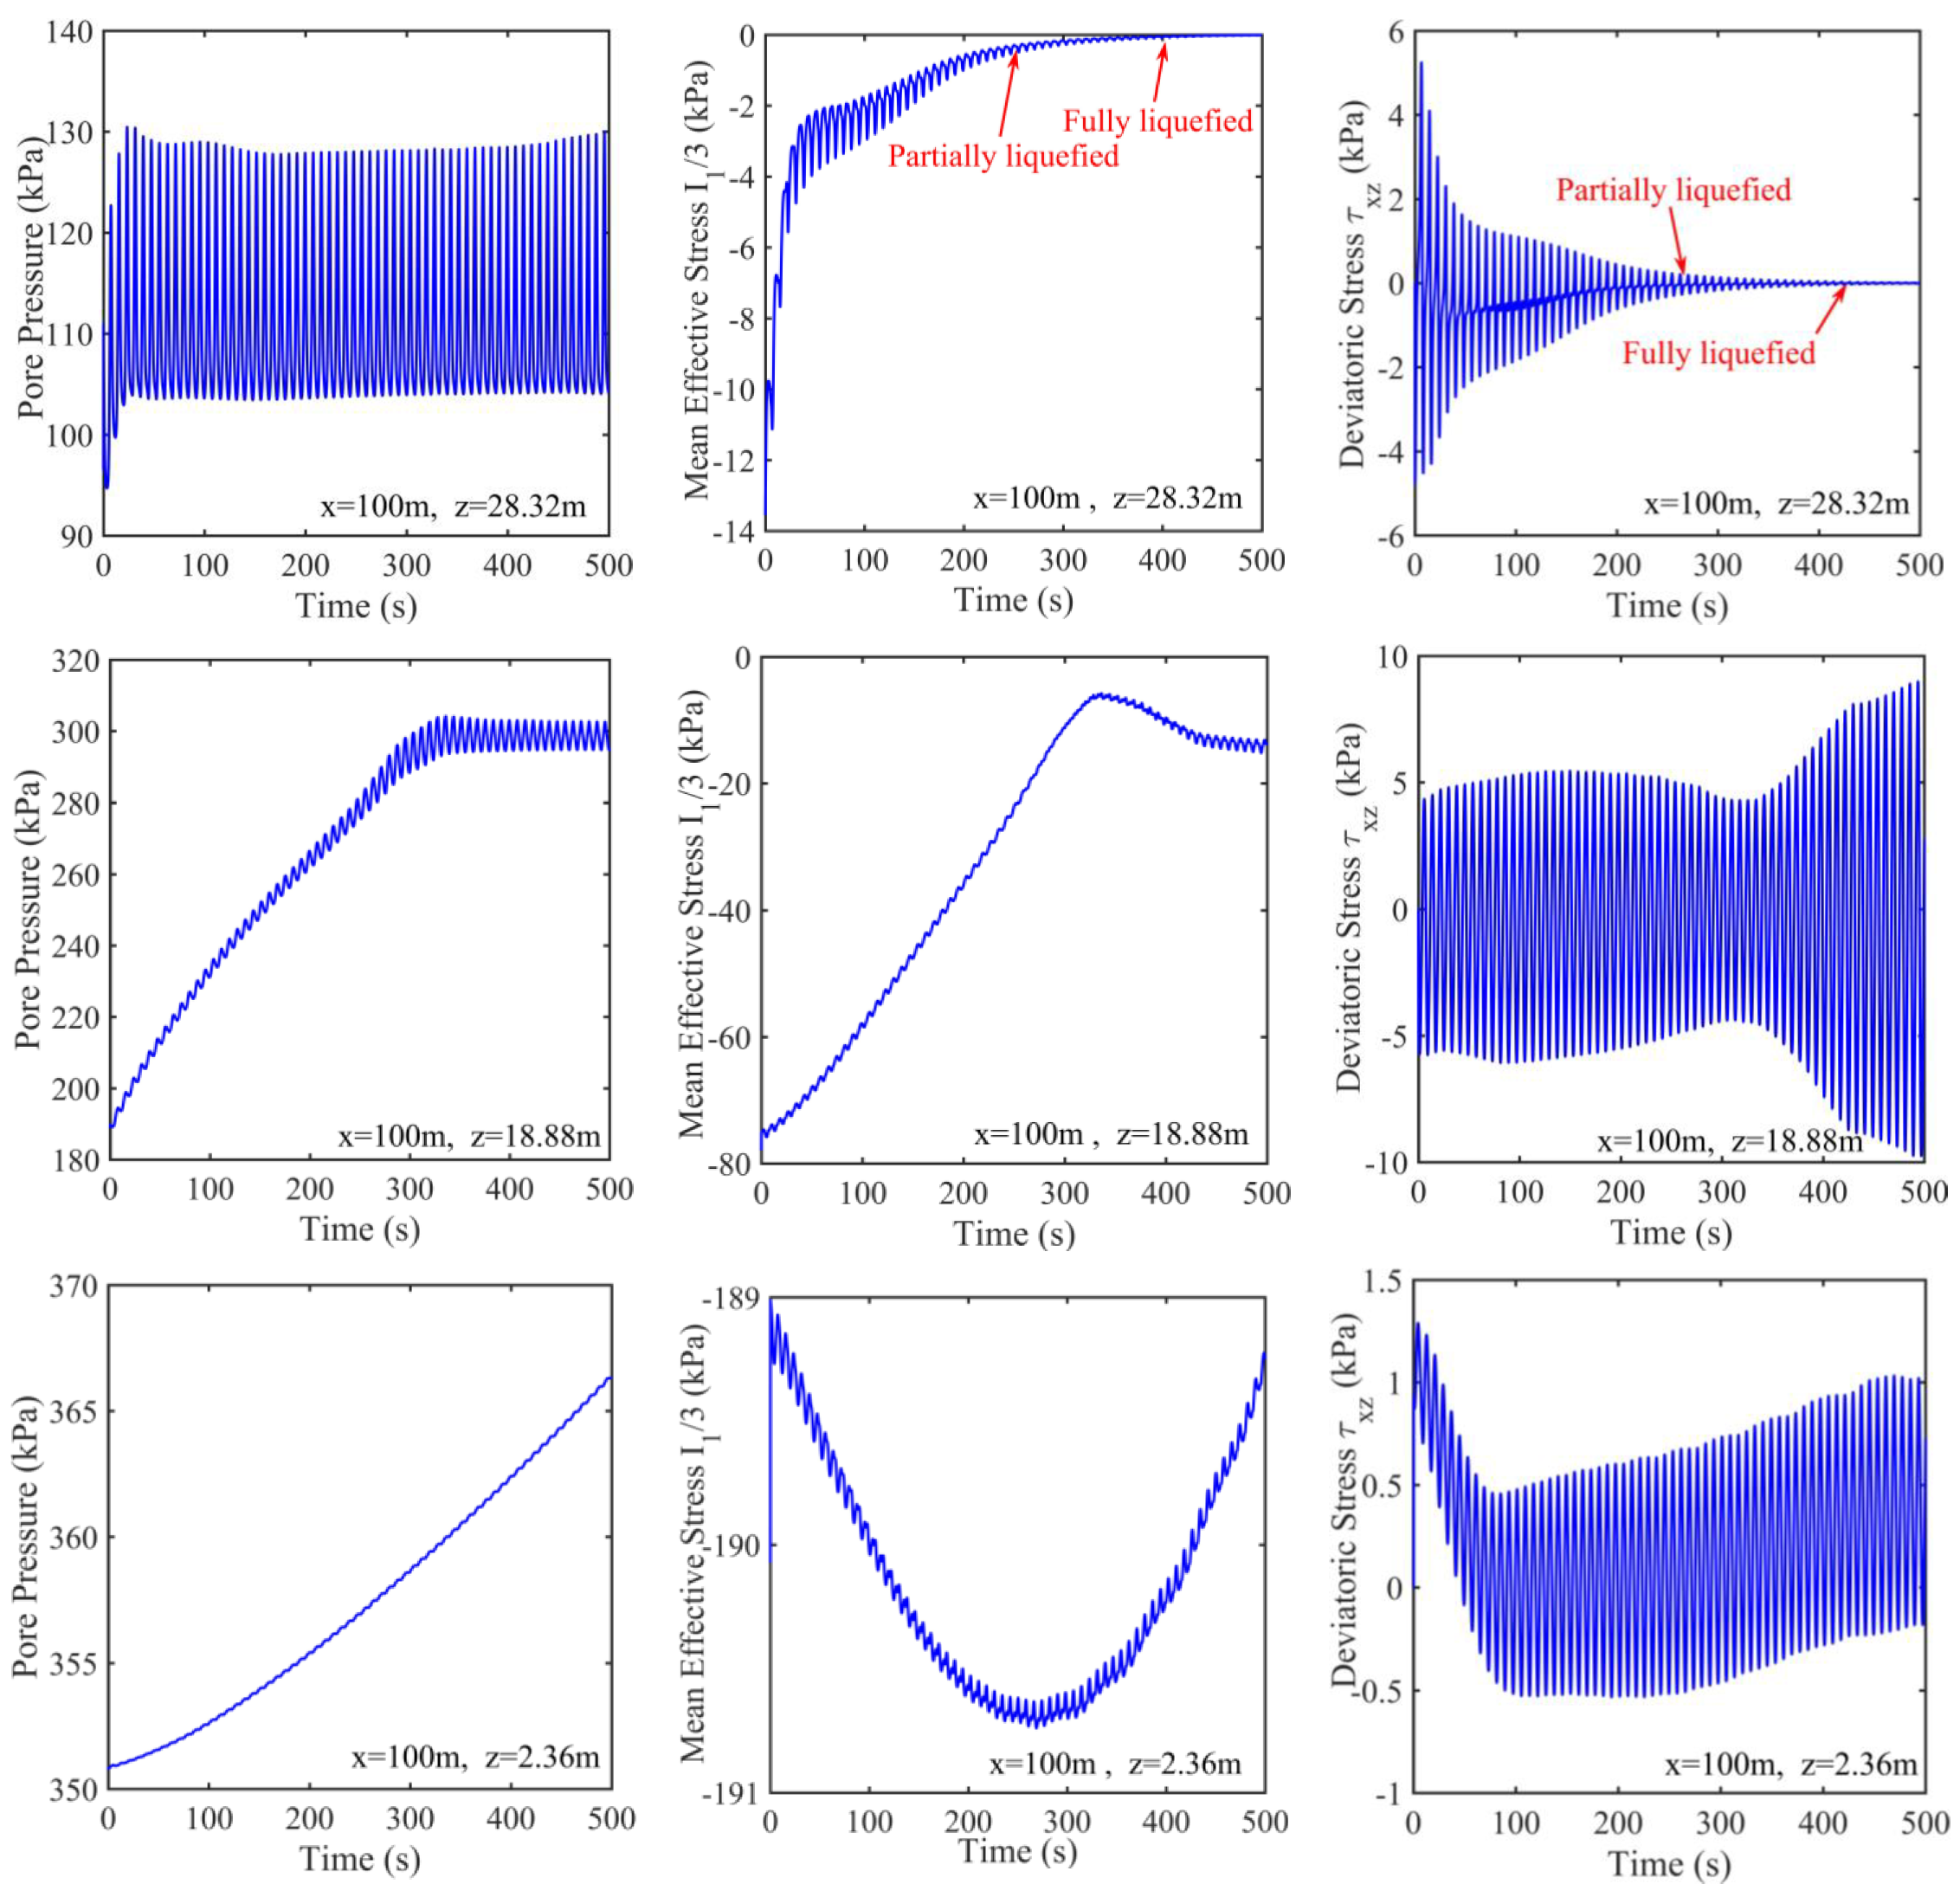
The time histories of the effective stresses at three typical buried depths on the symmetrical line
x = 100 m are demonstrated in
Figure 4. It is observed that the pore pressure at the three typical buried depths all builds up under the cnoidal wave loading. In the upper seabed floor, the residual component of pore pressure can reach a stable status (meaning that the residual pore pressure cannot accumulate anymore) within a relatively short period. In the medium depth of the seabed floor, it is about 300 s for the residual pore pressure to reach its stable status. In the lower seabed floor, it is found that the residual pore pressure does not reach its stable status until the end of the computation (
t = 500 s). It is indicated that the time for the residual pore pressure to reach its stable status is positively related to the buried depth. Another phenomenon observed is that the magnitude of the accumulated residual pore pressure in the medium depth of the seabed floor is much greater than that in the upper and lower seabed floor. It can be attributed to the fact that (1) the drainage path is relatively short and the initial effective stresses are relatively small in the upper seabed floor, and (2) the cnoidal wave-induced cyclic shear stress is not significant in the lower seabed floor. Finally, we find that the amplitude of the oscillatory component of the pore pressure is also positively related to the buried depth.
In
Figure 4, it can also be observed that the mean effective stress
I1/3 in the upper seabed floor gradually reduces, accompanying the accumulation of pore pressure. When |
I1/3| is less than a small critical value, the seabed soil will become partially liquefied first, and then sequentially become fully liquefied at the moment when |
I1/3| = 0. In the reduction process of the effective stress, the amplitude of the cnoidal wave-induced shear stress gradually becomes less and less. Finally, it becomes zero when the seabed soil becomes fully liquefied. It means that the fully liquefied seabed soil behaves like a kind of heavy fluid with great viscosity. It cannot bear any external shear loading due to the complete loss of the stiffness of the soil skeleton. The successful capture of this physical phenomenon indicates that the integrated model FSSI-CAS 2D is powerful to handle the problem of seabed dynamics. Currently, a lot of commercial software/packages do not have this capability.
In the medium part of the seabed floor, although the residual pore pressure has built up to more than 100 kPa, the mean effective stress has never reached zero. The full liquefaction cannot occur. Partial liquefaction is possible depending on the judgment criterion chosen. In the lower seabed floor, the pore pressure is only slightly accumulated under the wave loading. However, the magnitude of |I1/3| is around 190 kPa, far away from the status of partial liquefaction. Most importantly, it is found that the magnitude of effective stress is not always reduced in the accumulation process of pore pressure. It can also be increased, accompanying the pore pressure buildup. It is indicated by this phenomenon that the cnoidal wave-induced dynamics of a loose seabed floor is apparently complicated. We cannot understand these dynamics mechanisms, adopting a linear way of thinking.
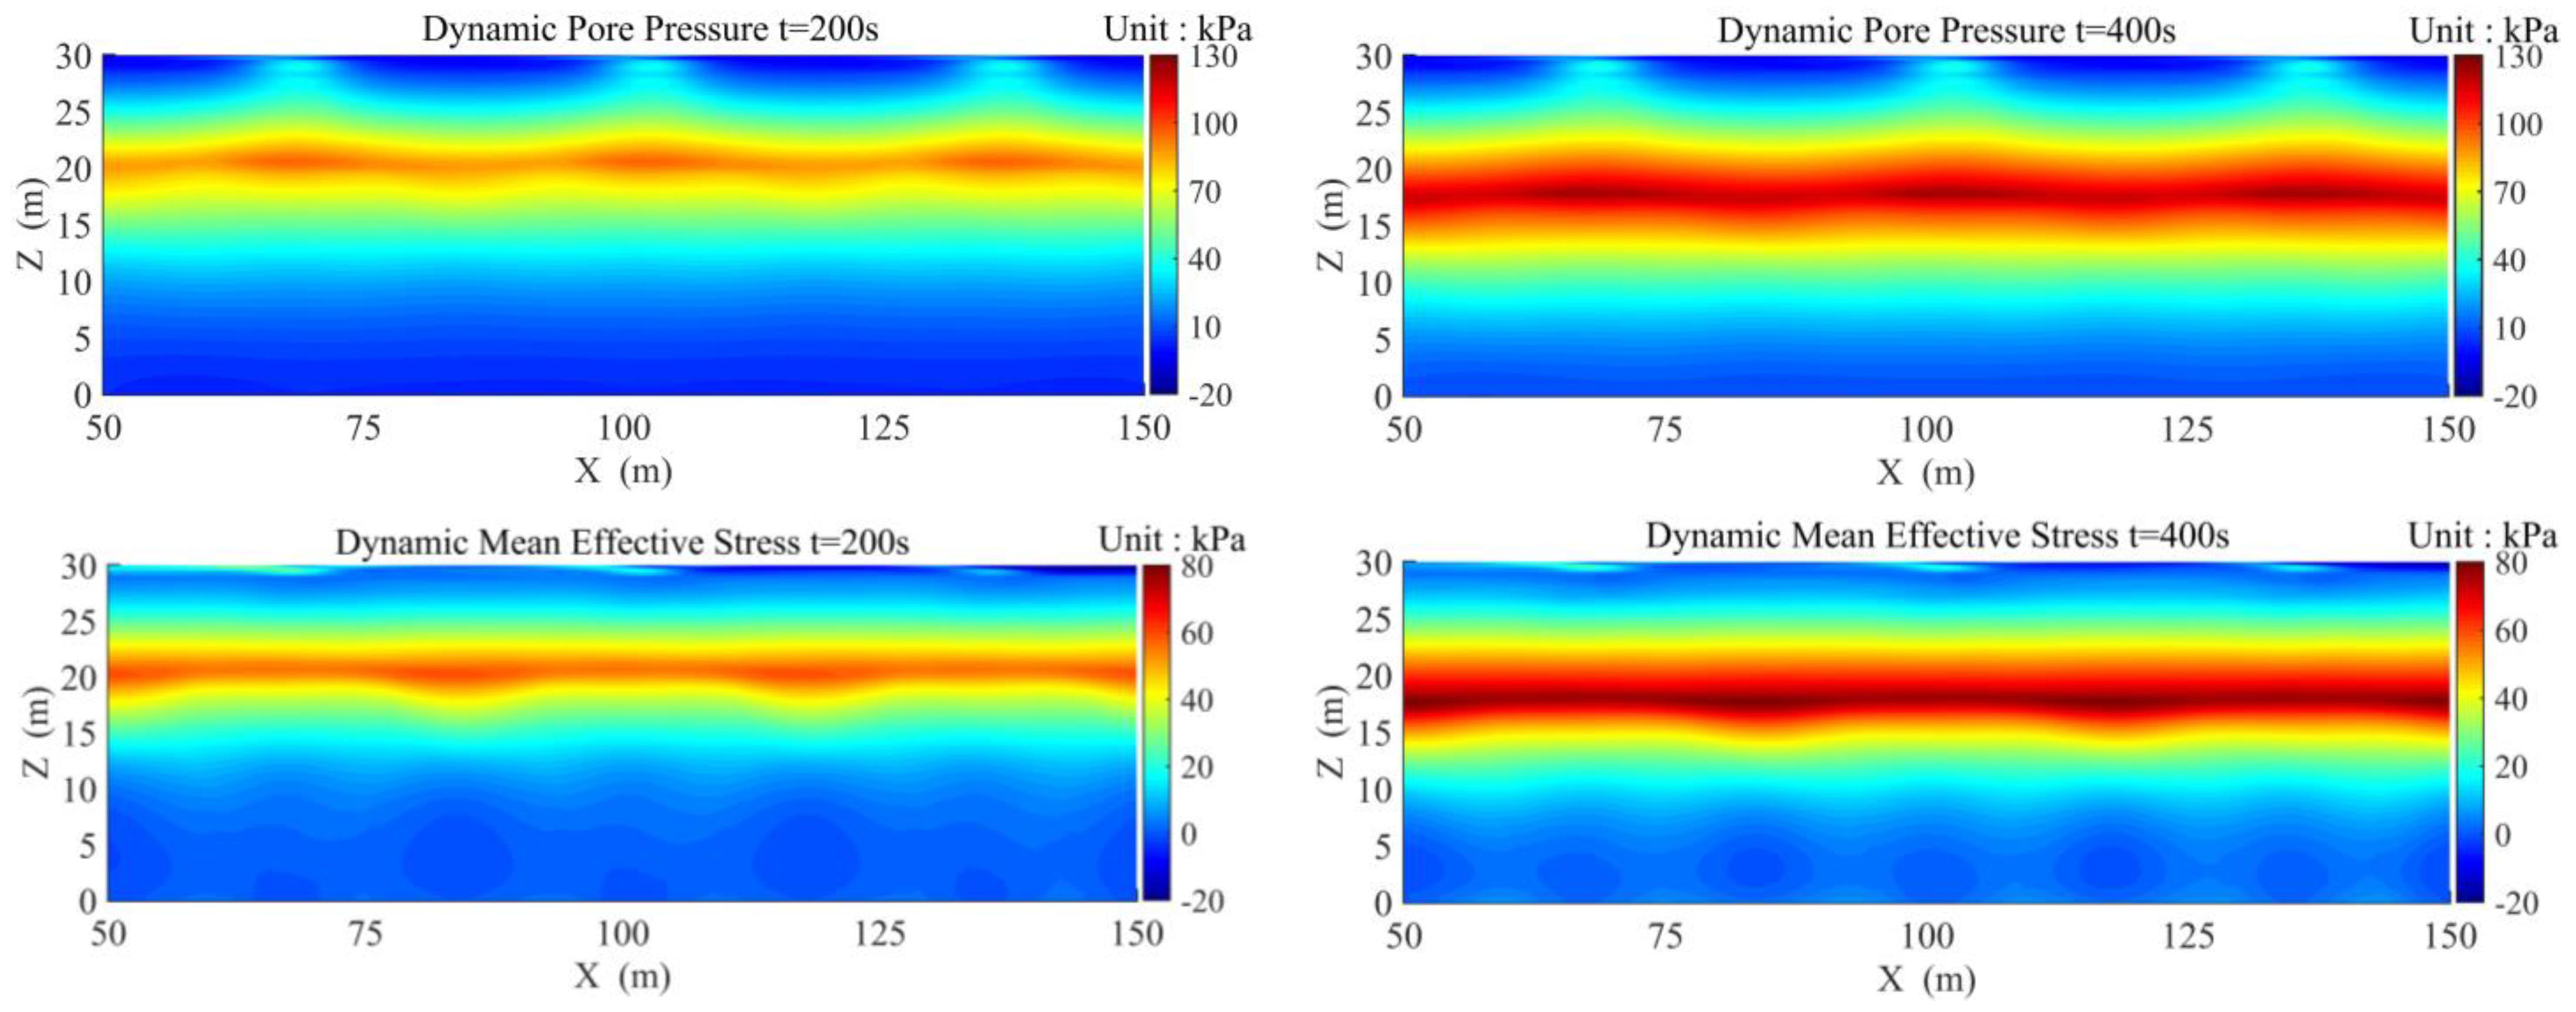
The distributions of the cnoidal wave-induced dynamic pore pressure and
I1/3 at two typical moments are illustrated in
Figure 5. It is clearly observed that the accumulation of the residual pore pressure in the range of
z = 15 to 23 m is significantly greater than that in the other parts. The reason is presented above. Correspondingly, the reduction of |
I1/3| in the range of
z = 15 to 23 m is also most obvious. It is also found that the distribution of the dynamic pore pressure and
I1/3 is not completely layered in the seabed floor. There are some wavy distributions in them.
4.3. Stress Path
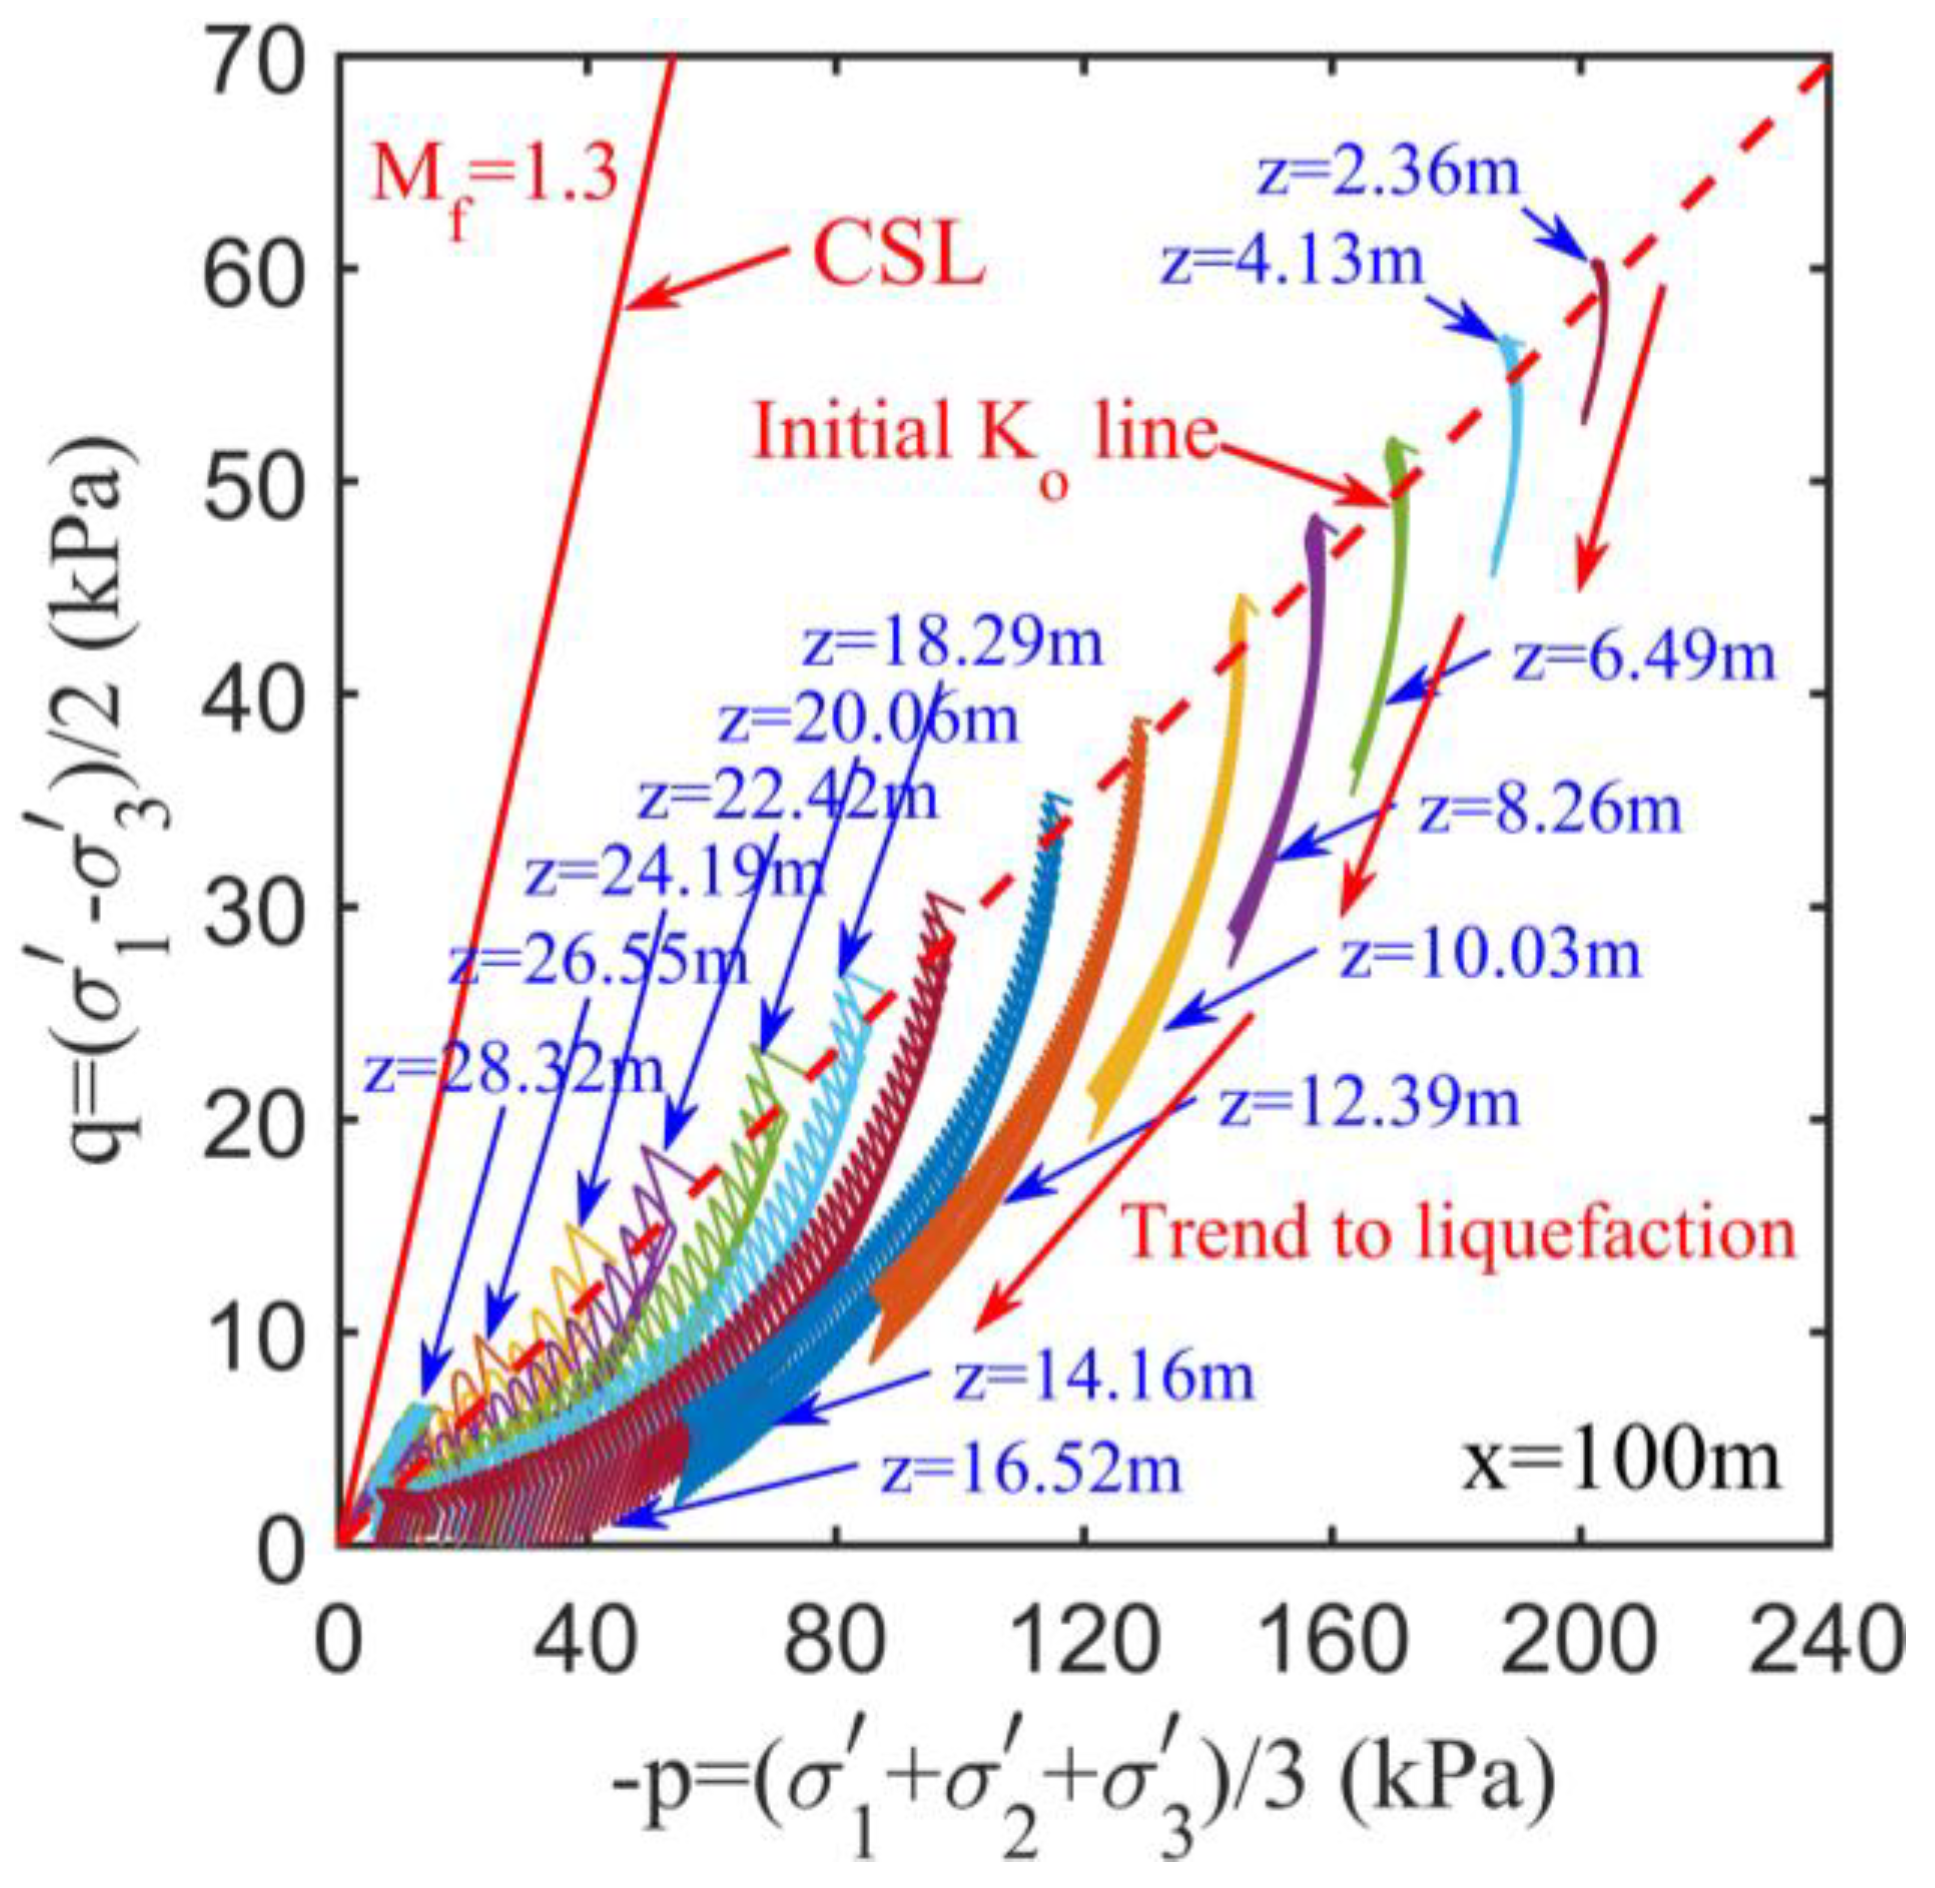
The stress paths induced by the cnoidal wave at a series of buried depths along the symmetrical line
x = 100 m are illustrated in
Figure 6. It is observed that the initial positions of stress state in the
p–
q coordinates at all buried depths are all located on the
K0 line, whose slope is much less than the slope of the critical state line (CSL). Under the continuous action of the cnoidal wave, the positions of stress state at all buried depths gradually move toward the zero point (fully liquefied status) in the
p–
q coordinates, accompanying the accumulation of pore pressure. Finally, the stress state at some buried depths (mainly located in the upper seabed floor) reaches or approaches the zero point, while they are far away from the zero point at the buried depths located in the lower seabed floor. It is indicated that only the seabed soil in the upper floor could become partially or fully liquefied.
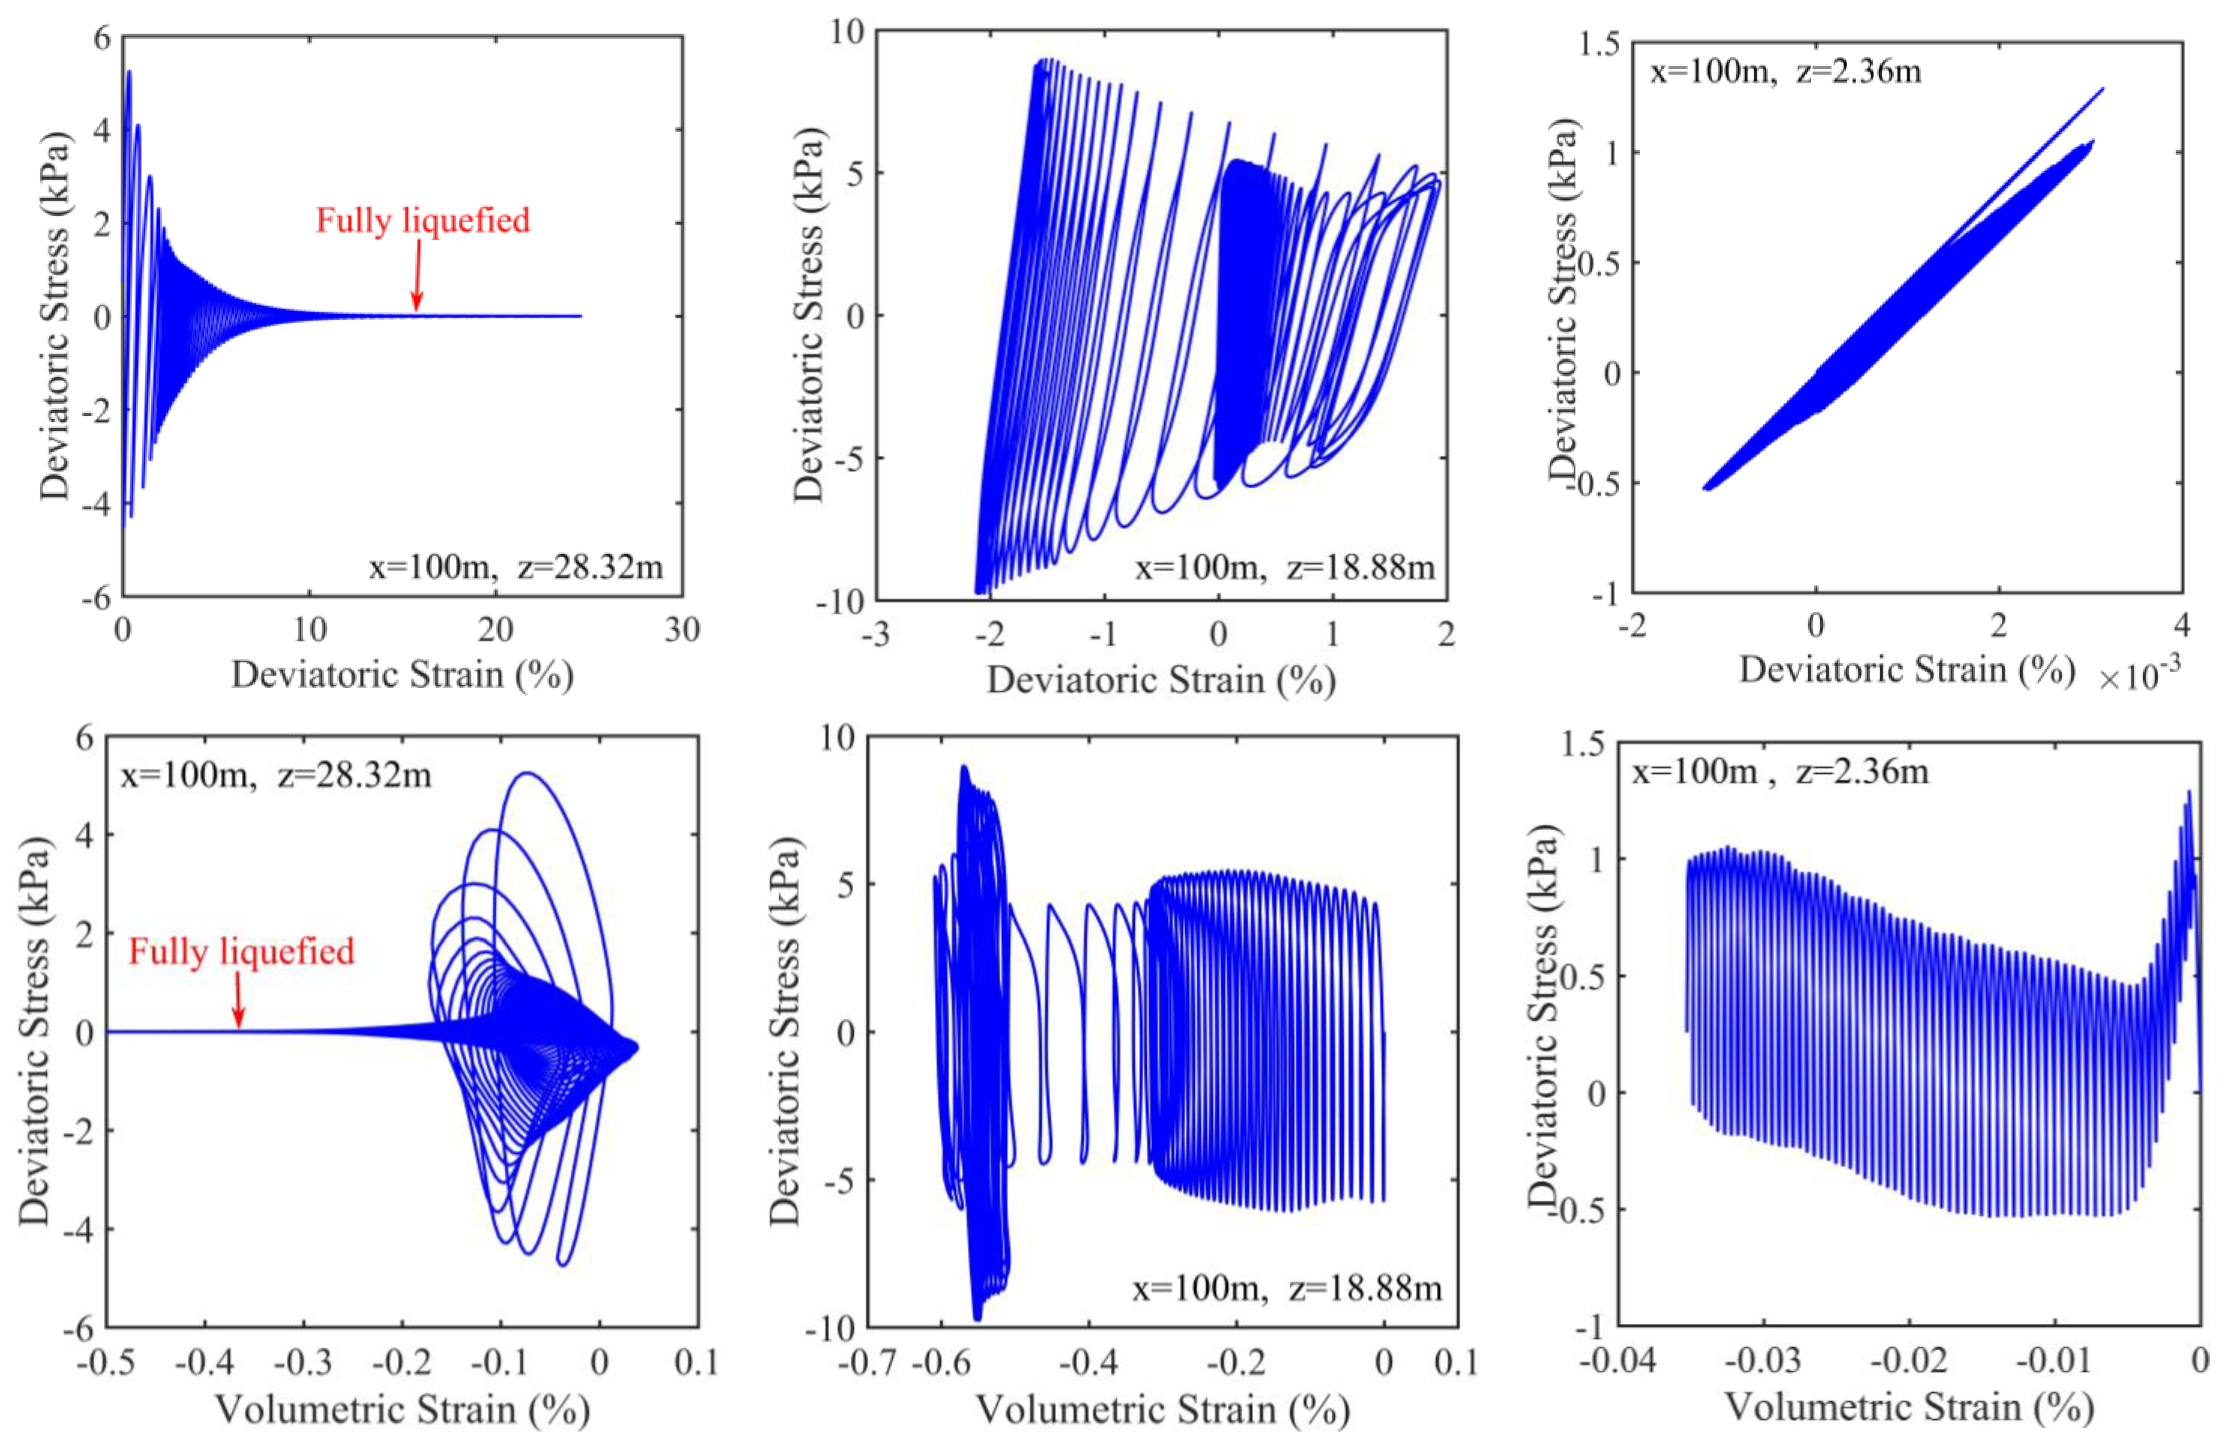
4.4. Stress–Strain Relationship
The relationship between the deviatoric stress
q and deviatoric strain
εs and volumetric strain
εv at three typical buried depths is demonstrated in
Figure 7. It is observed that the amplitude of
q is gradually reduced, accompanying the increase in
εs in the upper seabed floor. Once
q becomes zero, it means that the seabed soil at this position becomes fully liquefied. After the occurrence of full liquefaction, the deviatoric strain still significantly develops under the cnoidal wave loading. As illustrated in
Figure 7,
εs reaches up to 25% at the typical position (
x = 100 m,
z = 28.32 m) when the computation is finished. It is indicated that large deformation occurs in the upper seabed floor due to the wave-induced partial or full liquefaction. In the medium seabed floor, the magnitude of
εs is only at the order O (1%). However, the wave-induced deviatoric strain could basically be ignored in the lower seabed floor. Relative to
εs, the volumetric strain
εv is much less in the upper and medium seabed floors. Overall, it is indicated in
Figure 7 that the stress–strain relationship in the loosely deposited seabed floor is highly nonlinear and complicated under the action of the cnoidal wave.
4.5. Residual Liquefaction
There are two types of liquefaction mechanisms: momentary liquefaction and residual liquefaction. Momentary liquefaction can only occur in very dense seabed floors beneath wave troughs. Residual liquefaction generally occurs in loosely deposited seabed floors under cyclic loadings, such as wave loading and seismic loading. The occurrence of residual liquefaction is a fatal factor for the stability of offshore structures built on a loose seabed foundation. In this section, the characteristics of residual liquefaction and its process are both analyzed in the loose seabed floor.
The following stress-based criterion proposed by Yang and Ye (2018) [
14] is adopted to judge the occurrence of residual liquefaction:
where
is called liquefaction potential.
is the cnoidal wave-induced dynamic mean effective stress,
is the current mean effective stress, and
is the initial mean effective stress.
C is the cohesion of soil, and
α is a material parameter.
is actually the term characterizing the liquefaction resistance of soil, in which the contribution of the cohesion of soil to enhance the resistance ability against liquefaction is considered. In this study, the seabed floor is set as cohesiveness sand soil, leading to
C = 0 kPa.
is a critical value to judge whether residual liquefaction has occurred or not, whose value is dependent on the properties of soil. Wu (2004) [
31] suggested that
is in the range of 0.78–0.99. For Nevada sand related to the model parameters listed in
Table 1,
= 0.86 was proposed by Ye et al. (2015) [
32].
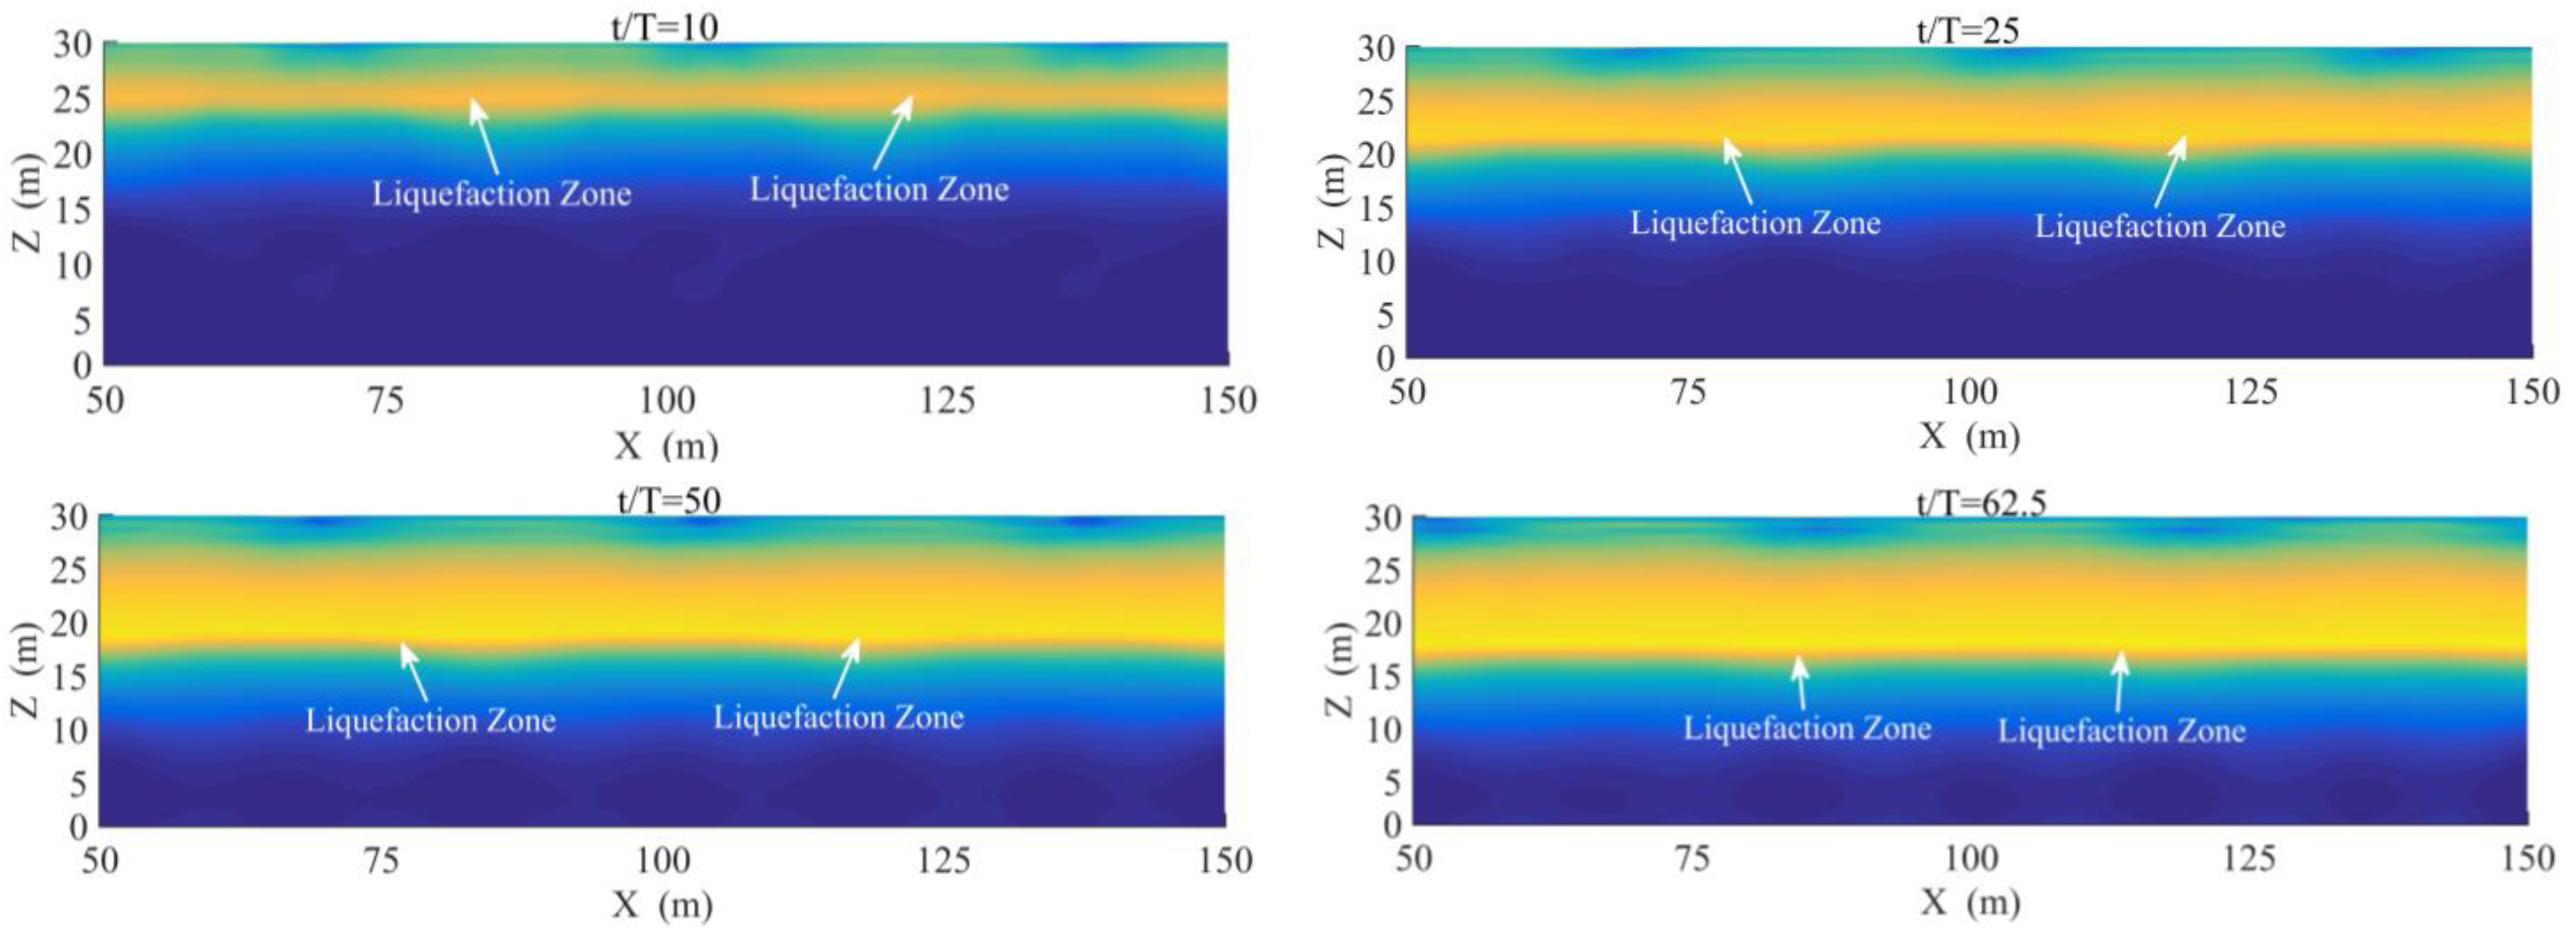
The distributions of
Lpotential along
x = 100 m at four typical times are illustrated in
Figure 8. It is observed that the liquefaction potential along
x = 100 m is gradually increased over time under the action of the cnoidal wave. If
= 0.86 is taken as the critical value for the occurrence of residual liquefaction, then we can find that the liquefaction depth is gradually increased from the upper part into the medium part of the seabed floor. At
t = 500 s, the final depth of the liquefaction zone is about 14 m. In the lower seabed floor, there is no residual liquefaction occurring. This phenomenon can be more clearly observed in
Figure 9. It is shown in
Figure 9 that the liquefaction zone is gradually enlarging from the upper to the medium part of the seabed floor in the process of wave application. Finally, the frontier of the residual liquefaction zone reaches the position
z = 16 m, indicating that the thickness of the liquefaction zone is 14 m.
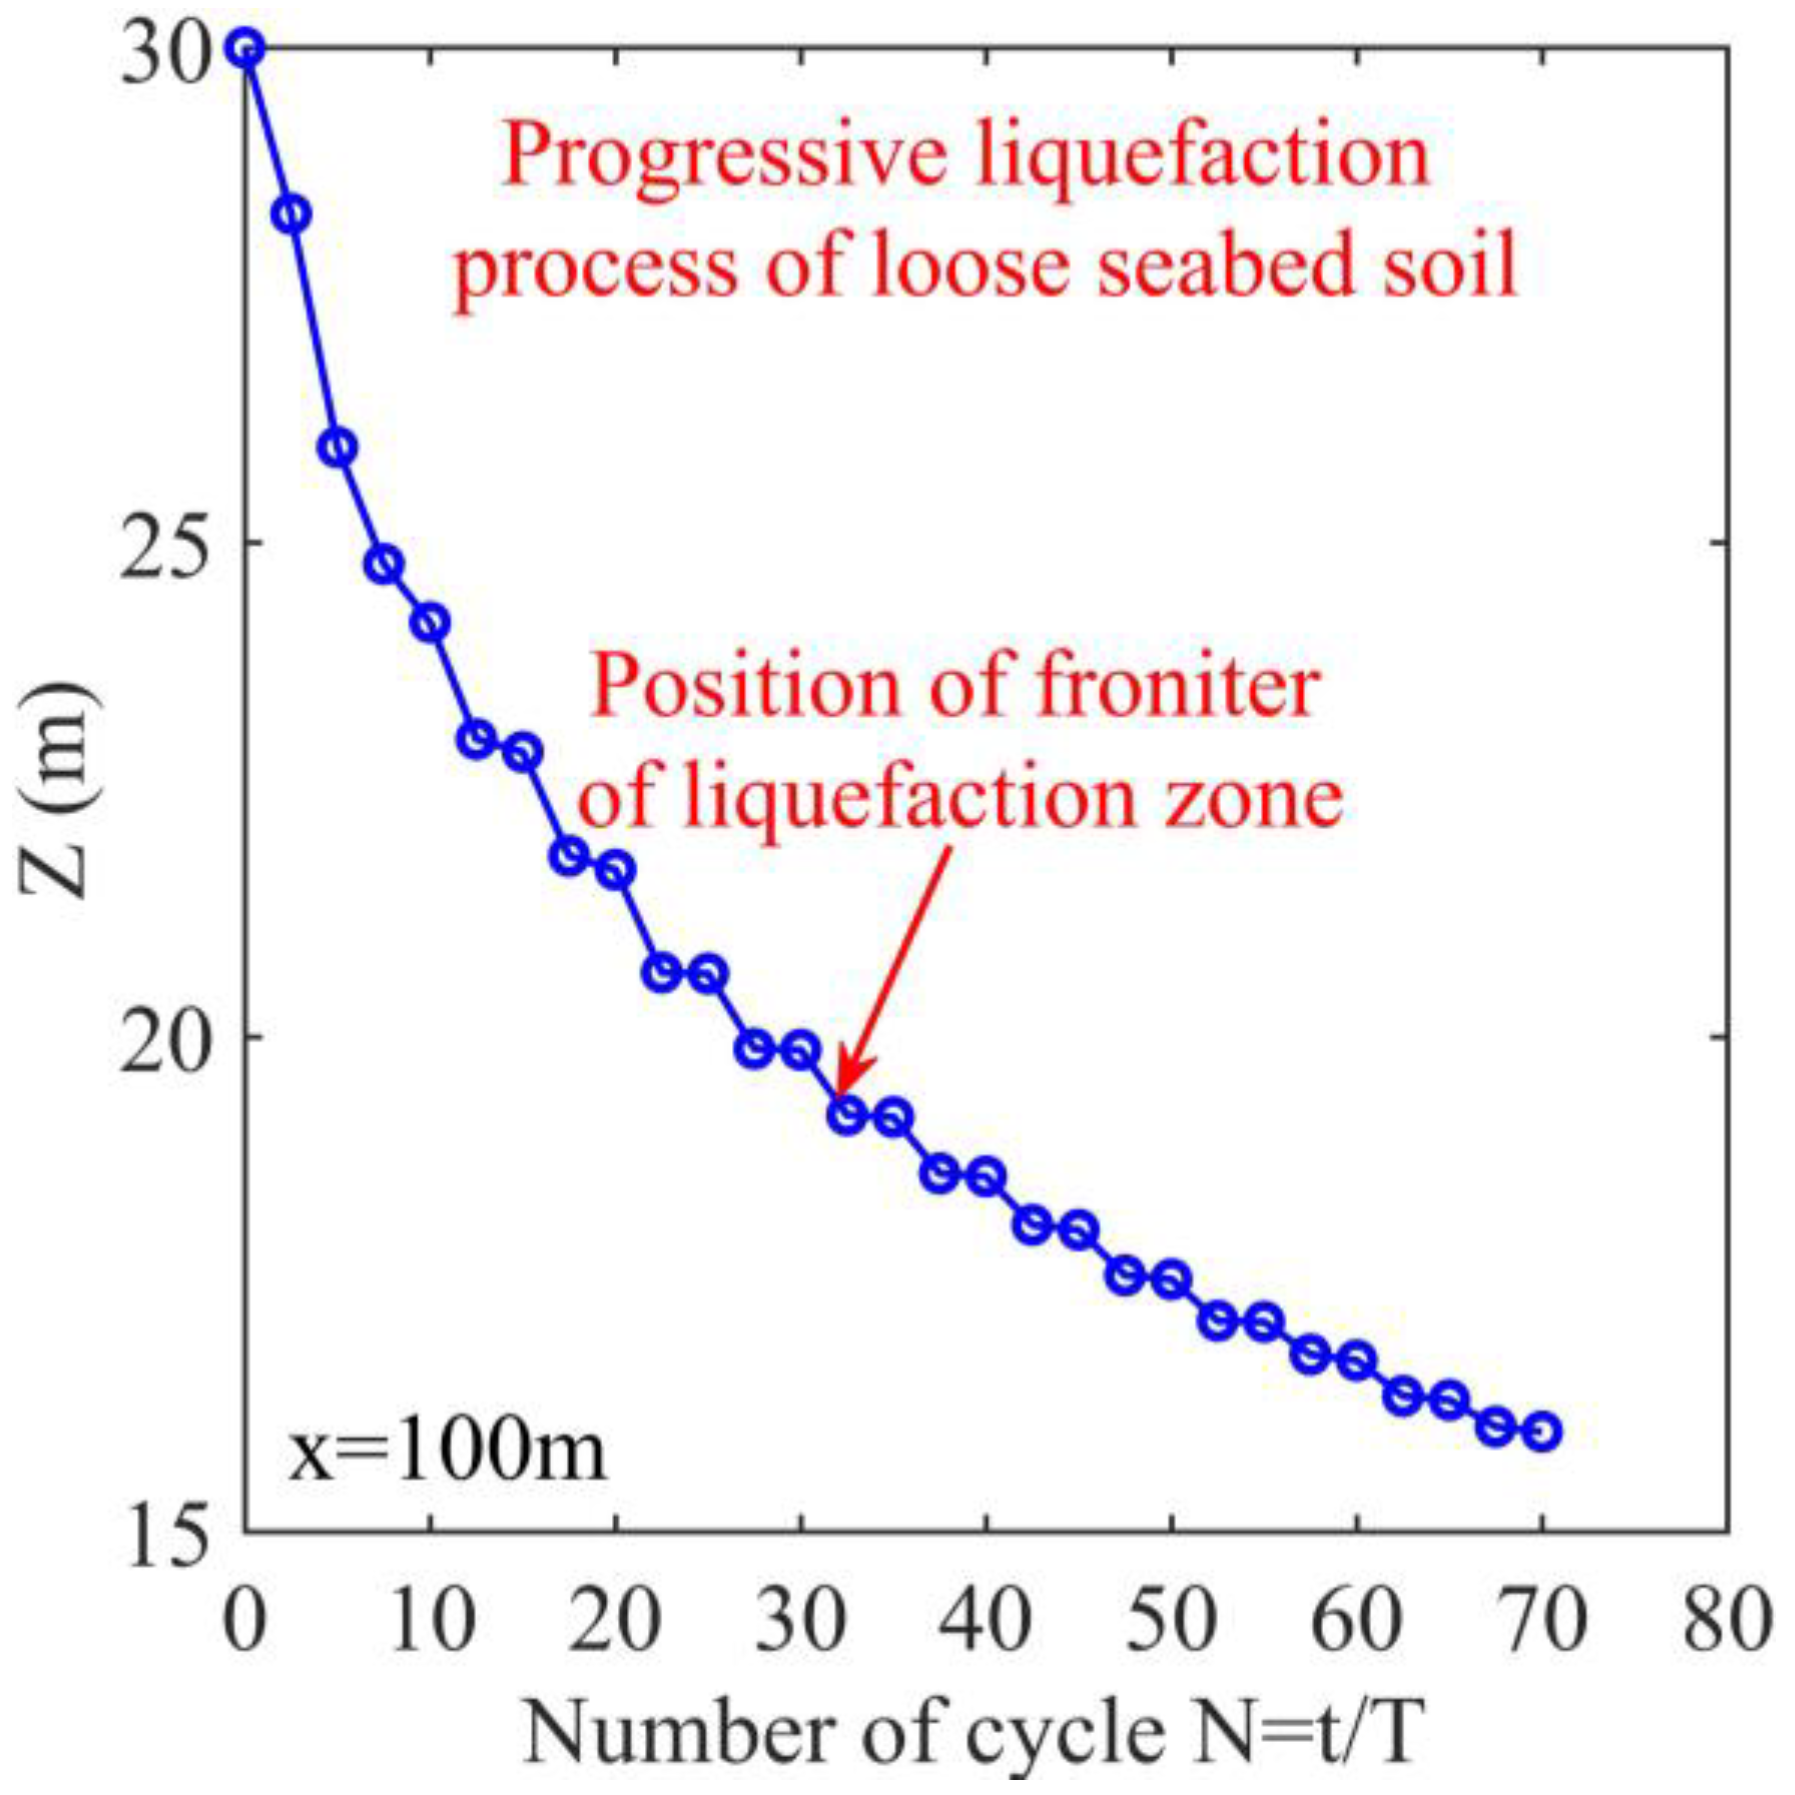
The above analysis has more or less implied that the residual liquefaction first occurs in the upper part, and then gradually transmits toward the lower part of the seabed floor.
Figure 10 exactly proves this progressive process. It is observed that the residual liquefaction first occurs at the seabed surface, and then the liquefaction zone gradually enlarges toward the bottom of the seabed floor. Finally, the frontier of the liquefaction zone reaches
z = 16 m.
Residual pore pressure is the direct driven factor for the residual liquefaction. Its distribution characteristics along
x = 100 m at different times are demonstrated in
Figure 11, where the distribution characteristics of the oscillatory pore pressure are also presented. It is observed that the residual pore pressure along the seabed depth is gradually increasing with time. However, the growth is not infinite but controlled by the line of liquefaction resistance
. It means that the residual pore pressure cannot be greater than
at any time and any buried depth. An interesting phenomenon in the pore pressure oscillation distribution is that there has always been an inflection point in the vertical distribution. The vertical position of the inflection point is different with time. Compared with the position of the liquefaction zone frontier, it is found that the positions of these inflection points on the vertical distributions of the oscillatory pore pressure are basically the same as the positions of the liquefaction zone frontier at the same times. This mechanism could be taken as another evidence for the judgment of the occurrence of residual liquefaction.
4.6. Parametric Study
The effects of the permeability and saturation of seabed soil, as well as the wave types on the progressive liquefaction process are demonstrated in
Figure 12. It is found that the permeability and saturation of seabed soil both have a significant effect on the liquefaction process and the final liquefaction depth. The final liquefaction depth in the loose seabed floor is negatively related to the soil permeability and positively related to the saturation of seabed soil. If the third-order Stokes wave theory is utilized to formulate the hydrodynamic loading on the surface of the seabed floor, the progressive liquefaction process in the loose seabed floor is also illustrated in
Figure 12. It is found that the final depth of the liquefaction zone is greatly overestimated if the third-order Stokes wave theory is utilized. It reminds us that a nonlinear cnoidal wave theory must be adopted for the waves with great height in shallow water. Otherwise, the predicted results will not be reliable.


