Article

Cooperative Buffering Schemes for Time-Shifted Live Streaming of Distributed Appliances

1
Department of Computer Engineering, Hongik University, Seoul 04066, Korea
2
Puloon Technology Inc., Seoul 06721, Korea
3
School of Computer Science and Engineering, Konkuk University, Seoul 05029, Korea
*
Author to whom correspondence should be addressed.
Appl. Sci. 2021, 11(23), 11527; https://doi.org/10.3390/app112311527
Submission received: 1 November 2021 / Revised: 2 December 2021 / Accepted: 3 December 2021 / Published: 5 December 2021
(This article belongs to the Special Issue Distributed Computing Systems and Applications)

Abstract

:
Distributed appliances connected to the Internet have provided various multimedia services. In particular, networked Personal Video Recorders (PVRs) can store broadcast TV programs in their storage devices or receive them from central servers, enabling people to watch the programs they want at any desired time. However, the conventional CDNs capable of supporting a large number of concurrent users have limitations in scalability because more servers are required in proportion to the increased users. To address this problem, we have developed a time-shifted live streaming system over P2P networks so that PVRs can share TV programs with each other. We propose cooperative buffering schemes to provide the streaming services for time-shifted periods even when the number of PVRs playing back at the periods is not sufficient; we do so by utilizing the idle resources of the PVRs playing at the live broadcast time. To determine which chunks to be buffered, they consider the degree of deficiency and proximity and the ratio of playback requests to chunk copies. Through extensive simulations, we show that our proposed buffering schemes can significantly extend the time-shifting hours and compare the performance of two buffering schemes in terms of playback continuity and startup delay.

1. Introduction

With advances in computer technologies and networks, Internet-connected home appliances capable of providing various multimedia services have recently become prevalent. In particular, digital TVs with Personal Video Recorder (PVR) functionality can store broadcast programs in their built-in storage devices [1,2,3]. Thus, as long as live TV programs are stored during their broadcasting times, they can be kept time-shifted from live broadcast time without missing any parts of them. Thus, people can watch the TV programs they want at any desired time.
However, there are limitations on the availability of time-shifted programs due to the limited number of reception channels and storage capacity. Since each PVR has a small number of tuners, the number of channels through which it can receive programs simultaneously is also small. The time-shifting hours of TV programs that PVRs can support are also limited since the programs already stored must be replaced with newly broadcast programs due to limited storage capacity. Accordingly, only parts of the programs that have already been watched or explicitly recorded can be time-shifted within the PVR’s storage capacity.
To overcome these limitations, PVRs connected to broadband receive broadcast programs from central servers even though they have not stored the programs in their storage space [4]. To provide these networked PVR services with a large number of concurrent users in real time, it is essential to provide sufficient network bandwidth and fast responses to interactive operations. To this end, large-scale Content Delivery Networks (CDNs) have been employed to minimize the transmission delay between clients and servers by placing proxy servers close to clients [5,6,7]. CDNs can provide sufficient reliability and manageability for providing streaming services with a huge number of concurrent users without quality degradation, although they require a substantial investment in distributed CDN infrastructures to ensure timely delivery to the enormous users. It is also obvious that, as the number of users increases, ISPs or service providers must invest more in expanding resources including the number of servers and network bandwidth to accommodate the increased users.
To mitigate the burden of CDN’s increasing investment in infrastructure, we employ P2P technologies [8,9,10] where aggregate resources of the system scale with the number of users without additional investment for the services. Note that as more peers join the P2P systems, better resiliency and the faster data transmission can be provided because the peers bring network bandwidth, disk storage capacity, computing power, and memory resources together with them. This indicates that P2P systems are more scalable in terms of cost, compared to CDNs owned by ISPs or service providers, when expanding the service capacity of the systems. It is noted that they are also scalable in terms of the number of concurrent users. One popular commercial P2P live streaming system, PPLive, showed that it could use only 10 Mbps server bandwidth to serve 1.48 million concurrent users at a total consumption rate of 592 Gbps [11]. Thus, PVRs can share TV programs with each other over P2P networks at a low cost, providing a program distribution channel as an alternative to the unidirectional broadcasting network [12,13]. It is also obvious that P2P technologies can provide a significant service cost reduction by minimizing server intervention. PVRs basically provide time-shifting functions such as pause/resume, skip-forward/backward, fast-forward/rewind so that users can quickly move to any playback position they want. To receive the data required for playback when moving to any position, a PVR should receive data from other PVRs playing back around the position.
As shown in Figure 1, however, the popularity of live TV programs typically reaches the peak within several minutes after their broadcast times and exponentially decreases afterwards [14]. Thus, as a PVR moves to an earlier position time-shifted from the live broadcast time, the number of PVRs playing back at the position reduces rapidly, making it difficult for the PVR to receive necessary data from neighbors. It is obvious that its playback quality worsens since it is harder to satisfy a minimum number of neighbor PVRs required for playback. When they are eventually unable to obtain necessary data due to lack of neighbor PVRs storing them, they have to receive them from servers. This situation keeps PVRs from using advantages of P2P technologies, including scalability and low cost.
In this paper, we therefore propose efficient cooperative buffering schemes to provide streaming services without service disruption for time-shifted periods from the live broadcast time even when the number of PVRs playing back in these periods is not sufficient [15]. We have observed that, since PVRs playing TV programs back at the live broadcast time can receive broadcast signals directly through their tuners and decode them with hardware devices, they do not need to exchange data with other PVRs or buffer them. Thus, our proposed buffering schemes can utilize the idle resources of the PVRs playing back at the live broadcast time for buffering, cooperating with each other.
If PVRs do not cooperate to buffer broadcast programs to support each other’s time-shifting, they can time-shift only the parts of the programs that have been played back before. On the contrary, our buffering schemes enable people to watch any TV program from the beginning even if the broadcasting of the program has already started or even ended. That is, people can watch any broadcast program at any time, even on the channels they have not turned on before.
To determine which chunks are to be buffered, our proposed Degree of Deficiency and Proximity ( D _ D P )-based scheme prioritizes all time ranges depending on two factors: how deficient the number of copies of chunks is at each time range and how close to the live broadcast time the time range is [16]. To further improve performance, the Ratio of Playback Requests to Chunk Copies ( R _ R C )-based scheme considers the ratio of the number of actual requests to that of chunk copies already buffered. This scheme can evaluate the priority of each time range more accurately by evaluating the number of actual requests to be processed subsequently.
By utilizing the existing resources efficiently without investing more in expanding service capacity of the system, our proposed schemes can further improve the performance of time-shifted live streaming system. They can also adaptively adjust their computation loads depending on request arrival rates and computation capacity of tracker servers. Furthermore, they can be leveraged to alleviate the resource consumption on CDNs when employing both P2P networks and CDNs.
Through extensive simulations, we show that our proposed buffering schemes can significantly extend the time-shifting hours compared with when PVRs buffer the broadcast programs independently of each other. We also compare the performance of the two buffering schemes in terms of playback continuity and startup delay while varying the buffer size, playback request distribution, and the number of participating PVRs.
This paper is organized as follows: Section 2 describes work related to this paper. Section 3 describes our two proposed buffering schemes in detail. Section 4 compares the experimental results of the two buffering schemes. Finally, Section 5 offers conclusions.

2. Related Work

In addition to recent advances in information technologies, the proliferation in smart devices such as PVRs equipped with built-in storage devices have enabled people to watch video in a convenient way [1,2,3]. However, unless the PVRs are connected to broadband, they can support only limited time-shifting hours due to the shortage of their local storage space. To overcome this problem, networked PVRs with broadband connections have been developed so that they can receive data from a network.
On the other hand, video data traffic on the Internet have been growing rapidly and are predicted to be 82% of all Internet traffic in 2022 [17]. The increasing demands for VOD services, over-the-top (OTT) services such as Netflix, and time-shifted TV services are expected to continue driving this trend. To meet the demands of the tremendous amount of network traffic, CDNs have been employed by providing highly managed and globally distributed infrastructure as reliable backbones for video delivery. From a cost perspective, however, it is necessary to alleviate the burdens caused by the increasing video traffic on CDNs since CDNs require significant investments for expanding their services. To address the scalability issue in terms of cost, P2P technology has been employed as an alternative approach to CDNs [8,9,10]. Note that available resource capacity in P2P systems increases with the number of peers without additional investment.
Increasing buffering efficiency has been one of the most important research topics in P2P streaming systems because peers can play videos back without delays by exchanging the data each of them is currently buffering. To improve the system performance, it is therefore critical to make each peer keep buffering the data needed by others. Thus, many buffering schemes have been proposed in P2P VOD and live streaming systems [18,19,20,21,22]. However, they have different environments from time-shifted streaming systems. That is, peers store the entire part of each video on their storage devices in P2P VOD systems, while they receive live broadcast data generated on the fly in the time-shifted streaming systems. Smaller buffers in a main memory are used to buffer a shorter time period around live broadcast, and video data are received only from servers or other peers in P2P live streaming systems, while the reserved local storage space is used to time-shift live broadcast programs, and video data can be also received directly through broadcast channels in the time-shifted streaming systems. Therefore, the existing buffering schemes for P2P VOD and live streaming cannot be applied directly to the time-shifted streaming, and relatively fewer studies have been thus conducted on buffering techniques for time-shifted live streaming. They have tried to increase the availability of data required by PVRs based on different methods. In P2TSS [12], the authors proposed a buffering scheme to reduce the amount of data received from servers by increasing the hit ratio even though peers locally decide which blocks to cache for sharing with others through distributed cache algorithms. In [13], authors proposed a buffering scheme to adjust the ratio of caching and prefetching areas in a buffer of each peer according to its relative playback position in each playback group.
Unlike these existing studies, in this paper, we propose cooperative buffering schemes to exploit the characteristics of P2P time-shifted streaming that are different from existing P2P VOD and live streaming. Our contributions are twofold: first, we extend the time-shifting hours significantly and improve the performance by utilizing the idle resources of PVRs playing at the live broadcast time that are otherwise unused. Second, we present how to reduce the computational complexity by adaptively adjusting evaluation loads depending on request arrival rates and computation capacity of tracker servers.

3. Cooperative Buffering Schemes for Time-Shifted Live Streaming

In this section, we propose two cooperative buffering schemes for P2P time-shifted live streaming among networked PVRs. We first describe the overall architecture of our system. We then explain the schemes based on the Degree of Deficiency and Proximity (D _ D P ) and the R _ R C (Ratio of Playback Requests to Chunk Copies) in detail.

3.1. Overall System Architecture

Our P2P time-shifted live streaming system consists of streaming servers, a tracker server, and PVRs, as shown in Figure 2. The streaming servers store all TV programs after having received them directly through broadcasting channels. They also have sufficient network bandwidth to transmit a large number of programs to PVRs simultaneously. When a PVR cannot receive necessary data from other PVRs due to lack of available chunks, the streaming servers immediately transmit them to avoid service interruption.
The tracker server coordinates our time-shifted live streaming services by managing the buffering and transmission of broadcast programs among PVRs. First of all, to schedule buffering live programs in the system, it periodically collects the current status information including the current playback position of each PVR and the degree of deficiency and the number of playback requests of each chunk. Based on this information, the tracker server requests the PVRs playing back at the broadcast time to buffer the chunks of broadcast programs assigned to themselves. To support the playback of buffered programs, it also maintains necessary information including a list of available TV programs and the current connection status of each PVR. When a PVR moves to the desired playback position using time-shifting functions such as skip-forward/rewind and fast-forward/rewind, the tracker server gives the PVR a list of neighbor PVRs playing back around the position. After receiving a certain number of chunks from neighbor PVRs, the PVR then starts to play them back. The tracker server also maintains a skip list capable of keeping a list of PVRs according to playback positions to quickly retrieve the PVRs playing back around the desired position.
Note that we employ the mesh-pull based P2P networks to provide the streaming services and the combined storage spaces reserved for time-shifted live streaming among PVRs form a virtual storage space for cooperating to buffer and exchange live programs.

3.2. Buffering Based on Degree of Deficiency and Proximity

To determine which chunks should be buffered, this buffering scheme considers the following two factors: deficiency degree of a chunk at each playback period and proximity degree from the live broadcast time to reflect playback request distributions over time. Thus, this is called the Degree of Deficiency and Proximity ( D _ D P )-based scheme in this paper. In other words, this scheme prioritizes each period depending on how deficient the number of chunk copies is in the period and how close to the live broadcast time the period is.
In P2P streaming systems based on mesh-pull structures, peers exchange data with each other in chunks. To inform other peers of its current buffering status, each PVR sends buffermap messages indicating which chunks are already buffered and which ones are not. In this scheme, the tracker server can thus figure out how many copies of each chunk are buffered among PVRs by collecting their buffermaps periodically.
To derive the criteria to determine the target period for buffering, we first evaluate the chunk deficiency degree at each period. Table 1 summarizes the symbols used throughout this paper, and Figure 3 shows the number of chunk copies at each period. p i indicates i-th period away from the live broadcast time. C p i represents the number of copies of the corresponding chunk to p i , implying that the same number of PVRs are currently storing the chunk.
Q p i denotes whether or not p i is qualified for the minimum requirement on the number of neighbor PVRs to playback the chunk without quality degradation. That is, if C p i is equal to or greater than the minimum required number of neighbor PVRs considering their average uploading capacities denoted by M I N n b , then Q p i becomes 1, and it otherwise becomes 0, as in Equation (1).
Q p i = 1 if C p i MIN nb 0 otherwise
We can also obtain the ratio of the qualified periods to all the periods belonging to t r ( i , b ) by dividing k = i i + b 1 Q p k by b. b and t r ( i , b ) denote the buffer size of each PVR in periods or chunks and the time range starting at p i ending at p i + b 1 . Note that b and M I N n b are set to 5 and 2, respectively, in Figure 3. D D t r ( i , b ) represents the deficiency degree of chunks, i.e., the ratio of the unqualified periods to all the periods belonging to t r ( i , b ) calculated by subtracting the ratio from 1, as in Equation (2).
D D t r ( i , b ) = 1 k = i i + b 1 Q p k b
Equation (2) indicates that, as the value of D D t r ( i , b ) increases, the number of buffered chunks during t r ( i , b ) becomes more deficient. Thus, it is necessary to make more copies of chunks for the time range so that PVRs can play them back without quality degradation during the time range.
We also need to consider the fact that, as mentioned above, playback requests are skewed to several minutes after the live broadcast time and the number of requests sharply decreases afterwards. This implies that more copies of chunks should be buffered for the periods closer to the live broadcast time to support more concurrent playback requests. To reflect this trend of the playback request distribution over time periods, we first calculate the relative distance of t r ( i , b ) from the live broadcast time based on its middle period, as in i + b 1 2 T P , where T P denotes the total number of periods during the entire time-shifting hours. We can then evaluate P D t r ( i , b ) indicating the proximity degree from the live broadcast time to t r ( i , b ) by subtracting the distance from 1, as in Equation (3).
P D t r ( i , b ) = 1 i + b 1 2 T P
It can be seen from Equation (3) that, as the value of P D t r ( i , b ) becomes larger, playback requests belonging to t r ( i , b ) become more popular since the time range becomes closer to the live broadcast time. This also implies that more copies of chunks are needed to accommodate all the concurrent playback requests during the time range. As mentioned above, since the PVRs playing back at the live broadcast time receive TV signals directly through their tuners, they need neither to exchange them with other PVRs nor to buffer them. Thus, the tracker server requests those PVRs to buffer the chunks belonging to some periods before the live broadcast time by utilizing their idle resources needed for buffering.
To select the time range that is likely to contribute the most to the system performance, the tracker server considers the criteria of D D t r ( i , b ) and P D t r ( i , b ) as shown in Equation (4):
max i = 0 T P b 1 { D D t r ( i , b ) × w + P D t r ( i , b ) × ( 1 w ) }
The tracker server evaluates D D t r ( i , b ) and P D t r ( i , b ) of each time range by sliding the buffer-sized window by one period. The time range with a maximum value among all the candidates is selected so that the PVRs playing at the live broadcast time can buffer more copies of the most needed chunks.
In Equation (4), w is the weight value between D D t r ( i , b ) and P D t r ( i , b ) . Thus, w can be adjusted depending on the system environment, especially the program popularity distribution over periods. If the playback requests of PVRs are relatively more concentrated around the live broadcast time, we need to decrease w so that the portion of P D t r ( i , b ) can be given more weight. On the contrary, in the situation where it is a more important factor for performance improvement to make more copies of insufficient chunks since the requests are less concentrated around the broadcast time, it is necessary to increase w so that the portion of D D t r ( i , b ) can be reflected more.

3.3. Buffering Based on Ratios of Playback Requests to Chunk Copies

The above D _ D P -based buffering scheme determines the time ranges to be buffered, based on not only the playback request distribution over time, but also the number of copies of each chunk that are currently buffered, irrespective of the number of actual requests to be processed subsequently. In fact, the number of actual playback requests for each chunk may be different from its estimated number based on its current number. For example, in Figure 4, the total number of chunk copies at t r ( k + 5 , 5 ) is eight, while that at t r ( k , 5 ) is seven. According to the D _ D P -based scheme, of the two time ranges, t r ( k , 5 ) will be selected since the D D t r ( k , 5 ) value is larger and P D t r ( k , 5 ) values are also larger. However, we can see that the numbers of actual requests at t r ( k , 5 ) and t r ( k + 5 , 5 ) are 12 and 22, respectively. That is, the number of actual requests at t r ( k + 5 , 5 ) is almost twice that at t r ( k , 5 ) . This indicates that the chunks at t r ( k + 5 , 5 ) should be buffered more urgently to prevent playback quality disruption. To determine the priority of each time range for buffering more accurately, we therefore propose the Ratio of Playback Requests to Chunk Copies ( R _ R C )-based scheme to consider the ratio of the number of actual requests to be processed subsequently to that of chunk copies already buffered.
In our time-shifted live streaming system based on P2P networks, PVRs exchange data with each other on the mesh-pull structure. They periodically receive the buffermaps of neighbor PVRs and identify which PVRs are storing necessary chunks. After explicitly requesting each necessary chunk to neighbor PVRs, they eventually receive it. By investigating buffermaps of all PVRs, as shown in Figure 4, the tracker server can thus determine how many copies of each chunk among PVRs are actually requested and already buffered.
To derive how to determine the time range to be buffered, we first calculate both the number of copies of each chunk actually requested at p i , denoted by N R p i , and the number of its copies already buffered at p i , denoted by N C p i , as shown in Figure 4. For example, since five PVRs actually requested the chunk and two already buffered it at p k + 5 , N R p k + 5 and N C p k + 5 become 5 and 2, respectively. We can also obtain the average numbers of actual playback requests and buffered copies of chunks during t r ( i , b ) , denoted by A R t r ( i , b ) and A C t r ( i , b ) , respectively, as in Equations (5) and (6).
A R t r ( i , b ) = k = i i + b 1 N R p k b
A C t r ( i , b ) = k = i i + b 1 N C p k b
The tracker server finally selects the time range with a maximum value of the ratio of A R t r ( i , b ) and A C t r ( i , b ) , as in Equation (7).
min i = 0 T P b 1 A R t r ( i , b ) A C t r ( i , b )
Note that, as the ratio increases, the PVRs playing back at the corresponding time range should process relatively more requests compared to the number of chunk copies already buffered. This indicates that, to further improve the performance, it is required to buffer more chunk copies for the time range with a higher ratio.
On the other hand, when a PVR moves from the live broadcast time to another playback position by carrying out time-shifted functions, they stop buffering the chunks assigned previously and start to buffer the chunks having been played back for their own time-shifting. It is also noted that, when there is no room to store newly coming chunks in the storage spaces reserved for time-shifting, the earliest buffered chunks are replaced with the new ones.

3.4. Computational Complexity

In this subsection, we analyze the computational complexity of our proposed cooperative buffering schemes and present how to reduce it depending on computation loads and capacity of tracker servers. In both D _ D P - and R _ R C -based schemes, tracker servers should perform two tasks of determining the time ranges to be buffered when any PVRs start to playback live broadcast and periodically updating the aggregate buffermap information in the system.
First, for the task to determine the target time ranges to be buffered, they should evaluate D D t r ( i , b ) , P D t r ( i , b ) , A R t r ( i , b ) , and A C t r ( i , b ) per p i while i varies from 1 to T P . This indicates that the computational complexity of this task is O ( T P ) , since we assume the tracker servers evaluate them for each period. However, the complexity can be reduced considerably, i.e., to O ( T P b · r b ) simply by evaluating them every b · r b periods, not every single period. Note that r b represents a partial ratio of b. Moreover, if we employ more than one tracker server, the loads on each tracker server can be reduced to O ( T P b · r b · N t s ) where N t s represents the number of tracker servers in the system.
Second, the tracker servers should also update the aggregate buffermap information in the system reflecting the current buffering status of all PVRs. The information is used to evaluate the criteria for determining the time ranges to be buffered in both D _ D P and R _ R C -based schemes. The computational complexity of this task is O ( b ) since b chunks are updated in the aggregate buffermap each time the track server receives one buffermap from PVRs. However, this complexity can be also reduced to O ( b g ) simply by making each period consist of a group of g chunks, not one chunk. We can further reduce the complexity by decreasing the total number of update operations per second. Let N p , a p , λ b , and I u denote the total number of PVRs in the system, the availability of each PVR, the number of buffermap transmissions per PVR per second, and the aggregate buffermap update interval in multiples of λ b in a tracker server, respectively. We can evaluate the average number of participating PVRs at a specific time by multiplying N p by a p . Since the tracker server receives buffermaps at a rate of λ b per PVR per second, the total number of buffermaps received from all participating PVRs for one second is λ b · N p · a p . To alleviate the loads for the tracker server to perform the aggregate buffermap update operations, it may not perform the operations each time it receives one buffermap. In addition, the loads can be distributed on more than one tracker server. We can eventually reduce the number of the update operations performed by one tracker server for one second to λ b · N p · a p I u · N t s .
To support our time-shifted live streaming services in real time, we determine the number of tracker servers adaptively, depending on the request arrival rate in the system ( λ a ) and the request service rate of each tracker server ( μ t s ). To accommodate all the requests without quality disruption, the number of tracker servers ( N t s ) should be at least λ a μ t s . Thus, our buffering schemes employ additional tracker servers or restrict the number of requests to be admitted as λ a increases. Note that μ t s can be obtained by investigating the maximum number of requests being served while the average playback continuity of all the requests is over a predetermined percentage. It is also noted that our proposed schemes can further achieve the computation offloading of PVRs by removing the exchange of the keep-alive messages between PVRs, instead maintaining the aggregate buffermap to verify if each PVR is still participating in the network.

4. Experimental Results

To show the effectiveness of our cooperative buffering schemes for time-shifted live streaming of PVRs, we performed extensive simulations in a PeerSim P2P simulator. We set backbone network bandwidth to 10 Gbps and set the ratio of the bandwidth between a PVR and a router so that the portions of 100 Mbps, 50 Mbps, 20 Mbps, and 10 Mbps could be 10%, 50%, 20%, and 20%, respectively. The maximum number of neighbors of each PVR and the minimum required number of neighbors to playback without quality degradation, i.e., M I N n b , were set to six and four, respectively. The inter-arrival and inter-leaving rates followed a Poisson distribution with a mean of 3400 s. The playback rate of each program is 720 Kbps, and it is divided at a rate of three chunks per second. The size of each chunk was 30 KB, and each PVR buffers at least 45 chunks corresponding to 15 s before initial playback. However, note that a PVR can receive 45 chunks more quickly, i.e., without waiting for 15 s, if it runs under good conditions. Table 2 shows the simulation parameters used in this section.
To compare the performance of our proposed schemes according to the buffer size, we changed it to 150, 300, and 450 s. To reflect the fact that a large portion of playback requests are concentrated near the live broadcasting time and the others are dispersed over the entire time-shifting hours, we used three types of playback request distributions according to the degree of concentration of playback requests around the live broadcast time: distribution 1 (the highest concentration degree), distribution 2 (the middle one), and distribution 3 (the lowest one), as shown in Figure 5. To show the performance of the schemes according to the number of participating PVRs, we also varied it between 1200 and 2400.
In this section, we compare the performance of our proposed buffering schemes based on D _ D P with different w values and R _ R C with each other in terms of playback continuity and startup delay while varying the parameters of buffer size, playback request distribution, and the number of PVRs.

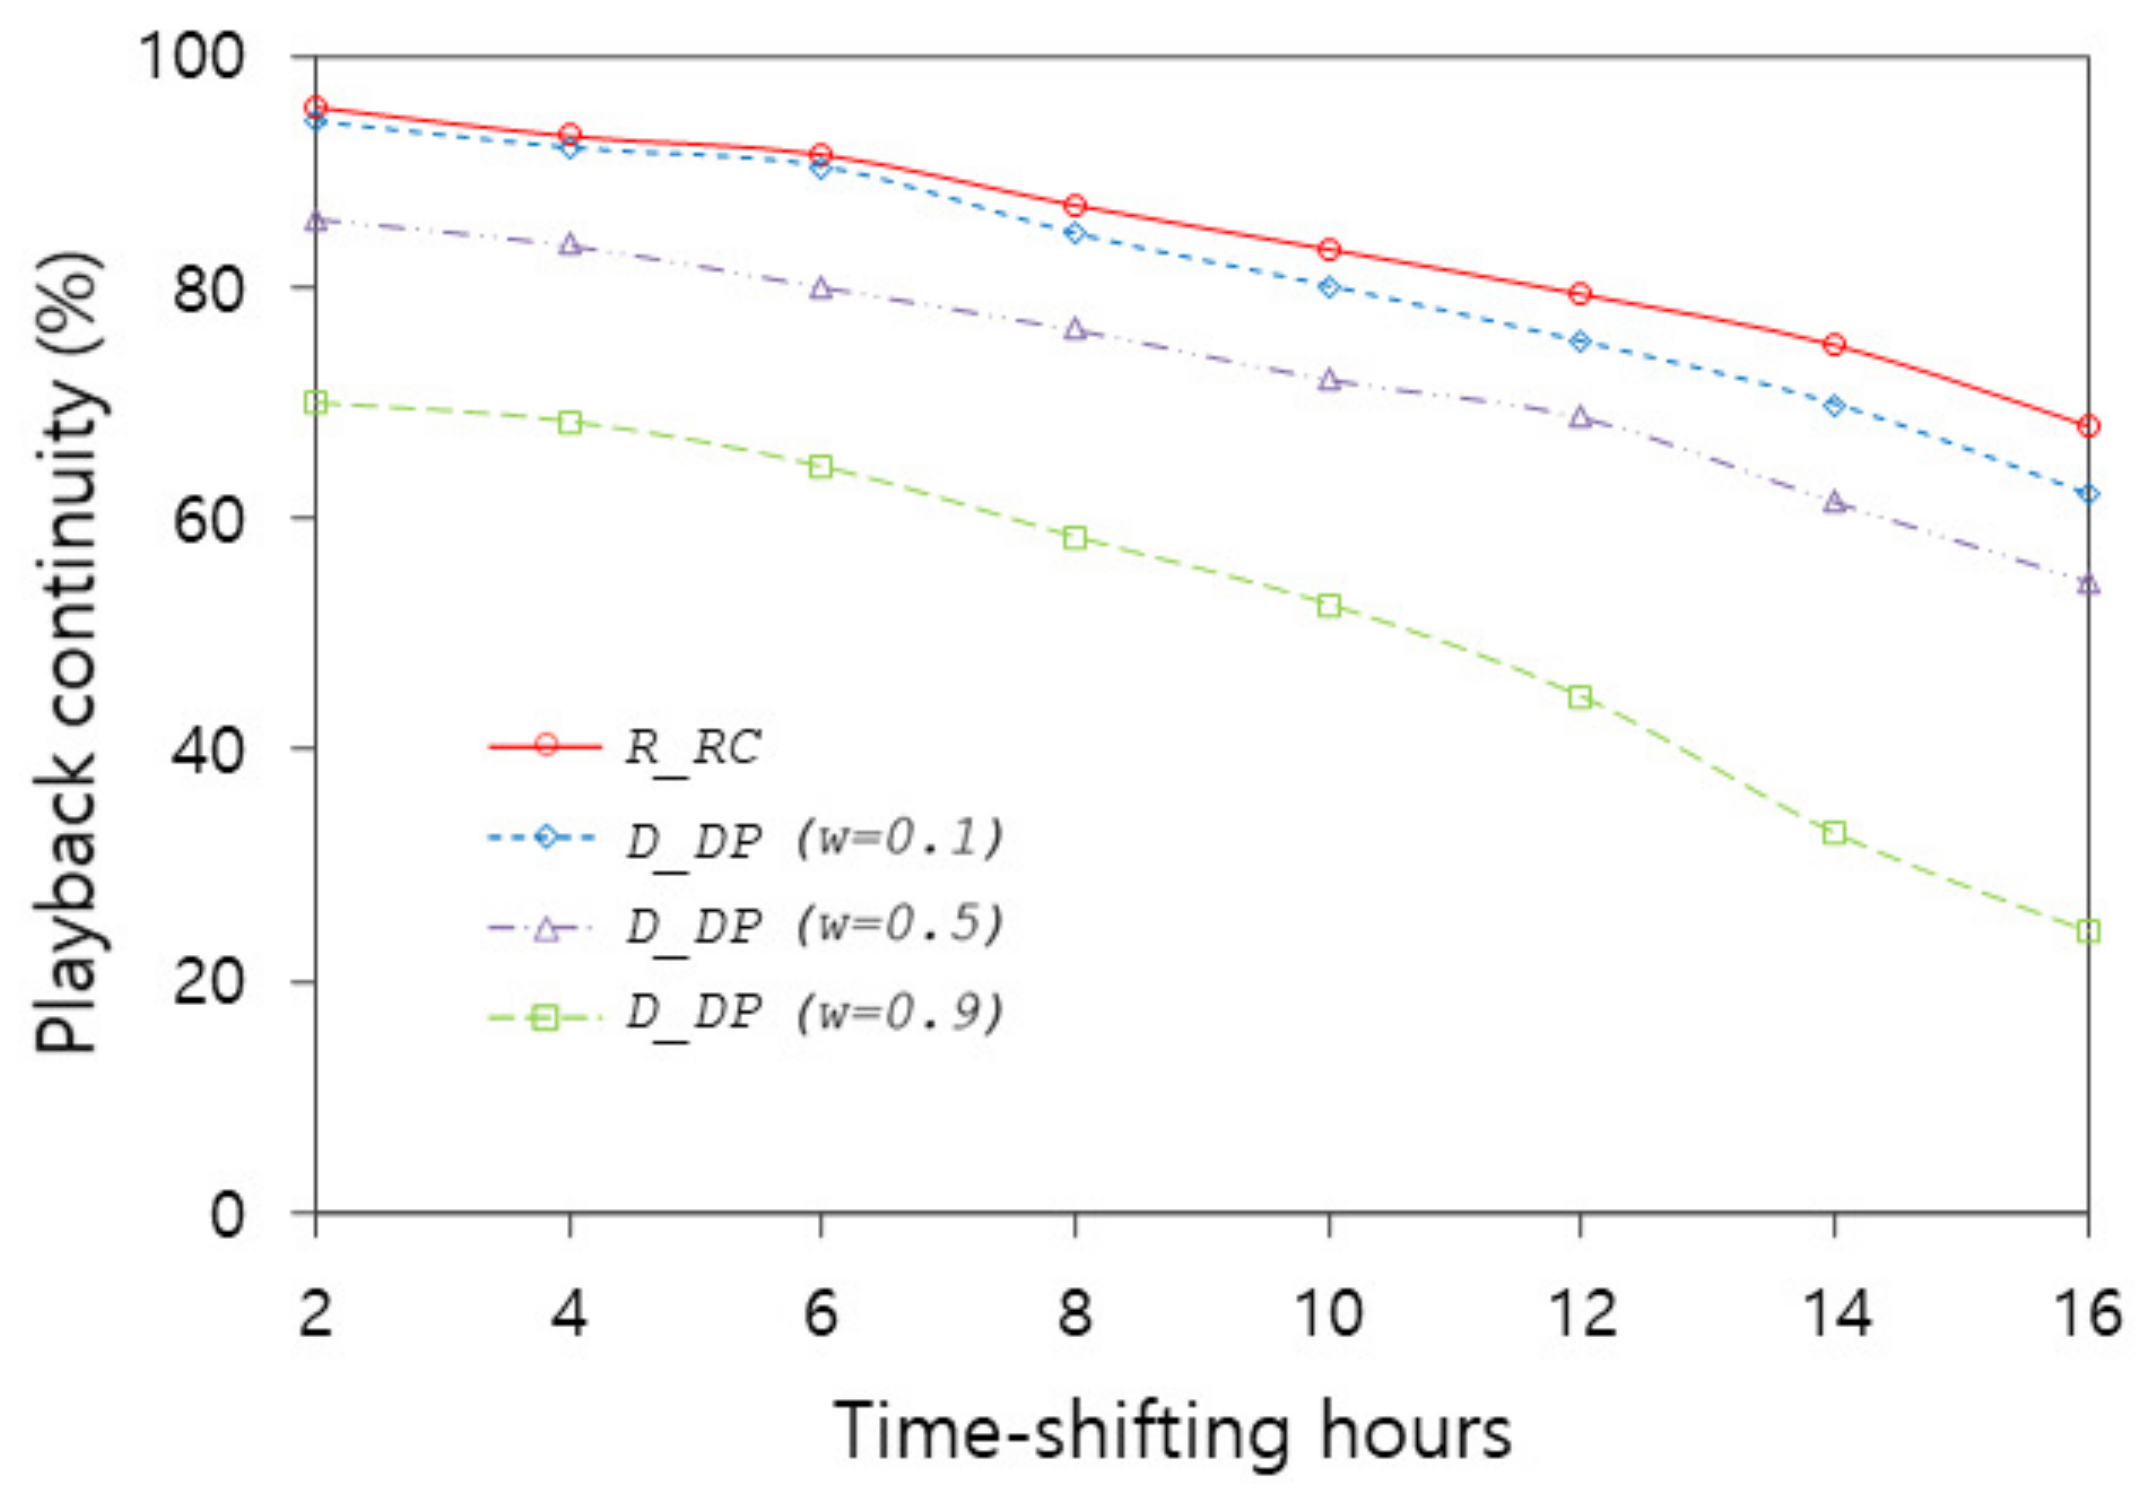
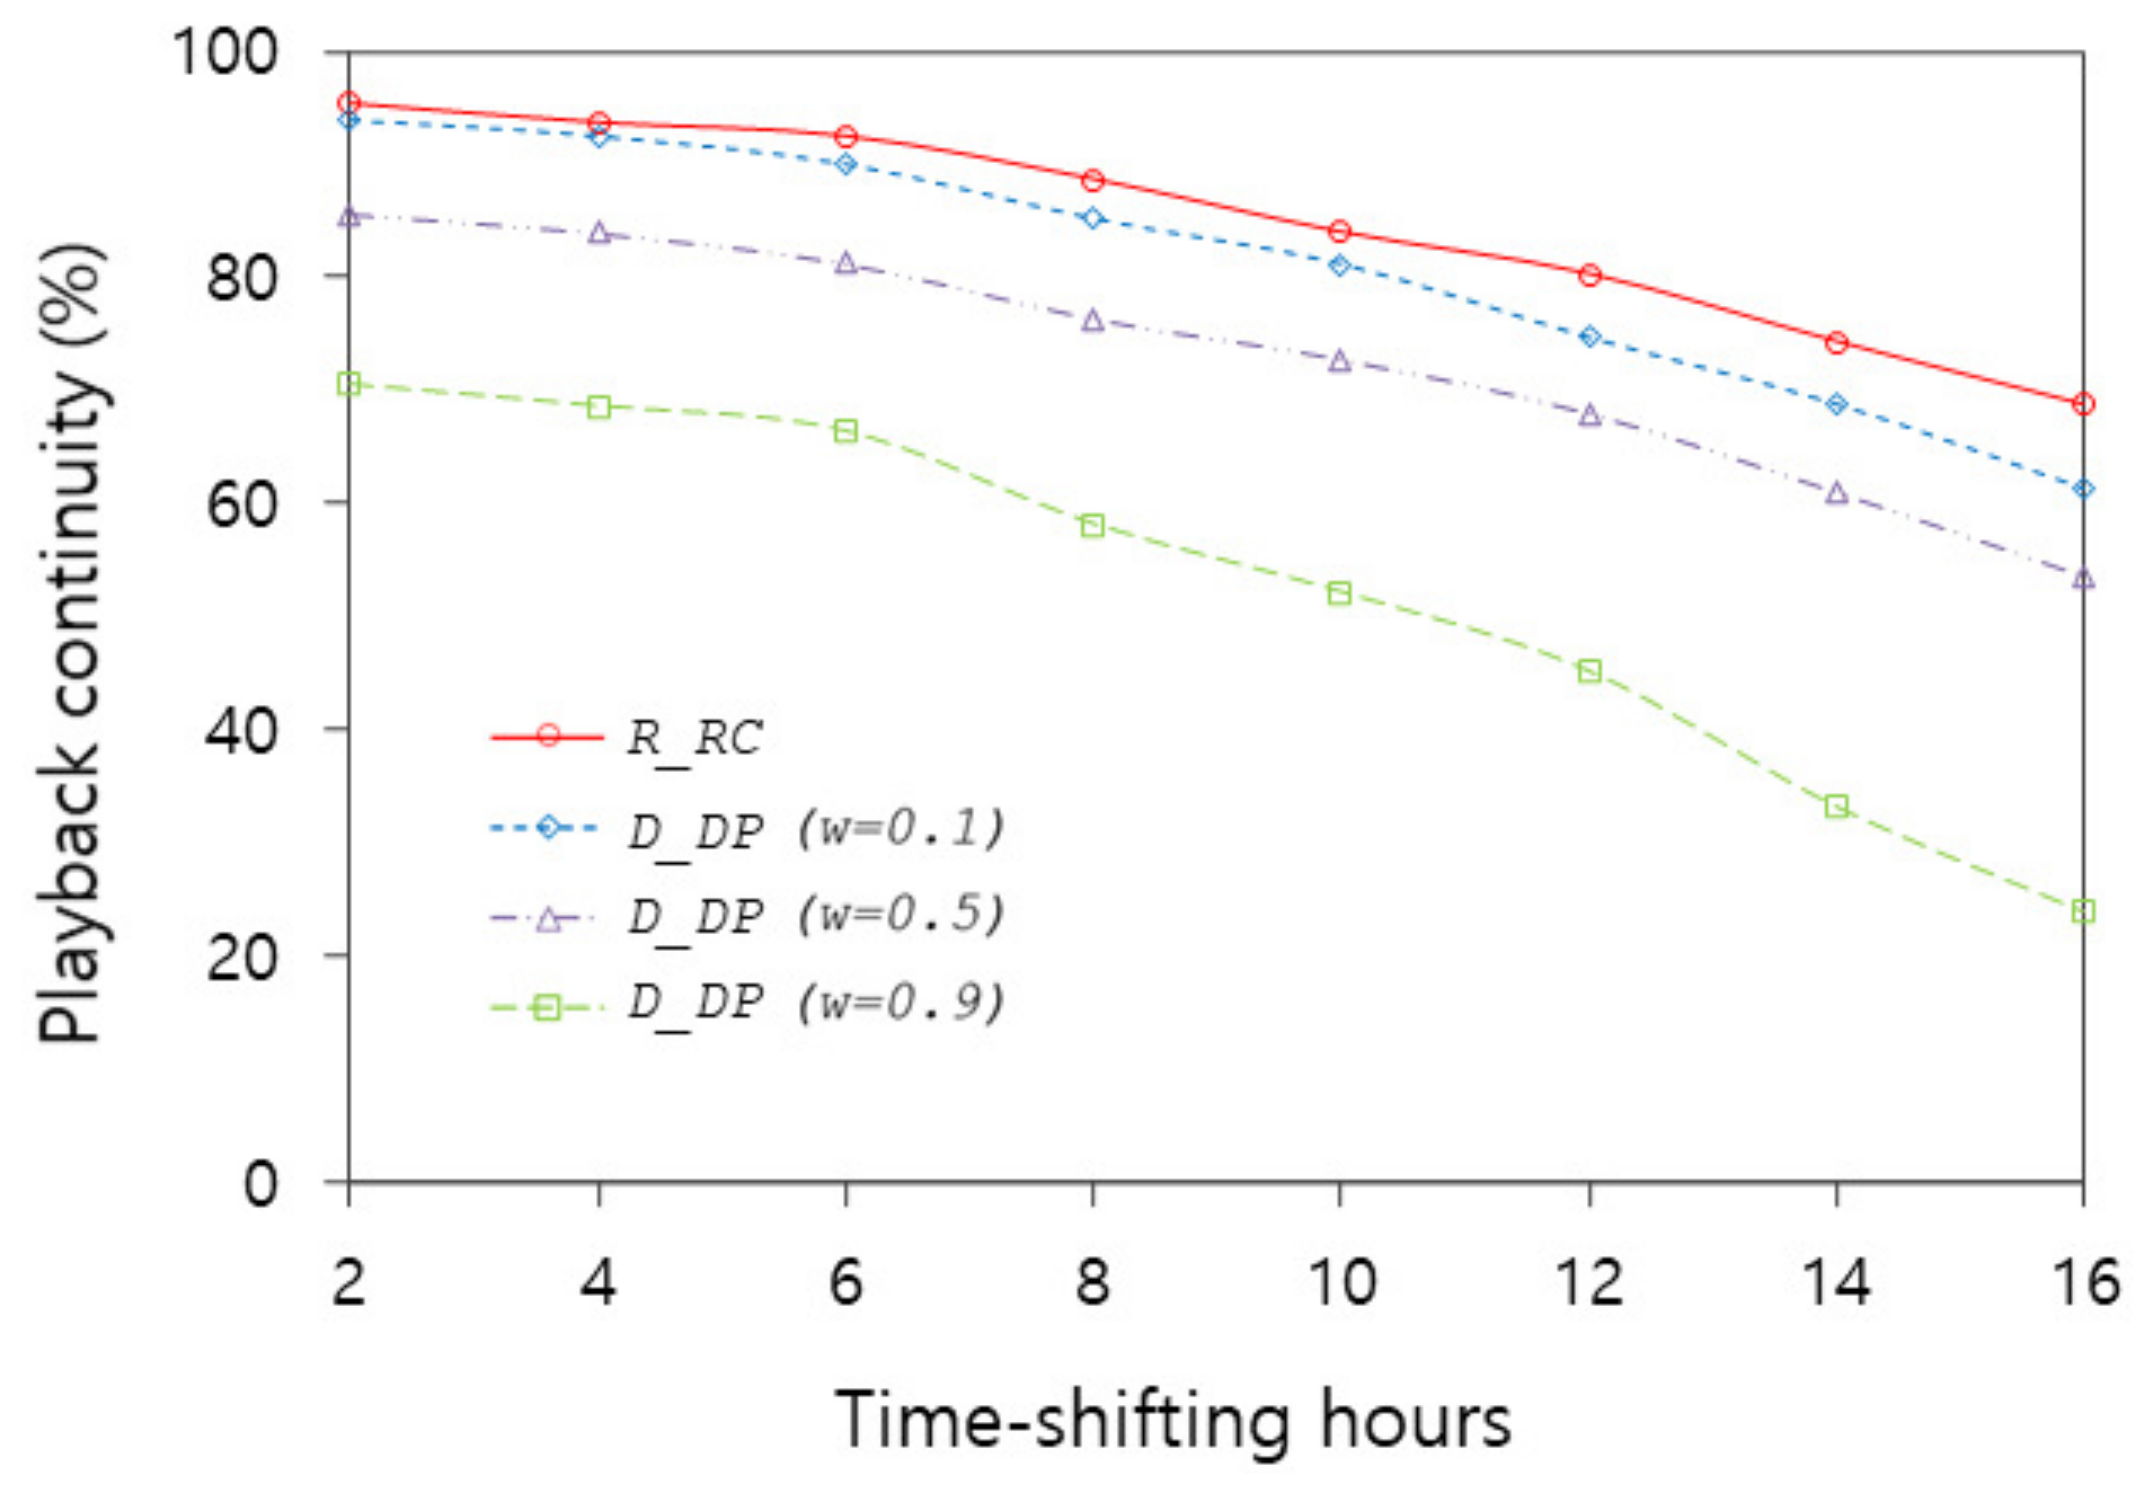
4.1. Playback Continuity
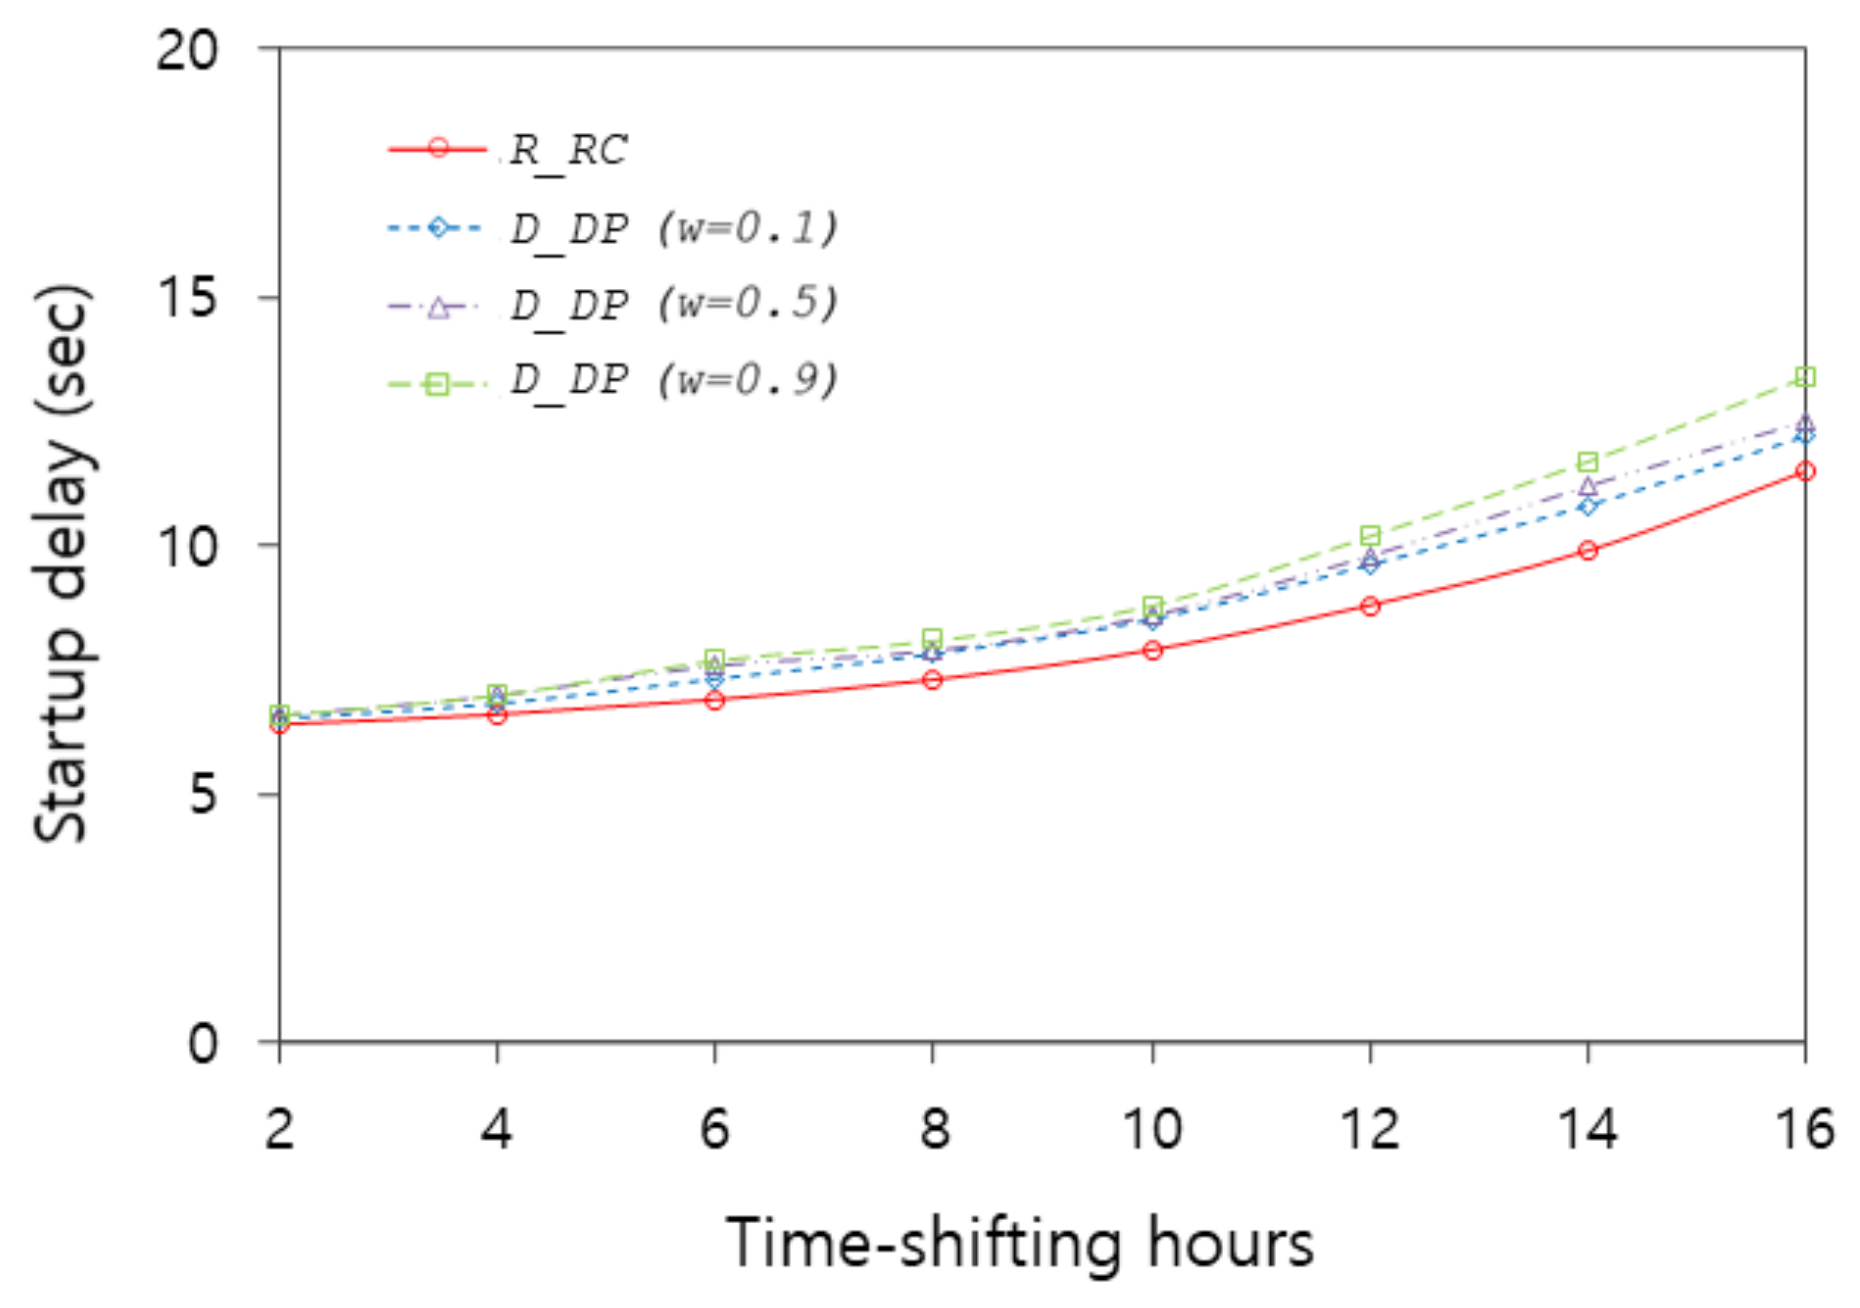
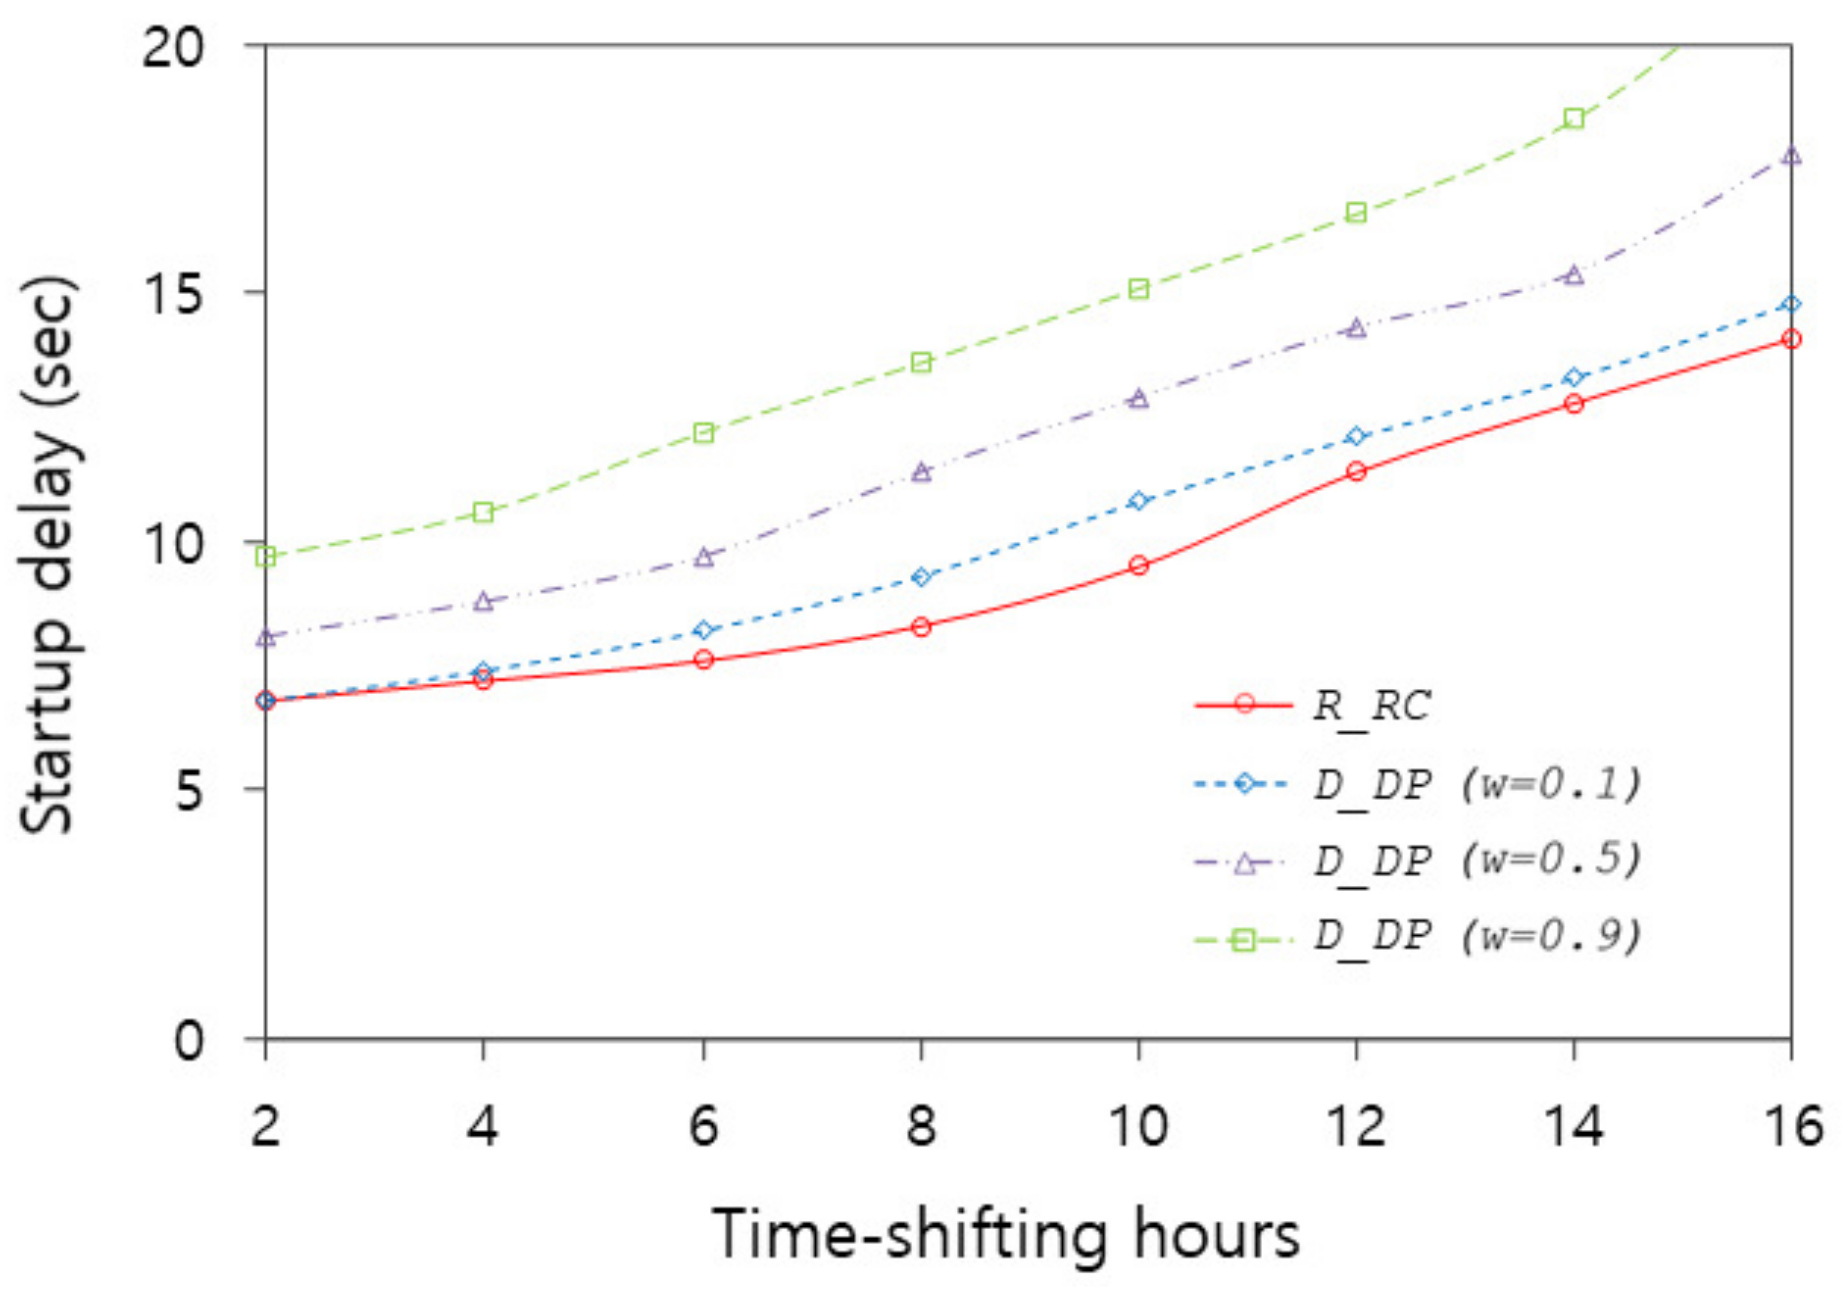
First of all, we can see from Figure 6, Figure 7 and Figure 8 that our proposed buffering schemes can substantially extend effective time-shifting hours compared with when PVRs buffer the same broadcast programs independently of each other. In Figure 6, each independent PVR can store only the parts of the programs corresponding to 450 s, whereas our buffering schemes extend effective time-shifting hours whose playback continuities are over 90% to 7.4, 6.8, 4.5, and 3.2 h for the R _ R C -based scheme and the D _ D P -based scheme with w values of 0.1, 0.5, and 0.9, respectively. This significant improvement is possible because PVRs playing back at the live broadcast time work together to buffer for each other’s time-shifting. It is also evident that, as we use the larger buffer, we can obtain more time-shifting hours.
Figure 6, Figure 7 and Figure 8 show the playback continuity of the R _ R C -based scheme and the D _ D P -based scheme with w values of 0.1, 0.5, and 0.9 while changing the buffer size to 150, 300, and 450 s in distribution 1. We can see that the playback continuity of the R _ R C -based scheme is higher than the D _ D P -based scheme with all w values in all buffer sizes. When the buffer size is 300 s, the average playback continuity of the R _ R C -based scheme for 16 time-shifting hours is 84.1%, whereas those of the D _ D P -based scheme with w values of 0.1, 0.5, and 0.9 are 81.1%, 72.9%, and 51.2%, respectively. In particular, when the buffer size is 300 s, the average playback continuity of the R _ R C -based scheme for the first two time-shifting hours is 95.6%, while that of the D _ D P -based scheme with w values of 0.9 is 70.0%, which indicates a 25.6% performance difference. The reason for this is that the R _ R C -based scheme can adjust the number of chunk copies required immediately more accurately by evaluating the number of actual requests.
It can be also seen that the playback continuity in all the schemes improves as the buffer size increases. The average playback continuity of the R _ R C -based scheme with buffer sizes of 450 s and 150 s for 10 time-shifting hours is 91.5% and 78.1%, respectively, which is a 13.4% improvement. The difference in the D _ D P -based scheme with the w value of 0.9 between two buffer sizes is 49.7%. It is obvious that more chunks can be shared among PVRs with larger buffers since a larger buffer can accommodate more chunks.
We can also see that the performance degrades as playback positions go further from the live broadcast time. The playback continuities of the R _ R C -based scheme with a buffer size of 300 s are 95.6% and 68.0% at the 2nd and 15th hour positions after the live broadcast time, respectively. The reason for this is that the number of playback requests decreases due to the reduced popularity as the playback position becomes further away from the live broadcast time. Thus, it is more likely that the number of neighbor PVRs at the position cannot be greater than M I N n b . It is also evident from Figure 6, Figure 7 and Figure 8 that the performance can become even worse with smaller buffer sizes due to lack of available chunks required for playback.
It is noted that the playback continuity of the D _ D P -based scheme increases as the w value decreases. When the buffer size is 150 s, the average playback continuity of the D _ D P -based scheme with w values of 0.1 and 0.9 for the first 10 time-shifting hours is 75.4% and 30.6%, respectively. This considerable difference is caused by the fact that the proximity degree from the live broadcast time, i.e., P D t r ( i , b ) , is more weighted in Equation (4) as the w value decreases. Thus, the smallest w value is best adjusted to the distribution 1, whose concentration degree around the live broadcast time is highest in these simulations.
On the other hand, Figure 8, Figure 9 and Figure 10 demonstrate that the performance of the D _ D P -based scheme is significantly affected by the w value selected according to the types of playback request distributions. When the w value is 0.9 in distribution 1, 2 and 3, the average playback continuity for the first 16 h is 19.6%, 57.9%, and 75.1%, respectively. This substantial difference is because, as the w value becomes smaller, the chunks closer to the live broadcast time are more buffered. Thus, when the w value is 0.9 in distribution 1, the D _ D P -based scheme determines the target time range mainly based on the deficiency degree, reflecting only 10% proportion in the proximity degree even though most of playback requests are concentrated around the live broadcast time. As a result, the average playback continuity is only 19.6% with a w value of 0.9. On the contrary, when using distribution 3, where playback requests are most evenly distributed over time among three types of distributions, the average playback continuity with a w value of 0.9 is 75.1%, which is almost the same as those with other w values and the D _ D P -based scheme.
It is noted that the performance of the R _ R C -based scheme is not significantly affected by the types of playback request distributions. In particular, the difference in the average playback continuity for 16 h between the distributions 1 and 2 is only 0.7%. The reason for this is that the R _ R C -based scheme determines the target time range based on the number of actual requests regardless of how high the request concentration degree is around the live broadcast time.
Figure 11 shows the experimental results when the number of participating PVRs is 2400 with the buffer size of 150 s. This experiment doubles the number of PVRs and halves the buffer size compared to the experiment shown in Figure 7. Note that the experimental results from Figure 7 and Figure 11 show a similar performance. This is because a similar data duplication degree can be maintained at most playback positions since the doubled PVRs can compensate for the half-sized buffer.
Note that the experiments with the smaller w values show better performance in all types of distributions. This is because the tendency to watch TV around the live broadcast time is reflected in all types of distributions, even if the concentration degree around that time may differ depending on the types of playback request distributions.

4.2. Startup Delay

Figure 12, Figure 13 and Figure 14 show the startup delay of the R _ R C -based scheme and the D _ D P -based scheme with w values of 0.1, 0.5, and 0.9 and a buffer size of 300 s when using distribution 1, 2, and 3, respectively. Similar to the experimental results on the playback continuity, the R _ R C -based scheme outperforms the D _ D P -based scheme in all cases because the R _ R C -based scheme is capable of evaluating the number of actual requests more accurately. The average startup delay of the R _ R C -based scheme for the first 10 time-shifting hours in distribution 1 is 6.6 s, while those of the D _ D P -based scheme with w values of 0.1, 0.5, and 0.9 are 7.1, 9.0, and 12.3 s, respectively.
We can also see that the differences in the startup delay among the R _ R C -based scheme and D _ D P -based schemes with three w values become longer as the playback requests are more concentrated around the live broadcast time as in distribution 1. The largest differences in the average startup delay of distribution 1, 2, and 3 among them are 5.7, 3.7, and 0.6 s, respectively. This is because, as the playback requests are more uniformly distributed over time as in distribution 3, the proximity degree to reflect the concentration degree of playback requests around live broadcast time becomes a relatively less important factor for determining the target time range.
As expected, the startup delay of all the schemes increases as the playback positions go further from the live broadcast time, for example, when the startup delays of the R _ R C -based scheme for 2 and 16 h away from the live broadcast time are 5.2 and 11.9 s, respectively. The reason is that the chunks required for initial playback can be received more quickly around the live broadcast time than at distant positions since much more PVRs are likely to play back around the time.

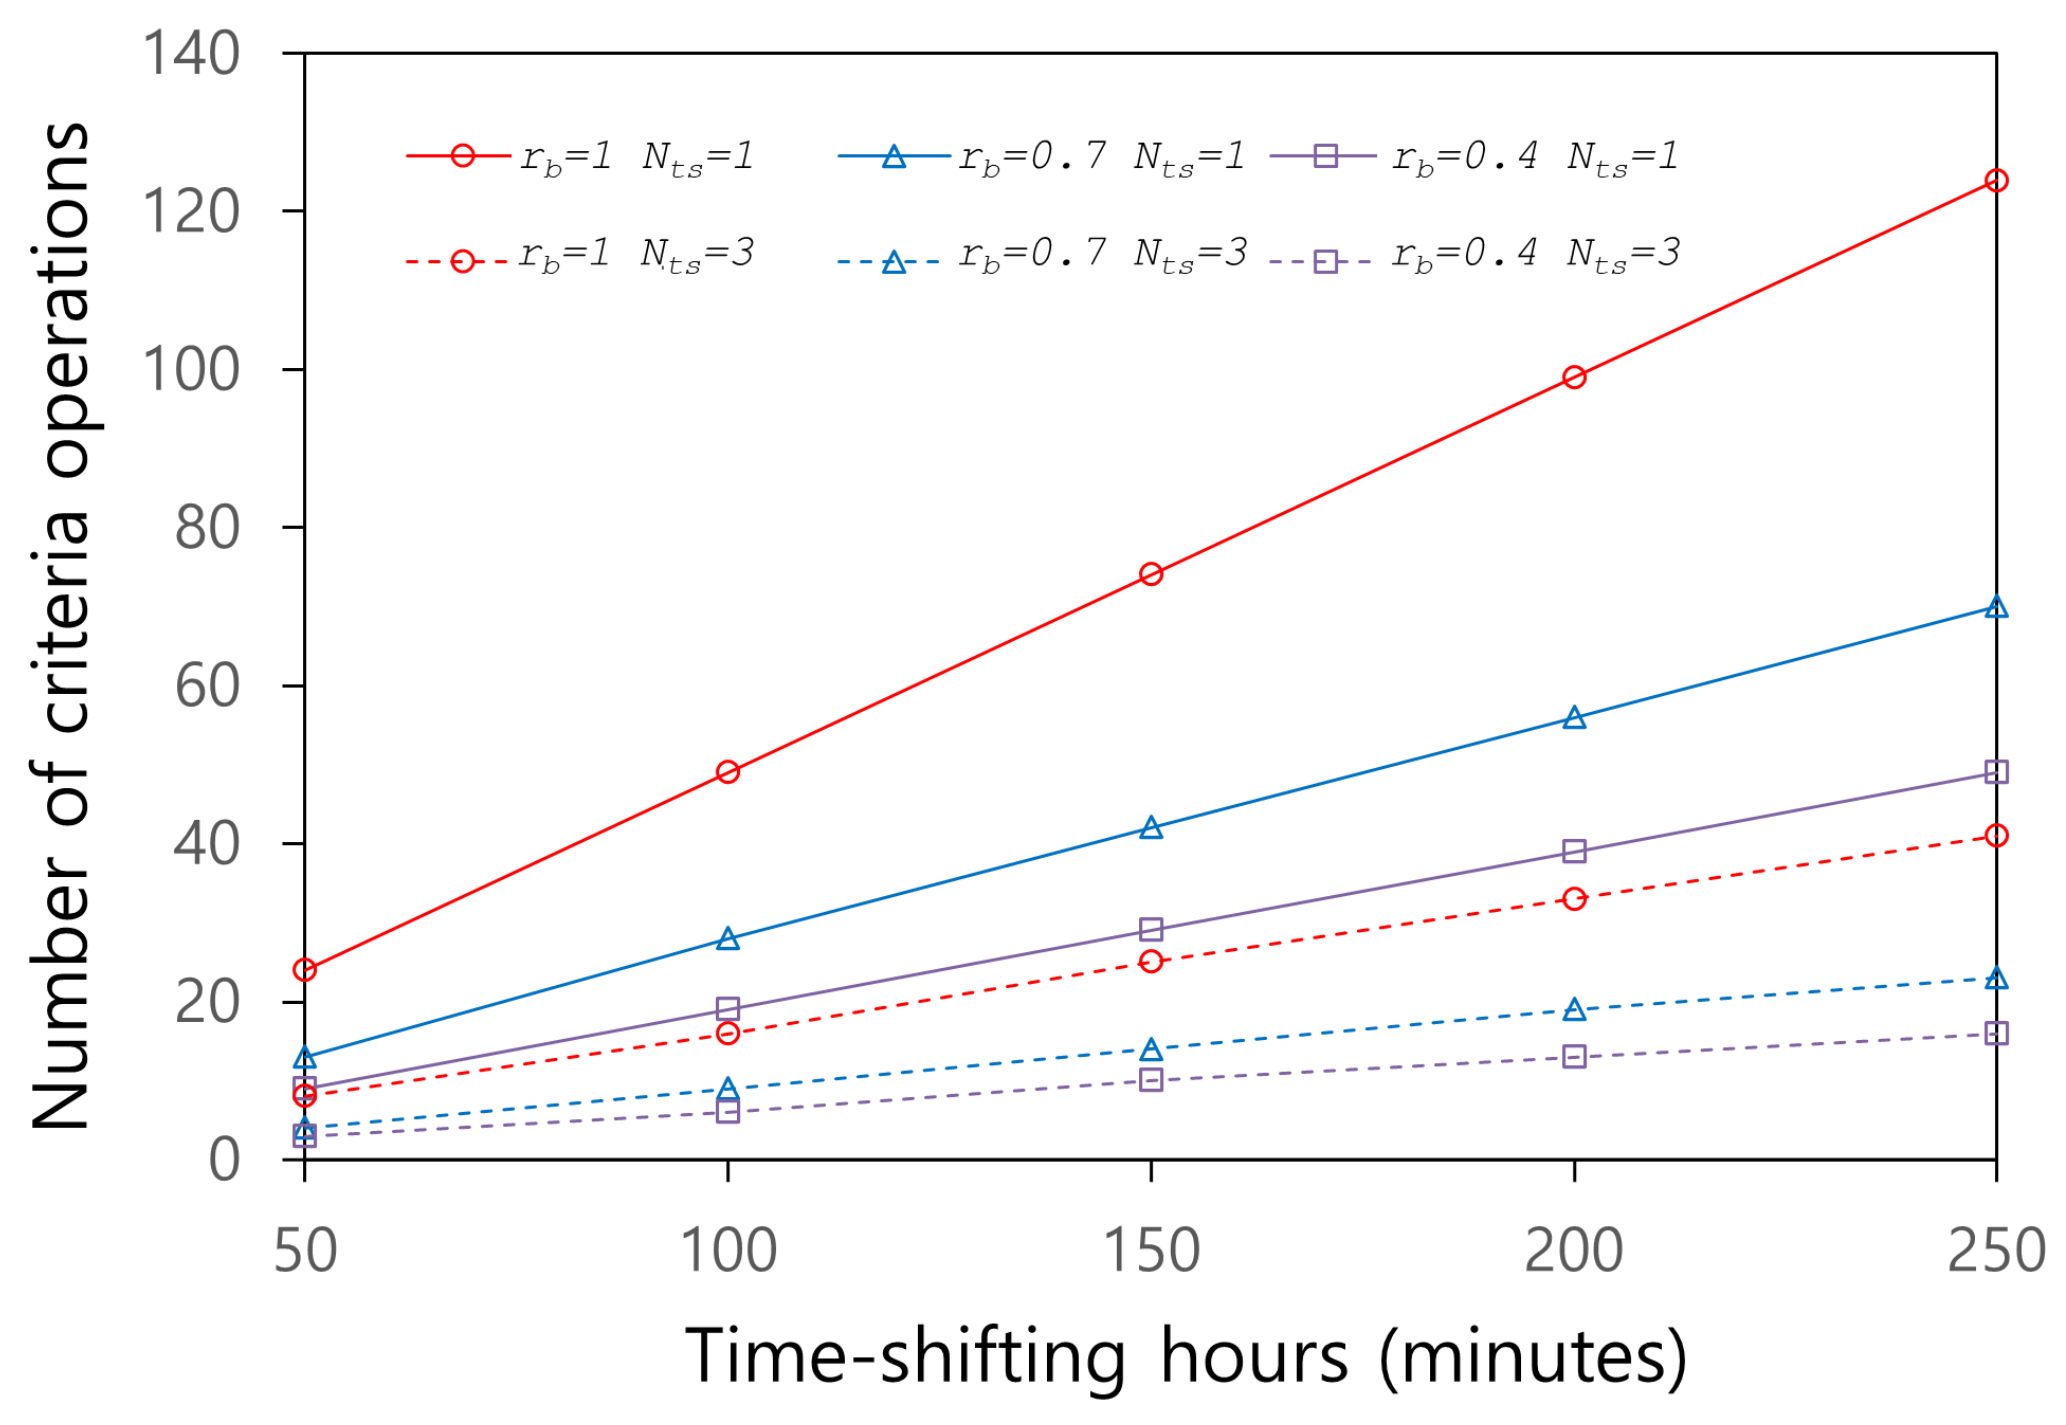
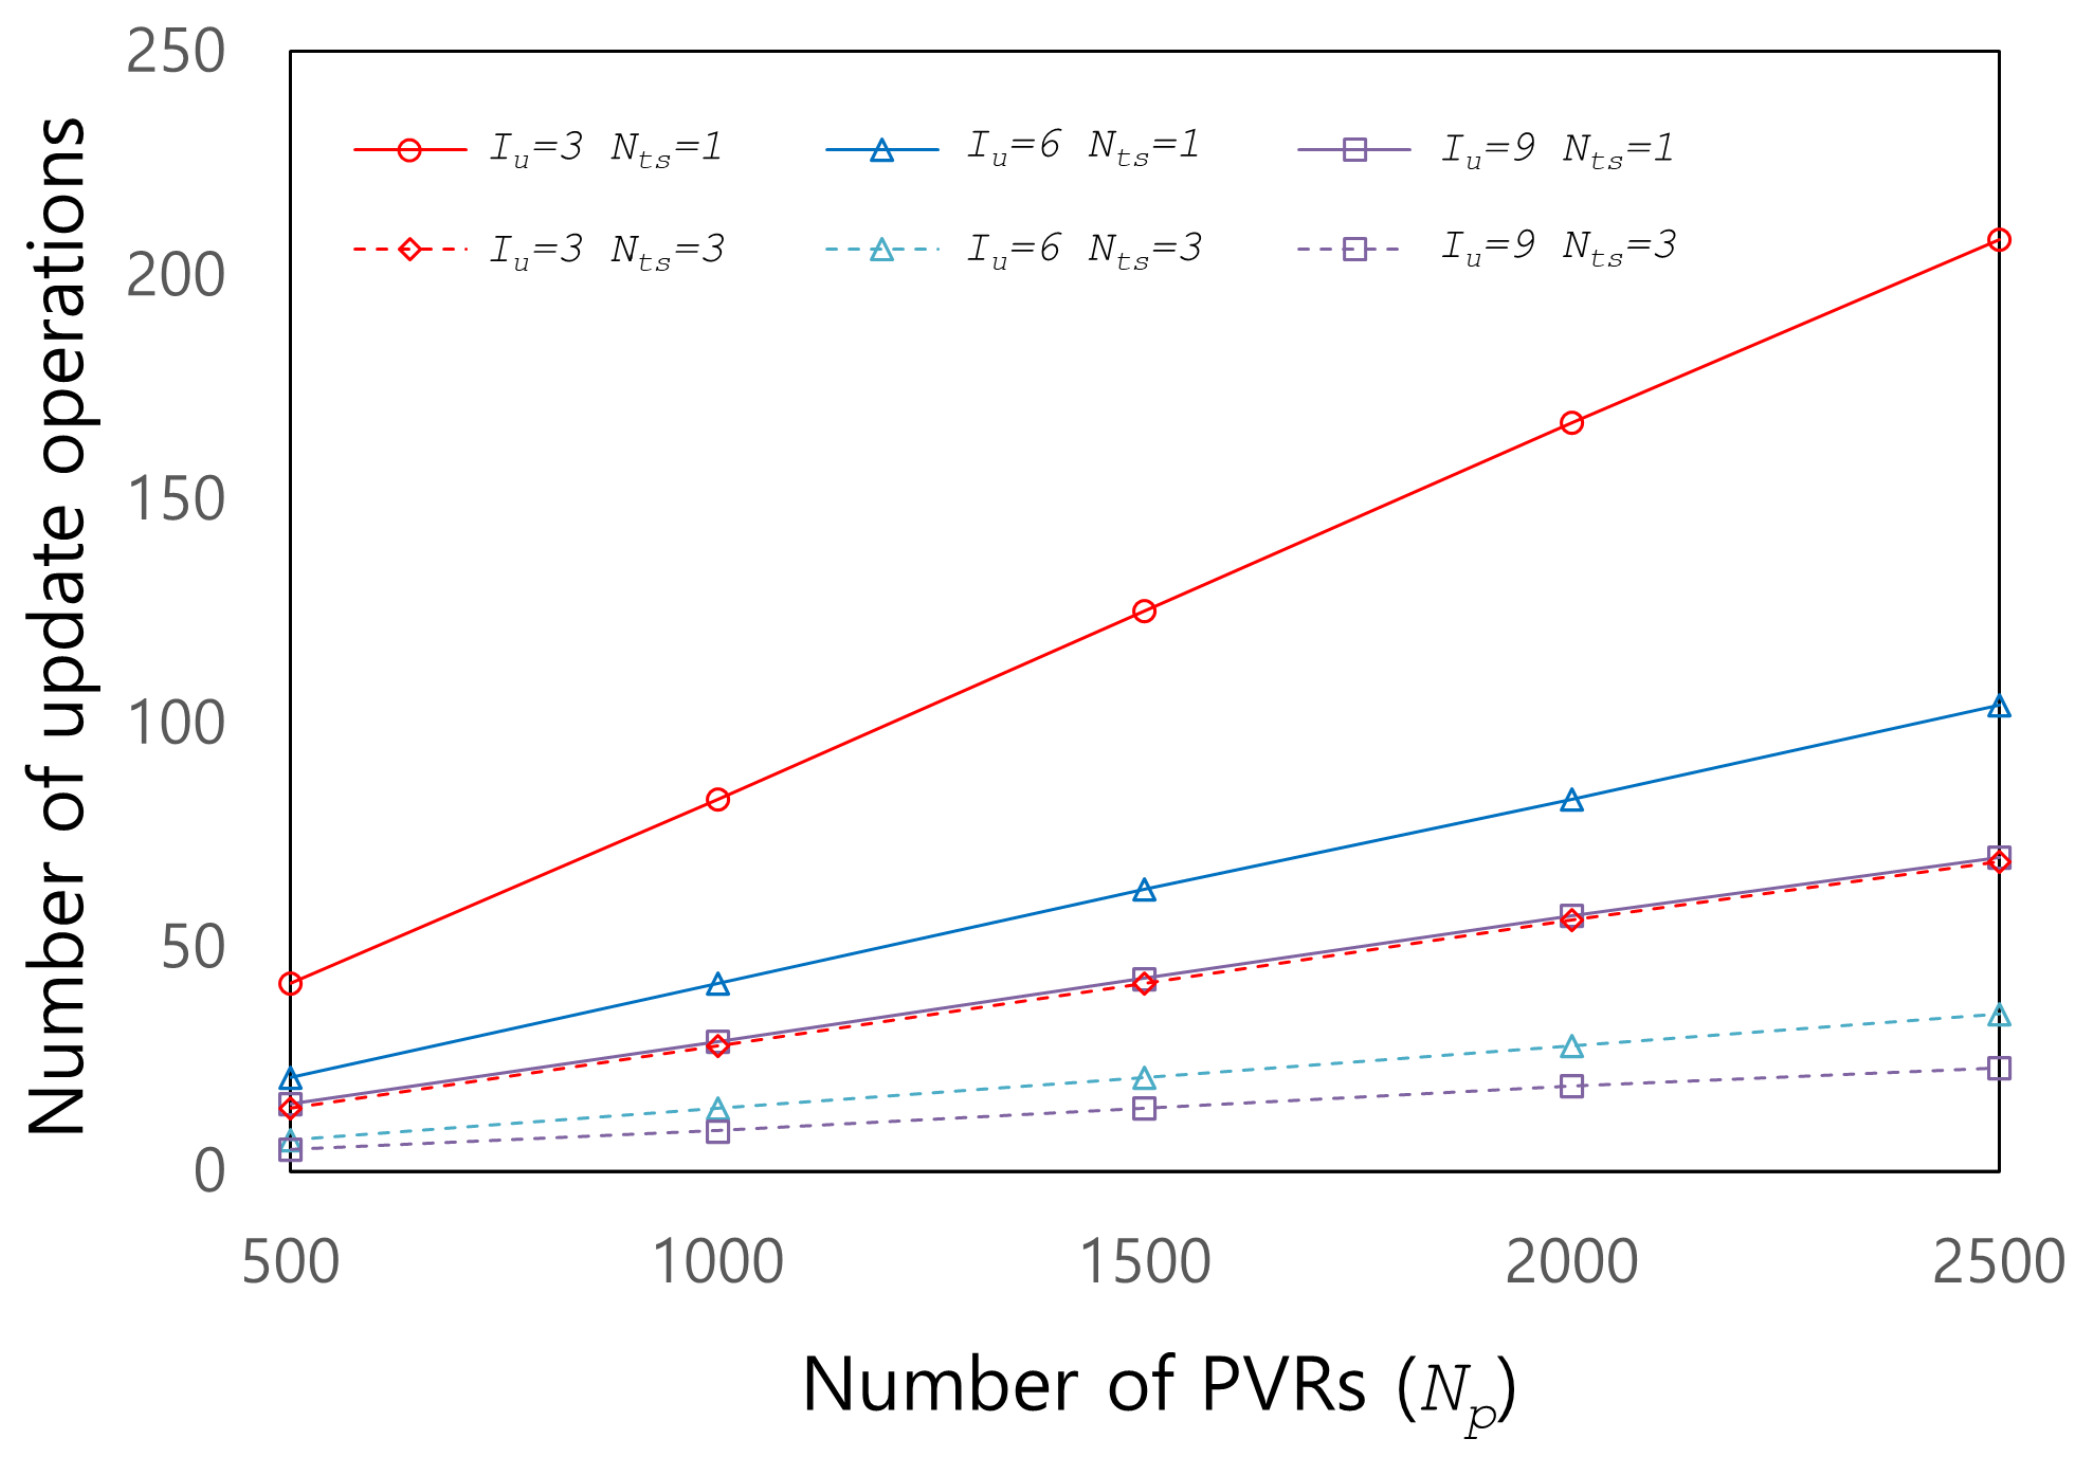
4.3. Computation Reduction of Cooperative Buffering Schemes

Figure 15 shows the computational complexity of the D _ D P and R _ R P -based schemes in terms of the number of operations required to evaluate the criteria when a tracker server determines the target time range to be buffered and when the buffer size is 300 s. We varied the entire time-shifting hours provided by all participating PVRs from 50 to 250 min, r b value from 0.4 to 1, and N t s between 1 and 3. We can see that the number of operations is only 9 when r b is 1 and the time-shifting hours are 50 min and 124 when r b is 0.4 and the time-shifting hours are 250 min. This is because the operations should be performed for more time ranges as time-shifting hours are extended or r b decreases. This implies that we can control the complexity by adjusting r b . Moreover, we can further reduce the complexity by employing more tracker servers. It can be seen that, when N t s becomes 3, the number of operations decreases to one third in all cases because the evaluation loads are distributed to more tracker servers.
Figure 16 demonstrates the number of the aggregate buffermap update operations per second according to N p while varying I u and N t s . As expected, we can see that the number of operations per second is only 14 when N p is 500 and I u is 9, while 208 when N p is 2500 and I u is 3. This indicates that as N p decreases and I u increases, the total number of the update operations for the aggregate buffermap can be reduced significantly by extending the interval of the operations. It can be also seen that, with the increased N t s , the complexity can be further reduced to a similar degree.
Therefore, we can see that our proposed schemes can provide the time-shifted live-streaming services in real time by adaptively adjusting their computational complexity, i.e., by extending the intervals of target time ranges and the aggregate buffermap update operations, and increasing the number of tracker servers, depending on request arrival rates and computation capacity of tracker servers.

5. Conclusions

In this paper, we proposed a time-shifted live streaming system based on P2P technologies that are highly scalable at a low cost so that PVRs can share TV programs with each other. We also proposed two cooperative buffering schemes to provide the streaming services for time-shifted periods even when the number of PVRs playing back at the periods is insufficient. This is possible because the proposed schemes can utilize the idle resources of the PVRs playing back at the live broadcast time by working together with each other. As a result, people can watch any broadcast program at any time even on the channels that they have not watched before. To determine which chunks to be buffered, the D _ D P -based scheme prioritizes each time range depending on its degree of chunk deficiency and proximity to the live broadcast time, while the R _ R C -based scheme considers the ratio of the number of actual requests to that of chunk copies already buffered. Through extensive simulations, we showed that our proposed schemes can considerably extend the time-shifting hours compared with when PVRs buffer the broadcast programs independently of each other. The performance of the two schemes was also compared in terms of playback continuity and startup delay while varying the buffer size, playback request distribution, and the number of PVRs.

Author Contributions

Conceptualization, E.K.; software, Y.C.; validation, E.K. and H.S.; formal analysis, E.K. and H.S.; investigation, E.K. and H.S.; writing—original draft preparation, E.K.; writing—review and editing, Y.C. and H.S.; visualization, E.K. and Y.C.; supervision, H.S.; funding acquisition, E.K. and H.S. All authors have read and agreed to the published version of the manuscript.

Funding

This work was supported by the National Research Foundation of Korea (NRF) grant funded by the Korea government (MSIT) (No. 2019R1A2C1002221 and 2019R1F1A1063698).

Institutional Review Board Statement

Not applicable.

Informed Consent Statement

Not applicable.

Conflicts of Interest

The authors declare no conflict of interest.

References

  1. Dimitrova, N.; Jasinschi, R.; Agnihotri, L.; Zimmerman, J.; McGee, T.; Li, D. Personalizing video recorders using multimedia processing and integration. In Proceedings of the ACM Conference on Multimedia, Ottawa, ON, Canada, 30 September–5 October 2001; pp. 564–567. [Google Scholar]
  2. Sentinelli, A.; Marfia, G.; Gerla, M.; Kleinrock, L.; Tewari, S. Will IPTV ride the Peer-to-Peer stream? IEEE Commun. Mag. 2007, 45, 86–92. [Google Scholar] [CrossRef]
  3. Abreu, J.; Nogueira, J.; Becker, V.; Cardoso, B. Survey of Catch-up TV and other time-shift services: A comprehensive analysis and taxonomy of linear and nonlinear television. Telecommun. Syst. 2017, 64, 57–74. [Google Scholar] [CrossRef]
  4. Kim, E.; Lee, C. An on-demand TV service architecture for networked home appliances. IEEE Commun. Mag. 2008, 46, 56–63. [Google Scholar] [CrossRef]
  5. Cahill, A.; Sreenan, C. An efficient CDN placement algorithm for the delivery of high-quality tv content. In Proceedings of the ACM Conference on Multimedia, New York, NY, USA, 10–16 October 2004; pp. 975–976. [Google Scholar]
  6. Cranor, C.; Green, M.; Kalmanek, C.; Sibal, S.; Merwe, J.; Sreenan, C. Enhanced streaming services in a content distribution network. IEEE Internet Comput. 2001, 5, 66–75. [Google Scholar] [CrossRef]
  7. Chejara, U.; Chai, H.; Cho, H. Performance comparison of different cache-replacement policies for video distribution in CDN. In Proceedings of the IEEE Conference on High Speed Networks and Multimedia Communications, Toulouse, France, 30 June–2 July 2004; pp. 921–931. [Google Scholar]
  8. Miguel, E.; Silva, C.; Coelho, F.; Cunha, I.; Campos, S. Construction and maintenance of P2P overlays for live streaming. Multimed. Tools Appl. 2012, 80, 20255–20282. [Google Scholar] [CrossRef]
  9. Zare, S. A program-driven approach joint with pre-buffering and popularity to reduce latency during channel surfing periods in IPTV networks. Multimed. Tools Appl. 2018, 77, 32093–32105. [Google Scholar] [CrossRef]
  10. Hei, X.; Liang, C.; Liang, J.; Liu, Y.; Ross, K. A measurement study of a large-scale P2P IPTV system. IEEE Trans. Multimed. 2007, 9, 1672–1687. [Google Scholar]
  11. Huang, G. Experiences with PPLive. In Proceedings of the Keynote at ACM SIGCOMM P2P Streaming and IP-TV Workshop, Kyoto, Japan, 31 August 2007. [Google Scholar]
  12. Deshpande, S.; Noh, J. P2TSS: Time-shifted and live streaming of video in peer-to-peer systems. In Proceedings of the IEEE Conference on Multimedia and Expo, Hannover, Germany, 23–26 June 2008; pp. 649–652. [Google Scholar]
  13. Kim, E.; Kim, T.; Lee, C. An adaptive buffering scheme for P2P live and time-shifted streaming. Appl. Sci. 2017, 7, 204. [Google Scholar] [CrossRef] [Green Version]
  14. Wauters, T.; Meerssche, W.; Turck, F.; Dhoedt, B.; Demeester, P.; Caenegem, T.; Six, E. Co-operative proxy caching algorithms for time-shifted IPTV services. In Proceedings of the EUROMICRO Software Engineering and Advanced Applications, Cavtat, Croatia, 29 August–1 September 2006; pp. 379–386. [Google Scholar]
  15. Cho, Y. Cooperative Buffering Schemes for PVR Systems Supporting P2P Streaming. Master’s Thesis, Hongik University, Seoul, Korea, 2016. [Google Scholar]
  16. Cho, Y.; Kim, E. A cooperative buffering scheme for PVR systems to support P2P streaming. J. Korean Inst. Next Gener. Comput. 2016, 12, 85–92. [Google Scholar]
  17. Evans, C.; Julian, I.; Simon, F. The Sustainable Future of Video Entertainment from Creation to Consumption; Futuresource Consulting Ltd.: Hertfordshire, UK, 2020; pp. 1–34. [Google Scholar]
  18. Ho-Shing, T.; Chan, S.; Haochao, L. Optimizing Segment Caching for Peer-to-Peer On-demand streaming. In Proceedings of the 2009 IEEE International Conference on Multimedia and Expo (ICME), New York, NY, USA, 28 June–3 July 2009; pp. 810–813. [Google Scholar]
  19. Lin, C.; Yan, M. Dynamic peer buffer adjustment to improve service availability on peer-to-peer on-demand streaming networks. J. Peer-to-Peer Netw. Appl. 2014, 7, 1–15. [Google Scholar] [CrossRef]
  20. Fujimoto, T.; Endo, R.; Matsumoto, K.; Shigeno, H. Video-popularity-based caching scheme for P2P Video-on-Demand streaming. In Proceedings of the IEEE Workshops of International Conference on Advanced Information Networking and Applications, Biopolis, Singapore, 22–25 March 2011; pp. 748–755. [Google Scholar]
  21. Liu, Z.; Shen, Y.; Rossand, K.; Panwar, S. LayerP2P: Using layered video chunks in P2P live streaming. IEEE Trans. Multimed. 2009, 11, 1340–1352. [Google Scholar]
  22. Chen, Y.; Chen, C.; Li, C. Measurement study of cache rejection in P2P live streaming system. In Proceedings of the IEEE Conference on Distributed Computing Systems, Beijing, China, 17–20 June 2008; pp. 12–17. [Google Scholar]
Figure 1. Typical popularity distribution of live broadcast TV programs.
Applsci 11 11527 g001
Figure 2. Overall system architecture for P2P time-shifted live streaming among PVRs.
Applsci 11 11527 g002
Figure 3. A buffering scheme based on the Degree of Deficiency and Proximity.
Applsci 11 11527 g003
Figure 4. A buffering scheme based on the Ratio of Playback Requests to Chunk Copies.
Applsci 11 11527 g004
Figure 5. Three types of playback request distributions according to the concentration degree around the live broadcast time.
Applsci 11 11527 g005
Figure 6. Comparison of playback requests between D _ D P and R _ R P in distribution 1 with a 450 s buffer.
Applsci 11 11527 g006
Figure 7. Comparison of playback requests between D _ D P and R _ R P in distribution 1 with a 300 s buffer.
Applsci 11 11527 g007
Figure 8. Comparison of playback requests between D _ D P and R _ R P in distribution 1 with a 150 s buffer.
Applsci 11 11527 g008
Figure 9. Comparison of playback requests between D _ D P and R _ R P in distribution 2 with a 150 s buffer.
Applsci 11 11527 g009
Figure 10. Comparison of playback requests between D _ D P and R _ R P in distribution 3 with a 150 s buffer.
Applsci 11 11527 g010
Figure 11. Comparison of playback requests between D _ D P and R _ R P in distribution 1 with a 150 s buffer when the number of PVRs is 2400.
Applsci 11 11527 g011
Figure 12. Comparison of startup delay between D _ D P and R _ R P in distribution 1 with 300 s buffer.
Applsci 11 11527 g012
Figure 13. Comparison of startup delay between D _ D P and R _ R P in distribution 2 with 300 s buffer.
Applsci 11 11527 g013
Figure 14. Comparison of startup delay between D _ D P and R _ R P in distribution 3 with a 300 s buffer.
Applsci 11 11527 g014
Figure 15. The number of criteria determination operations according to time-shifting hours with a 300 s buffer.
Applsci 11 11527 g015
Figure 16. The number of the aggregate buffermap update operations according to N p with a 300 s buffer.
Applsci 11 11527 g016
Table 1. Summary of symbols.
SymbolDefinition
p i i-th period away from the live broadcast time
C p i Number of chunk copies at p i
Q p i 1 or 0 indicating whether or not p i is qualified for the minimum requirement
on the number of neighbor PVRs
M I N n b Minimum number of neighbor PVRs required to playback without quality
degradation
bBuffer size of each PVR in periods or chunks
t r ( i , b ) Time range with b periods long, starting at p i ending at p i + b 1
D D t r ( i , b ) Deficiency degree of chunks, i.e., ratio of the unqualified periods among all the
periods belonging to t r ( i , b )
P D t r ( i , b ) Proximity degree from the live broadcast time to t r ( i , b )
T P Total number of periods during the entire time-shifting hours
wWeight value between D D t r ( i , b ) and P D t r ( i , b )
N R p i Number of chunk copies actually requested at p i
N C p i Number of chunk copies already buffered at p i
A R t r ( i , b ) Average number of actual playback requests of chunks during t r ( i , b )
A C t r ( i , b ) Average number of buffered copies of chunks during t r ( i , b )
r b Partial ratio of b
N t s Number of tracker servers
gNumber of chunks in a group corresponding to a period
N p Total number of PVRs in the system
a p Availability of each PVR
λ b Number of buffermap transmissions per PVR per second
I u Aggregate buffermap update interval in multiples of λ b in a tracker server
λ a Request arrival rate in the system
μ t s Request service rate of each tracker server
Table 2. Simulation parameters.
ParameterDefault Value
Number of participating PVRs1200
Backbone network bandwidth10 Gbps
Bandwidth between router and PVR100 Mbps: 10%
50 Mbps: 50%
20 Mbps: 20%
10 Mbps: 20%
Maximum number of neighbor PVRs6
M I N n b 4
Average inter-arrival and inter-leaving rate3400 s
Video playback rate720 Kbps
Number of chunks per second3
Chunk size30 KB
Buffer size in seconds150
Number of buffered chunks required for initial playback45 chunks (15 s)
Simulation duration36,000 s
Publisher’s Note: MDPI stays neutral with regard to jurisdictional claims in published maps and institutional affiliations.

