
Correlation Analysis and Its Application on an Asymmetry Rotor Structure with Overhang


Abstract
:1. Introduction
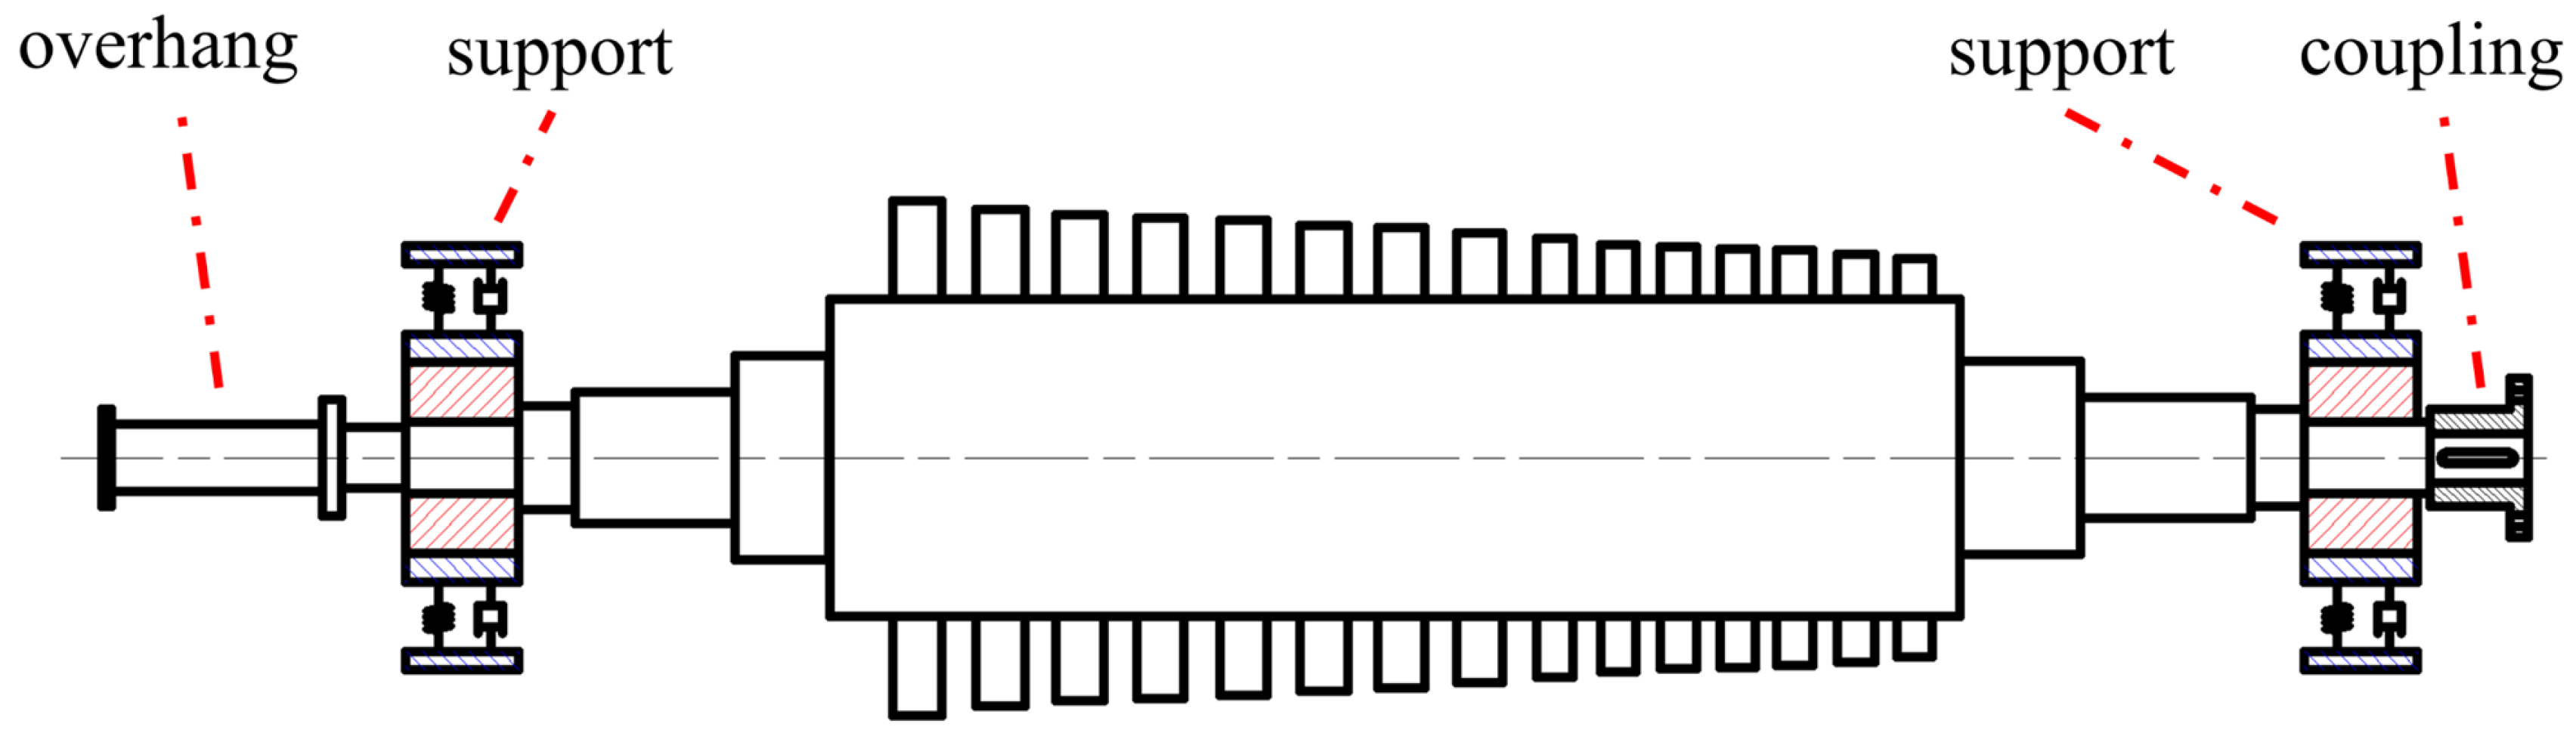
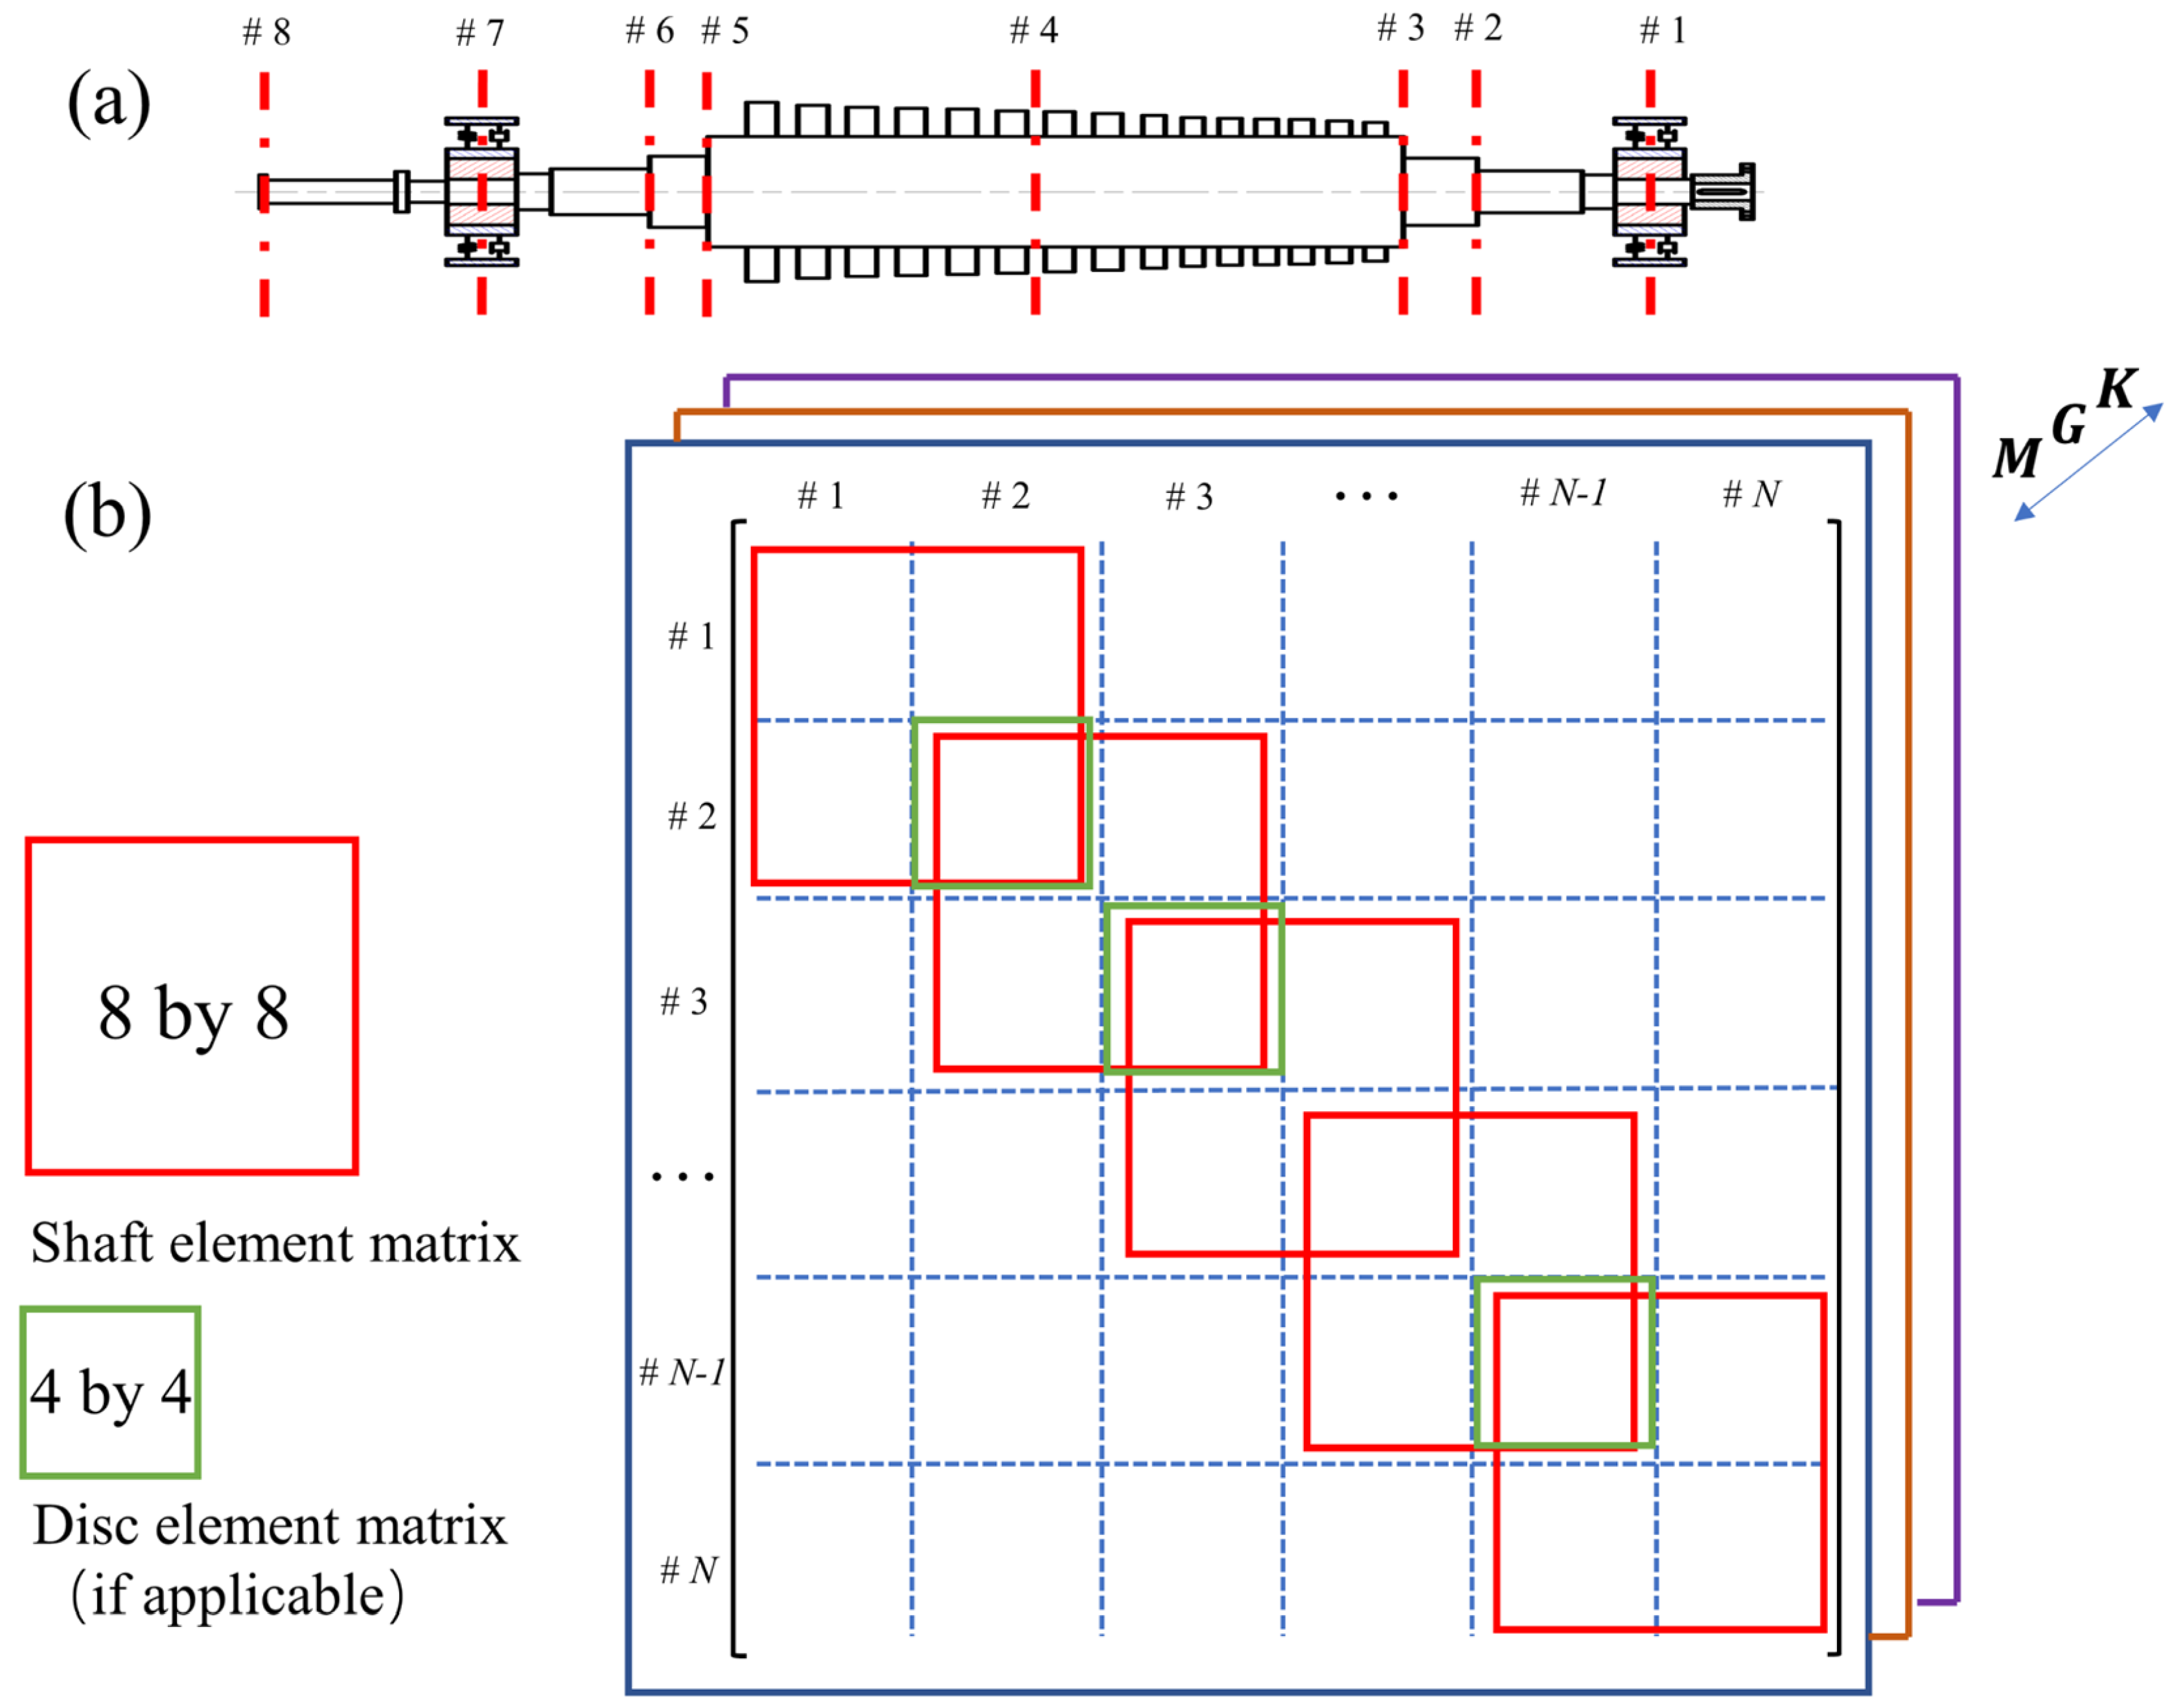
2. Modeling Process
2.1. Modeling of the Disc
2.2. Modeling of the Shaft Segment
2.3. Modeling of the Bearing Force
2.4. The Governing Equations
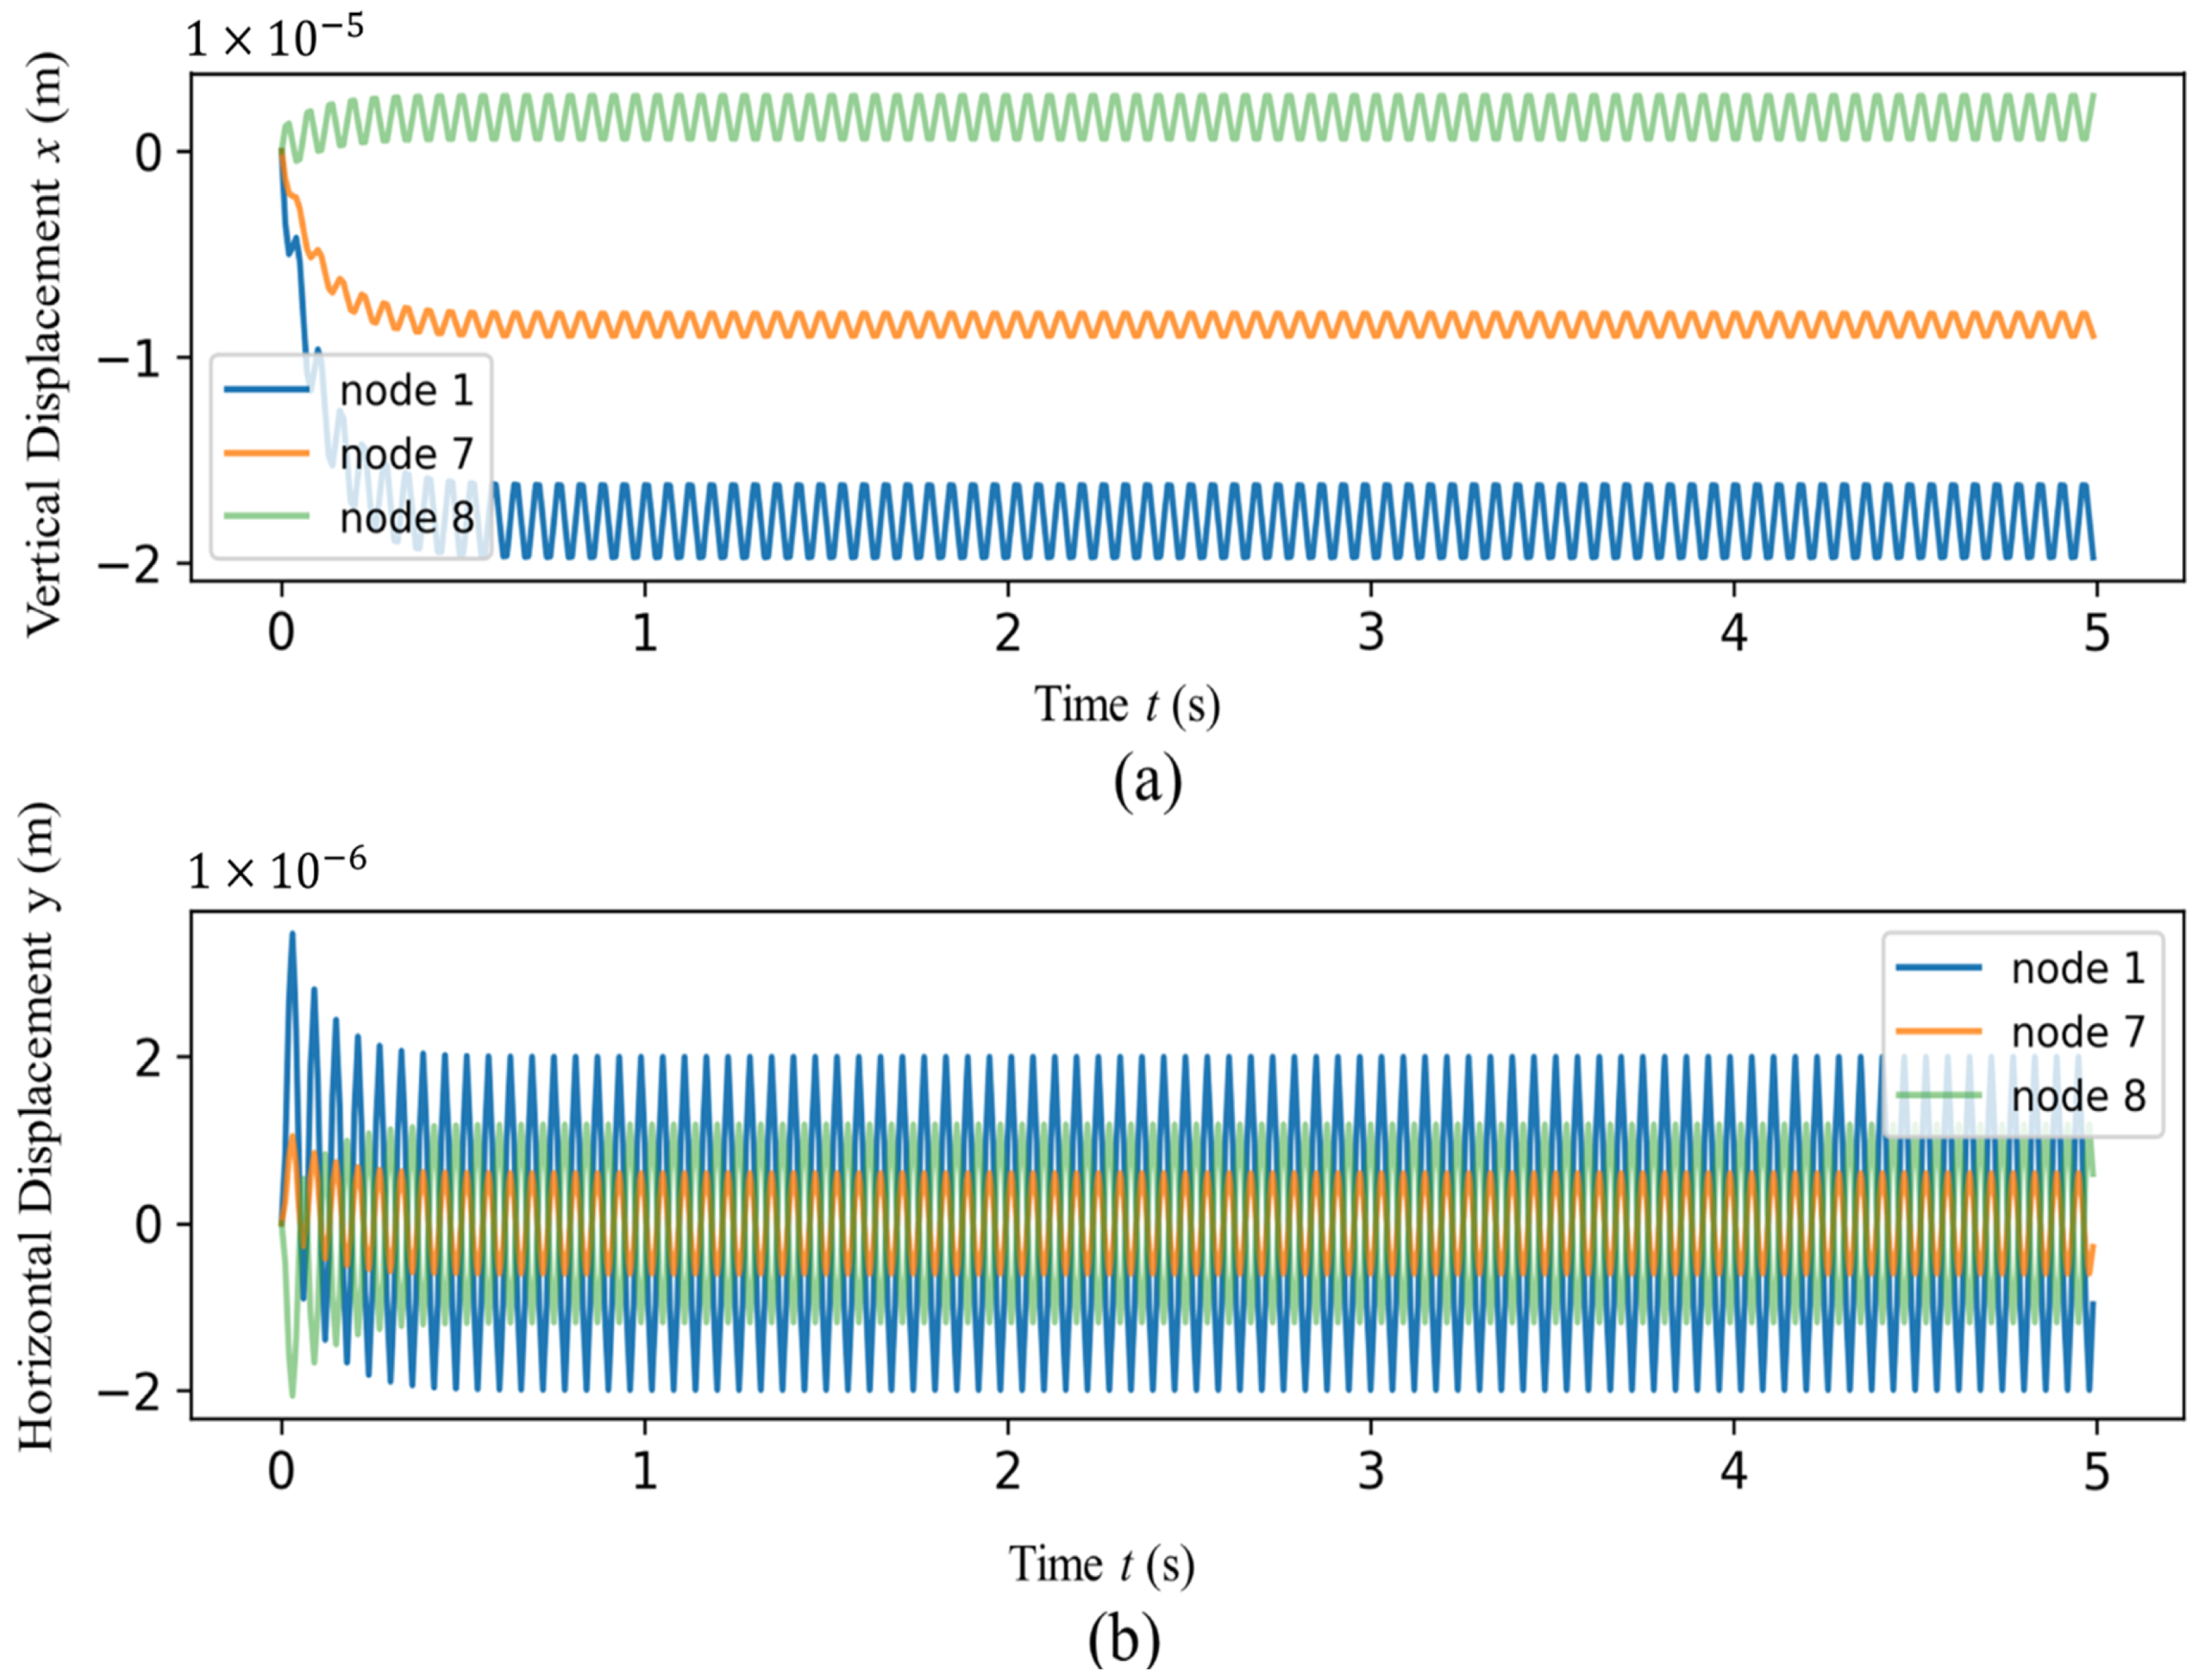
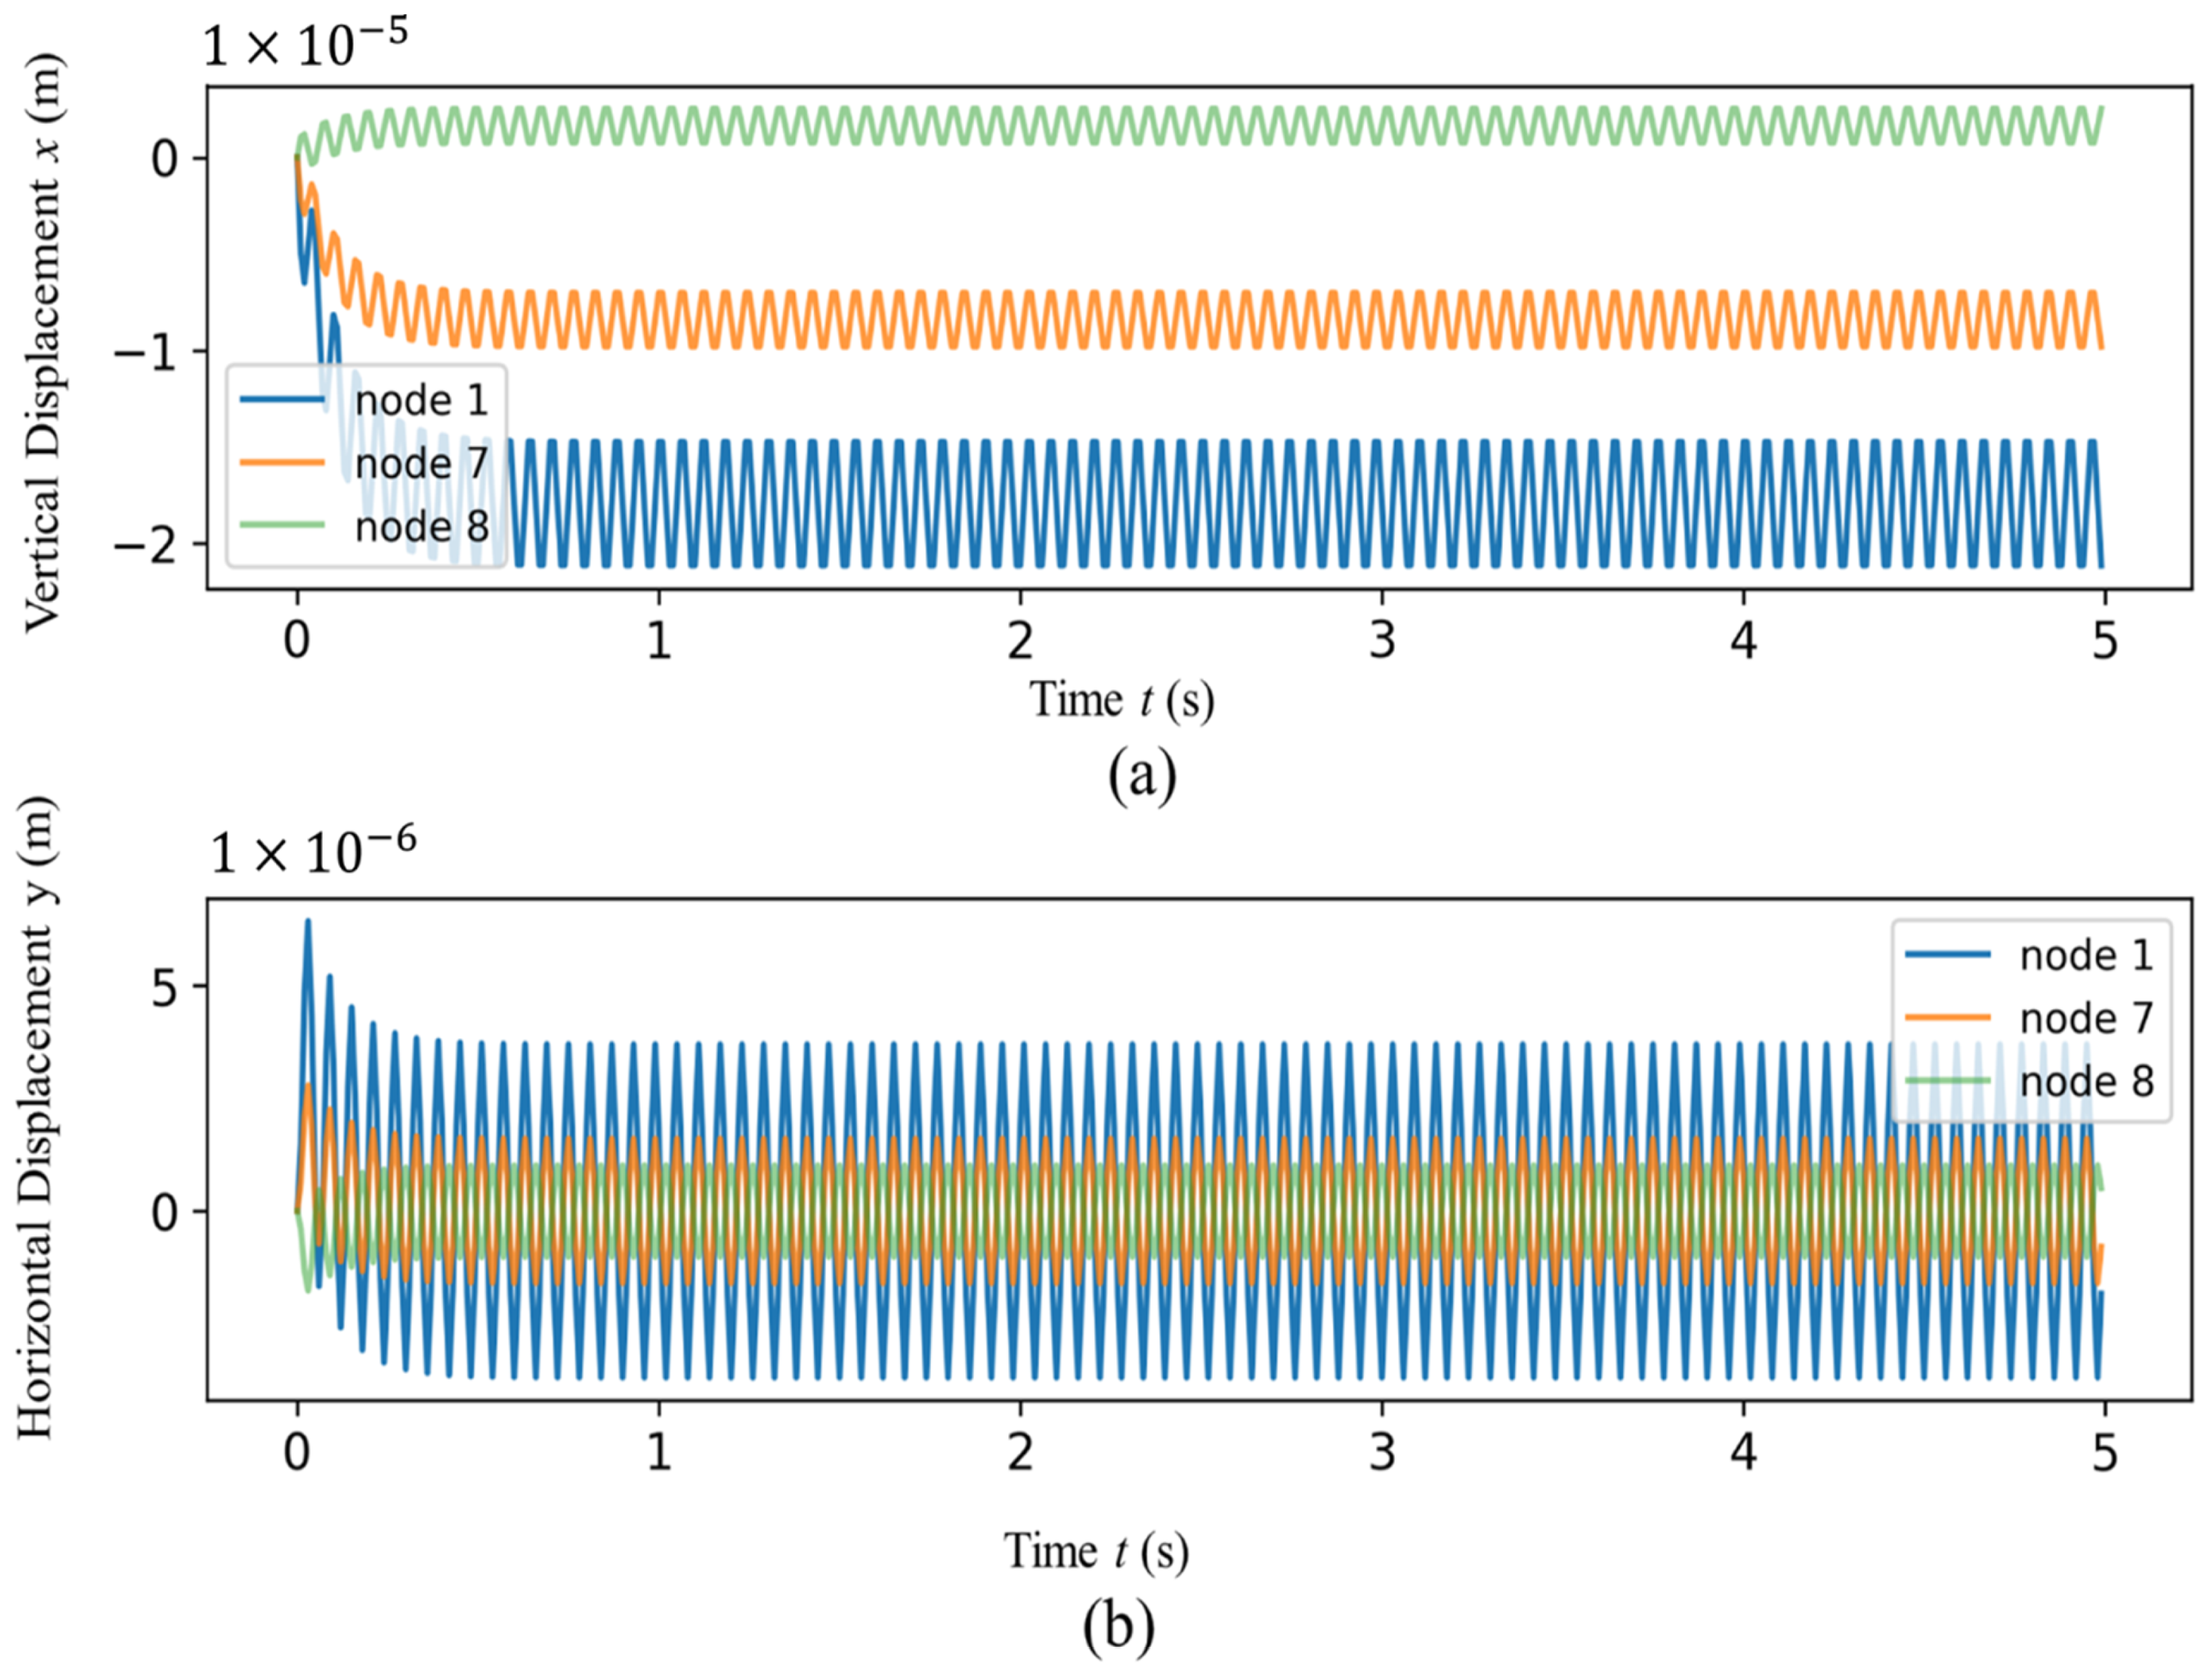
3. Numerical Analysis of the System
3.1. The Critical Speed of the Rotor with Overhang
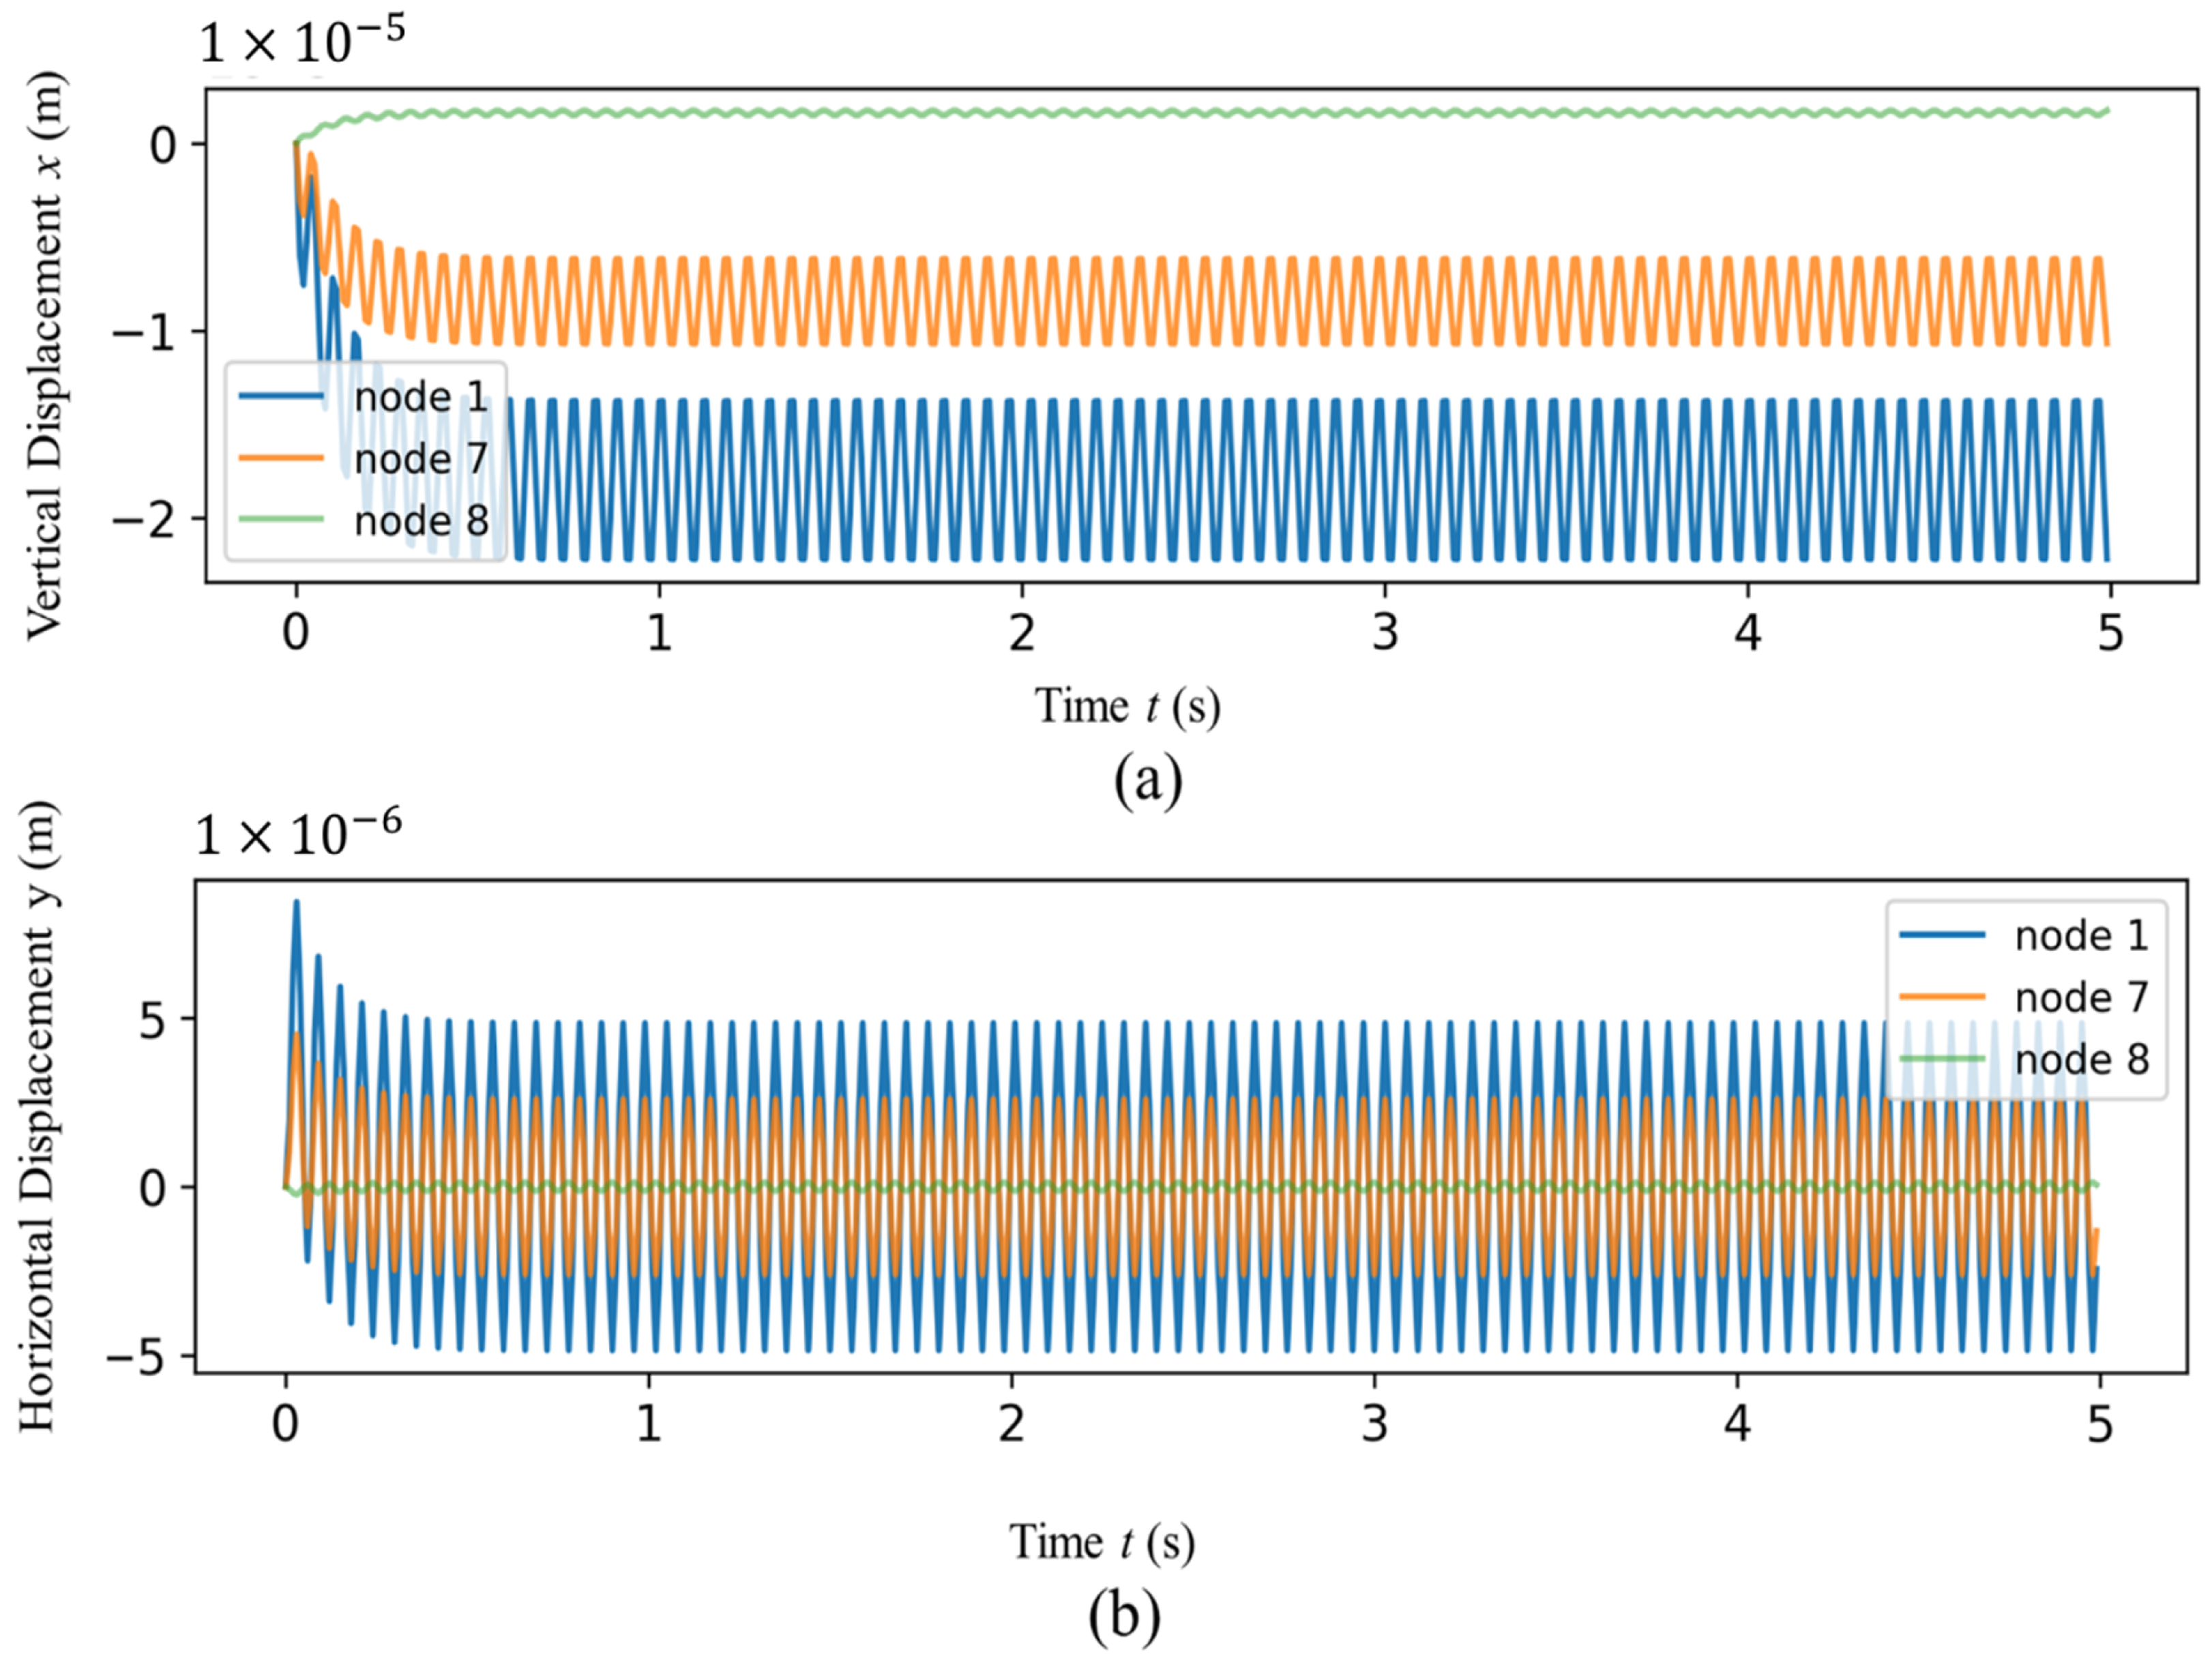
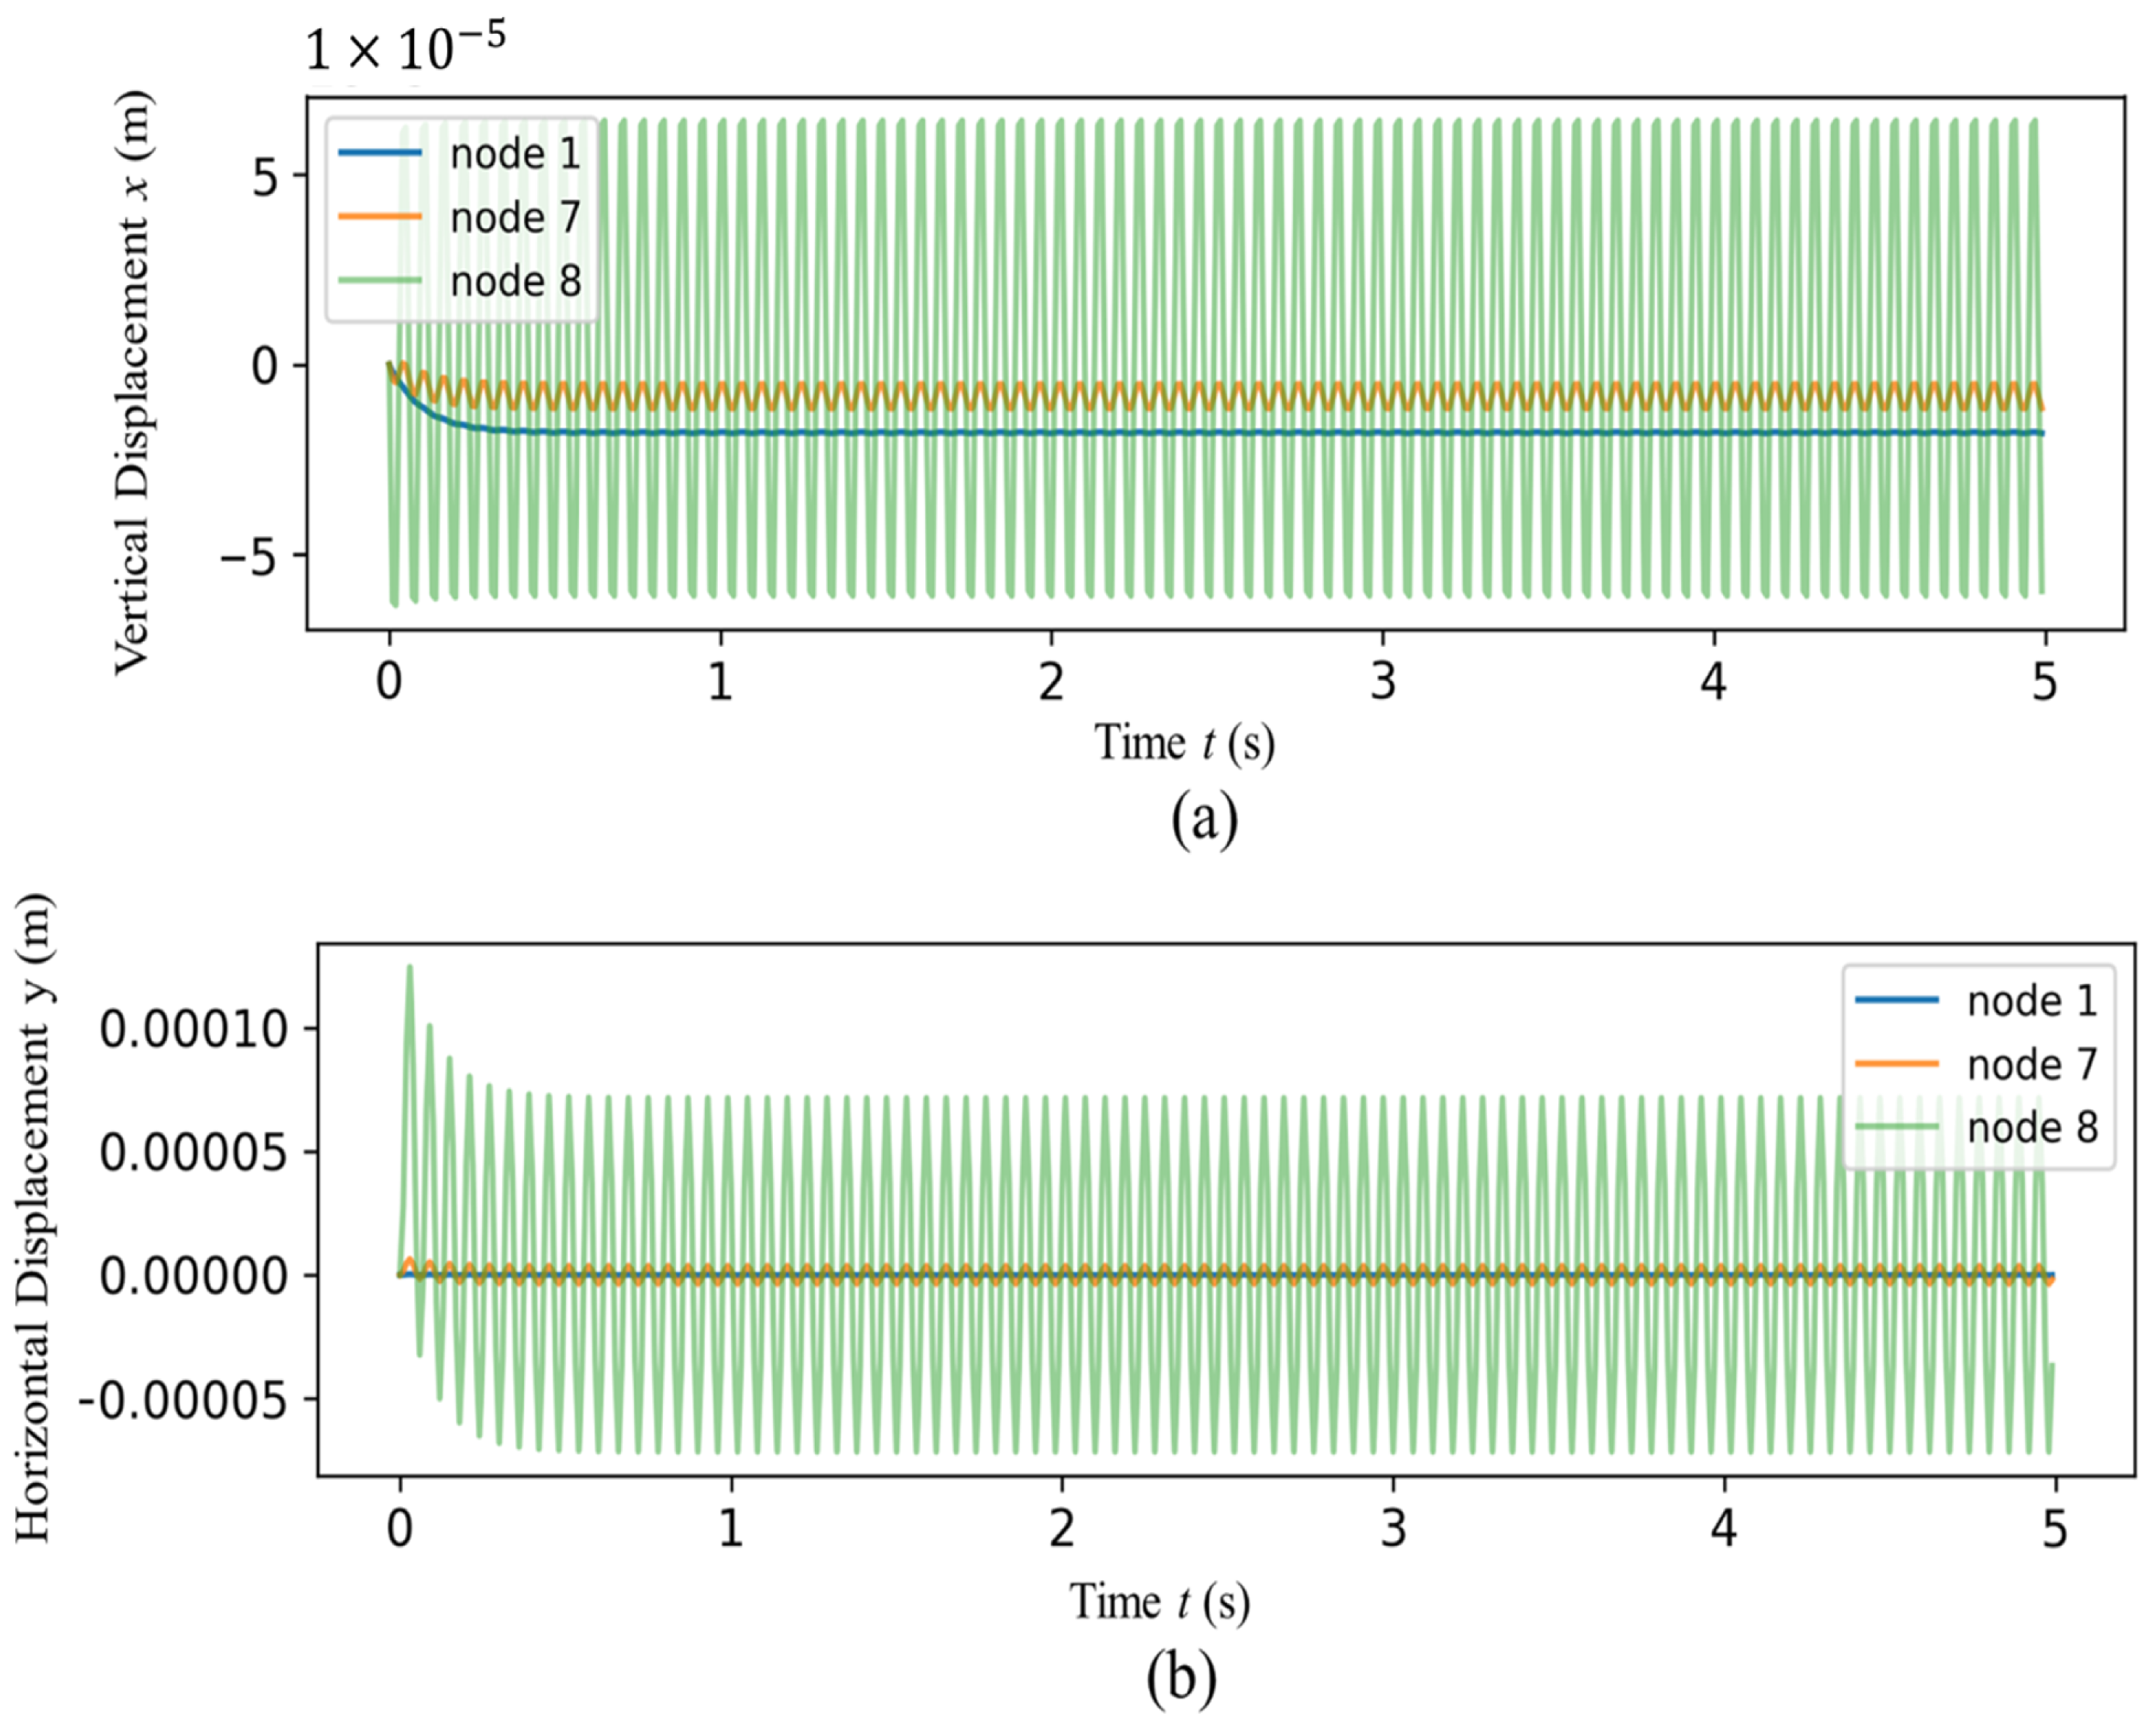
3.2. The Correlation Analysis of the Rotor with Overhang
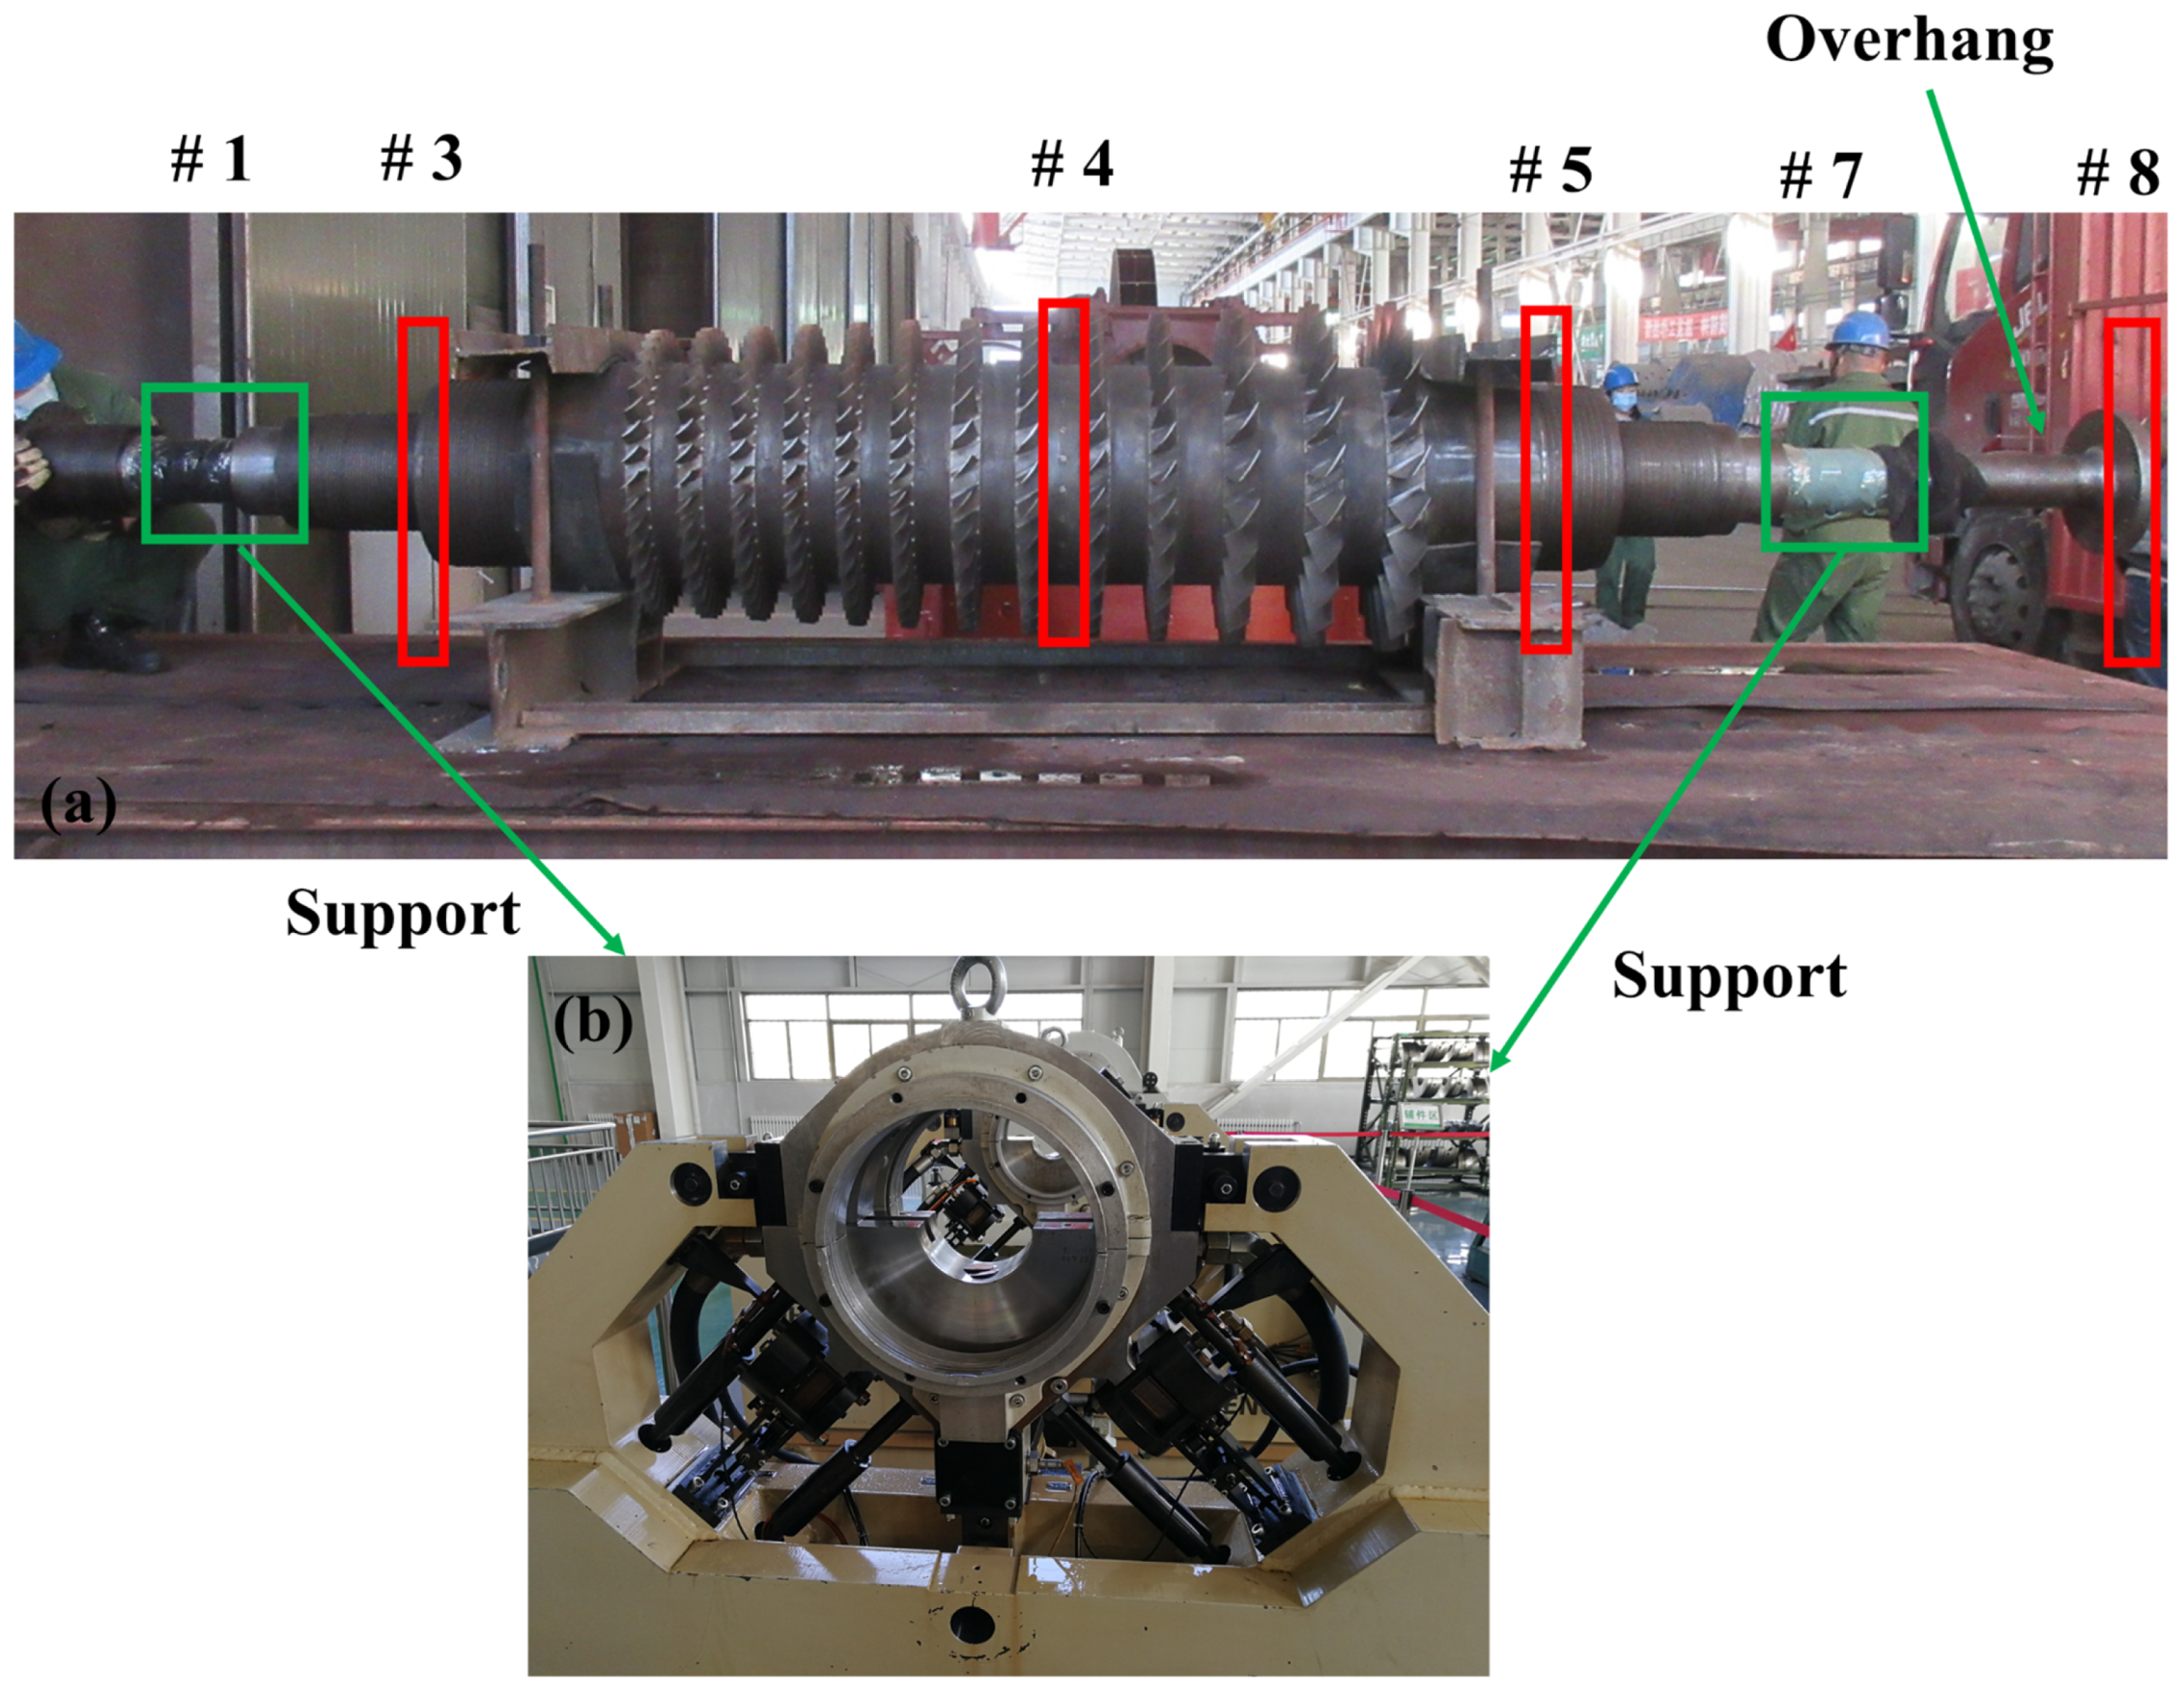
4. Experimental Test
4.1. Experiment Descriptions
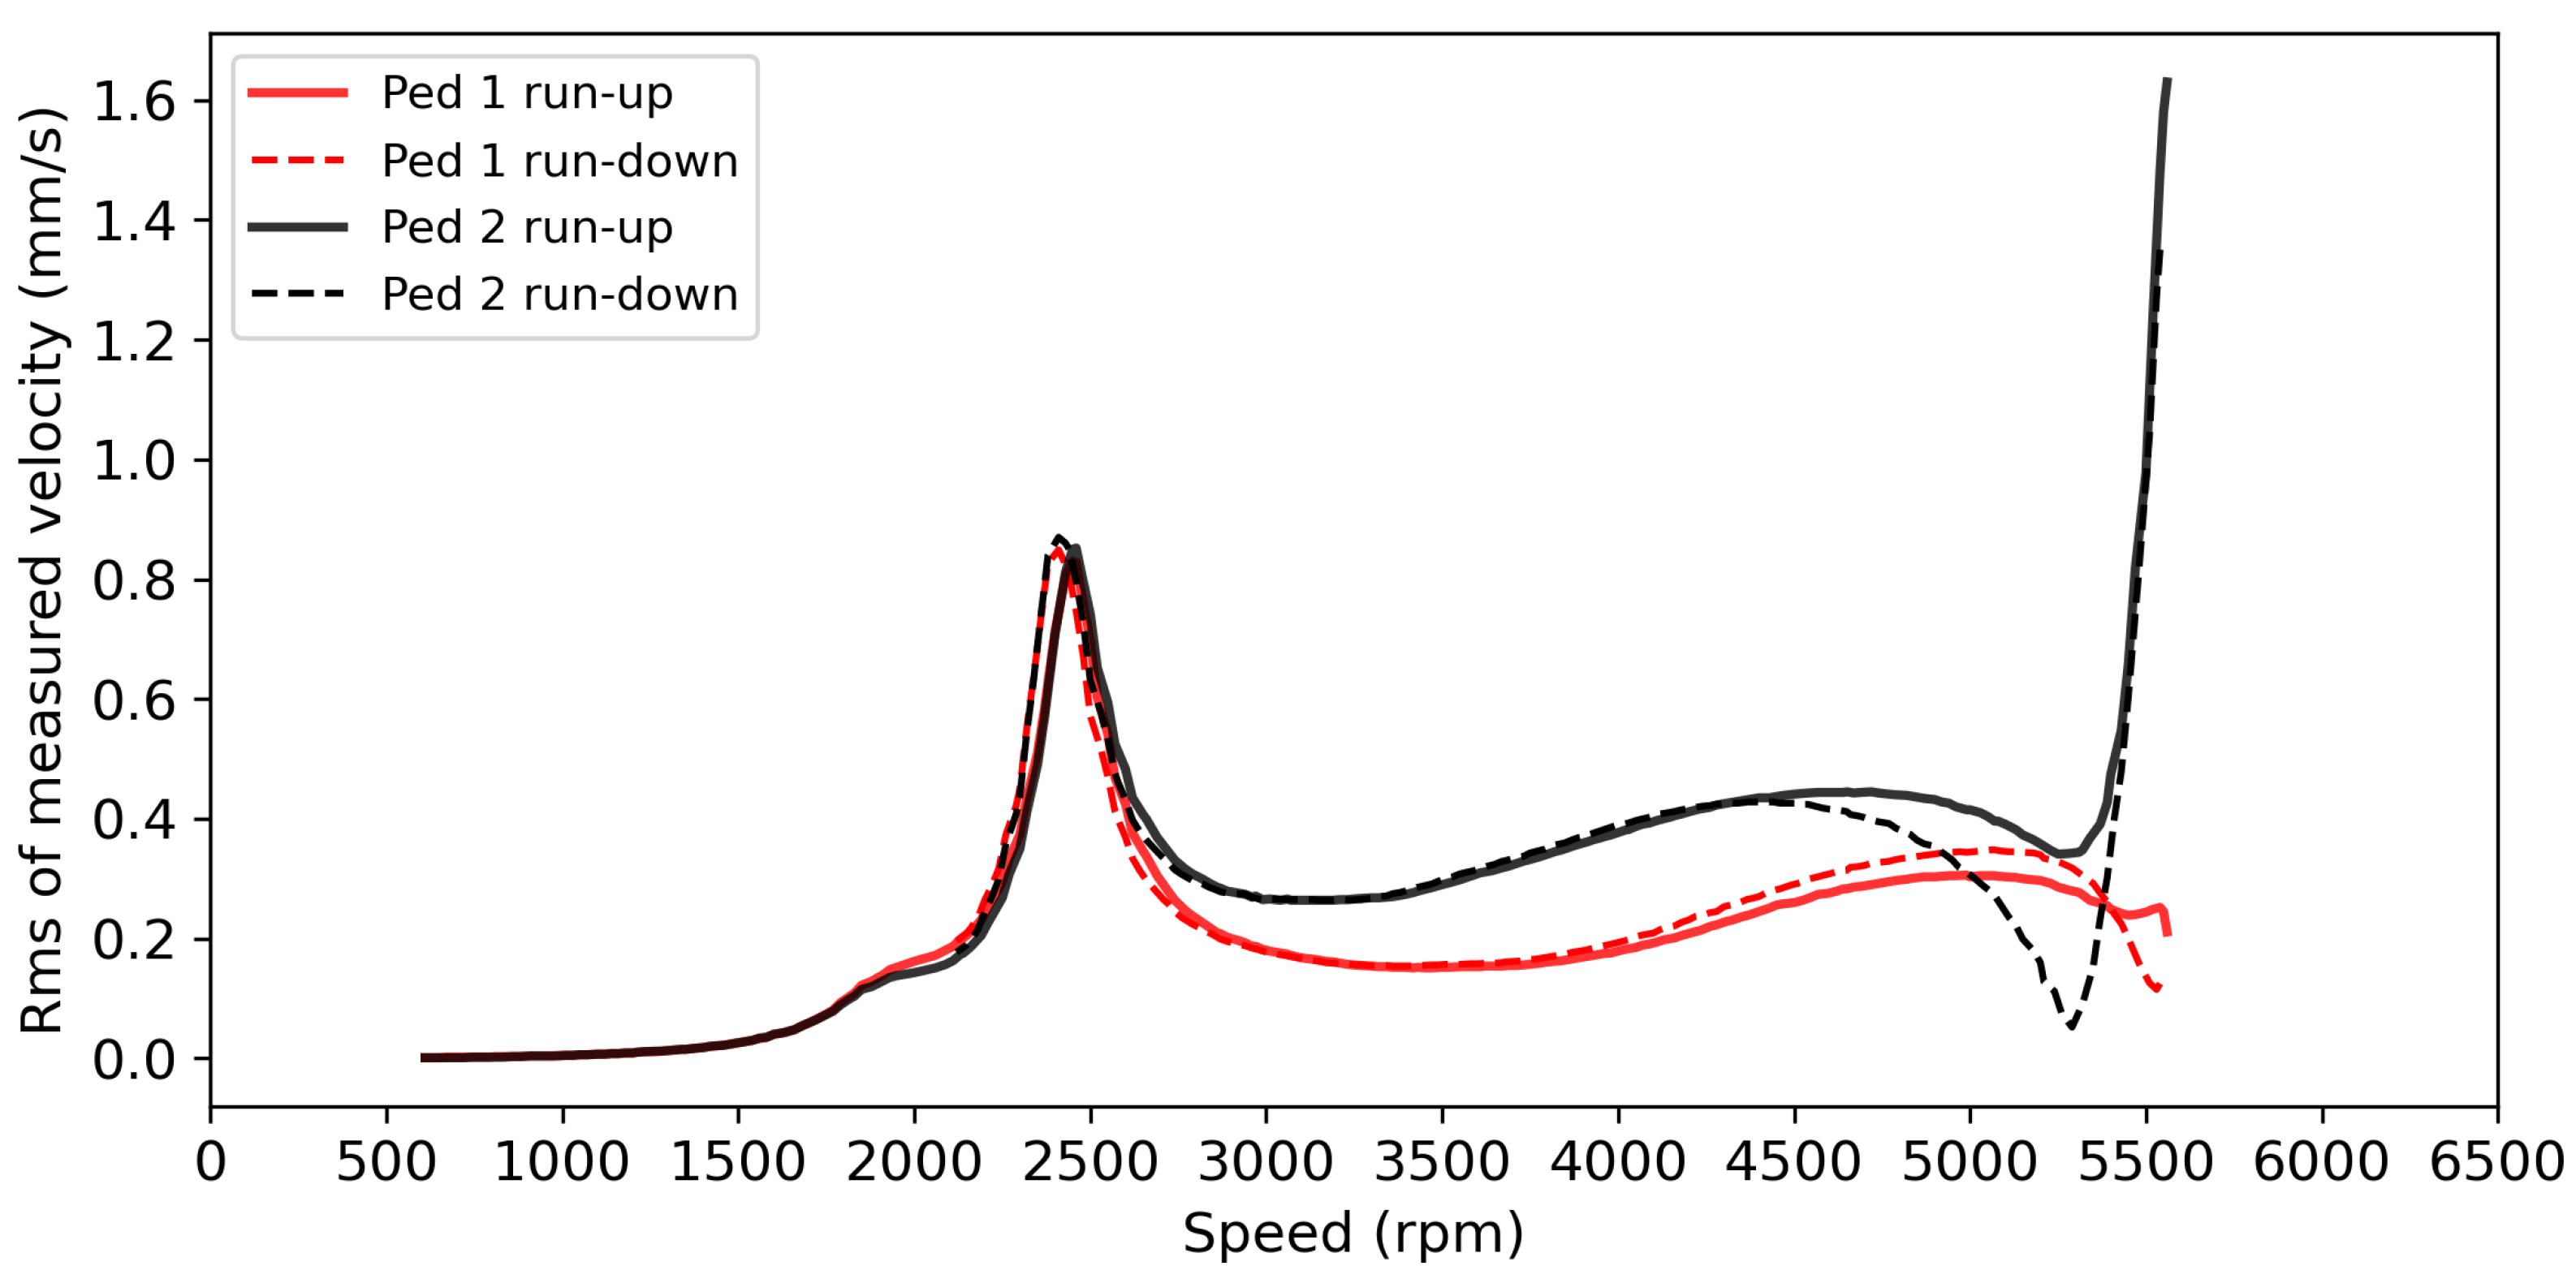
4.2. Experiment Procedure
5. Discussion and Conclusions
Author Contributions
Funding
Institutional Review Board Statement
Informed Consent Statement
Data Availability Statement
Conflicts of Interest
References
- Shin, H.; Shin, K.; Jang, G.; Cho, S.; Jung, K.; Choi, J. Experimental Verification and 2D Equivalent Analysis Techniques of BLDC Motor With Permanent Magnet Overhang and Housing-Integrated Rotor Core. IEEE Trans. Appl. Supercond. 2020, 30, 1–5. [Google Scholar] [CrossRef]
- Petukhov, I.; Akinin, K.; Filomenko, A. Influence of the Magnetic Field of the Overhang Parts of the Micromotor Winding on the Rotor Position Sensor. In Proceedings of the 2020 IEEE Problems of Automated Electrodrive. Theory and Practice (PAEP), Kremenchuk, Ukraine, 21–25 September 2020; pp. 1–4. [Google Scholar]
- Lee, J.; Kim, R.; Jung, H.; Yeo, H. Electromagnetic and thermal analyses of surface-mounted permanent magnet motor with flux-absorbing structure for enhancing overhang effect. IET Electr. Power Appl. 2020, 14, 2037–2043. [Google Scholar] [CrossRef]
- Shin, H.; Jang, G.; Choi, J. Quasi-3D electromagnetic analysis and experimental verification of multi-pole magnetization BLDC motor. AIP Adv. 2020, 10, 015218. [Google Scholar] [CrossRef]
- Fedorynenko, D.; Kirigaya, R.; Nakao, Y. Dynamic characteristics of spindle with water-lubricated hydrostatic bearings for ultra-precision machine tools. Precis. Eng. 2020, 63, 187–196. [Google Scholar] [CrossRef]
- Yao, S.; Griffith, D.T.; Chetan, M.; Bay, C.J.; Damiani, R.; Kaminski, M.; Loth, E. A gravo-aeroelastically scaled wind turbine rotor at field-prototype scale with strict structural requirements. Renew. Energy 2020, 156, 535–547. [Google Scholar] [CrossRef]
- Hwang, Y.J.; Jang, J.Y.; Jeon, H. Overhang Effect Analysis of a Homopolar HTS Synchronous Generator Using 3D Finite Element Method. IEEE Trans. Appl. Supercond. 2020, 30, 1–5. [Google Scholar] [CrossRef]
- Bak, C.; Forsting, A.M.; Sorensen, N.N. The influence of leading edge roughness, rotor control and wind climate on the loss in energy production. J. Phys. Conf. Ser. 2020, 1618, 052050. [Google Scholar] [CrossRef]
- Shin, K.; Bang, T.; Cho, H.; Choi, J. Design and Analysis of High-Speed Permanent Magnet Synchronous Generator With Rotor Structure Considering Electromechanical Characteristics. IEEE Trans. Appl. Supercond. 2020, 30, 1–5. [Google Scholar] [CrossRef]
- Ludecke, F.D.; Cheng, P.W. Simplified design criteria for drivetrains in direct-drive wind turbines. J. Phys. Conf. Ser. 2020, 1618, 042024. [Google Scholar] [CrossRef]
- Ferede, E.; Gandhi, F. Aeroelastic Analysis of a Quad-Rotor Wind Turbine. In Proceedings of the AIAA Scitech 2021 Forum, Nashville, TN, USA, 11–15 January 2021; p. 0813. [Google Scholar]
- Filsoof, O.T.; Hansen, M.H.; Yde, A.; Bottcher, P.; Zhang, X. A novel methodology for analyzing modal dynamics of multi-rotor wind turbines. J. Sound Vib. 2021, 493, 115810. [Google Scholar] [CrossRef]
- Ortolani, A.; Persico, G.; Drofelnik, J.; Jackson, A.; Campobasso, M.S. High-fidelity calculation of floating offshore wind turbines under pitching motion. In Turbo Expo: Power for Land, Sea, and Air; American Society of Mechanical Engineers: New York, NY, USA, 2020; Volume 84249, p. V012T42A012. [Google Scholar]
- Kumar, C.V.S.; Vivek, E.K.; Vignesh, S. Rotordynamic Analysis and Redesign of High-Pressure Turbine Test Rig. In Proceedings of the 6th National Symposium on Rotor Dynamics; Springer: Berlin/Heidelberg, Germany, 2021; pp. 77–91. [Google Scholar]
- Van der Male, P.; Van Schaik, R.; Vergassola, M.; van Dalen, K.N. Tower shadow excitation of a downwind rotor blade of a turbine with a tubular tower. J. Phys. Conf. Ser. 2020, 1618, 032019. [Google Scholar] [CrossRef]
- Cao, D.; Wang, L.; Chen, Y.; Huang, W. Bifurcation and chaos of the bladed overhang rotor system with squeeze film dampers. Sci. China Ser. E Technol. Sci. 2009, 52, 709–720. [Google Scholar] [CrossRef]
- Koo, M.; Choi, J.; Park, Y.; Jang, S. Influence of rotor overhang variation on generating performance of axial flux permanent magnet machine based on 3-D analytical method. IEEE Trans. Magn. 2014, 50, 1–5. [Google Scholar] [CrossRef]
- Gong, X.; Cao, D. Fuzzy proportional-integral-derivative control of an overhang rotor with double discs based on the active tilting pad journal bearing. J. Vib. Control 2013, 19, 1487–1498. [Google Scholar] [CrossRef]
- Kim, K.; Lee, J. Overhang effect analysis of permanent magnet machine according to the rotor types. In Proceedings of the 2006 12th Biennial IEEE Conference on Electromagnetic Field Computation, Miami, FL, USA, 30 April–3 May 2006; p. 414. [Google Scholar]
- Yu, D.; Huang, X.; Wu, L.; Fang, Y. Design and Analysis of Outer Rotor Permanent-Magnet Vernier Machines with Overhang Structure for In-Wheel Direct-Drive Application. Energies 2019, 12, 1238. [Google Scholar] [CrossRef] [Green Version]
- Seo, J.; Ro, A. Analysis and Design of Spoke-type Ferrite Permanent Magnet Motor with Rotor Overhang. In Proceedings of the 2018 IEEE 18th International Power Electronics and Motion Control Conference (PEMC), Budapest, Hungary, 26–30 August 2018; pp. 512–517. [Google Scholar]
- Kim, H.; Jung, T. Analysis of rotor overhang effect considering load torque variance in automobile BLDC fan motor. In Proceedings of the 2012 IEEE Vehicle Power and Propulsion Conference, Seoul, Korea, 9–12 October 2012; pp. 68–71. [Google Scholar]
- Noyes, C.; Qin, C.; Loth, E. Pre-aligned downwind rotor for a 13.2 MW wind turbine. Renew. Energy 2018, 116, 749–754. [Google Scholar] [CrossRef]
- Ma, Y.; Liang, Z.; Zhang, D.; Yan, W.; Hong, J. Experimental investigation on dynamical response of an overhung rotor due to sudden unbalance. In Turbo Expo: Power for Land, Sea, and Air; American Society of Mechanical Engineers: New York, NY, USA, 2015; Volume 56772, p. V07BT32A009. [Google Scholar]
- Zhao, F.; Kwon, B. Optimal design of asymmetric rotor overhang lengths in an axial-flux dual-stator permanent magnet vernier machine. In Proceedings of the 2015 IEEE International Magnetics Conference (INTERMAG), Beijing, China, 11–15 May 2015; p. 1. [Google Scholar]
- Tamrakar, R.; Mittal, N.D.; Singh, R.K. Experimental Comparison of Response for Healthy and Cracked Overhung Rotor System. Arab. J. Sci. Eng. 2021, 46, 11701–11710. [Google Scholar] [CrossRef]
- Tiaki, M.M.; Hosseini, S.A.A.; Zamanian, M. Nonlinear forced vibrations analysis of overhung rotors with unbalanced disk. Arch. Appl. Mech. 2016, 86, 797–817. [Google Scholar] [CrossRef]
- Tamrakar, R.; Mittal, N.D. Comparison of response to unbalance of overhung rotor system for different supports. Int. J. Mech. Eng. Technol. 2017, 8, 56–65. [Google Scholar]
- Tamrakar, R.; Mittal, N.D. Crack detection in an overhung rotor system using external harmonic excitation. In Advances in Rotor Dynamics, Control, and Structural Health Monitoring; Springer: Berlin/Heidelberg, Germany, 2020; pp. 159–169. [Google Scholar]
- Capone, G. Analytical description of fluid-dynamic force field in cylindrical journal bearing. L’Energia Elettr. 1991, 3, 105–110. [Google Scholar]

| Node 1–2 | Node 2–3 | Node 3–4 | Node 4–5 | Node 5–6 | Node 6–7 | Node 7–8 | |
|---|---|---|---|---|---|---|---|
| Length | 435 mm | 235 mm | 1117.5 mm | 1117.5 mm | 185 mm | 420 mm | 555 mm |
| Diameter | 235 mm | 369 mm | 588 mm | 588 mm | 386 mm | 252 mm | 126 mm |
| Parameters | Value |
|---|---|
| Young’s module E | 100 × Pa |
| Density | 7.85 × kg/m |
| Poisson’s ratio | 0.211 |
| Axial force H | 0 |
| Order of Stiffness | First-Order | Second-Order | Third-Order |
|---|---|---|---|
| 13.5 Hz | 28.5 Hz | 349.3 Hz | |
| 39.6 Hz | 86.3 Hz | 360.9 Hz | |
| 80.6 Hz | 201.8 Hz | 416.4 Hz |
| Correlation (m/kg) | |||
|---|---|---|---|
| 3 to 1 | 3 to 7 | 3 to 8 | |
| x | |||
| y | |||
| 4 to 1 | 4 to 7 | 4 to 8 | |
| x | |||
| y | |||
| 5 to 1 | 5 to 7 | 5 to 8 | |
| x | |||
| y | |||
| 8 to 1 | 8 to 7 | 8 to 8 | |
| x | |||
| y |
| Correlation (m/kg) | |||
|---|---|---|---|
| 3 to 1 | 3 to 7 | 3 to 8 | |
| x | |||
| y | |||
| 4 to 1 | 4 to 7 | 4 to 8 | |
| x | |||
| y | |||
| 5 to 1 | 5 to 7 | 5 to 8 | |
| x | |||
| y | |||
| 8 to 1 | 8 to 7 | 8 to 8 | |
| x | |||
| y |
| Correlation (m/kg) | |||
|---|---|---|---|
| 3 to 1 | 3 to 7 | 3 to 8 | |
| x | |||
| y | |||
| 4 to 1 | 4 to 7 | 4 to 8 | |
| x | |||
| y | |||
| 5 to 1 | 5 to 7 | 5 to 8 | |
| x | |||
| y | |||
| 8 to 1 | 8 to 7 | 8 to 8 | |
| x | |||
| y |
Publisher’s Note: MDPI stays neutral with regard to jurisdictional claims in published maps and institutional affiliations. |
© 2021 by the authors. Licensee MDPI, Basel, Switzerland. This article is an open access article distributed under the terms and conditions of the Creative Commons Attribution (CC BY) license (https://creativecommons.org/licenses/by/4.0/).
Share and Cite
Zhong, S.; Zhang, S.; Yang, J.; Zhang, Y. Correlation Analysis and Its Application on an Asymmetry Rotor Structure with Overhang. Appl. Sci. 2021, 11, 11501. https://doi.org/10.3390/app112311501
Zhong S, Zhang S, Yang J, Zhang Y. Correlation Analysis and Its Application on an Asymmetry Rotor Structure with Overhang. Applied Sciences. 2021; 11(23):11501. https://doi.org/10.3390/app112311501
Chicago/Turabian StyleZhong, Shun, Suxia Zhang, Jie Yang, and Yanan Zhang. 2021. "Correlation Analysis and Its Application on an Asymmetry Rotor Structure with Overhang" Applied Sciences 11, no. 23: 11501. https://doi.org/10.3390/app112311501
APA StyleZhong, S., Zhang, S., Yang, J., & Zhang, Y. (2021). Correlation Analysis and Its Application on an Asymmetry Rotor Structure with Overhang. Applied Sciences, 11(23), 11501. https://doi.org/10.3390/app112311501