Article

Design and Experimental Validation of Power Electric Vehicle Emulator for Testing Electric Vehicle Supply Equipment (EVSE) with Vehicle-to-Grid (V2G) Capability

by
Eduardo García-Martínez
1,*,
Jesús Muñoz-Cruzado-Alba
1,
José F. Sanz-Osorio
2 and
Juan Manuel Perié
1
1
Fundación CIRCE, Parque Empresarial Dinamiza, Avenida Ranillas Edificio 3D, 1ª Planta, 50018 Zaragoza, Spain
2
Instituto Universitario de Investigación CIRCE, Universidad de Zaragoza, Edificio CIRCE, Campus Río Ebro, C/Mariano Esquillor Gómez 15, 50018 Zaragoza, Spain
*
Author to whom correspondence should be addressed.
Appl. Sci. 2021, 11(23), 11496; https://doi.org/10.3390/app112311496
Submission received: 19 October 2021 / Revised: 22 November 2021 / Accepted: 30 November 2021 / Published: 4 December 2021
(This article belongs to the Special Issue Advances on Smart Cities and Smart Buildings)

Abstract

:
Nowadays, the global decarbonization and electrification of the world’s energy demands have led to the quick adoption of Electric Vehicle (EV) technology. Therefore, there is an urgent need to provide a wide network of fast Vehicle-to-Grid (V2G) charging stations to support the forecast demand and to enable enough autonomy of such devices. Accordingly, V2G charging stations must be prepared to work properly with every manufacturer and to provide reliable designs and validation processes. In this way, the development of power electric vehicle emulators with V2G capability is critical to enable such development. The paper presents a complete design of a power electric vehicle emulator, as well as an experimental testbench to validate the behaviour of the proposal.

1. Introduction

The development of the Smart Grid is contributing to the integration of renewable energy into the electric grid, which guides the needed decarbonization of energy consumption to deal with climate change and the depletion of fossil fuels. However, this development is increasing the complexity of the electric grid [1], adding new power system elements which must provide reliable operation in all kinds of different situations. One of these new systems is the Electric Vehicle Supply Equipment (EVSE), which is required for the grid integration of the Electric Vehicle (EV), including Battery Electric Vehicle (BEV) and Plug-in Hybrid Electric Vehicle (PHEV). Thanks to the Vehicle-to-Grid (V2G) functionality, the EVSE can work both as a load or as a generation source, using the energy of the EV battery available for secondary purposes, such as peak shaving, load frequency control, demand response or the management of renewable energy surplus [2,3].
It is expected than in 2030, more than the 90% of the EVSE will be private [4], while over the 80% of EV charging currently takes place at home [5]. Accordingly, the main domains for V2G functionality will be Vehicle-to-Building (V2B) or Vehicle-to-Home (V2H), whether the building is connected to the grid or isolated, where several advantages has been proved [6]. In order to use this functionality, EVSE must be integrated into the building Energy Managment System (EMS), which will handle the charging or discharging according to the needs of the building [7,8]. Therefore, to ensure the proper behaviour of these new systems, the research of suitable test systems can establish the Smart Grid development [9,10].
There are several test system techniques in the literature, but the ones that exchange real power with the Hardware-Under-Test (HUT) give the most accurate results, due to the fact that they can probe the full system. A very promising technique to test the full system is the Power Hardware-In-the-Loop (PHIL) technique, which has the best trade-off between test fidelity and test coverage [11]. However, in applications like testing EV chargers, in which the number of tests carried out can be very high and they have a very defined functionality, the PHIL technique can be replaced by a power test bed, or also known as machine emulator [12].
Electric Vehicle Emulators EVE are powerful tools to develop and test EV charging stations. They have been used for a while for testing EVSE communication [13], unidirectional power [14,15] or unidirectional power and communications [16,17]. Besides, the requirements needed for a test bench based on PHIL for testing and verification of EV and EVSE are defined in [18]. However, bidirectional vehicles and chargers have a better impact on the stability of the Smart Grid, offering expanded flexibility services [5]. Therefore, the testing of these systems is an important step in the development of the present and future power electric grid.
This paper presents the details of the design and development for manufacturing the electric vehicle emulator for testing V2G chargers, with power factor grid correction functionality. The paper is organized as follows. Firstly, Section 2 analyses the main needs of the Electric Vehicle Emulator (EVE). The design of the system is described in Section 3, explaining every developed component. Then, in Section 4 the complete test system and some of the main results are shown. Finally, the conclusions are drawn in Section 5.

2. EV Emulator Needs

The EV battery needs a bidirectional power electronics system to charge and discharge its energy to the electric grid. However, current on-board EV chargers are only unidirectional and are not able to give energy to the grid. The main reason is that, as a rule of thumb, the unidirectional topologies can get higher power densities (W/m 3 ) and more specific power (W/kg) than the bidirectional ones. Therefore, the V2G functionality is only available in DC standards, because in this case, the bidirectional power electronics converter is located in the EVSE, where the specific power index is not especially important.
Table 1 shows the current status of the DC chargers standards. Among these standards, CHAdeMO [19] is the first and most used standard with V2G capability [20]. There have been five updates of the protocol in order to include the different necessities of the new EV and their uses. Consequently, an electric vehicle emulator compatible with this standard will cover most of V2G EVSE in the market.
Accordingly, the EVE also needs a bi-directional power electronics system to test both charge and discharge. If the emulator takes energy from the same point of common coupling as the V2G charger, the electric consumption during the test is only the sum of EV emulator and V2G charger losses, which saves in general more than 90% of the test energy. Furthermore, if the power factor is close to 1, the test can be done in facilities with lower electric power supply, which also saves money and allows testing in several places. This is important for testing unidirectional chargers, especially old EVSE [21], since the Active Front End (AFE) can be a topology with no control of the reactive power consumed during the charging state. Therefore, an EVE with a four-quadrants AFE will be able to test different types of EVSE, ensuring low apparent power consumption during the complete test.
The end user of EVE should be laboratories which need to check the integration of the EV in a specific electric grid; for instance to test stability, time response, compatibility, etc. However, it could also be interesting for EVSE manufacturers to check the behaviour of their developments and for maintenance purposes. Therefore, extra functionality to debug the correct behaviour of the EVSE will be desired.

3. EV Emulator Design
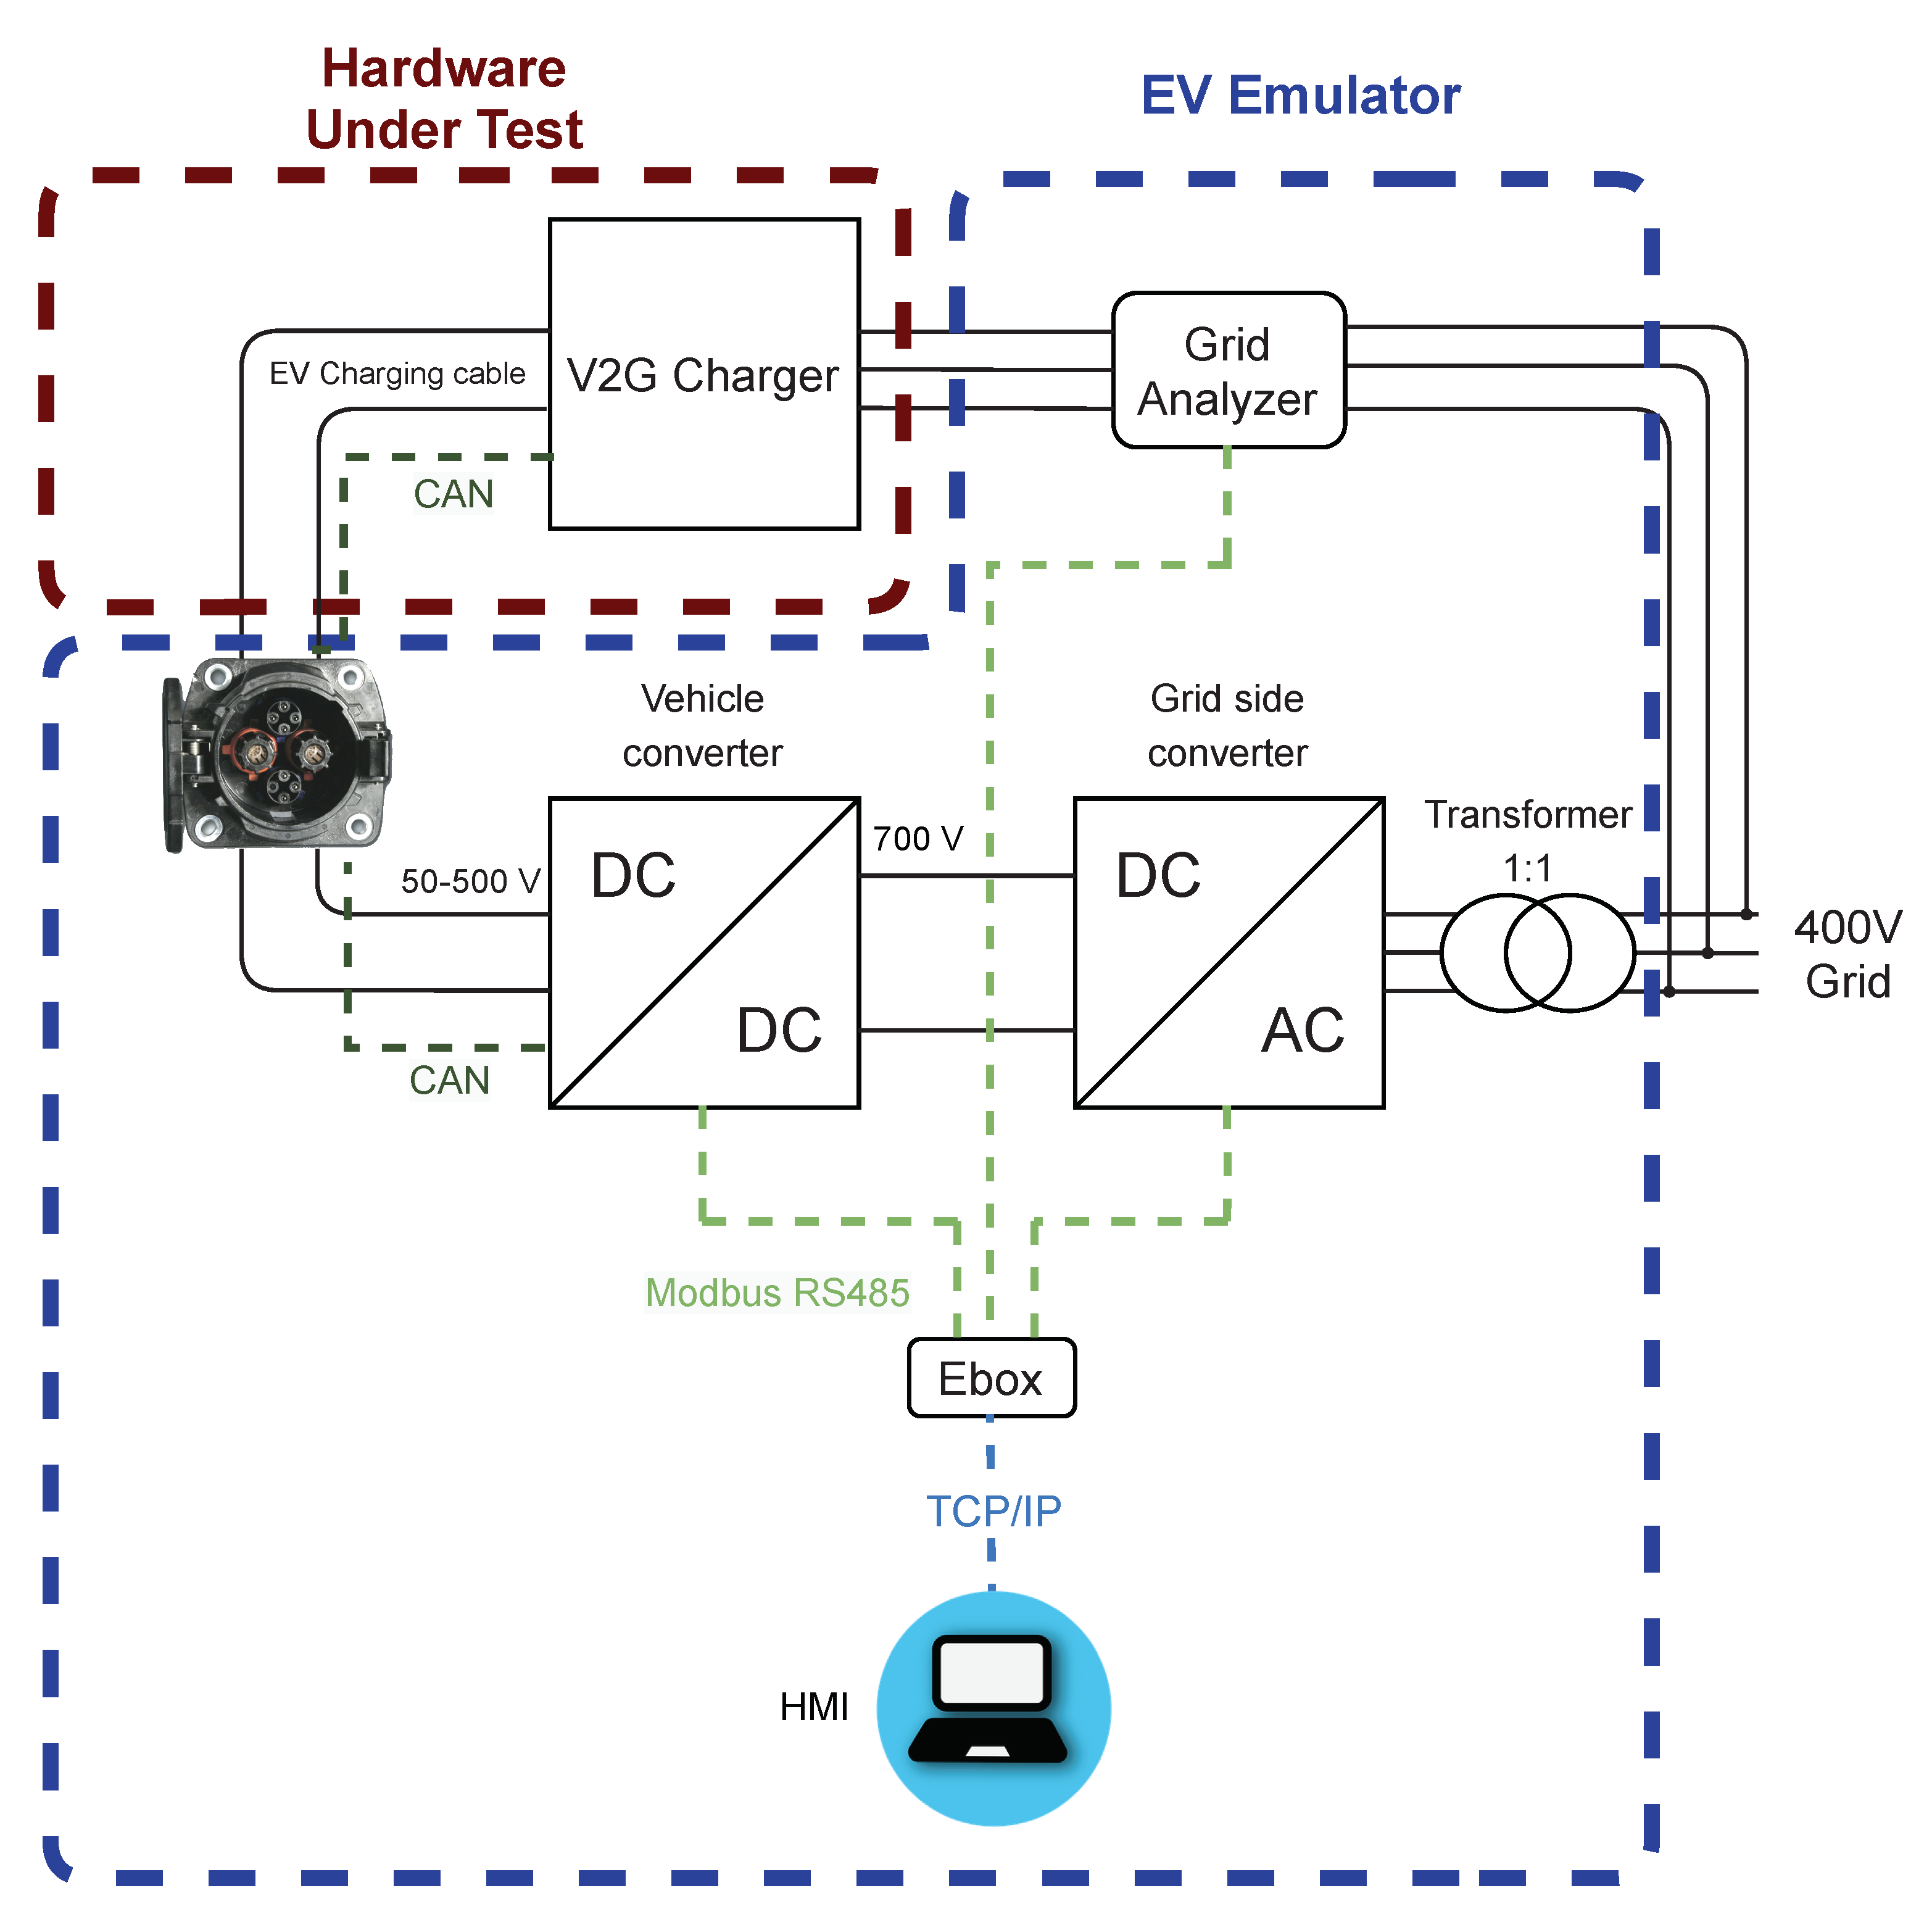
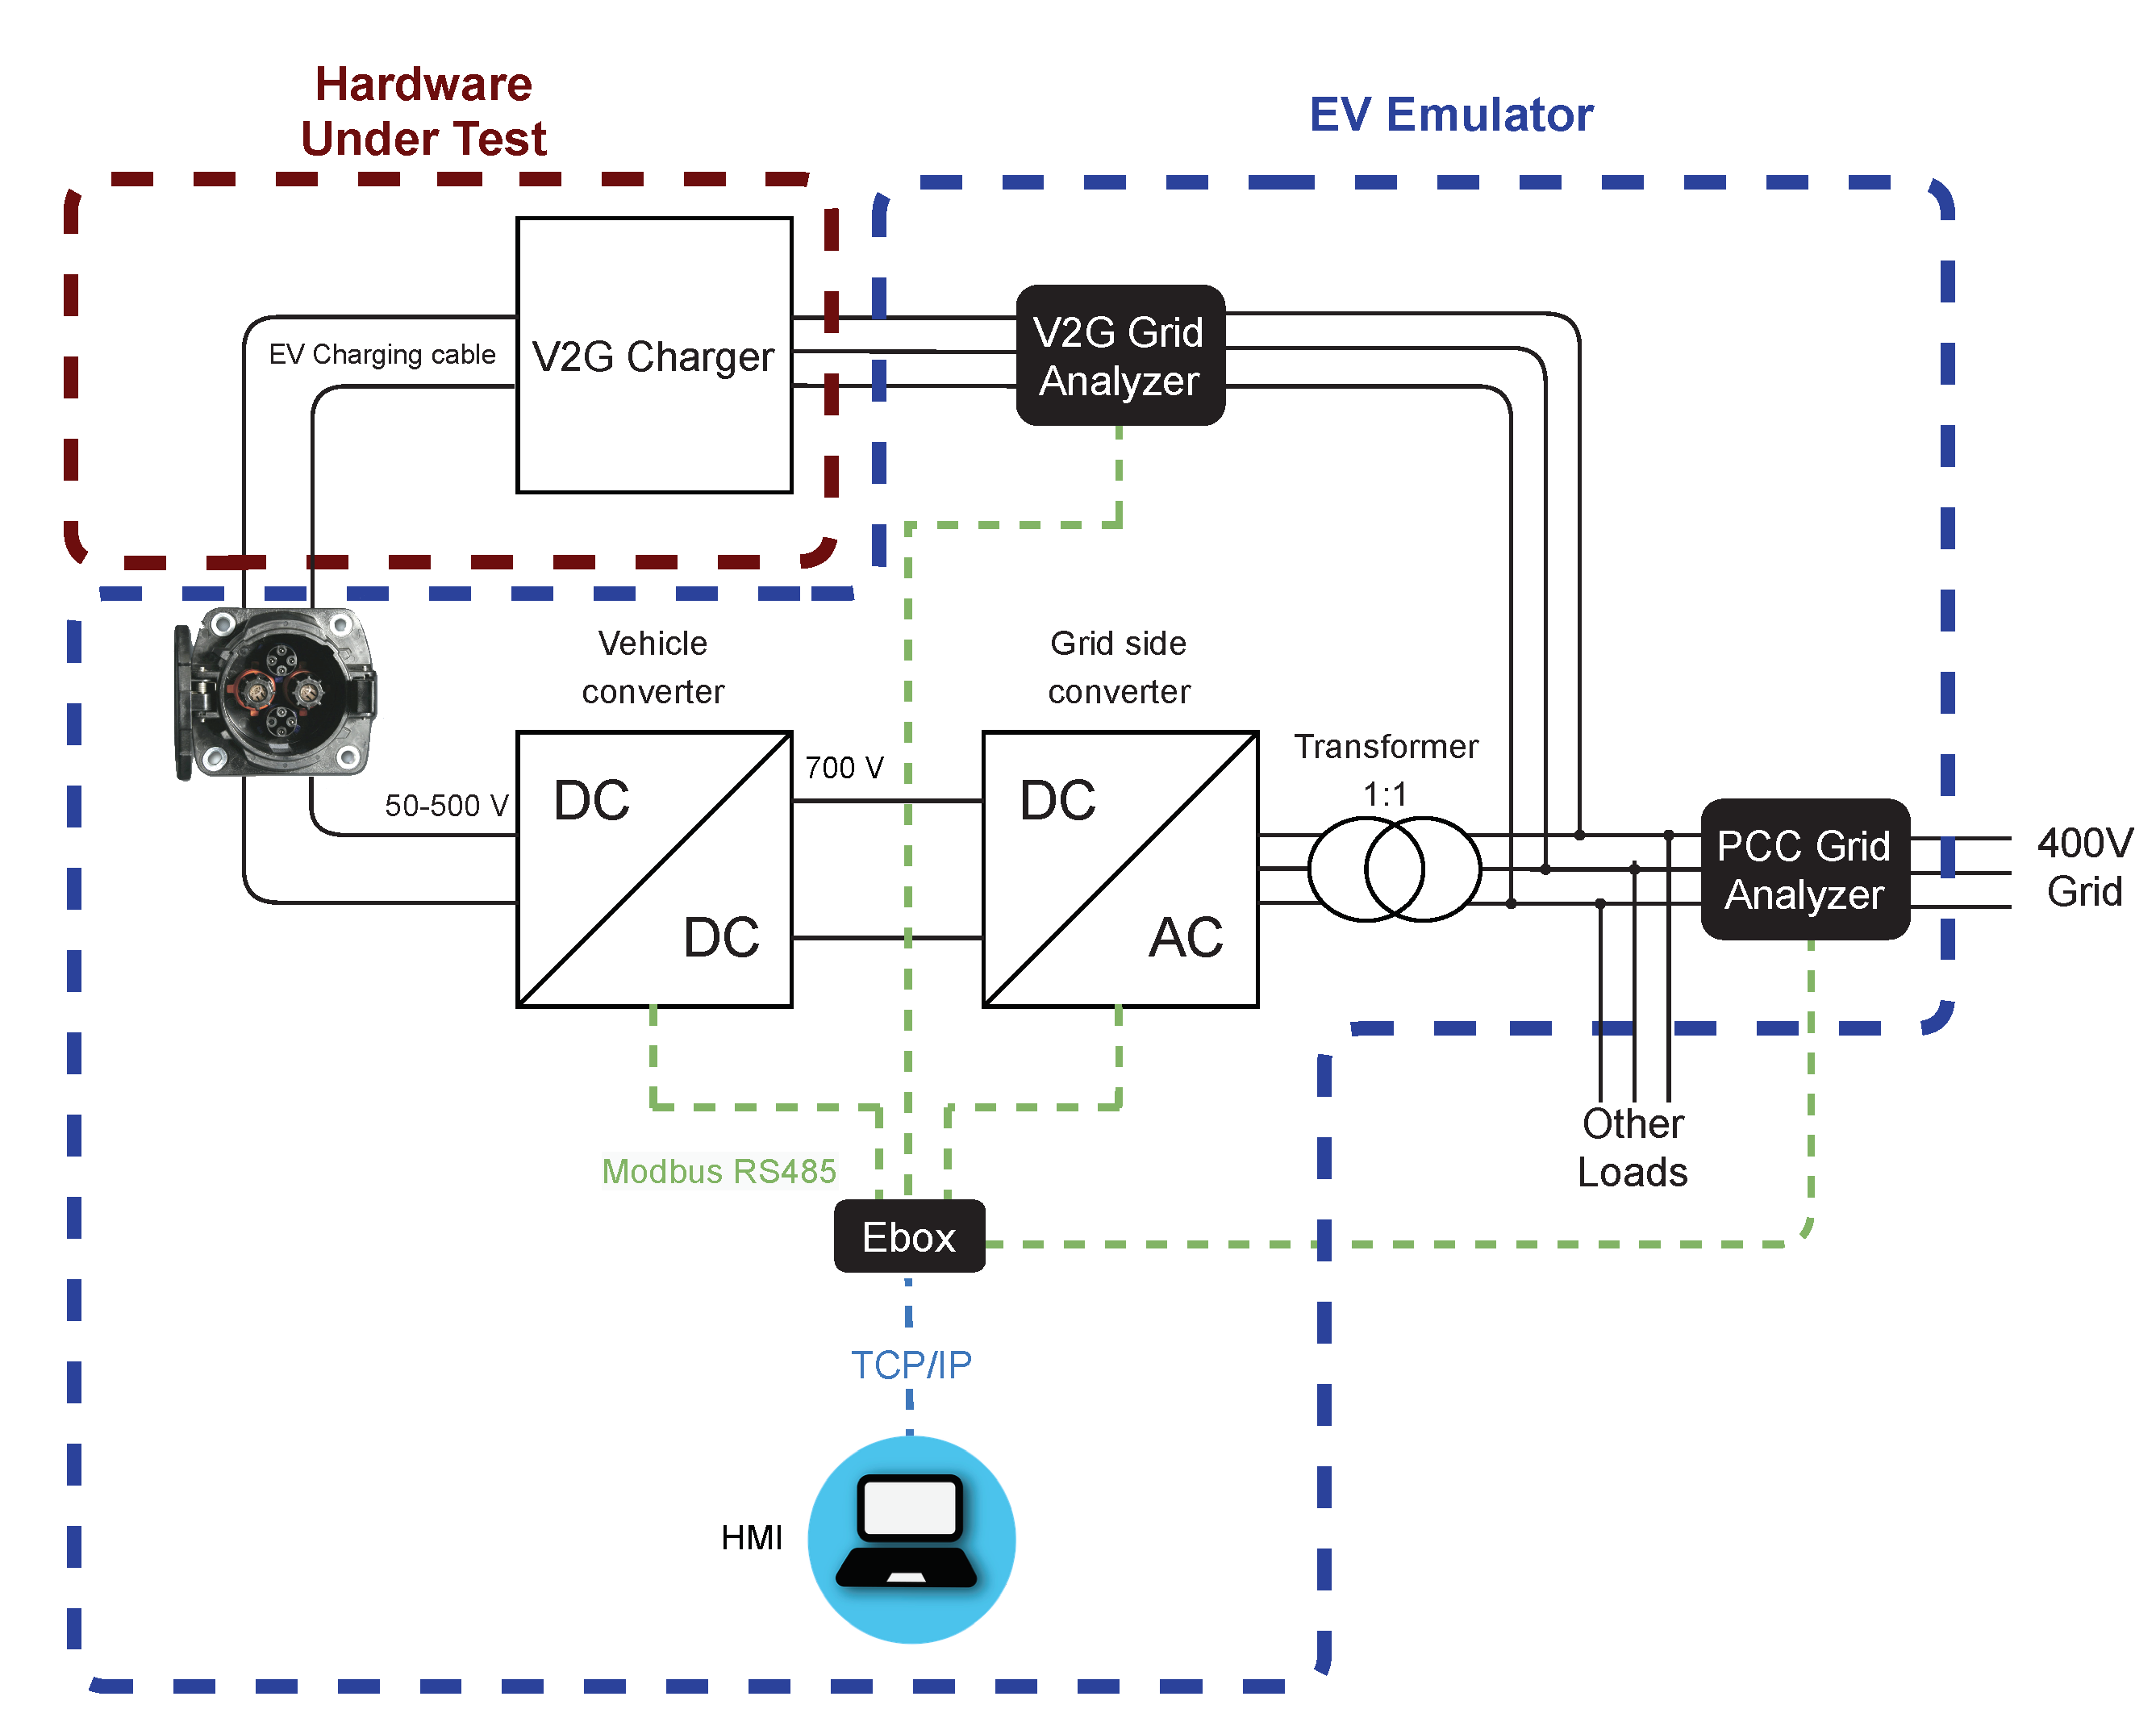
3.1. Overview

A block diagram of the complete EV emulator system proposed with the HUT EV charger connection is shown in Figure 1.
The power electronics system is built up of one AC/DC grid side converter and one DC/DC vehicle converter, whose specifications are listed in Table 2. The two components communicate through an embedded low cost gateway, which is called Energy Box (EBox) [22], via Modbus RS485. The EBox also communicates via Modbus RS485 with the grid analyzer to measure in real time the active and reactive power of the HUT and with the Human–Machine Interface (HMI) via TCP/IP. Furthermore, a CHAdeMO protocol communication via CAN has been implemented in the DC/DC, which allows the emulator to interact with HUT, setting the power limits and the desired current during the test. In order to have galvanic isolation in the whole system, a three-phase transformer / Δ is connected between the AFE and the electric grid at 400 Vrms and 50 Hz.

3.2. DC/DC Converter

3.2.1. Hardware Design

Figure 2 shows the schematic of the DC/DC converter. A three-branches in parallel bridge topology to generate the battery output voltage emulation has been designed. Switching frequency of the IGBTs (SEMIKRON SEMIX302GB12E4s) are 20 kHz, working in the non audible spectrum. A carrier phase-shift scheme is adopted to make the equivalent switching frequency up to 60 kHz, reducing the output voltage ripple, and also the selection of IGBTs with less current capability but better switching efficiency.
The output filter is an LC filter, with three coils connected in parallel to the output capacitor. It is a second-order low-pass filter with a resonance frequency ω r e s given by Equation (1):
ω r e s = 3 L C o u t
The resonance frequency of the filter needs to be placed at least one tenth of the switching frequency in order to have a sufficient rejection of the switching components. To avoid resonance problems of the filter, ω r e s is also placed lower than the control frequency of the system. It allows the control to compensate the resonance current implementing a virtual resistance ( R v i r t u a l ), which is placed in series with each inductor. This control method improves the overall efficiency of the system, avoiding physical resistance in the filter to dampen the resonance. However, due to the lower ω r e s , the overall dynamic is reduced but is still enough to guarantee the stability and fidelity of the test. In order to decide the R v i r t u a l , Figure 3 shows the bode plot of the LC filter (Equation (2)) with different resistance values.
G D C f i l t e r ( s ) = 1 L C o u t 3 s 2 + R v i r t u a l C o u t 3 s + 1
Ideally, it can be seen in Figure 3 that with a higher R the system is damper. However, a high R v i r t u a l will also increase the measurement noise of the current, decreasing the steady state performance. A trade-off between dampening and performance has been chosen, selecting a R v i r t u a l = 1 Ω . The frequency response of the filter with the selected resistance is shown in Figure 4, obtaining resonance gain close to 10 dB.

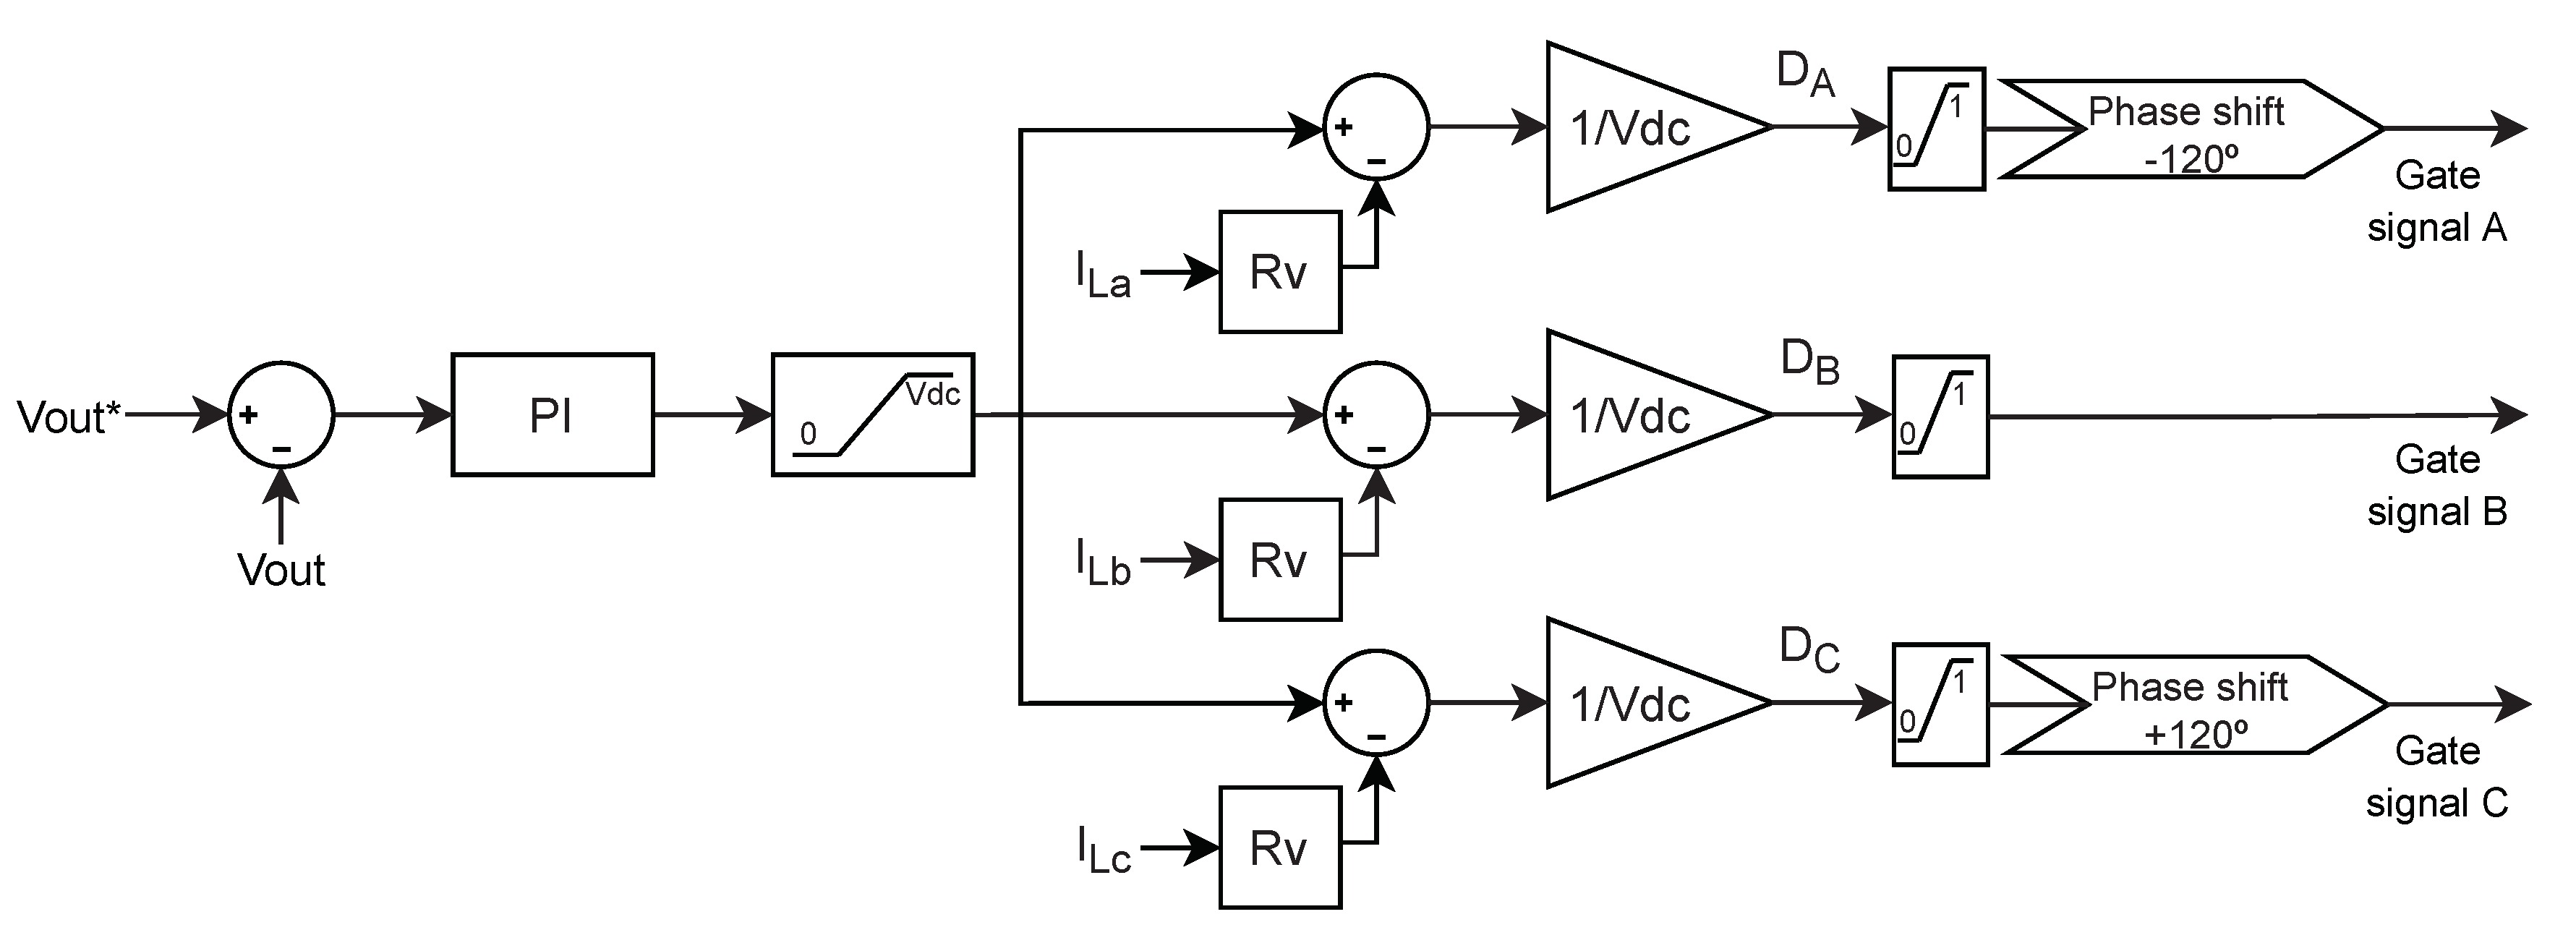
3.2.2. Control Design

The block scheme control of the DC/DC converter is shown in Figure 5.
The current of every coil is measured and multiplied by the R v i r t u a l , getting the emulation effect of a real resistance in the LC filter. A PI control has been chosen in order to get no voltage error in the steady state output capacitor voltage. The output of the PI regulator is subtracted in every branch by the previous calculation of the R v i r t u a l gain, and then divided by the input voltage V d c to obtain the duty cycle in every branch. After that, a carrier phase-shift is implemented in order to obtain 120° phase in each branch PWM.
The gain of this integrator has been calculated to have a cut-off frequency to 16.7 Hz, which gives a step response of the system close to 3 ms. Figure 6 shows the step response of the system to a 40 V instantaneous set-point change.

3.3. AC/DC Converter

3.3.1. Hardware Design

The AC/DC converter, used to exchange power with the electric grid, has been designed and manufactured with a three-level Neutral Point Clamped (NPC) topology with SEMIKRON SK150MLI066T IGBTs, as shown in Figure 7. In comparison with the two level converter, this topology reduces the voltage stress on the IGBTs and their switching losses, increasing the output voltage waveform quality.The attenuation of the current switching ripple is done by a third-order LCL grid filter, which is smaller and lower-priced than the first order L filter [23]. Furthermore, the AC/DC converter can operate in the four quadrants, compensating reactive power if needed, even when the DC/DC converter is not working. This functionality makes it possible to perform the complete set of tests in facilities consuming only the active power losses of the whole testbench. This is because the EVE can compensate whenever the power factor of the charger diverges from 1, especially at low charging levels.

3.3.2. Control Design

Figure 8 shows the general block scheme control of the AC/DC converter, which is based on [24,25]. The controller is divided into the following four layers:
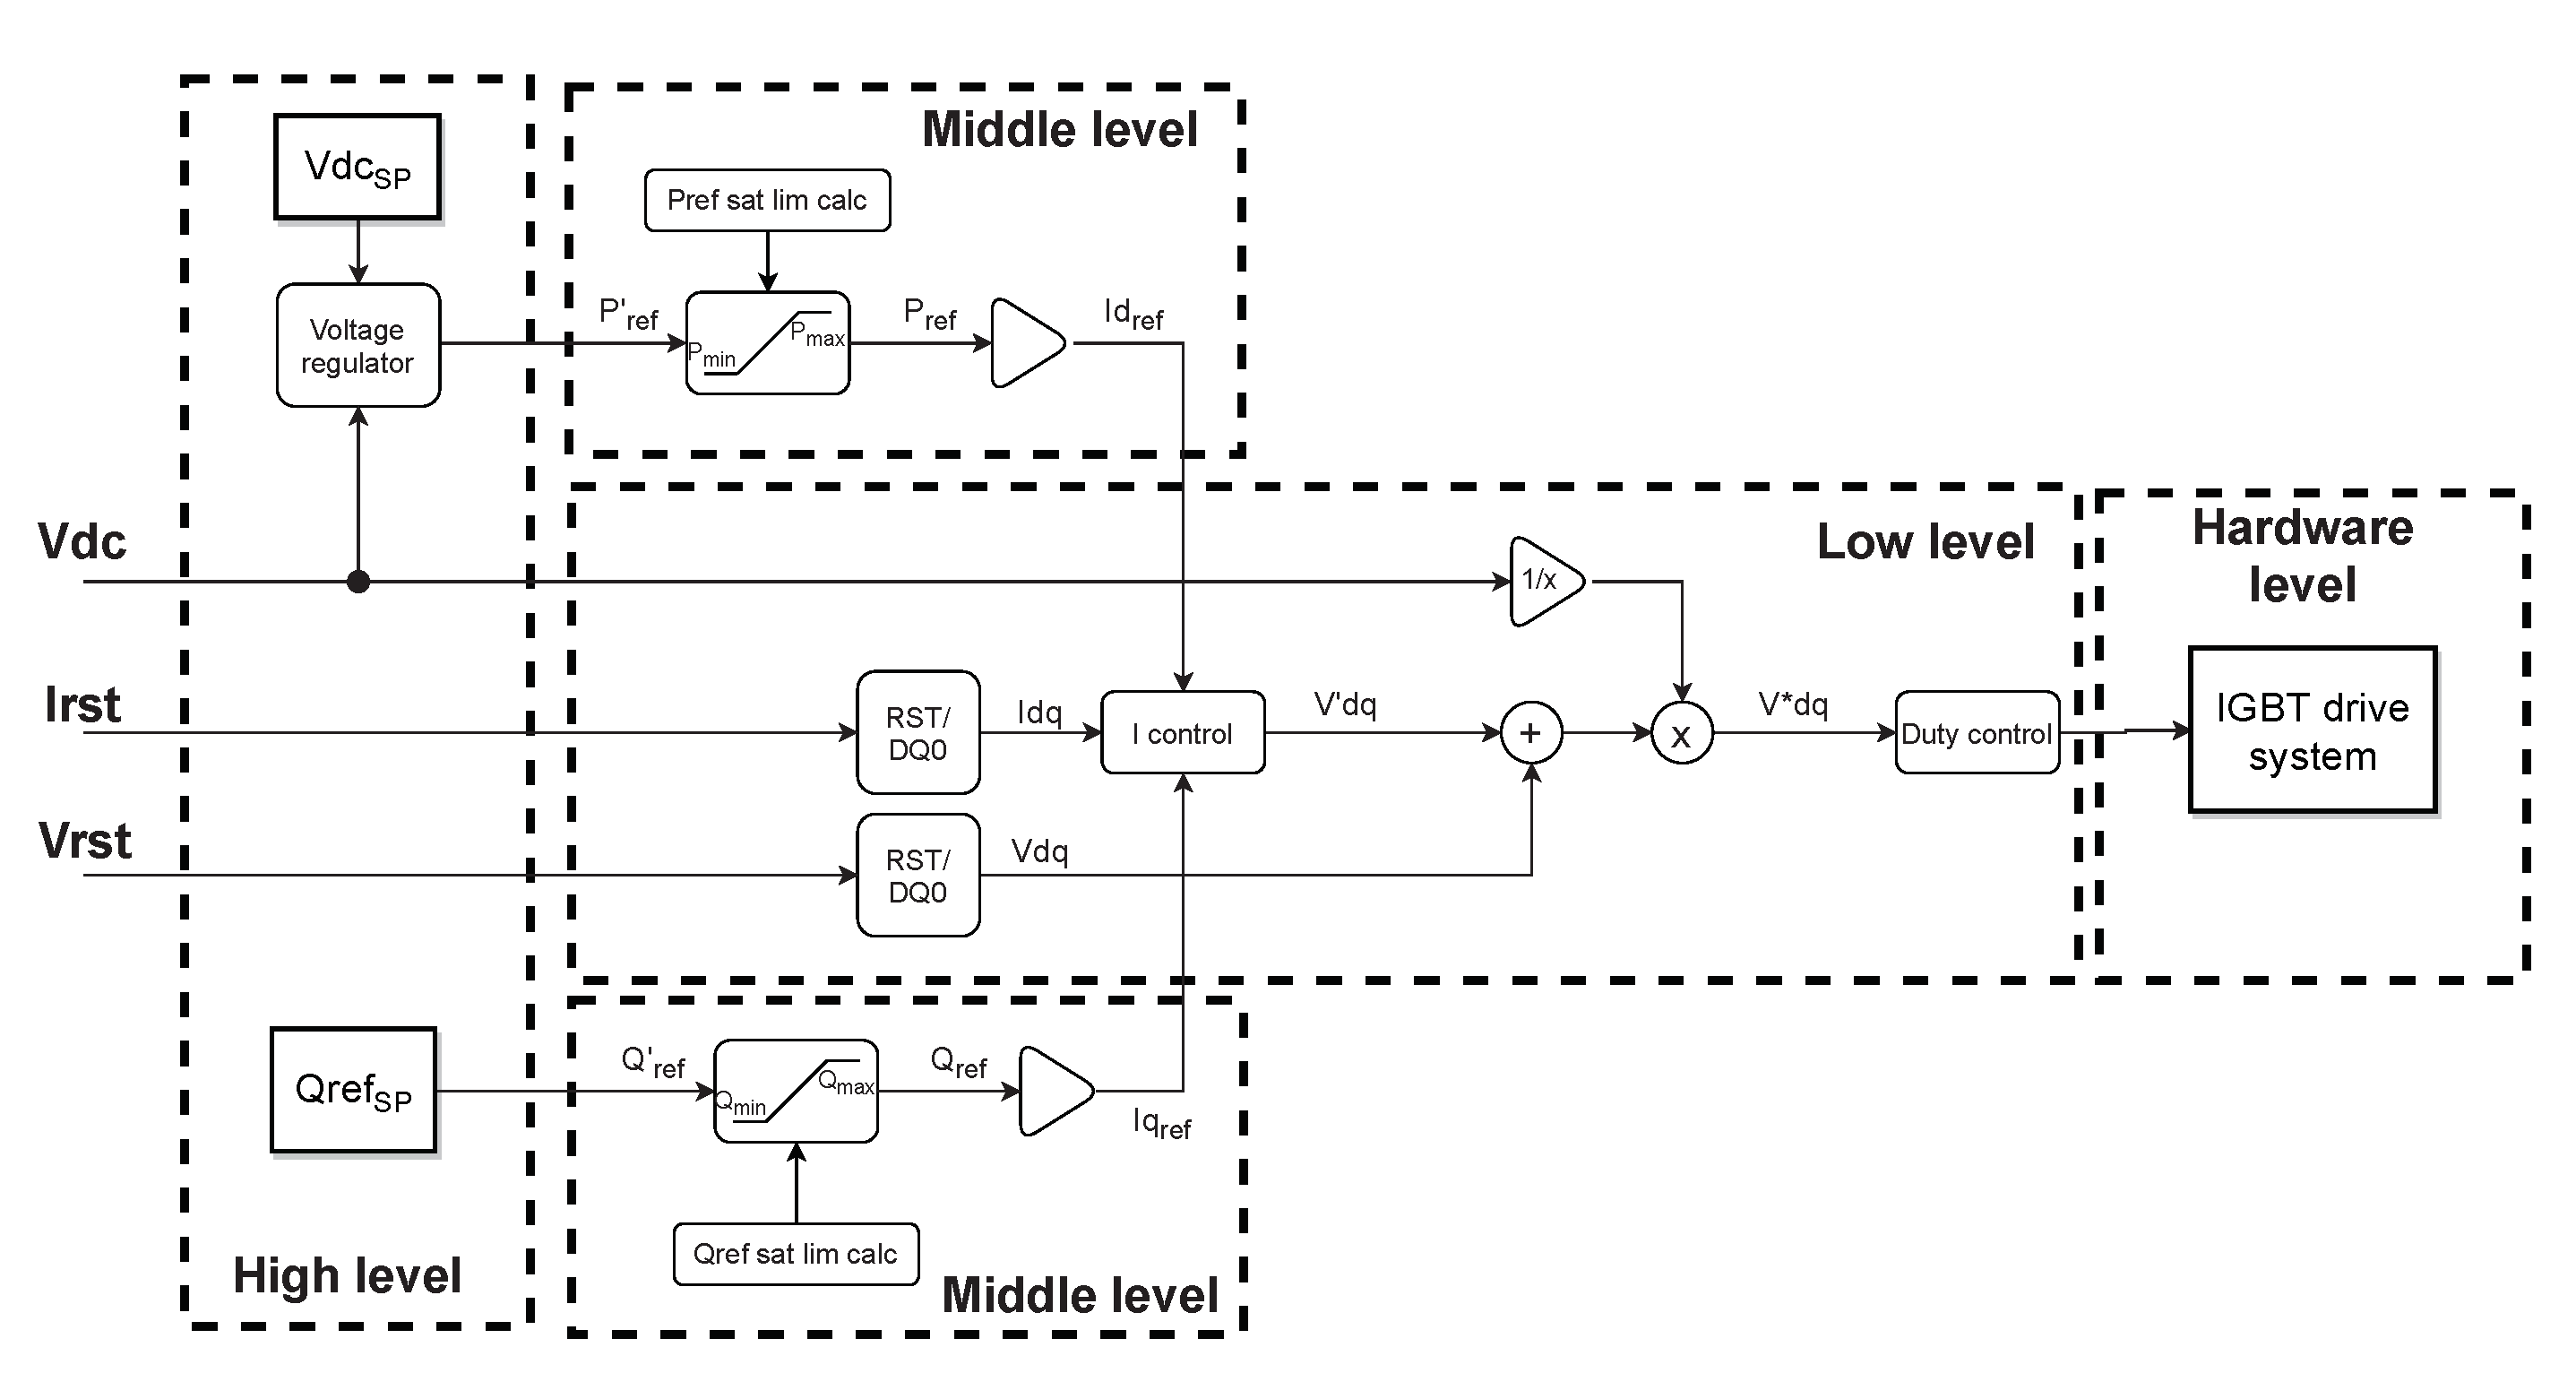
  • High-level controller: the higher level control is in charge of generating the appropriate active and reactive power references provided to the low level layers of the controller. The purpose is to lead the system to the desired goal: on the one hand, to maintain the desired DC voltage level by regulating the active power output with the voltage regulator box; on the other hand, to adjust the system’s reactive power reference by means of providing the needed reactive power output.
  • Middle-level controller: the middle-level controller is responsible for saturating the power references in order to guarantee that the system remains in its operation working range and does not exceed its limits. Therefore, safety features and operating constraints such as temperature and over-voltages are considered to evaluate whether the desired power objectives are reached or not. Finally, from the power references, the current references are set.
  • Low-level controller: the low-level controller is divided into two parts: the current controller that determines the control actions needed to follow the control current references; and the duty control system, in charge of the converter’s modulation technique.
  • Hardware-level controller: the hardware level controls the power converter’s drive system, translating the control signals to the physical pulses of the converter.

3.4. EBox

3.4.1. Hardware Design

The EBox has been described previously in the literature [22]. It is a low cost gateway that uses a Raspberry Pi computing module to manage the high level power electronics system and to run the reactive control algorithm of the EVE. Furthermore, it can communicate with the HMI and the grid analyzer, which allows the gathering of the information of the complete system.

3.4.2. Control Design

To control and ensure the compensation of the EVSE reactive power consumption, the EBox communicates with a grid analyzer to know the reactive power value and send the calculated set-point to the emulator AFE, which generates the desired current. As shown in Figure 9, there are three different grid analyzer configurations: in the output of the V2G charger under test, in the Point of Common Coupling (PCC) of the facility or in both (V2G and PCC).
Depending on the location of the analyzer, the control algorithm implemented in the EBox has to be changed, achieving different performances:
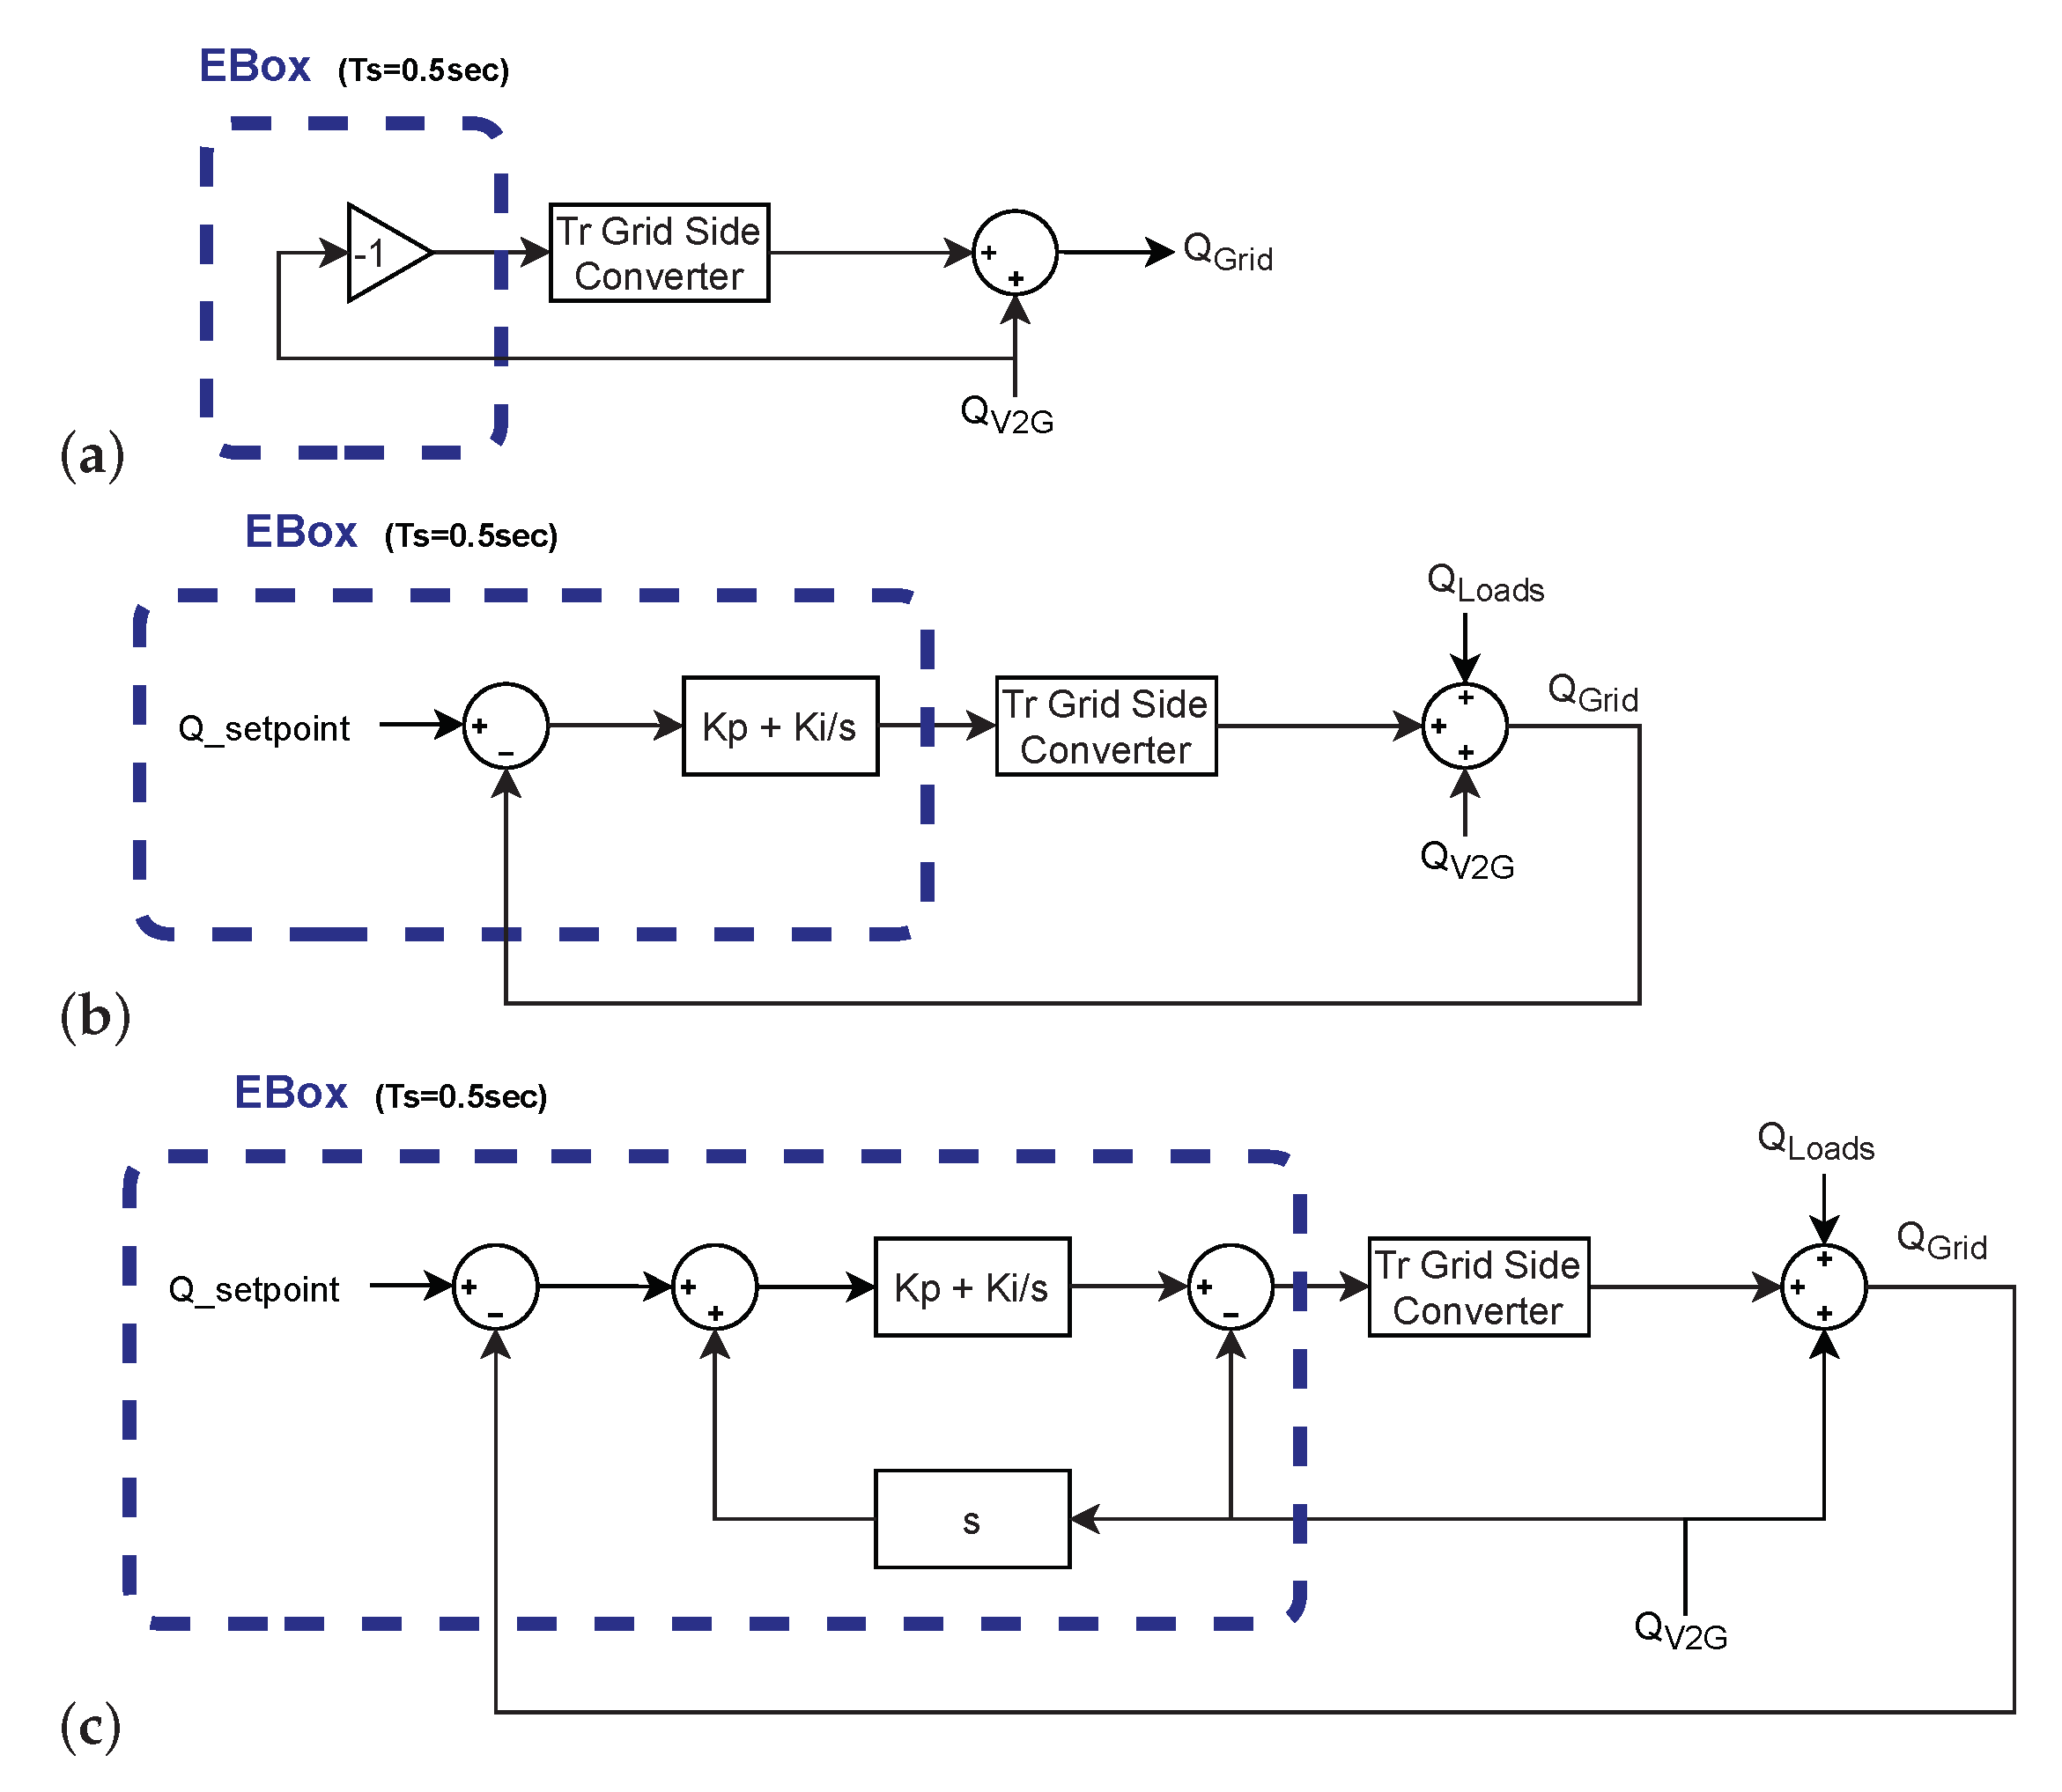
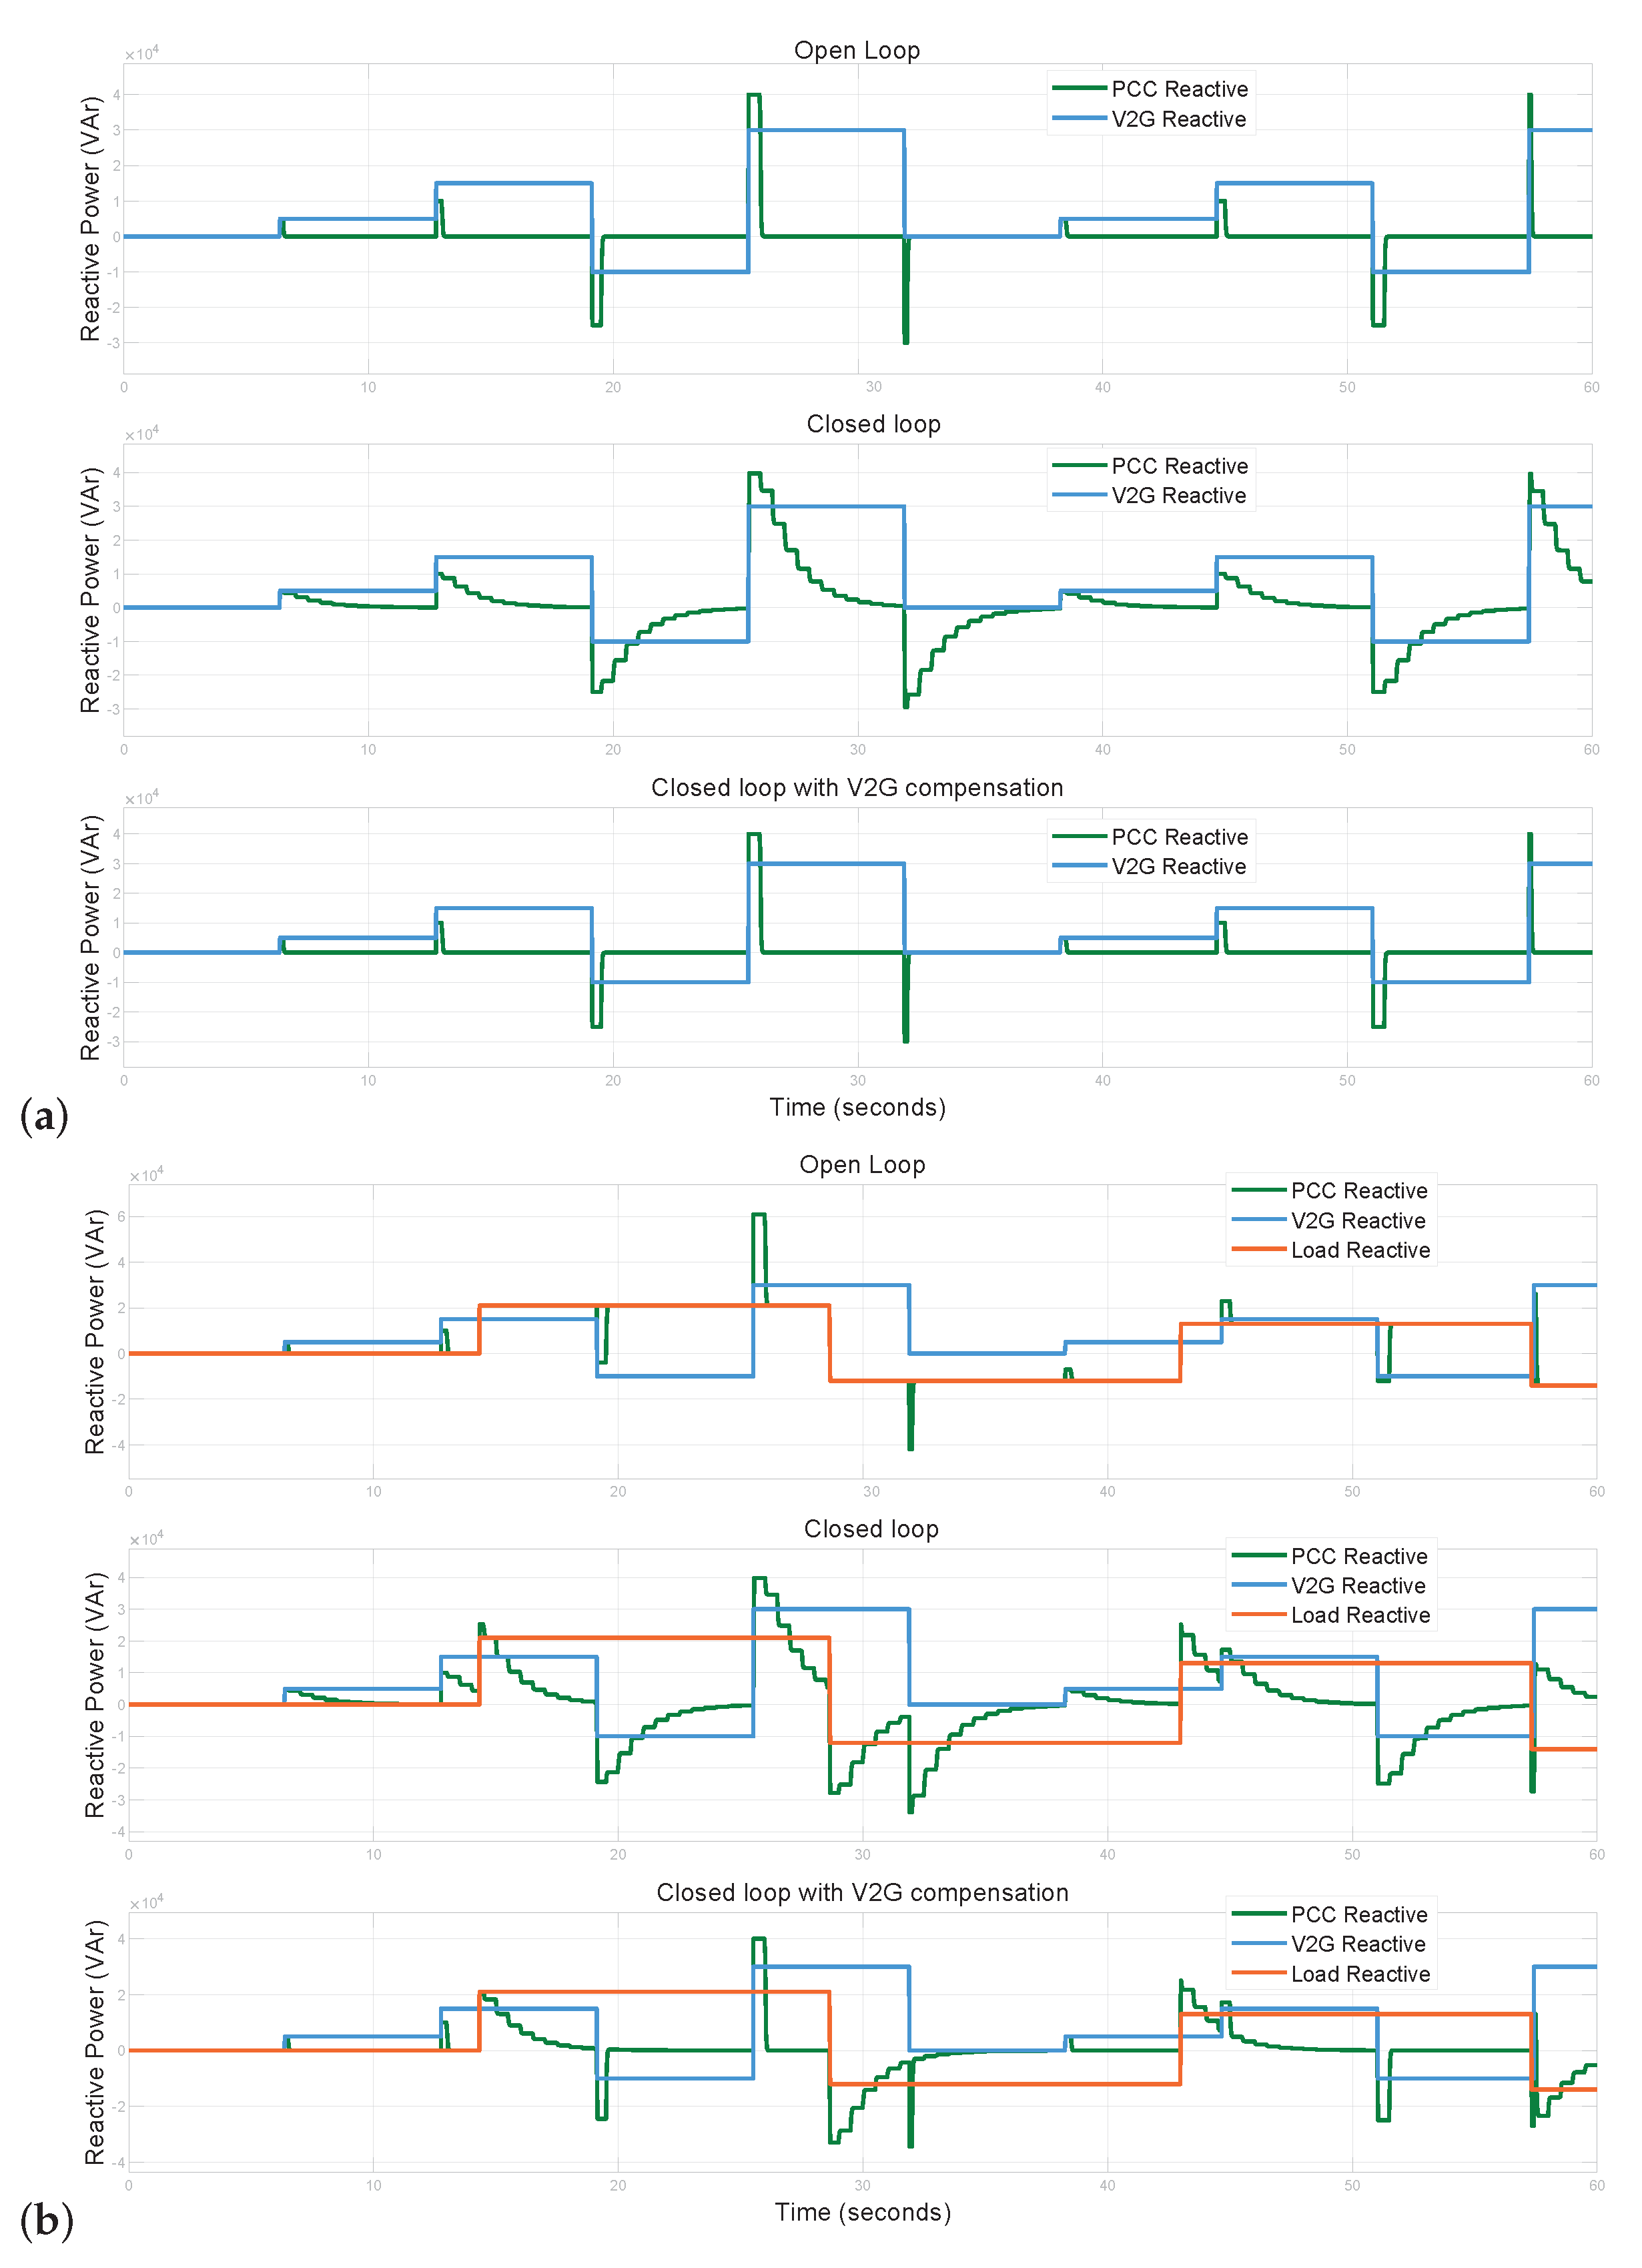
  • V2G: in this case, the grid analyzer can only measure the power consumed or returned by V2G charger. The control algorithm implemented in this context is an open loop control, which is shown in Figure 10a. This control loop is easy to implement and has a very good time response. However, it is not possible to determine the reactive power at the PCC, and problems such as an incorrect calibration or installation of the EVE could even increase the power consumption in the facility.
  • PCC: the grid analyzer is located at the point where the facility is connected to the grid. Figure 10b shows the control algorithm, which is a closed loop control with a PI regulator to ensure zero error in steady-state operation. The problem is that the time response of this control is minimum 5–10 times the time step, so loads with an abrupt change of power can be over the limits for a few seconds.
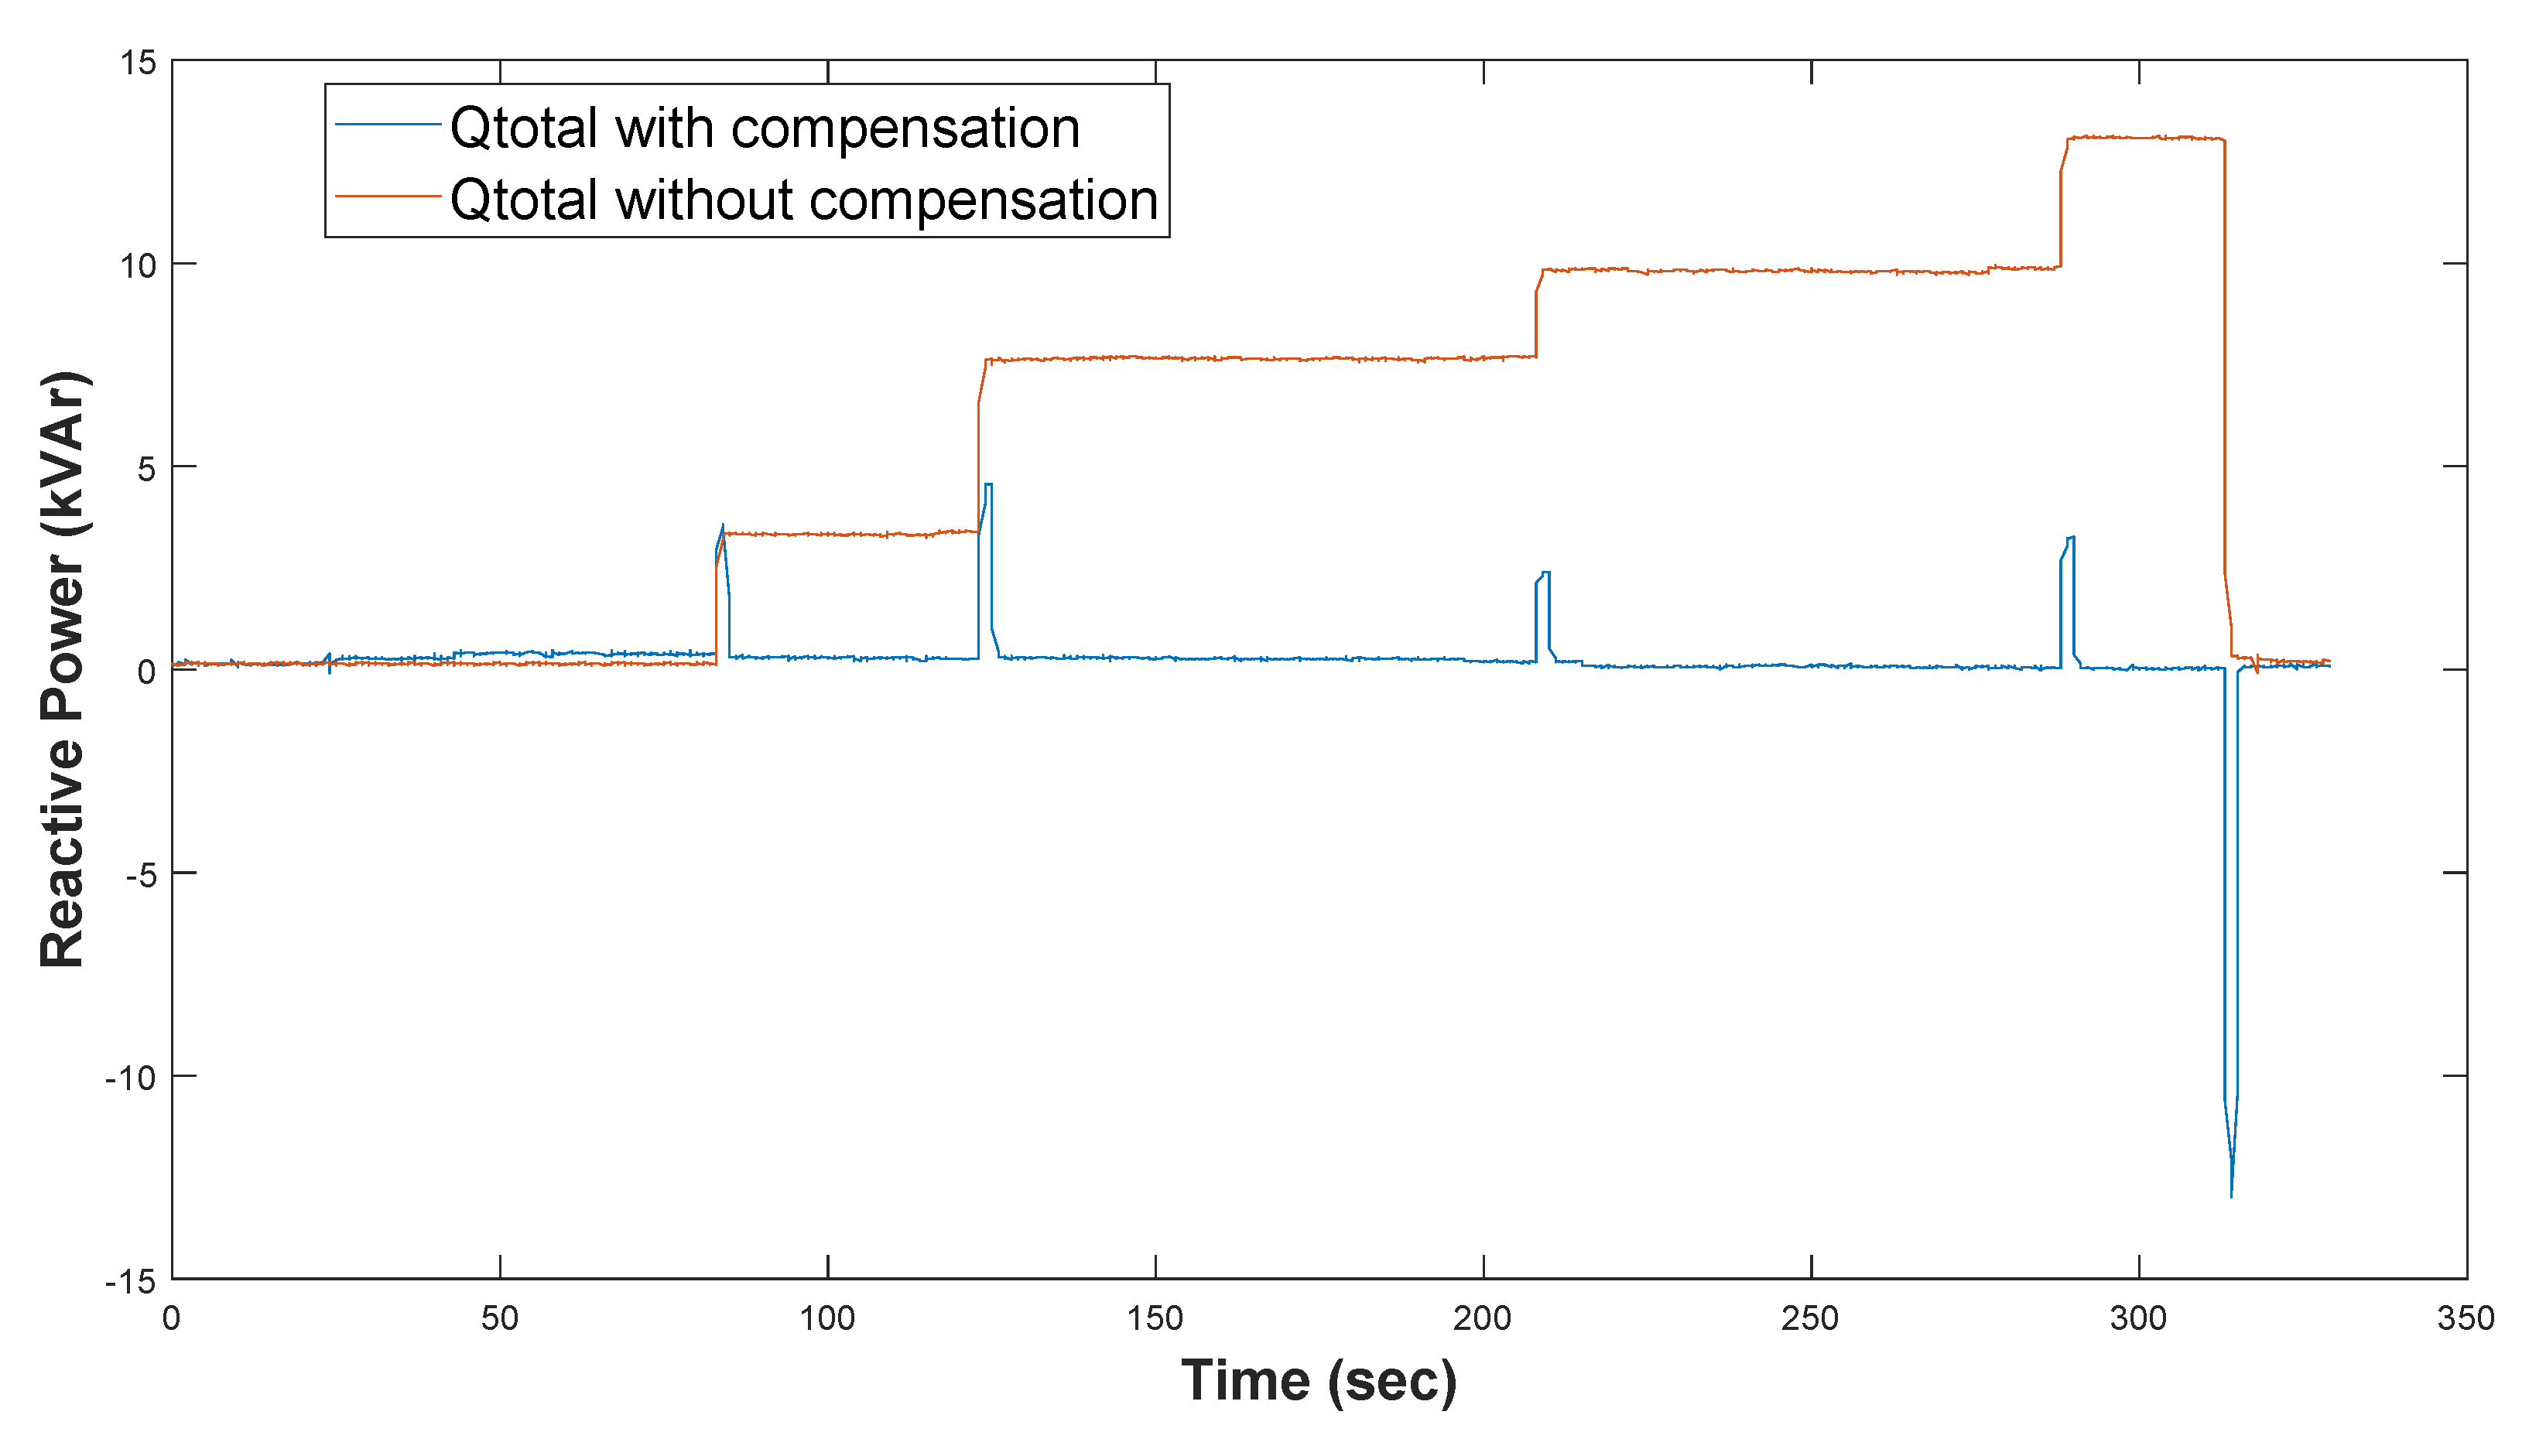
  • V2G and PCC: the two grid analyzers are installed, one in the V2G charger and the other one in the PCC. The control algorithm is shown in Figure 10c, which is based on the previous closed loop control with a PI regulator. However, in this case, the reactive power of the charger is measured and directly compensated at the output of the regulator. In order to avoid the integration of the error produced by the charger, the derivative of this measure is compensated in the input of the regulator. In this way, the controller achieves a better time response capability. However, it has to be highlighted that the use of two grid analyzers increases close to 2% the final price of the solution.
Figure 11 shows the simulation in MATLAB/Simulink of the reactive power consumption of the three different types of control that have been shown in previous Figure 10. It can be seen that in Figure 11a without any external loads, the reactive consumption in the PCC with open control loop as well as with closed control loop with V2G compensation are the same, while with closed control loop the response is slower than the previous case. However, if there is reactive power consumption by an external load, Figure 11b shows different behaviour. On one hand, with open control loop the reactive power consumption at the PCC in steady-state is determined by the external loads. On the other hand, with closed control loop, the power at the PCC can be fully compensated by the EVE, with a better time response to the V2G power demand by compensating it using two grid analyzers.
Comparing the last two control modes in Figure 11b, it should be noticed that the reactive power error given by the abrupt change of the V2G power at time t = 32 s, is quickly balanced with the third type of reactive control strategy. The reason is that the compensation of the V2G power avoids the error integration in the PI control, improving the time response and performance of the reactive power control at the PCC.

4. Experimental Results

4.1. Test Description

The main equipment involved in the tests is shown in Figure 12. A V2G charger has been used as a HUT and it has been connected to the EVE through a CHAdeMO connection. The bottom box of the emulator is the AC/DC converter and the upper box is the DC/DC converter. Both of them are connected to the EBox, which is also connected to the grid analyzer (Circutor CVM-MINI) via RS-485 and to the HMI through TCP/IP. The transformer is also inside an enclosure for safety reasons.
The simplified sequence of the complete test is shown in Figure 13, where it is explained how the system works, and the main processes with their interactions that are running, which are needed to emulate the behaviour of an EV. First, the user has to start the EVE system through the HMI and wait until the DC/DC system is ready to initiate the charge/discharge operation in order to test the HUT accordingly. Then, the user has to plug-in the cable and begin the operation needed to launch the charging/discharging process of the HUT. The user can change the voltage and/or power manually at any time or load a script with the profile of EV charging/discharging, indicating every 0.5 s the required voltage and power via HMI. The test will be finished whenever: the user stops it via HMI, the EVE battery model determines that it has finished the charging/discharging process, or there is any error during the operation.

4.2. Manual Set-Point Adjustment

With the aim to test the stability of the emulator, the voltage response at different set-points has been analyzed. Figure 14 shows the manual change of current set-point from 65 to −65 A, with the emulator controlling the same set-point voltage at 300 V. It must be noticed that the slope of the current increment by the charger is 10 A/s, which is within the limits of the CHAdeMO standard [19]. Furthermore, the PI controller implemented in the emulator has a reduced velocity error during the transition of this current variation in the HUT.
Furthermore, it is possible to verify the behaviour of the system for grid management purposes. For example, thanks to this test, it has been verified that this charger could be used to perform frequency grid operation for current set-point changes up to 50 A [26]. Furthermore, the smooth transition between the two set-points, indicates that it is possible to use this EVSE with V2G capability for operations such as peak shaving or management of renewable energy surplus.
The variation of the set-point voltage from 300 V to 200 V is shown in Figure 15. These kinds of battery voltage fluctuations are abnormal in EV batteries, but they allow the user to know the stability and response of the charger to be tested. In this case, the emulator keeps the same set-point power, which produces an increment in the demanded current to the V2G charger. Depending on the time response of the chargers, maximum or minimum power peaks can appear during the voltage transition, which will be larger if the voltage transition is more abrupt.

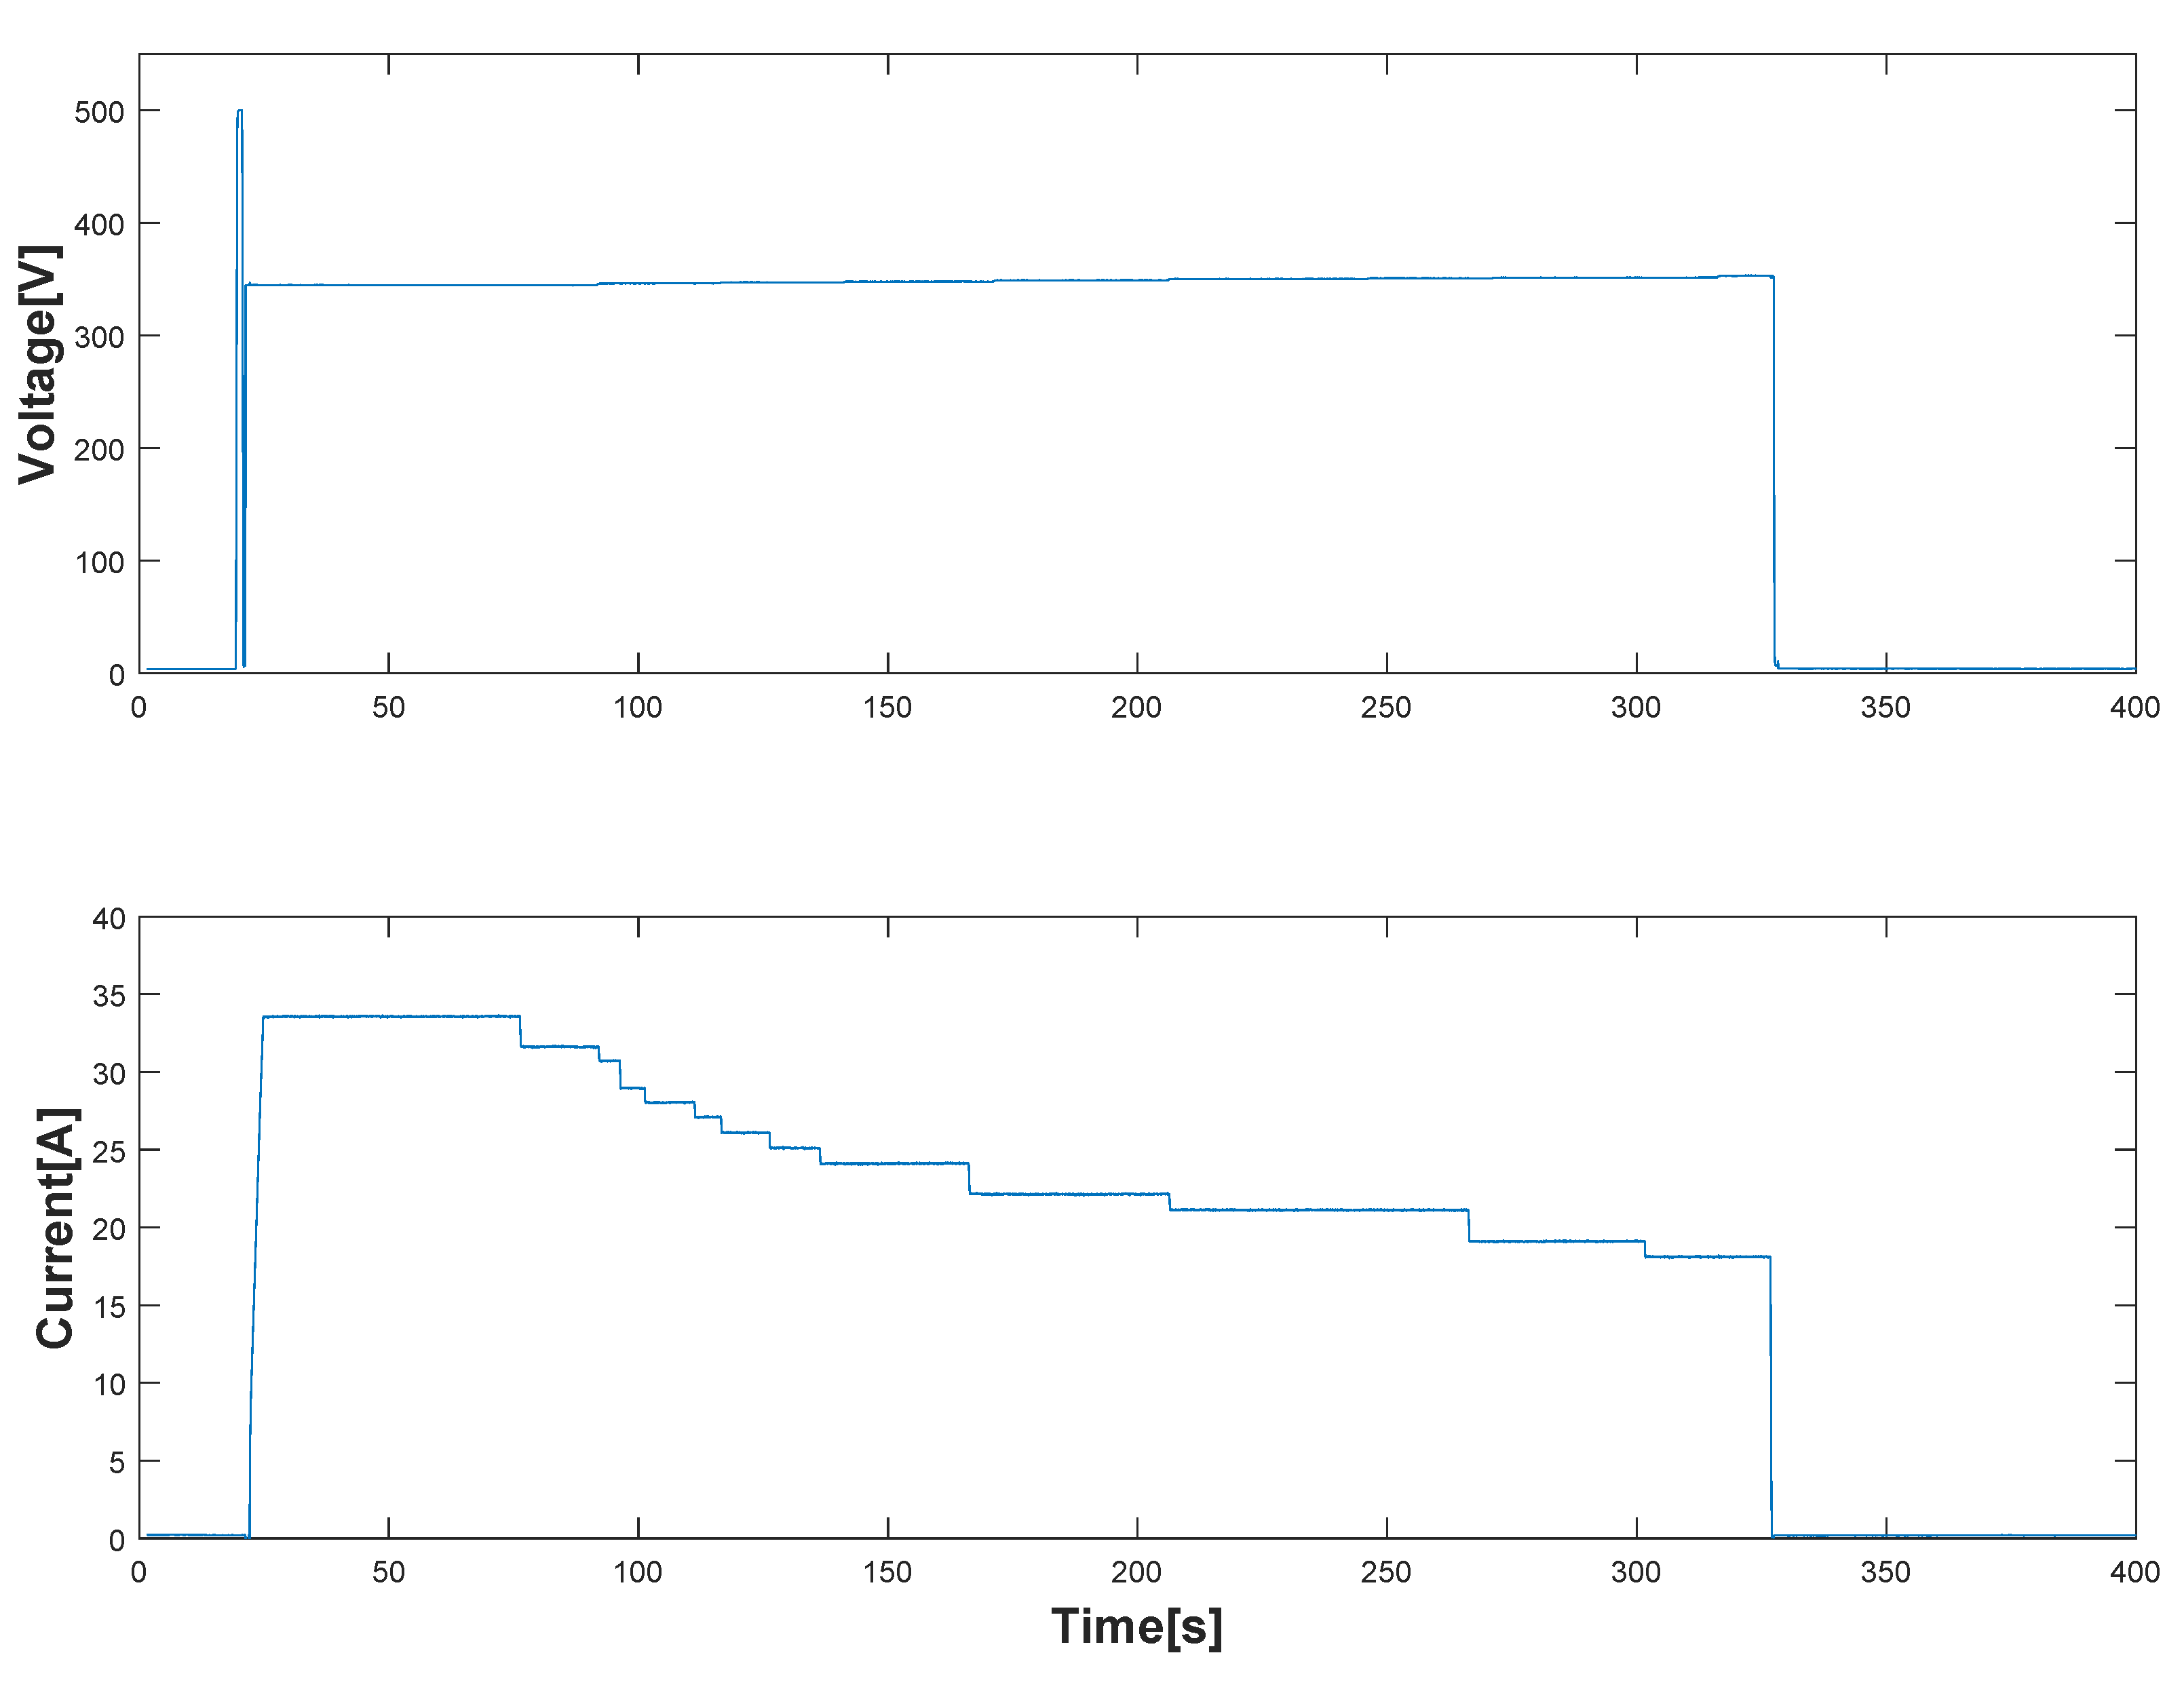
4.3. Load an EV Battery Profile

In this case, a user defined EV battery charge profile has been defined. It consists of a charging process of 5 min, starting the voltage at 350 V with a demanded power of 12 kW. This demanded power decreases until reaching 6.5 kW and the voltage increases up to 358 V, the moment when the emulator sends a stop command to the charger through CHAdeMO communication. The evolution of the voltage and current measured at the emulator output is shown in Figure 16. At the beginning of the charging process, the CHAdeMO’s isolation test procedure is performed by the charger, setting 500 V at the input of the emulator. Once the charger verifies that there is not any isolation problem, it closes the emulator power relay. From this point, the emulator control the output voltage and it sends the demanded power to the EVSE, which is defined in the loaded profile of the emulator. This profile can be modified in order to perform different user tests, changing current, voltage and time of the vehicle charge and executed as many times as needed. This feature allows the repeatability of the test, which makes it possible to compare and analyze the response of different HUTs.
To test the reactive power compensation, the previous EV battery charging profile has been used, but also adding a profile of reactive power consumption to the charger. A profile with abrupt changes in the reactive consumption has been configured in order to verify the behaviour of the emulator. In this case, the grid analyzer has been placed at the output of the HUT, with an open-loop control implemented in the EBox. Figure 17 shows the results of the test, measured with a power analyzer data logger (Fluke 435-II) at the PCC of the facility. Firstly, the reactive power consumption, without compensating it by the emulator, has been measured by a grid analyzer. Secondly, the same test has been repeated and measured, but this time compensating the reactive power consumption by the emulator. The data from the two measurements have been downloaded and synchronized.
The steady reactive power consumption of the HUT is completely compensated by the emulator. However, if the HUT has quick step changes in the reactive power consumption in less than the execution time control of the EBox, it cannot be compensated properly. This behaviour can cause problems in the facility’s PCC if the electric protection devices are less than the peak current occurred during the transition. To resolve this issue, it is possible to perform a power consumption characterization of the HUT at every charge/discharge current, and configure a charge/discharge profile in the emulator, including the reactive power that has to be generated by the emulator in order to compensate it.

5. Conclusions

EVs and V2G chargers have attracted a lot of attention for being considered as part of the solution to increase the share of renewable energy in the electric grid. Since most the EVSE are expected to be at home, these systems are an important tool towards the building EMS to achieve near-zero energy buildings. Therefore, the study and verification of the proper behaviour of these elements can smooth the path to the energy transition.
This paper has presented the design, test and results of a power EV emulator with V2G capability. The ability to emulate a real V2G EV to handle fast charge/discharge with an EV charger, consuming only the losses of the complete system, has been validated experimentally. In addition, for small and medium enterprises which only want to test EVSE and do not need the flexibility of a PHIL test bench, it is more economically affordable due to not requiring a fast real-time simulator and a high bandwidth power amplifier.
Future tests will consist of increasing the implemented EVSE protocol to CCS, due to the importance of this standard in Europe. Moreover, testing the AFE of the EVSE under test using the PHIL technique, allows us to verify the complete system: grid and vehicle side. Furthermore, thanks to the recirculation power of the EVE during test, a low power amplifier could be used to emulate the grid behaviour during the PHIL test. In order to test the fast dynamics behaviour of the DC side of a V2G charger, the implementation of a real-time battery model could be done in the EVE. Another future work will be the development of an EVE to test EVSEs which work on a DC grid.

Author Contributions

Conceptualization, E.G.-M., J.F.S.-O. and J.M.-C.-A.; methodology, E.G.-M., J.F.S.-O., J.M.-C.-A. and J.M.P.; software, E.G.-M. and J.M.P.; validation, E.G.-M.; investigation, E.G.-M., J.M.-C.-A. and J.M.P.; writing—original draft preparation, E.G.-M. and J.M.-C.-A.; writing—review and editing, E.G.-M., J.F.S.-O., J.M.-C.-A. and J.M.P.; visualization, E.G.-M. and J.M.-C.-A.; supervision, J.F.S.-O., J.M.-C.-A. and J.M.P. All authors have read and agreed to the published version of the manuscript.

Funding

This project has received funding from the European Union’s Horizon 2020 research and innovation programme under Grant Agreement No 875683.

Institutional Review Board Statement

Not applicable.

Informed Consent Statement

Not applicable.

Data Availability Statement

Not applicable.

Conflicts of Interest

The authors declare no conflict of interest.

References

  1. Monti, A.; Ponci, F. Power Grids of the Future: Why Smart Means Complex. In Proceedings of the Complexity in Engineering (COMPENG ’10), Rome, Italy, 22–24 February 2010; pp. 7–11. [Google Scholar] [CrossRef]
  2. Vahedipour-Dahraie, M.; Rashidizaheh-Kermani, H.; Najafi, H.R.; Anvari-Moghaddam, A.; Guerrero, J.M. Coordination of EVs Participation for Load Frequency Control in Isolated Microgrids. Appl. Sci. 2017, 7, 539. [Google Scholar] [CrossRef] [Green Version]
  3. Habeeb, S.A.; Tostado-Véliz, M.; Hasanien, H.M.; Turky, R.A.; Meteab, W.K.; Jurado, F. DC Nanogrids for Integration of Demand Response and Electric Vehicle Charging Infrastructures: Appraisal, Optimal Scheduling and Analysis. Electronics 2021, 10, 2484. [Google Scholar] [CrossRef]
  4. IEA. Global EV Outlook 2021. Paris. 2021. Available online: https://www.iea.org/reports/global-ev-outlook-2021 (accessed on 14 October 2021).
  5. Jones, L.; Lucas-Healey, K.; Sturmberg, B.; Temby, H.; Islam, M. The A to Z of V2G: A Comprehensive Analysis of Vehicle-to-Grid Technology Worldwide. Realising Electric Vehicle to Grid Services Project. 2021. Available online: https://arena.gov.au/assets/2021/01/revs-the-a-to-z-of-v2g.pdf (accessed on 14 October 2021).
  6. Tostado-Véliz, M.; León-Japa, R.; Jurado, F. Optimal electrification of off-grid smart homes considering flexible demand and vehicle-to-home capabilities. Appl. Energy 2021, 298, 117184. [Google Scholar] [CrossRef]
  7. Odkhuu, N.; Lee, K.-B.; Ahmed, M.A.; Kim, Y.-C. Optimal Energy Management of V2B with RES and ESS for Peak Load Minimization. Appl. Sci. 2018, 8, 2125. [Google Scholar] [CrossRef] [Green Version]
  8. Chen, J.; Zhang, Y.; Li, X.; Sun, B.; Liao, Q.; Tao, Y.; Wang, Z. Strategic integration of vehicle-to-home system with home distributed photovoltaic power generation in Shanghai. Appl. Energy 2018, 263, 114603. [Google Scholar] [CrossRef]
  9. Strasser, T.; Pröstl Andrén, F.; Lauss, G.; Bründlinger, R.; Brunner, H.; Moyo, C.; Seitl, C.; Rohjans, S.; Lehnhoff, S.; Palensky, P.; et al. Towards holistic power distribution system validation and testing—An overview and discussion of different possibilities. E I Elektrotechnik Inf. 2017, 134, 71–77. [Google Scholar] [CrossRef] [Green Version]
  10. Mylonas, E.; Tzanis, N.; Birbas, M.; Birbas, A. An Automatic Design Framework for Real-Time Power System Simulators Supporting Smart Grid Applications. Electronics 2020, 9, 299. [Google Scholar] [CrossRef] [Green Version]
  11. García-Martínez, E.; Sanz, J.F.; Muñoz-Cruzado, J.; Perié, J.M. A Review of PHIL Testing for Smart Grids—Selection Guide, Classification and Online Database Analysis. Electronics 2020, 9, 382. [Google Scholar] [CrossRef] [Green Version]
  12. Oettmeier, M.; Bartelt, R.; Heising, C.; Staudt, V.; Steimel, A.; Tietmeyer, S.; Bock, B.; Doerlemann, C. Machine emulator: Power-electronics based test equipment for testing high-power drive converters. In Proceedings of the 2010 International Conference on Optimization of Electrical and Electronic Equipment, Brasov, Romania, 20–22 May 2010; pp. 582–588. [Google Scholar] [CrossRef]
  13. Anil, D.; Sivraj, P. Electric Vehicle Charging Communication Test-bed following CHAdeMO. In Proceedings of the 2020 International Conference on Computing, Communication and Networking Technologies (ICCCNT), Kharagpur, India, 1–3 July 2020; pp. 1–7. [Google Scholar] [CrossRef]
  14. Jayawardana, I.; Ho, C.N.M.; Zhang, Y. A Comprehensive Study and Validation of a Power-HIL Testbed for Evaluating Grid-Connected EV Chargers. IEEE J. Emerg. Sel. Top. Power Electron. 2021. [Google Scholar] [CrossRef]
  15. De Herdt, L.; Shekhar, A.; Yu, Y.; Mouli, G.R.C.; Dong, J.; Bauer, P. Power Hardware-in-the-Loop Demonstrator for Electric Vehicle Charging in Distribution Grids. In Proceedings of the 2021 IEEE Transportation Electrification Conference & Expo (ITEC), Chicago, IL, USA, 21–25 June 2021; pp. 679–683. [Google Scholar] [CrossRef]
  16. Cabeza, T.; Sanz, J.F.; Calavia, M.; Acerete, R.; Cascante, S. Fast charging emulation system for electric vehicles. In Proceedings of the 2013 World Electric Vehicle Symposium and Exhibition (EVS27), Barcelona, Spain, 17–20 November 2013; pp. 1–6. [Google Scholar] [CrossRef]
  17. Ledinger, S.; Reihs, D.; Stahleder, D.; Lehfuss, F. Test Device for Electric Vehicle Grid Integration. In Proceedings of the 2018 IEEE International Conference on Environment and Electrical Engineering and 2018 IEEE Industrial and Commercial Power Systems Europe (EEEIC/I&CPS Europe), Palermo, Italy, 12–15 June 2018; pp. 1–5. [Google Scholar] [CrossRef]
  18. Popov, A.; Tybel, M.; Schugt, M. Power hardware-in-the-loop test bench for tests and verification of EV and EVSE charging systems. In Proceedings of the 2014 IEEE International Electric Vehicle Conference (IEVC), Florence, Italy, 17–19 December 2014; pp. 1–8. [Google Scholar] [CrossRef]
  19. CHAdeMO. Available online: https://www.chademo.com (accessed on 14 October 2021).
  20. Wang, L.; Qin, Z.; Slangen, T.; Bauer, P.; van Wijk, T. Grid Impact of Electric Vehicle Fast Charging Stations: Trends, Standards, Issues and Mitigation Measures—An Overview. IEEE Open J. Power Electron. 2021, 2, 56–74. [Google Scholar] [CrossRef]
  21. Krasselt, P.; Boßle, J.; Suriyah, M.R.; Leibfried, T. DC-Electric Vehicle Supply Equipment Operation Strategies for Enhanced Utility Grid Voltage Stability. World Electr. Veh. J. 2015, 7, 530–539. [Google Scholar] [CrossRef] [Green Version]
  22. Andolšek, A.; Nemček, M.P.; Gómez, A.; Zocchi, A.; Bruna, J.; Oliván, M.A. Flexibility and optimization services validation in a microgrid. In Proceedings of the 2018 CIRED Ljubljana Workshop, Ljubljana, Slovenia, 7–8 June 2018. [Google Scholar] [CrossRef]
  23. Azani, H.; Massoud, A.; Benbrahim, L.; Williams, B.W.; Holiday, D. An LCL filter-based grid-interfaced three-phase voltage source inverter: Performance evaluation and stability analysis. In Proceedings of the 2014 IET International Conference on Power Electronics, Machines and Drives (PEMD 2014), Manchester, UK, 8–10 April 2014. [Google Scholar] [CrossRef]
  24. Muñoz-Cruzado, J.; Villegas-Núñez, J.; Vite-Frías, J.A.; Carrasco-Solís, J.M.; Galván-Díez, E. New Low-Distortion Qf Droop Plus Correlation Anti-Islanding Detection Method for Power Converters in Distributed Generation Systems. IEEE Trans. Ind. Electron. 2015, 62, 5072–5081. [Google Scholar] [CrossRef]
  25. Muñoz-Cruzado-Alba, J.; Villegas-Núñez, J.; Vite-Frías, J.A.; Carrasco Solís, J.M. A New Fast Peak Current Controller for Transient Voltage Faults for Power Converters. Energies 2016, 9, 1. [Google Scholar] [CrossRef] [Green Version]
  26. Martinenas, S.; Marinelli, M.; Andersen, P.B.; Træholt, C. Implementation and demonstration of grid frequency support by V2G enabled electric vehicle. In Proceedings of the 2014 49th International Universities Power Engineering Conference (UPEC), Cluj-Napoca, Romania, 2–5 September 2014. [Google Scholar] [CrossRef] [Green Version]
Figure 1. General EVE testbench block diagram, pointing out the main power subsystems of the EVE (blue) and the HUT (red), as well as the communication interfaces defined between them (dark and light green).
Applsci 11 11496 g001
Figure 2. Topology of the DC/DC converter of the proposed EVE: a three-branches two-level in parallel bridge topology.
Applsci 11 11496 g002
Figure 3. Sweep of the LC filter transfer function with different values of R v i r t u a l : 0.1 Ω in blue, 0.251 Ω in red, 0.63 Ω in orange, 1.58 Ω in purple, 3.98 Ω in green, and 10.0 Ω in light blue.
Applsci 11 11496 g003
Figure 4. Bode diagram of the DC output filter with the selected R v i r t u a l = 1 Ω .
Applsci 11 11496 g004
Figure 5. EVE output voltage control block diagram of the DC/DC converter. The carrier of the three gate signals has the same sample time in order to keep constant the phase between them.
Applsci 11 11496 g005
Figure 6. Output voltage response of the DC/DC converter to a step of 40 V in the set-point.
Applsci 11 11496 g006
Figure 7. Topology of the AC/DC converter of the proposed EVE: a three-phase three-level NPC power converter.
Applsci 11 11496 g007
Figure 8. Control Scheme of the AC/DC converter of the proposed EVE pointing out four control levels: high, middle, low and hardware level.
Applsci 11 11496 g008
Figure 9. Representation of the two possible locations of the grid analyzer in order to compensate the reactive power injected by the EVE.
Applsci 11 11496 g009
Figure 10. Three types of different reactive compensation control strategies: (a) Open loop control, measuring reactive power at the output of the V2G charger. (b) Closed loop control, measuring reactive power at the PCC of the facility. (c) Closed loop control with V2G compensation, measuring both V2G charger and the PCC of the facility.
Applsci 11 11496 g010
Figure 11. Simulation of the reactive power consumption using the same V2G consumption profile with abrupt consumption changes. Two scenarios have been considered: (a) without power consumption of the external loads; (b) with power consumption of the external loads. In every scenario, all three different control strategies have been tested: open loop, closed loop, and closed loop with V2G compensation.
Applsci 11 11496 g011
Figure 12. General overview of the testbench used for the power tests done with the proposed EVE. On the left, a 50 kW EVE together the EBox gateway; On the right the HUT system built up with a 50 kW V2G charger; and the power transformer in the centre.
Applsci 11 11496 g012
Figure 13. Simplified operation sequence diagram of the complete EVE test procedure.
Applsci 11 11496 g013
Figure 14. Experimental results of the variation of the current set-point from 65 A to −65 A at 300 V set-point. Voltage (top) and current (bottom) transient evolution is depicted in the figure.
Applsci 11 11496 g014
Figure 15. Experimental results of the variation of the voltage set-point from 300 V to 200 V at 10 kW set-point. Voltage (top) and current (bottom) transient evolution is depicted in the figure.
Applsci 11 11496 g015
Figure 16. Emulation of an EV charging for 5 min. The upper graph is the output voltage of the charger and the lower graph is the charged current.
Applsci 11 11496 g016
Figure 17. Reactive power consumption of the EV charging with (blue) and without (red) reactive power compensation, measured at the facility’s PCC.
Applsci 11 11496 g017
Table 1. Current status of the different DC chargers standards [20].
StandardCHAdeMOGB/TCCS Type 1CCS Type 2TeslaChaoJi
Maximum Voltage (V)10007506009005001500
Maximum Current (A)400250400400631600
Maximum Power (kW)400185200350250900
Communication ProtocolCANCANPLCPLCCANCAN
V2X FunctionYesNoNoNoUnknownYes
Start year200920132014201320122020
Table 2. Main electrical parameters of the designed EVE.
EV Emulator
Nominal Power50 kW
Efficiency>96%
Internal DC-link voltage700 V
Switching frequency20 kHz
Control frequency20 kHz
Input
Nominal RMS phase voltage230 V
Nominal RMS phase current80 A
I ripple1% Inom
Nominal frequency50 Hz
Output
Output voltage range50–500 V
Output current range−100 A to 100 A
Maximum voltage ripple<2% Vmax
Publisher’s Note: MDPI stays neutral with regard to jurisdictional claims in published maps and institutional affiliations.

