Article

Measurement and Analysis of Downhole Drill String Vibration Signal

1
School of Engineering and Technology, China University of Geosciences, Beijing 100083, China
2
Key Laboratory of Deep Geodrilling Technology, Ministry of Natural Resources, Beijing 100083, China
*
Author to whom correspondence should be addressed.
Appl. Sci. 2021, 11(23), 11484; https://doi.org/10.3390/app112311484
Submission received: 4 November 2021 / Revised: 28 November 2021 / Accepted: 30 November 2021 / Published: 3 December 2021
(This article belongs to the Special Issue Trends and Prospects in Intelligent Drilling Technology)

Abstract

:
Downhole drill string vibration data can provide an effective reference for research drill string vibration during drilling. In this paper, the research group used a storage-type downhole vibration measurement equipment equipped with an orthogonal, three-axis accelerometer to measure and collect drill string vibration signals during drilling in an oil well. Based on the installation characteristics of the sensor, the relationship between the acceleration measurement value of the sensor and the center acceleration value of the drill string is obtained. Then the time-domain signals representative of the vibration in igneous rock drilling is analyzed. It can be found that the occurrence of stick-slip vibration can be judged by the regular wave packets in the time-domain signal, while the time-domain signal of whirl is disorderly. The main frequency of stick-slip vibration in the low-frequency band is 0.1221 Hz and the period of stick-slip vibration is very close to 10 s through Fast Fourier (FFT) and Short-time Fourier transform (DTFT) methods. In the process of whirling, two frequencies, respectively, 0.05341 Hz and 155.5 Hz, play a major role. The frequency 0.05341 Hz is very close to the reciprocal of the period of 20 s when the peak energy spectrum density appears, indicating that the occurrence of whirl is very likely to be related to the natural frequency of the drilling tool. Through further time-frequency analysis, it also can be found that the occurrence of whirl and stick-slip is greatly related to the use of torsional impactors and jars.

1. Introduction

In the process of oil field development and oil and gas reservoir exploration, drilling is a project with high-cost and high-risk characteristics. Researchers have discovered one of the factors affecting the low drilling efficiency when the harmful vibration of the drill string occurs downhole [1,2,3,4,5,6,7], which is also one of the reasons for the increase in drilling costs [8,9,10]. In order to control drilling costs and improve drilling efficiency, drill string vibration has become a long-term focus of researchers in the drilling industry [11,12].
The vibration of the drill string downhole can generally be divided into four patterns: longitudinal vibration, transverse vibration, torsional vibration, and whirl [13]. When the drill string vibrates longitudinally, the drill bit will repeatedly jump off the bottom of the well, causing great damage to the PDC bit [14,15]. Burgess TM et al. established a model to cause downhole drilling tool damage mainly due to lateral vibration [16]. Torsional vibration is inevitable during the drilling process. Close DA et al. found that when the frequency of torsional vibration reaches above 50 Hz, torsional vibration can cause fatigue damage to the drilling tool [17]. When the severity of torsional vibration increases until the rotation of the drill string can be stagnated, the torsional vibration is transformed into a more harmful stick-slip vibration [5,18]. Whirl is a kind of bending vibration caused by the eccentricity of drill string rotation, and it is also an important reason for downhole drilling tool failure [18,19,20].
In order to study the vibration of downhole drilling tools, since the 1970s, researchers have established mathematical models to study the vibration of downhole drilling tools [21,22]. However, in actual drilling operations, due to the presence of drilling fluid in the borehole, the vibration of the drill string is complicated and difficult to quantify [23,24]. Therefore, another focus of drill string vibration research is on dynamic measurement. At present, most petroleum service companies use measurement acceleration to achieve dynamic measurement of downhole drilling tools [1] and have developed a drill string vibration measurement and analysis system that can be put on the market [25,26,27]. As early as 1993, Baker Hughes developed a ground measurement system for drill string vibration mounted on kelly [28], and later developed a near-bit measurement tool with eccentric accelerometers [13]. Hallibutton developed a vibration measurement tool DDS with a three-axis accelerometer eccentrically mounted in 1998 [13]. In order to solve the problem of real-time signal viewing, Schlumberger developed a vibration measurement system that uses a mud pulse system to transmit signals in real time. The system installs an orthogonal, three-axis accelerometer on the axis of the measurement device [29,30,31]. APS company independently developed a drill string vibration measurement system DVMS [32] that installs a three-axis accelerometer radially along the radius of the measuring device. Among the three existing acceleration sensor installation methods, the acceleration sensor installation method of the storage drill string vibration measurement equipment in this article is the same as that of Baker Hughes and Hallibutton, which belong to the eccentric installation method of the acceleration sensor.
The research group used this measuring device to collect the near-bit drill string vibration signal during the drilling of an oil well. We intercepted the drilling signal of the igneous rock section. We analyzed the drill string vibration pattern reflected by the vibration signal through the peak value, average value, and root mean square value of the signal. Additionally, through fast Fourier transform [33] and short-time Fourier transform [34] methods, we analyzed the time-frequency characteristics of vibration signals. It provided an effective basis for identifying harmful vibrations in time and proposing damping measures during igneous rock drilling.

2. Principle and Method of Drill String Vibration Measurement

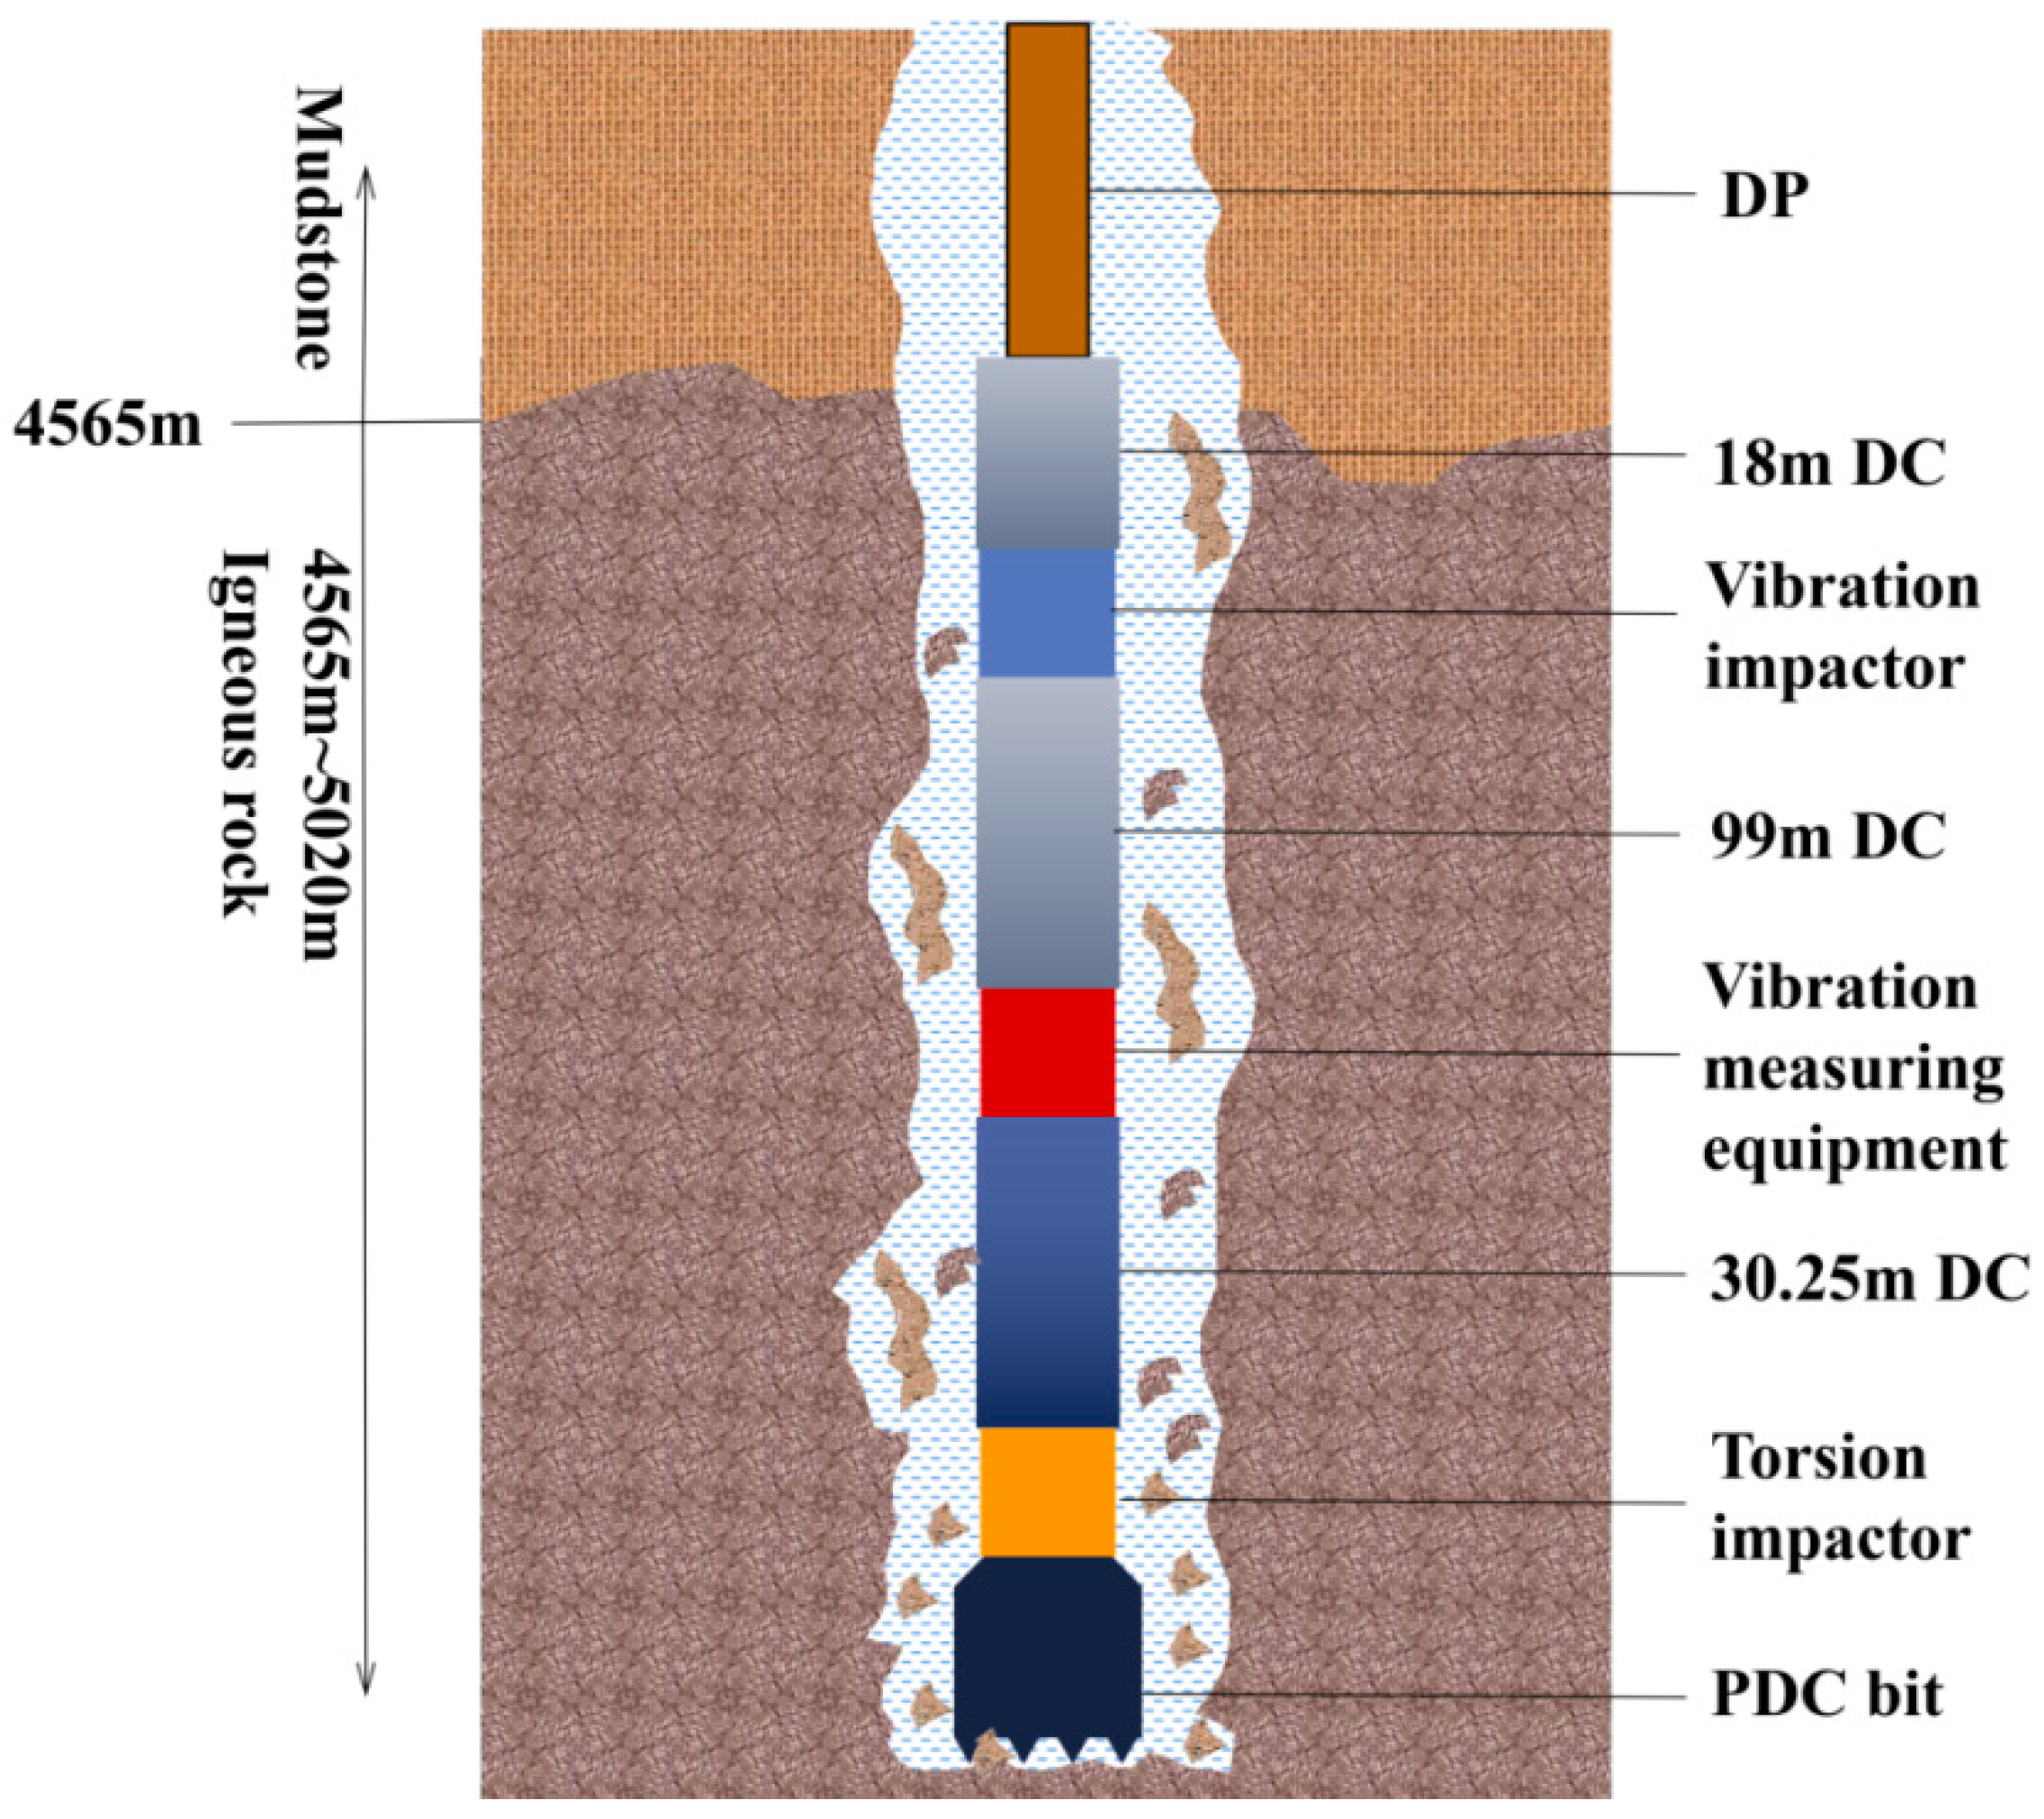
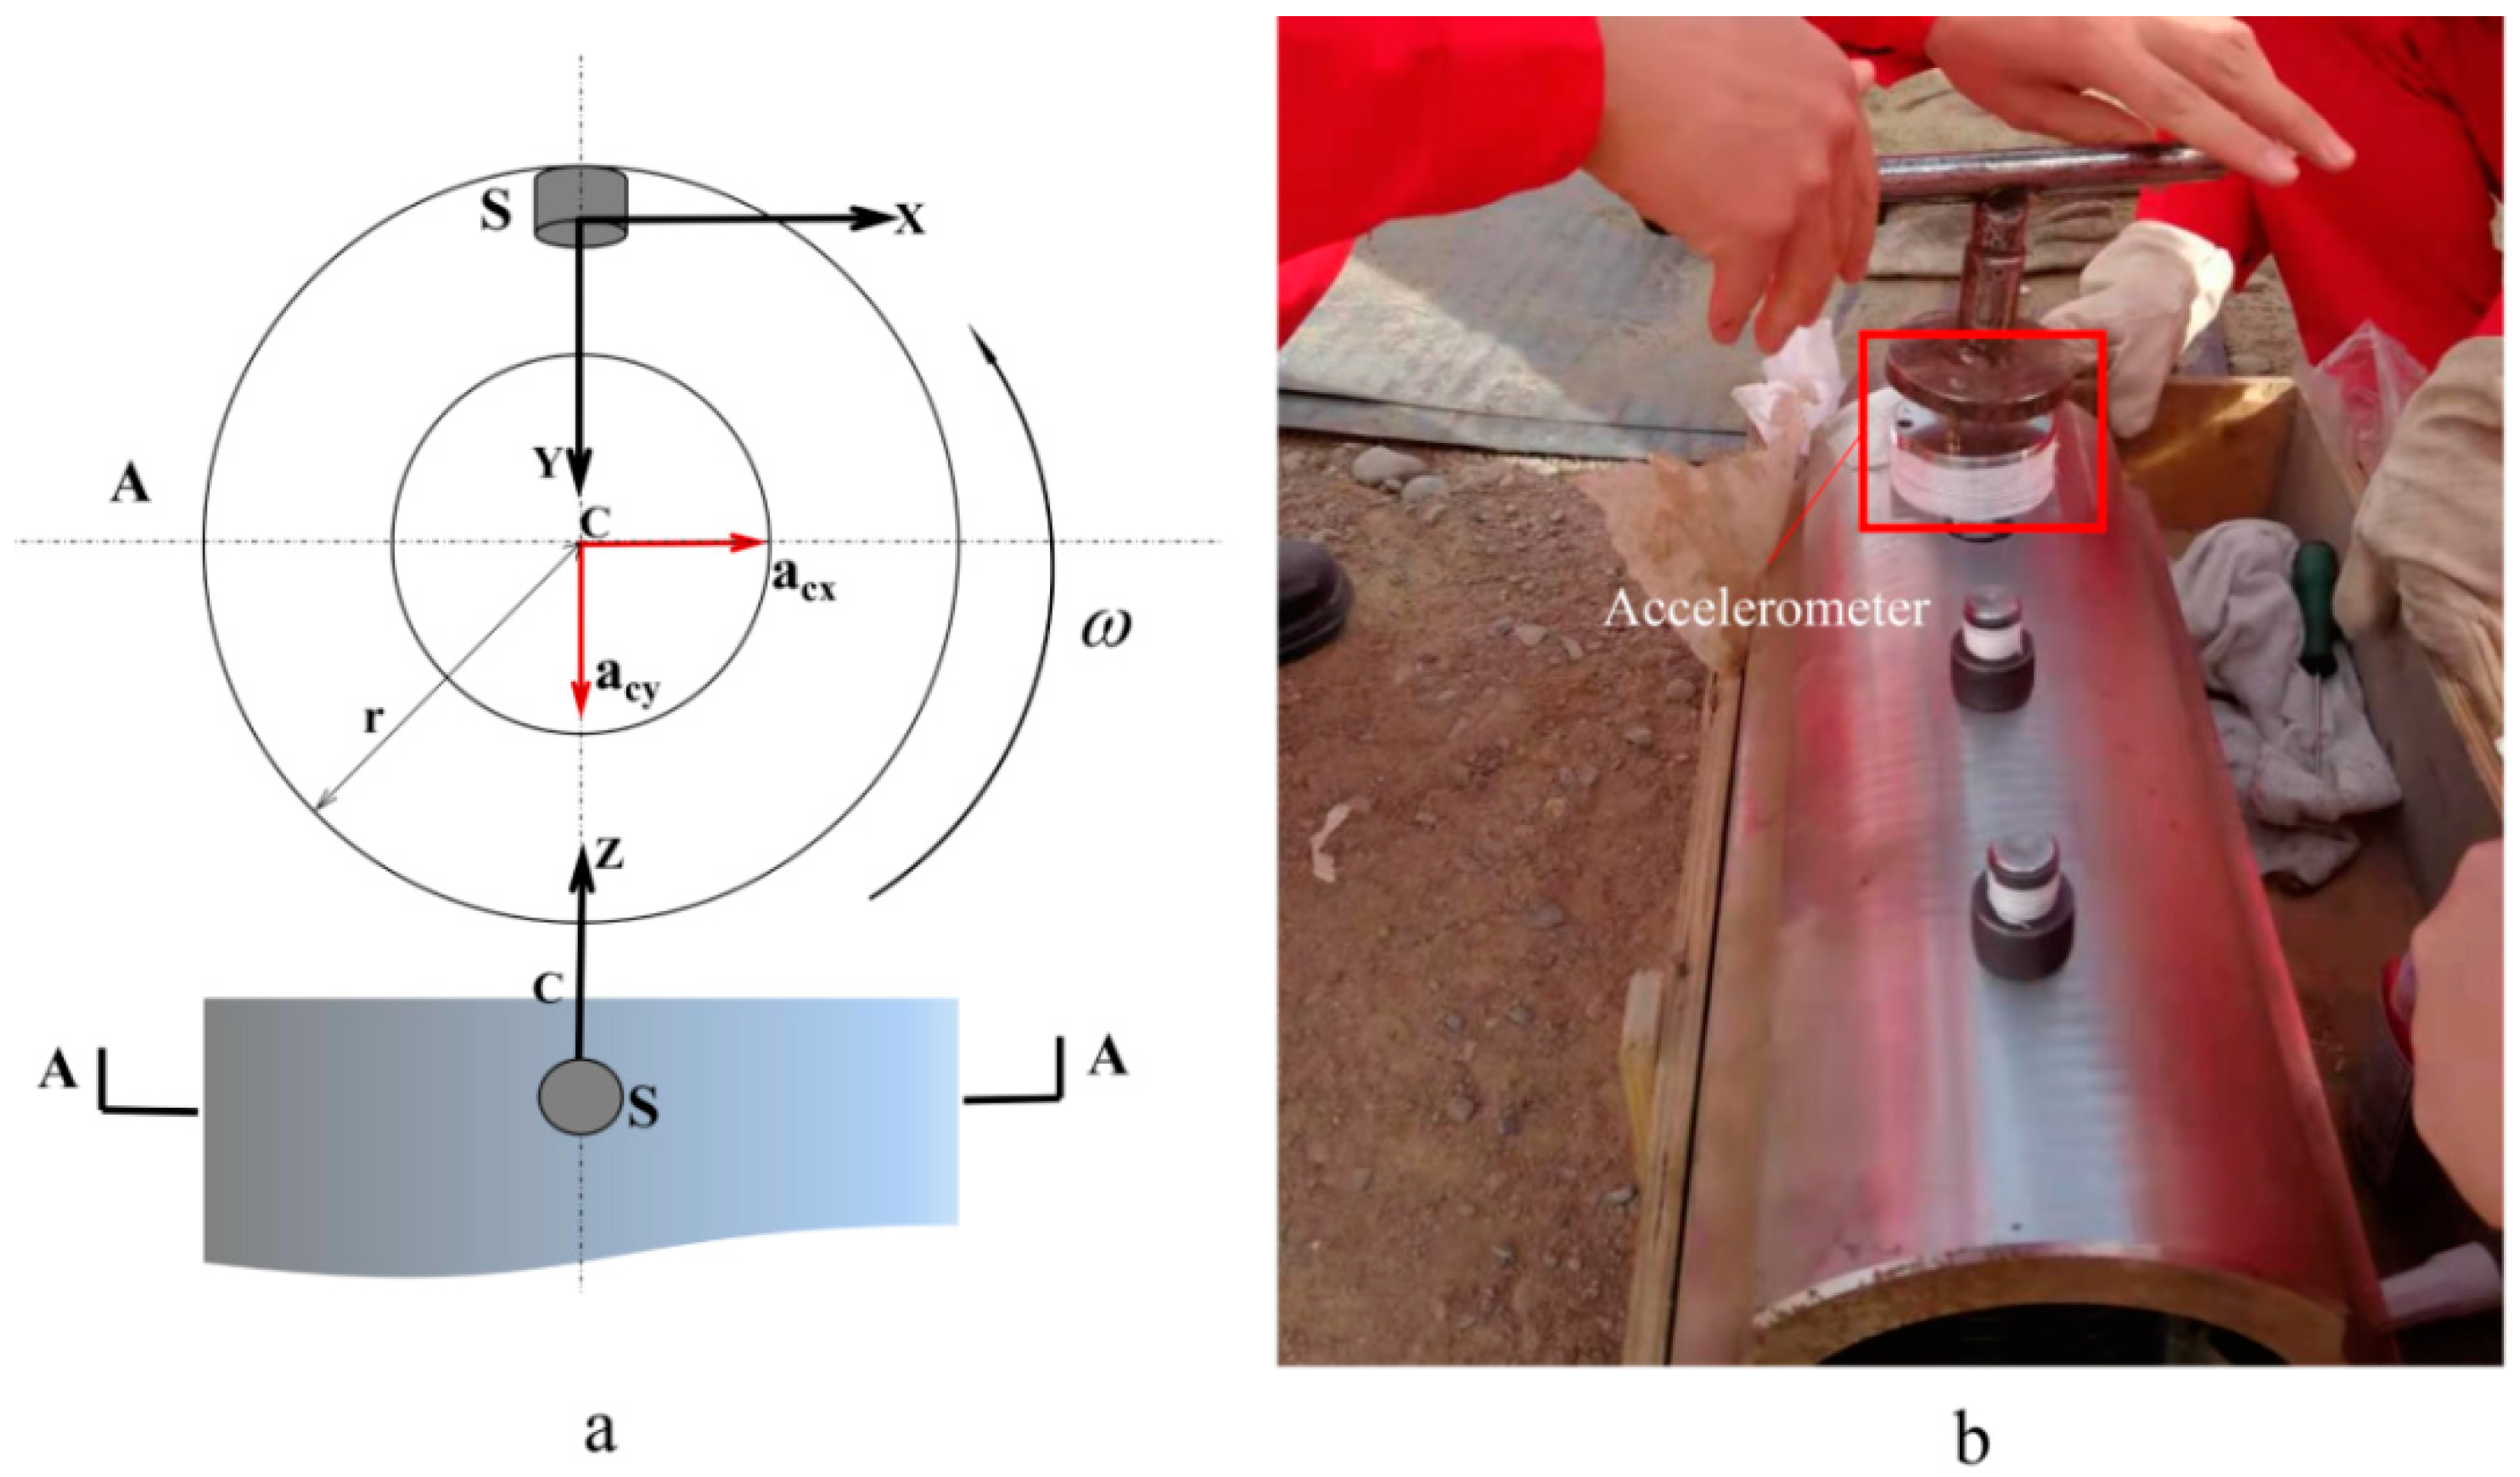
2.1. Principle of Drill String Vibration Measurement

The downhole drilling tool assembly used in this vibration data collection is shown in Figure 1. In order to reduce the impact of the jar and the torsion device on the vibration measurement signal, the vibration measurement equipment was installed 32 m above the drill bit, 30.25 m from the lower torsion impactor, and 99 m from the upper jar. The vibration measurement equipment was connected with the torsion impact device and the jar by drill collars. The dimensions of the main downhole drilling tools are shown in Table 1.
In deep or ultra-deep well drilling, the borehole environment is harsh. Downhole measuring instruments need to work in high-temperature and high-pressure environments. Therefore, a reliable and effective measuring device is a prerequisite for analyzing drill string vibration. This research group developed a vibration measurement equipment based on the investigation of the current development status of existing measurement equipment. The purpose of this equipment is to install the three-axis acceleration sensor radially eccentrically on the measuring sub body. The specific principle is shown in Figure 2. The sensor was installed on the measuring sub body with a certain eccentricity R. It started to move with the rotation of the drill string and collected the composite signal of the revolution and rotation of the drill string. The specific parameters of the acquisition sensor are shown in Table 2.
The three-axis acceleration sensor was eccentrically installed on the body of the drill string vibration measurement equipment. The three orthogonal axes of the accelerometer respectively measure the axial vibration acceleration of the drill string, the radial vibration acceleration of the measuring point where the sensor on the drill string is pointing to the axis of the drill string, and the tangential acceleration of the sensor on the motion trajectory.
The designed completion depth of the logging well is 8054 m, and igneous rock was encountered in the Permian well at a depth of 4565~5020 m. In the process of drilling into the igneous rock, the borehole wall collapsed and blocks frequently occurred. Therefore, this vibration measurement mainly collected vibration data with a depth of 4565~5020 m. The measurement equipment setting parameters and downhole environment are shown in Table 3. After the igneous rock drilling data acquisition was completed, the vibration measurement equipment stored the signal in real time. As the drilling tool was replaced and brought to the ground, the collected data are shown in Figure 3.

2.2. Vibration Signal Processing

The drill string rotates and revolves downhole. Because the sensor is installed eccentrically on the measuring equipment, the vibration acceleration at the center of the drill string has a certain relationship with the vibration acceleration collected by the sensor. Assuming that the installation eccentricity of the sensor on the measuring equipment is R , the relationship between the measured value of the orthogonal three-axis acceleration sensor in three directions and the center acceleration of the drill string is:
a S X = a C X + R ω ˙
a S Y = a C Y + R ω 2
a C Z = a S Z
where a C X and a C Y are the lateral vibration acceleration of the drill string center, a C Z is the axial vibration acceleration of the drill string center, a S X is the vibration acceleration of the sensor center along the tangential direction of the drill string, a S Y is the acceleration of the sensor center along the drill string radial direction, and a S Z is the acceleration of the sensor center along the drill string axial direction. The unit of acceleration is the acceleration of gravity g , R is the distance from the sensor to the center of the drill string, and the unit is m . ω is the rotation angular velocity of the drill string, a function of time, and the unit is r a d / s .
There are four basic patterns of drill string downhole vibration: axial vibration, lateral vibration, torsional vibration, and whirl. During drilling, these drill string vibration patterns may alternately occur or complex coupled vibrations may occur. The vibration acceleration signal collected by the vibration measurement device cannot quantify the specific vibration pattern. However, by analyzing the average value, root mean square value, and peak value of the measured value from the sensor in the time domain, the main vibration mode of the drill string in this time interval can be qualitatively judged.
When the drill string vibrates axially, the drill bit will jump up and down, which will seriously damage the PDC drill bit. It can be judged directly by the peak value and fluctuation amplitude of the axial acceleration signal.
Assume that the average values of the tangential acceleration and the radial acceleration measured by the sensor in a certain time window are a ¯ S X and a ¯ S Y . The rotation speed of the drill string is constant when general lateral vibration occurs. The integrals of a S X and a S Y in one movement cycle are equal, so the value of a ¯ S Y a ¯ S X is very small when the drill string undergoes general lateral vibration.
Torsional vibration is a vibration mode produced by the interaction between the drill bit and the formation or the drill string and the borehole wall. When a single torsional vibration occurs, the speed changes more drastically, making R ω 2 much larger than R ω ˙ , so the value of a ¯ S Y a ¯ S X is larger when torsional vibration occurs. Stick-slip vibration is a self-excited torsional vibration. When the downhole drill string undergoes Stick-slip vibration, the collected triaxial acceleration signals will show regular intermittent wave packets in the time domain. At this time, the rotation speed of the downhole drill string will appear in two states: stagnation and slippage. Periodic peaks and valleys also appear on the mean value, root mean square value, and peak curve.
The whirling of the drill string has been proven to be one of the main reasons for the premature failure of the PDC drill bit [13]. When the drill string whirl occurs, the acceleration frequency of the drill string lateral vibration will be proportional to the drill string rotation speed, and the amplitude of the radial acceleration and the tangential acceleration are roughly the same [35]. The difference between ASX and ASY is relatively large, and ASX will have a large peak.
The vibration direction of the drill string is shown in Figure 4. The figure briefly shows the direction of each vibration.

3. Result Analysis

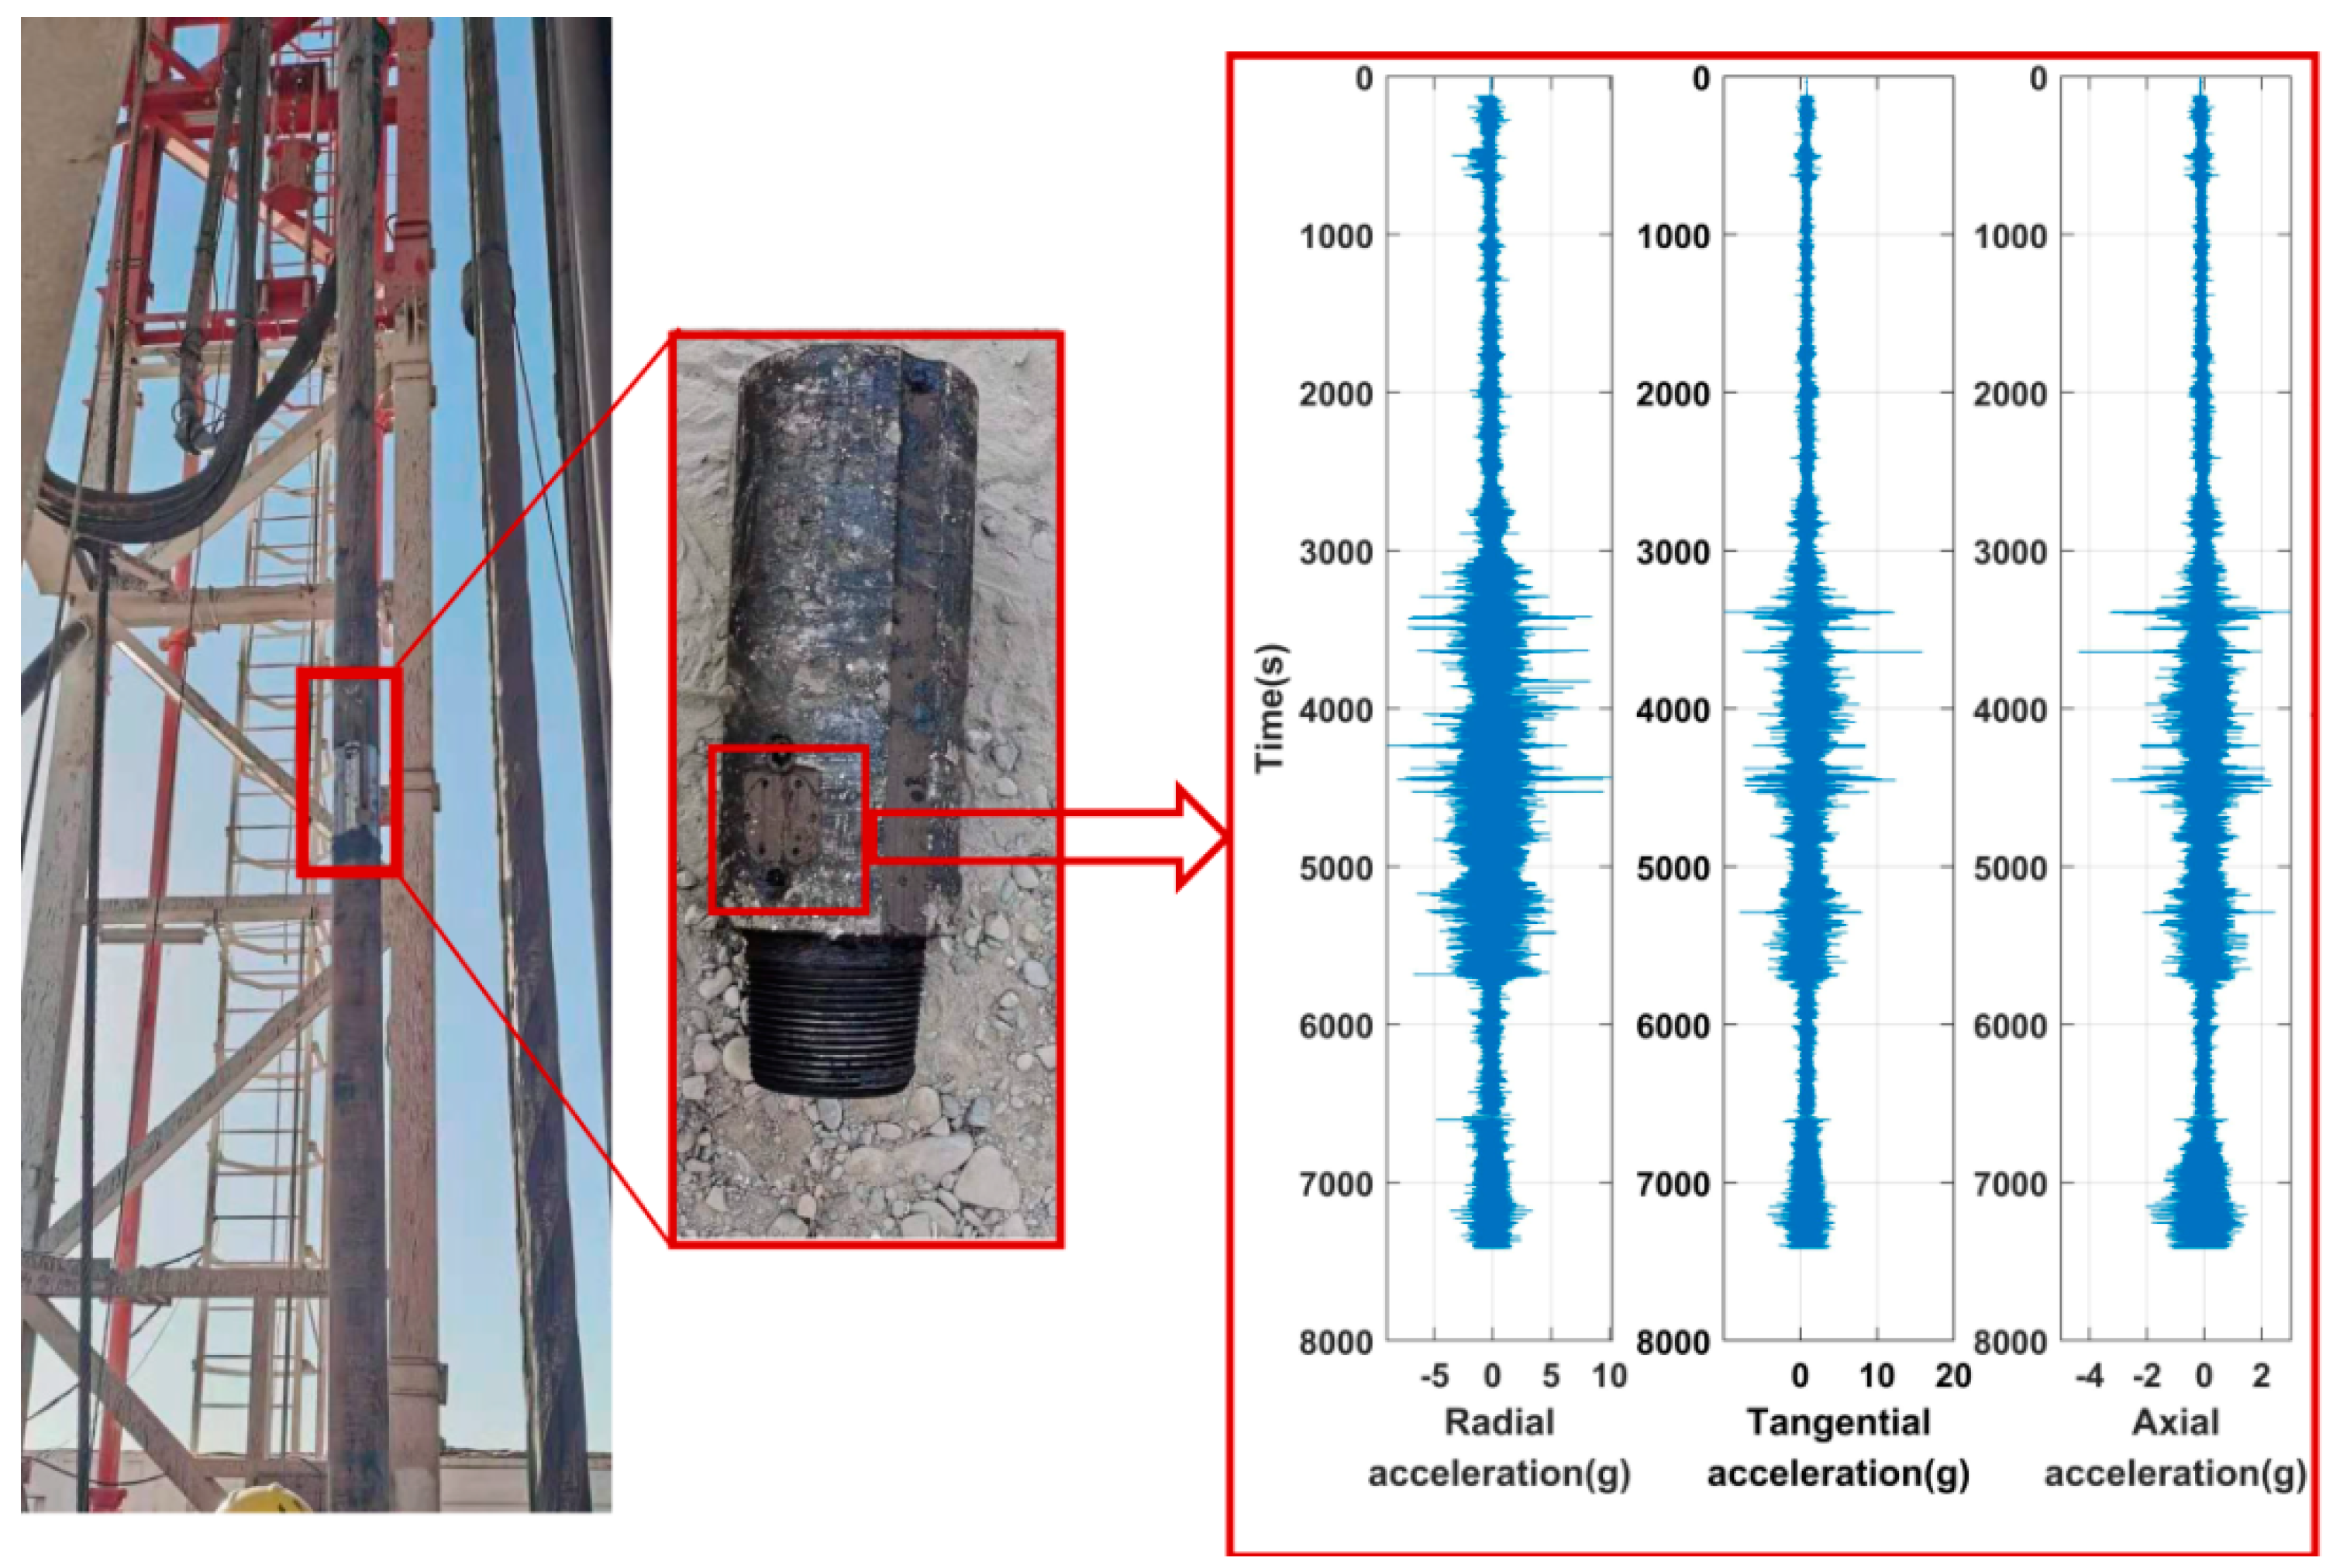
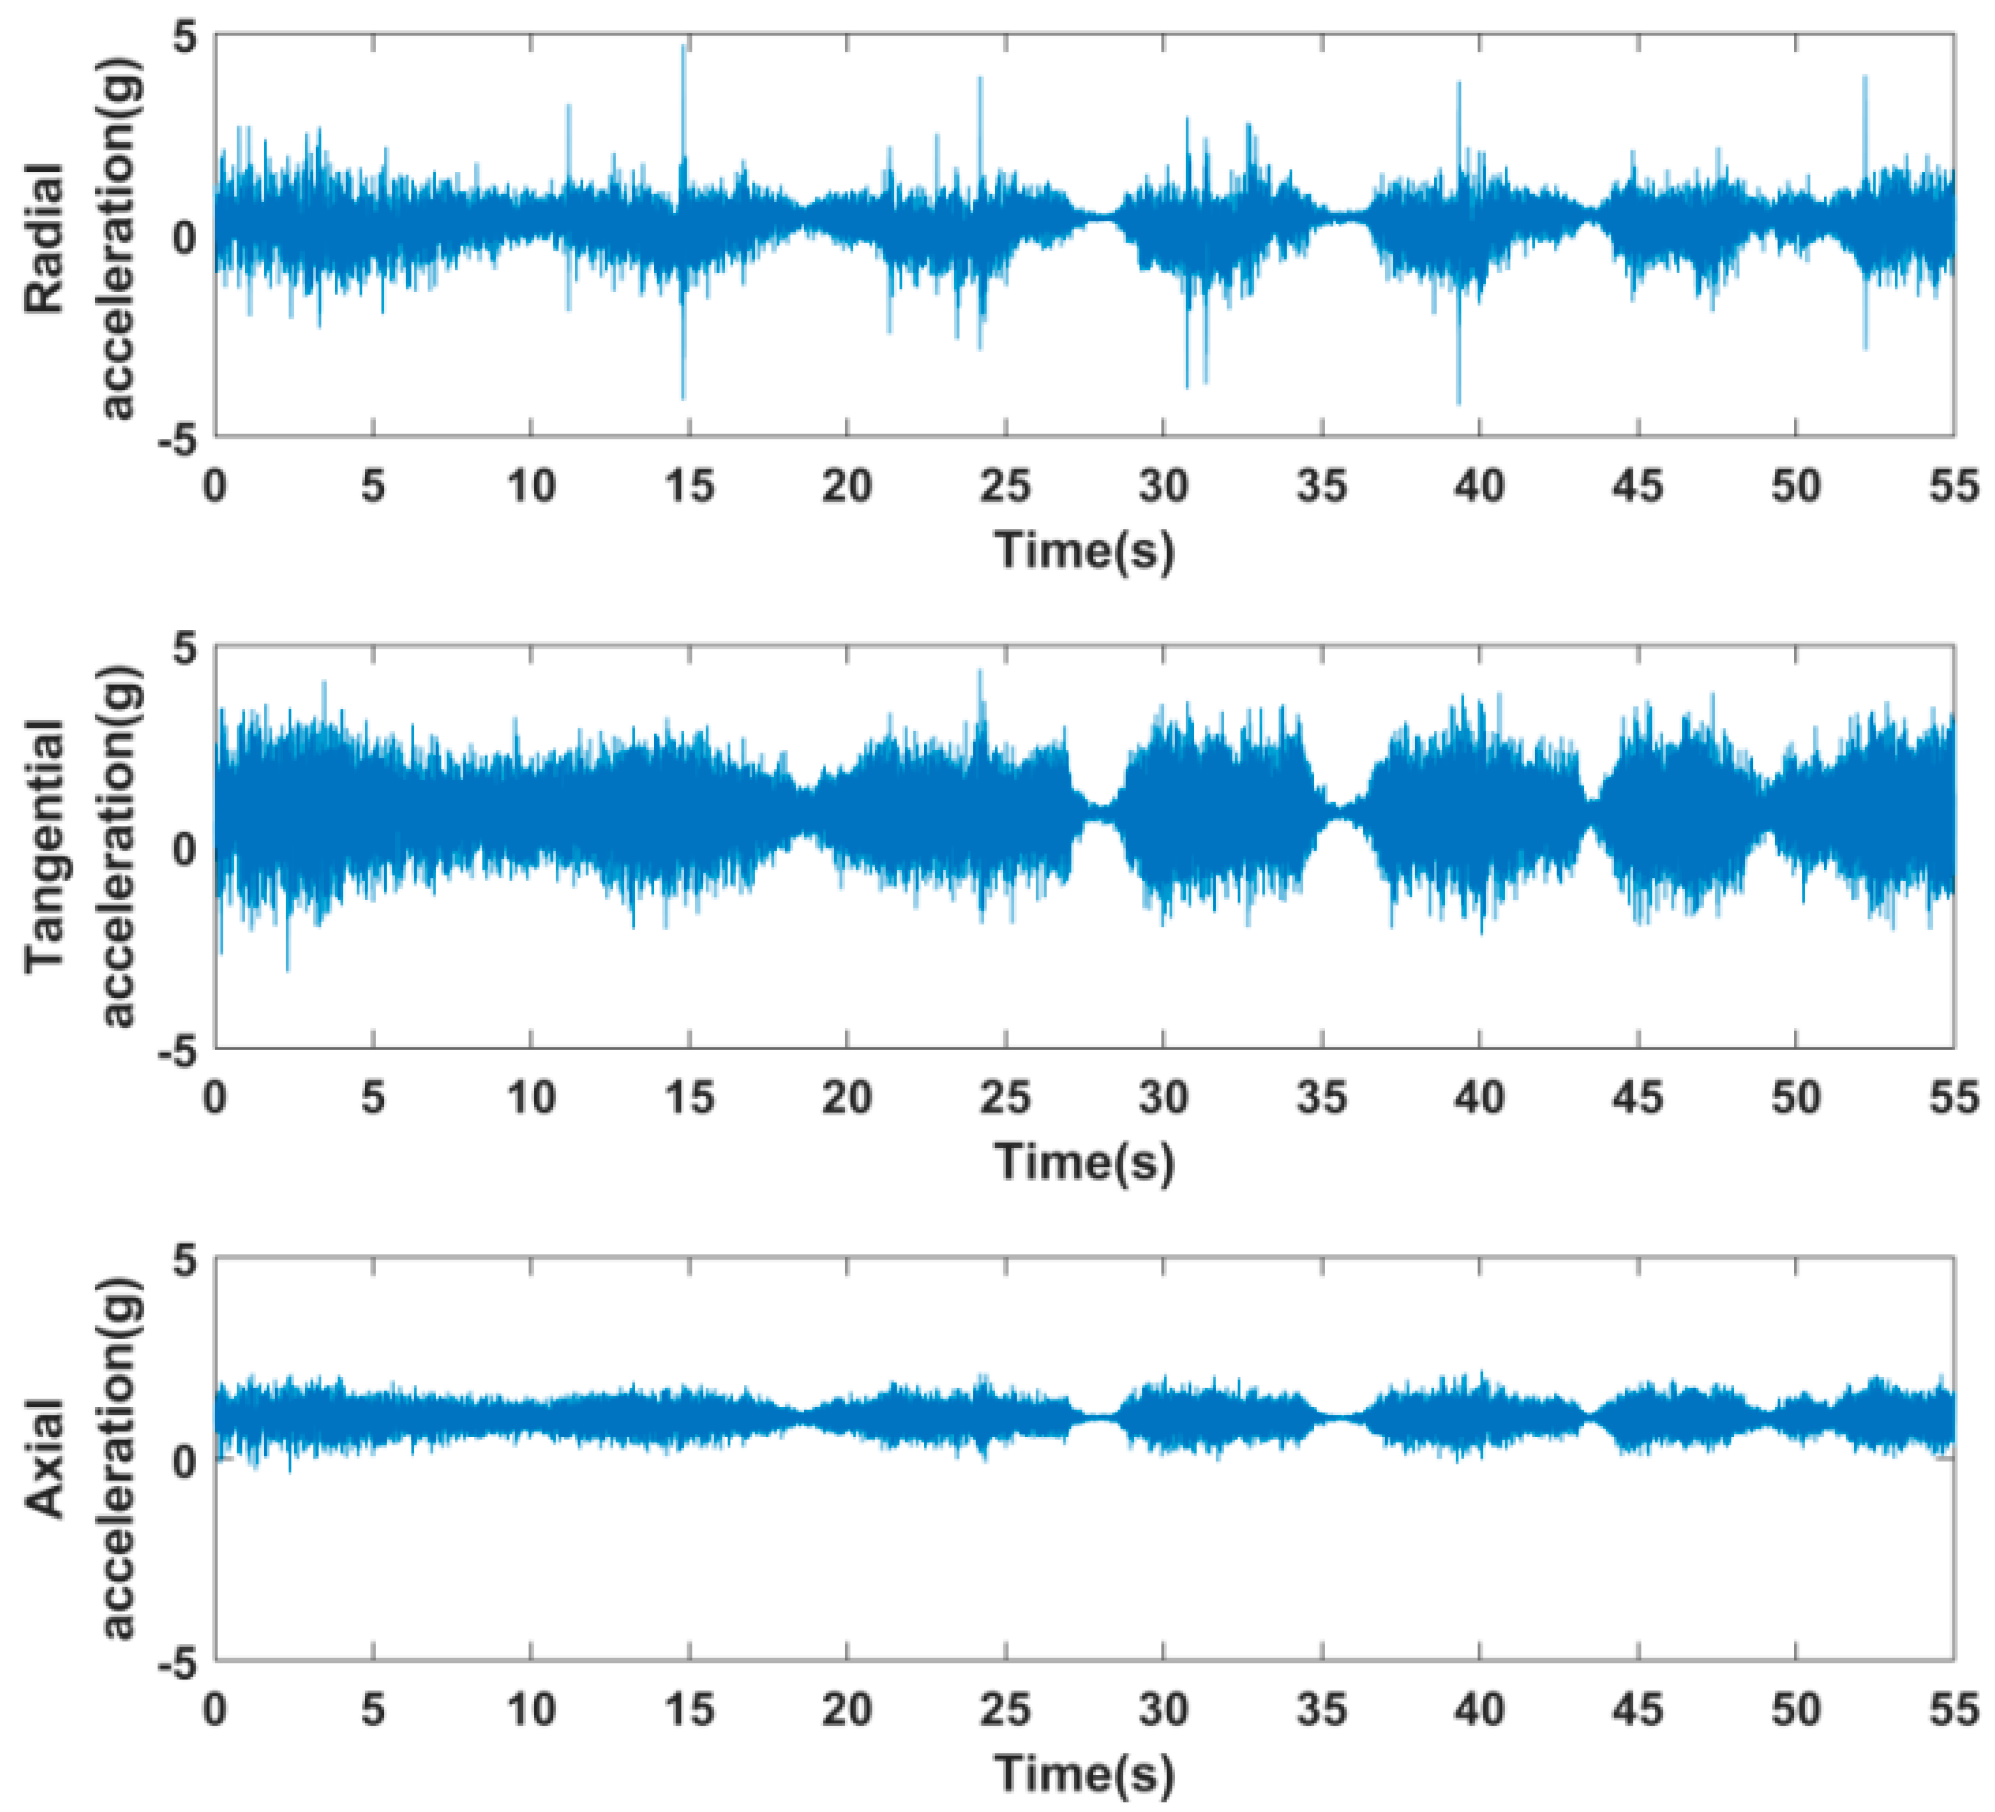
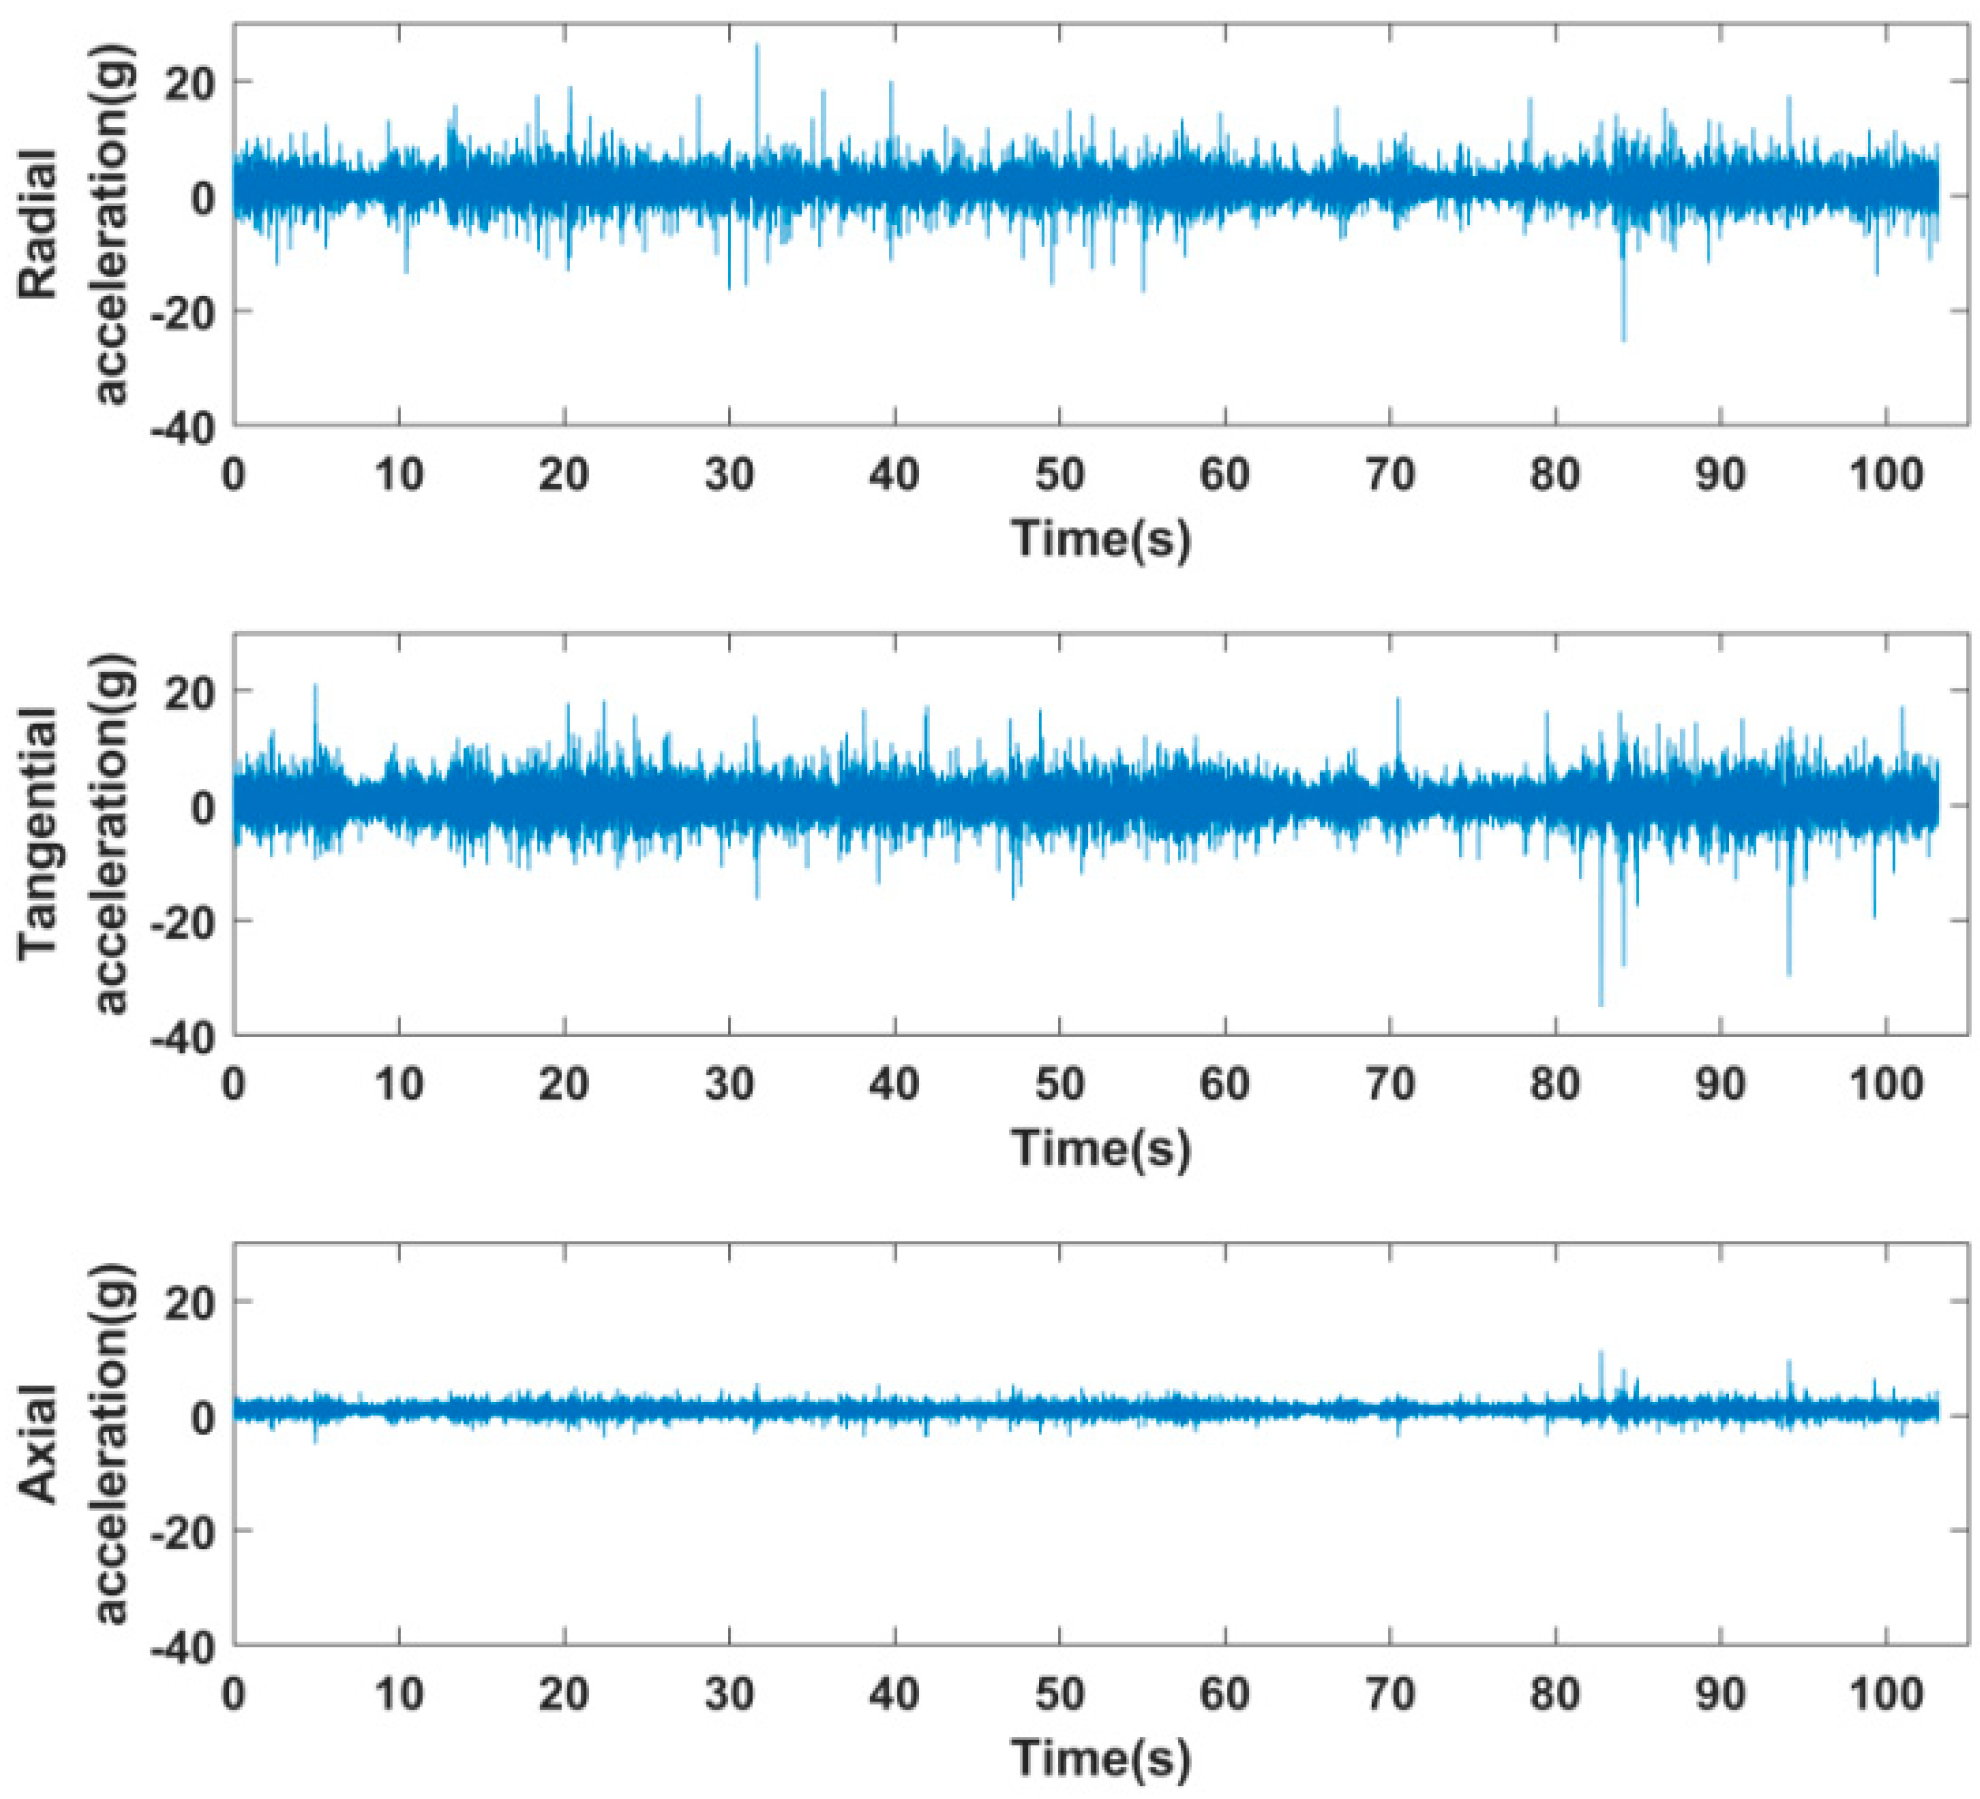
3.1. Time Domain Analysis of Vibration Signal

In the entire igneous rock drilling, the downhole collapse and block falling accidents frequently occurred, especially at the depths of 4700~4720 m and 4740~4750 m. The drilling parameters are shown in Table 4. Therefore, a representative time-domain signal was selected for analysis in the two segments of drilling vibration signals.
To study the vibration of the downhole drilling tool during these two sections of drilling, we intercepted the time-domain signal analysis with a higher proportion in the two segments of signals. The signal types shown in Figure 5 and Figure 6 both account for more than 40% of the vibration signals in the 4700~4720-m and 4740~4750-m segments, respectively. We analyzed its characteristics in the time domain.
The three-axis acceleration signals in the signal shown in Figure 5 all exhibit periodic fluctuations in the time domain, and the fluctuation laws are the same. Tangential acceleration and radial acceleration fluctuated sharply above and below the 0 value, but the amplitude of the radial acceleration value in the negative direction was greater than the amplitude in the positive direction. The axial acceleration fluctuated around 1 g. The vibration amplitude of radial acceleration and tangential acceleration was basically about 7 g, and the amplitude of axial acceleration was 2 g. It was found that the tangential acceleration was less affected by the speed change than the radial acceleration from Equations (1) and (2), indicating that the lateral vibration of the drill string in the downhole was more severe than the axial vibration. In the intercepted signal segment, the tangential acceleration and radial acceleration were close to 0 g simultaneously after a wave packet of signal appeared. This may have been due to factors such as bending or shrinkage of the borehole wall when the drill string moved downhole, and friction with the borehole wall inevitably occurs. When the friction is large enough, the drill string stops rotating due to excessive resistance. At this time, the downhole torque will gradually accumulate. When the torque is accumulated enough to overcome the frictional resistance torque, the drill string will be released instantly, thus forming a viscous phase and a slip phase. When the axial acceleration is gradually close to 1 g and continues for a period of time, and when the values of radial acceleration and tangential acceleration tend to 0 g, it indicates that the rotation of the drill string gradually stops and is stable in a stagnant state. It can be seen from the alternating appearance of wave packets in the time domain signal. At this time, the drill string was in a state of ‘rotation-stagnation-rotation’, which is also consistent with the movement characteristics of stick-slip vibration. It shows that the vibration represented by this type of signal in igneous rock drilling is stick-slip vibration. In the time interval of 20~30 s in Figure 5, the radial acceleration gradually converged from −4 g to 0 g, indicating that the centripetal force experienced by the sensor gradually decreased to 0, and, at the same time, that the drill string rotation speed gradually decreased to 0. This process lasted about 7 s. In Figure 5, the tangential acceleration also gradually decreased from the peak value to 0 g. This shows that the torsional vibration and lateral vibration of the drill string gradually decreased until it stops. However, after about 3 s of stagnation, the radial acceleration and tangential acceleration increased to their peak values in a dominant manner, indicating that the drill string was rotating again. Axial acceleration also has a similar changing law. The difference is that the stable value of axial acceleration when it tends to stagnate is 1 g, which is consistent with the gravitational acceleration in a vertical well. It can be seen that the period of stick-slip vibration under this working condition was 10 s, in which the viscous phase was 7 s and the slip phase was 3 s.
In Figure 6, the three-axis acceleration is disorderly. The radial acceleration fluctuated from 2 g up and down, the fluctuation range was large, and the overall range of change reached 50 g. The fluctuation center of the tangential acceleration was slightly less than 2 g, and the overall fluctuation amplitude was roughly equal to the radial acceleration. It can be seen from Equations (1) and (2) that radial acceleration is more sensitive to changes in speed, while tangential acceleration is more representative of lateral vibration. The axial vibration acceleration fluctuation center was approximately 1 g, which was approximately equal to the gravitational acceleration in a vertical well. From the overall change of the time-domain signal, it can be seen that the degree of lateral vibration and torsional vibration of the drill string was more severe than the axial vibration, but the vibration mode cannot be judged only from the time-domain signal.
We calculated the peak value, root mean square value, and average value of the signal in Figure 5 and Figure 6 using a time window with a length of 100 signal points. We drew the graphs, as shown in Figure 7 and Figure 8.
Peak value, mean value, and root mean square calculation methods are as follows:
Peak value:
X p = max { | x i | }
Mean value:
X ¯ = 1 N i = 1 N x i
Root mean square:
X r m s = 1 N i = 1 N x i 2
In the peak curve of Figure 7, the changes of radial acceleration and tangential acceleration are highly similar. The maximum radial acceleration peak is 5.73 g, the maximum tangential acceleration peak is 4.50 g, and the axial acceleration peak fluctuates slightly above 2 g. This shows that the lateral vibration of the drill string during this period was relatively strong, accompanied by weaker axial vibration. The root mean square value of acceleration can reflect the vibration energy of the drill string. Figure 7 shows that, in the viscous phase, the root mean square of the radial acceleration and the tangential acceleration are both at a low level. The maximum value of the root mean square value of radial acceleration reached 1.83 g, the maximum value of root mean square value of tangential acceleration reached 1.57 g, and the root mean square value of axial acceleration fluctuated with a very small amplitude around 1 g. This shows that the drill string had the largest lateral impact energy on the borehole wall in the process of stick-slip vibration, followed by torsional vibration energy, and axial vibration was the smallest. From the mean value curve in Figure 7, the value of tangential acceleration was the smallest, the mean value of tangential acceleration fluctuated slightly above and below 0.7 g, and the maximum value did not exceed 1 g. The mean value of radial acceleration varied greatly, the maximum value reached 1.7 g, and the minimum value of the mean value in the viscous phase was not much different from the average level of the mean value of tangential acceleration. The average value of axial acceleration fluctuated slightly above and below 1 g. This shows that the mean value of tangential acceleration is related to lateral vibration. The regular wave crests in the radial acceleration are related to the centripetal force generated by the high rotational speed of the drill string during slippage, which indicates that the average value of the radial acceleration can directly reflect the torsional movement of the drill string. The average curve in Figure 7 shows that the torsional vibration of the drill string was relatively strong, and the axial vibration was weak. Moreover, it can be judged that the inclination angle was small, according to the average value of the axial acceleration being stable around 1 g.
Figure 8 shows the peak, root mean square, and mean curve of the drill signal intercepted from 4740 m to 4750 m in a time window with a length of 100 signal points. It can be seen from the peak curve in Figure 8 that the peak curves of radial acceleration and tangential acceleration are chaotic and have a high degree of coincidence. The maximum value in the radial acceleration peak curve was 28 g, the maximum value in the tangential acceleration peak curve was 37 g, and the maximum value in the axial acceleration peak curve was 11.32 g. This indicates that the lateral vibration of the drill string was relatively severe, it may have had a relatively severe impact on the well wall, and the degree of axial vibration was weaker than that of lateral vibration. In the root mean square curve of Figure 7, the maximum value of radial acceleration was 4.96 g, the maximum value of tangential acceleration was 4.99 g, and the root mean square value of axial acceleration fluctuated up and down at the center of fluctuation slightly greater than 1 g. It can be known from the analysis of stick-slip vibration in the previous article that the change of speed has a great influence on radial acceleration; so, radial acceleration can reflect the intensity of torsional vibration. Rotation speed has little effect on tangential acceleration; so, tangential acceleration can reflect the severity of lateral vibration. It shows that in this segment of the signal, the torsional vibration of the drill string was as severe as the lateral vibration, and the axial vibration was the weakest. In the mean curve in Figure 8, the fluctuation center of tangential acceleration is slightly less than 1 g, the fluctuation center of radial acceleration is about 1.8 g, and the fluctuation center of axial acceleration is 1 g. This shows that the torsional vibration and lateral vibration of the drill string occurred at the same time. The torsional vibration was relatively strong, followed by the lateral vibration, and the axial vibration was the weakest; the coupling formed a whirl motion. From the small amplitude fluctuation of the axial vibration up and down 1 g, it can be seen that the inclination angle of the well in this section was very small. This is also consistent with the on-site situation.
The effects of stick-slip and whirl are shown in Figure 9.
Through the statistical analysis of the signal in the time domain, the method for judging the vibration mode of the drill string was preliminarily proposed, as shown in Table 5.

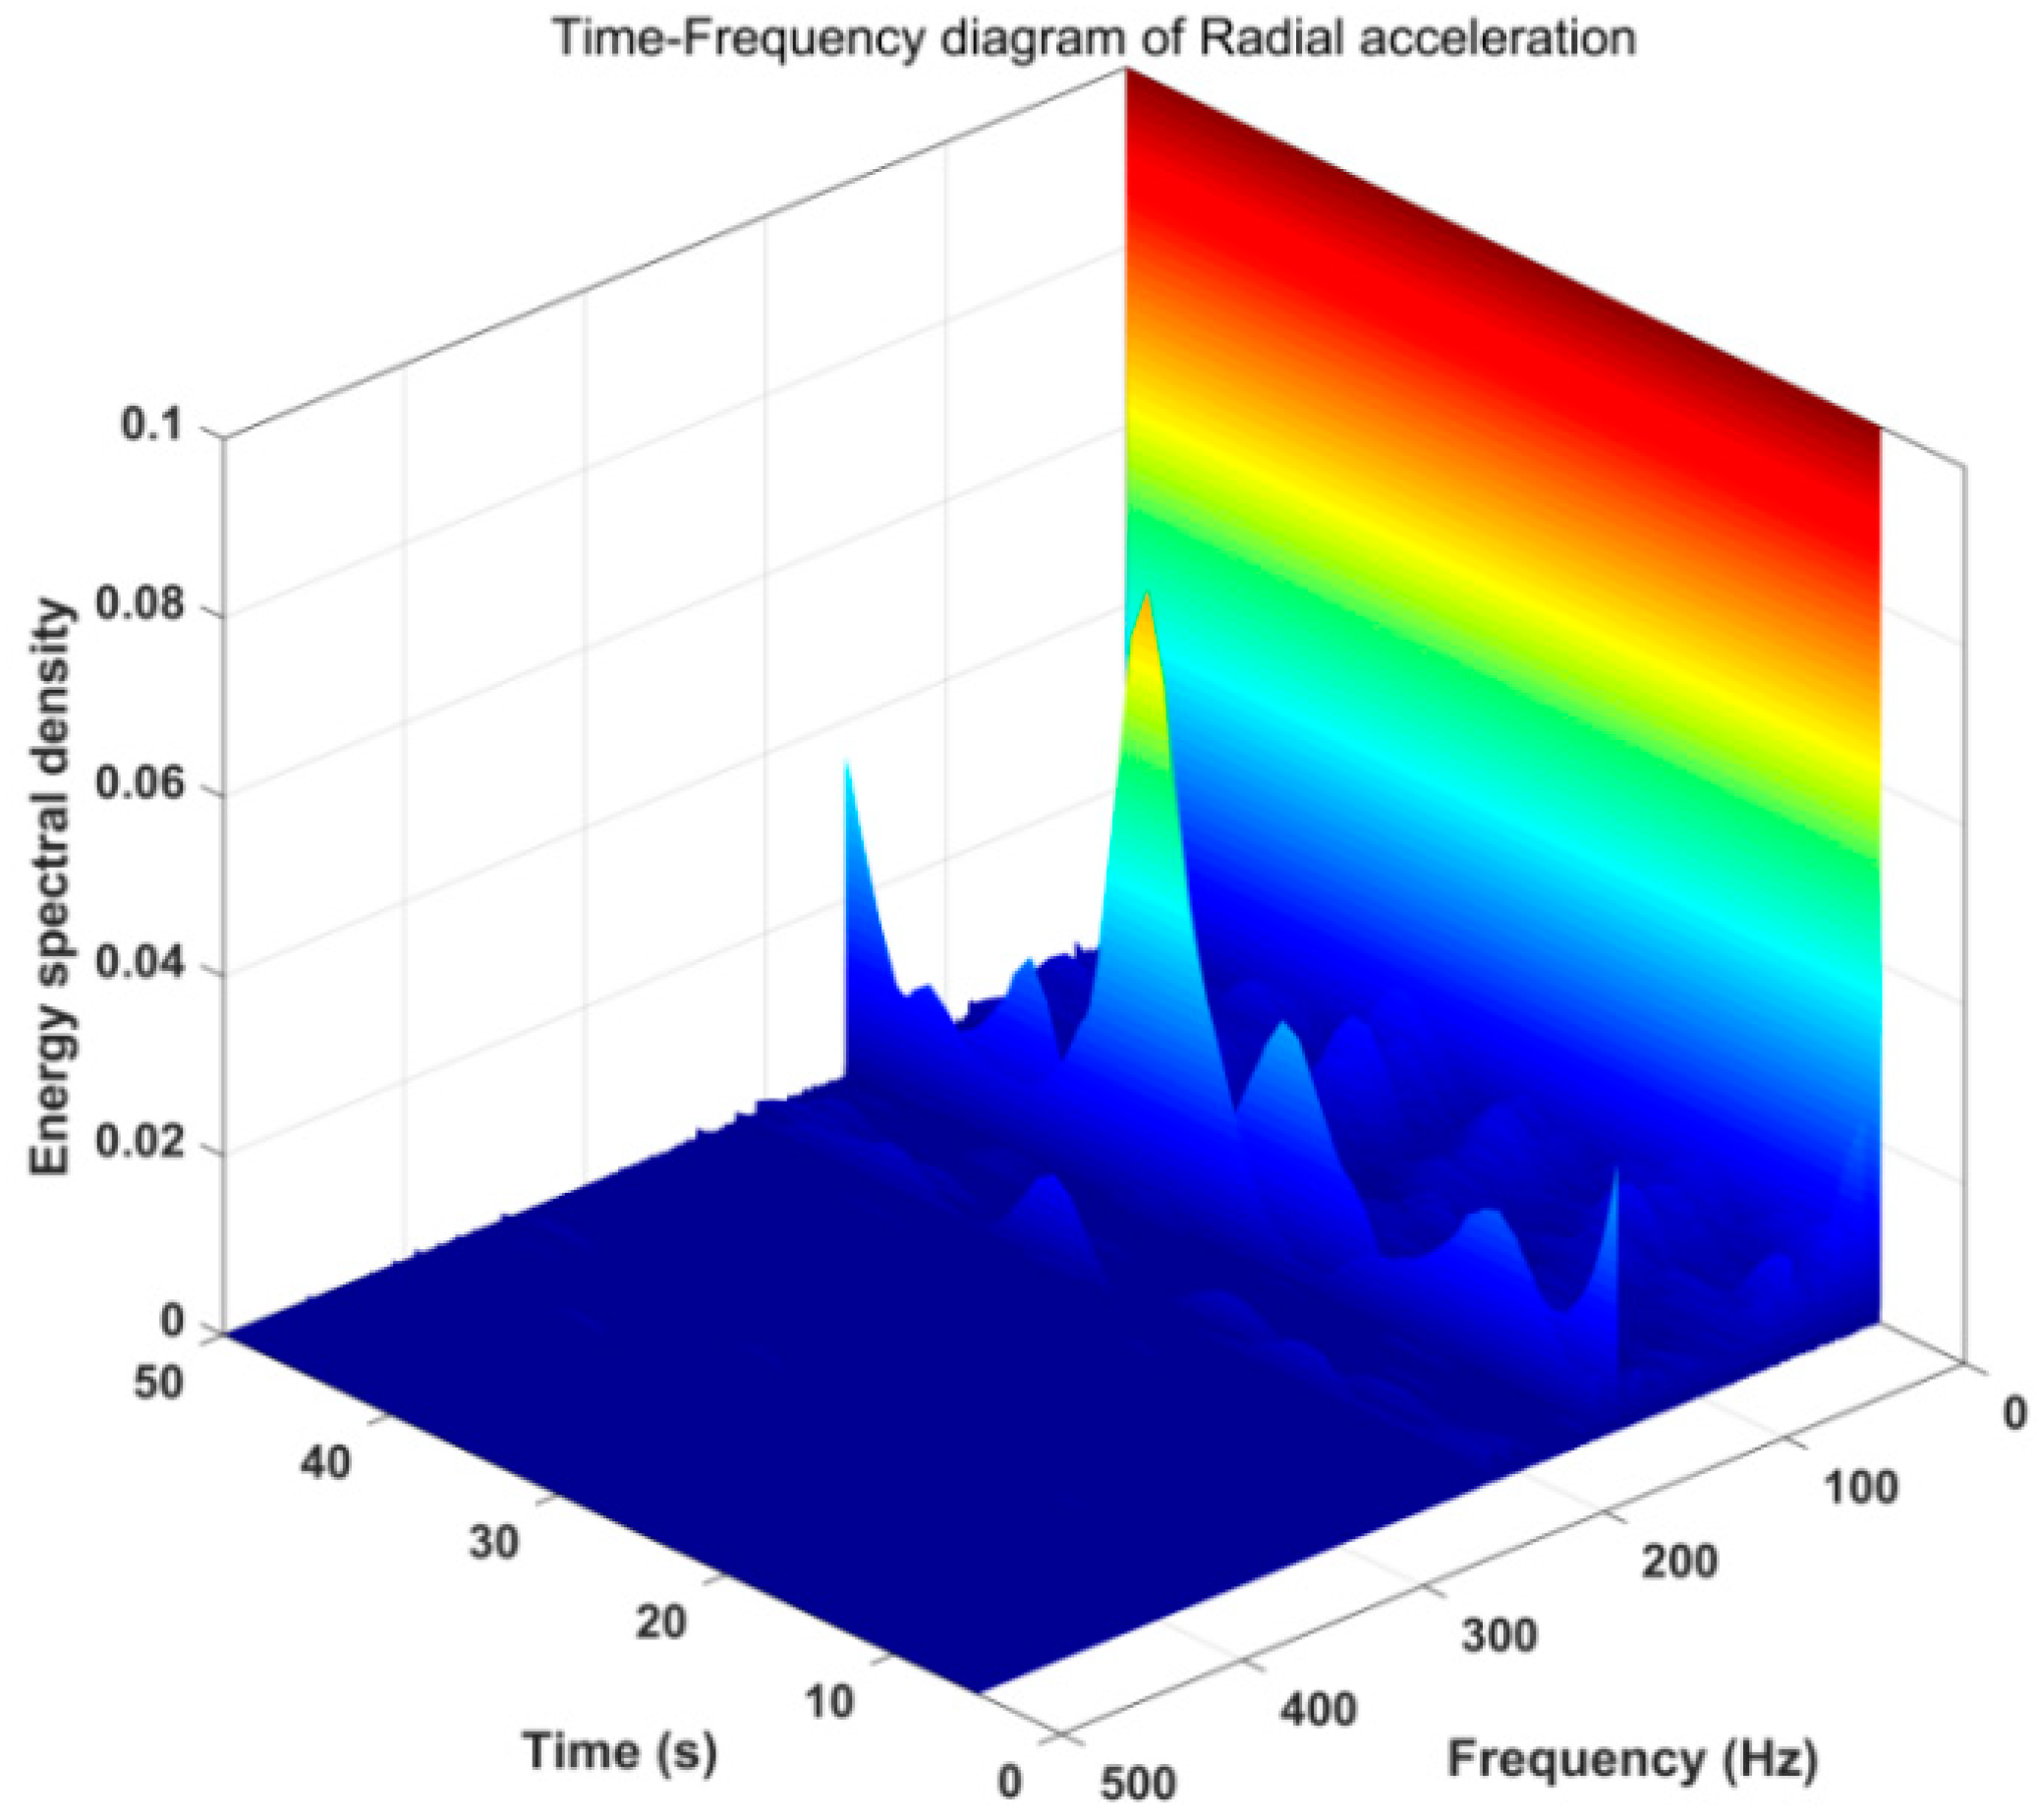
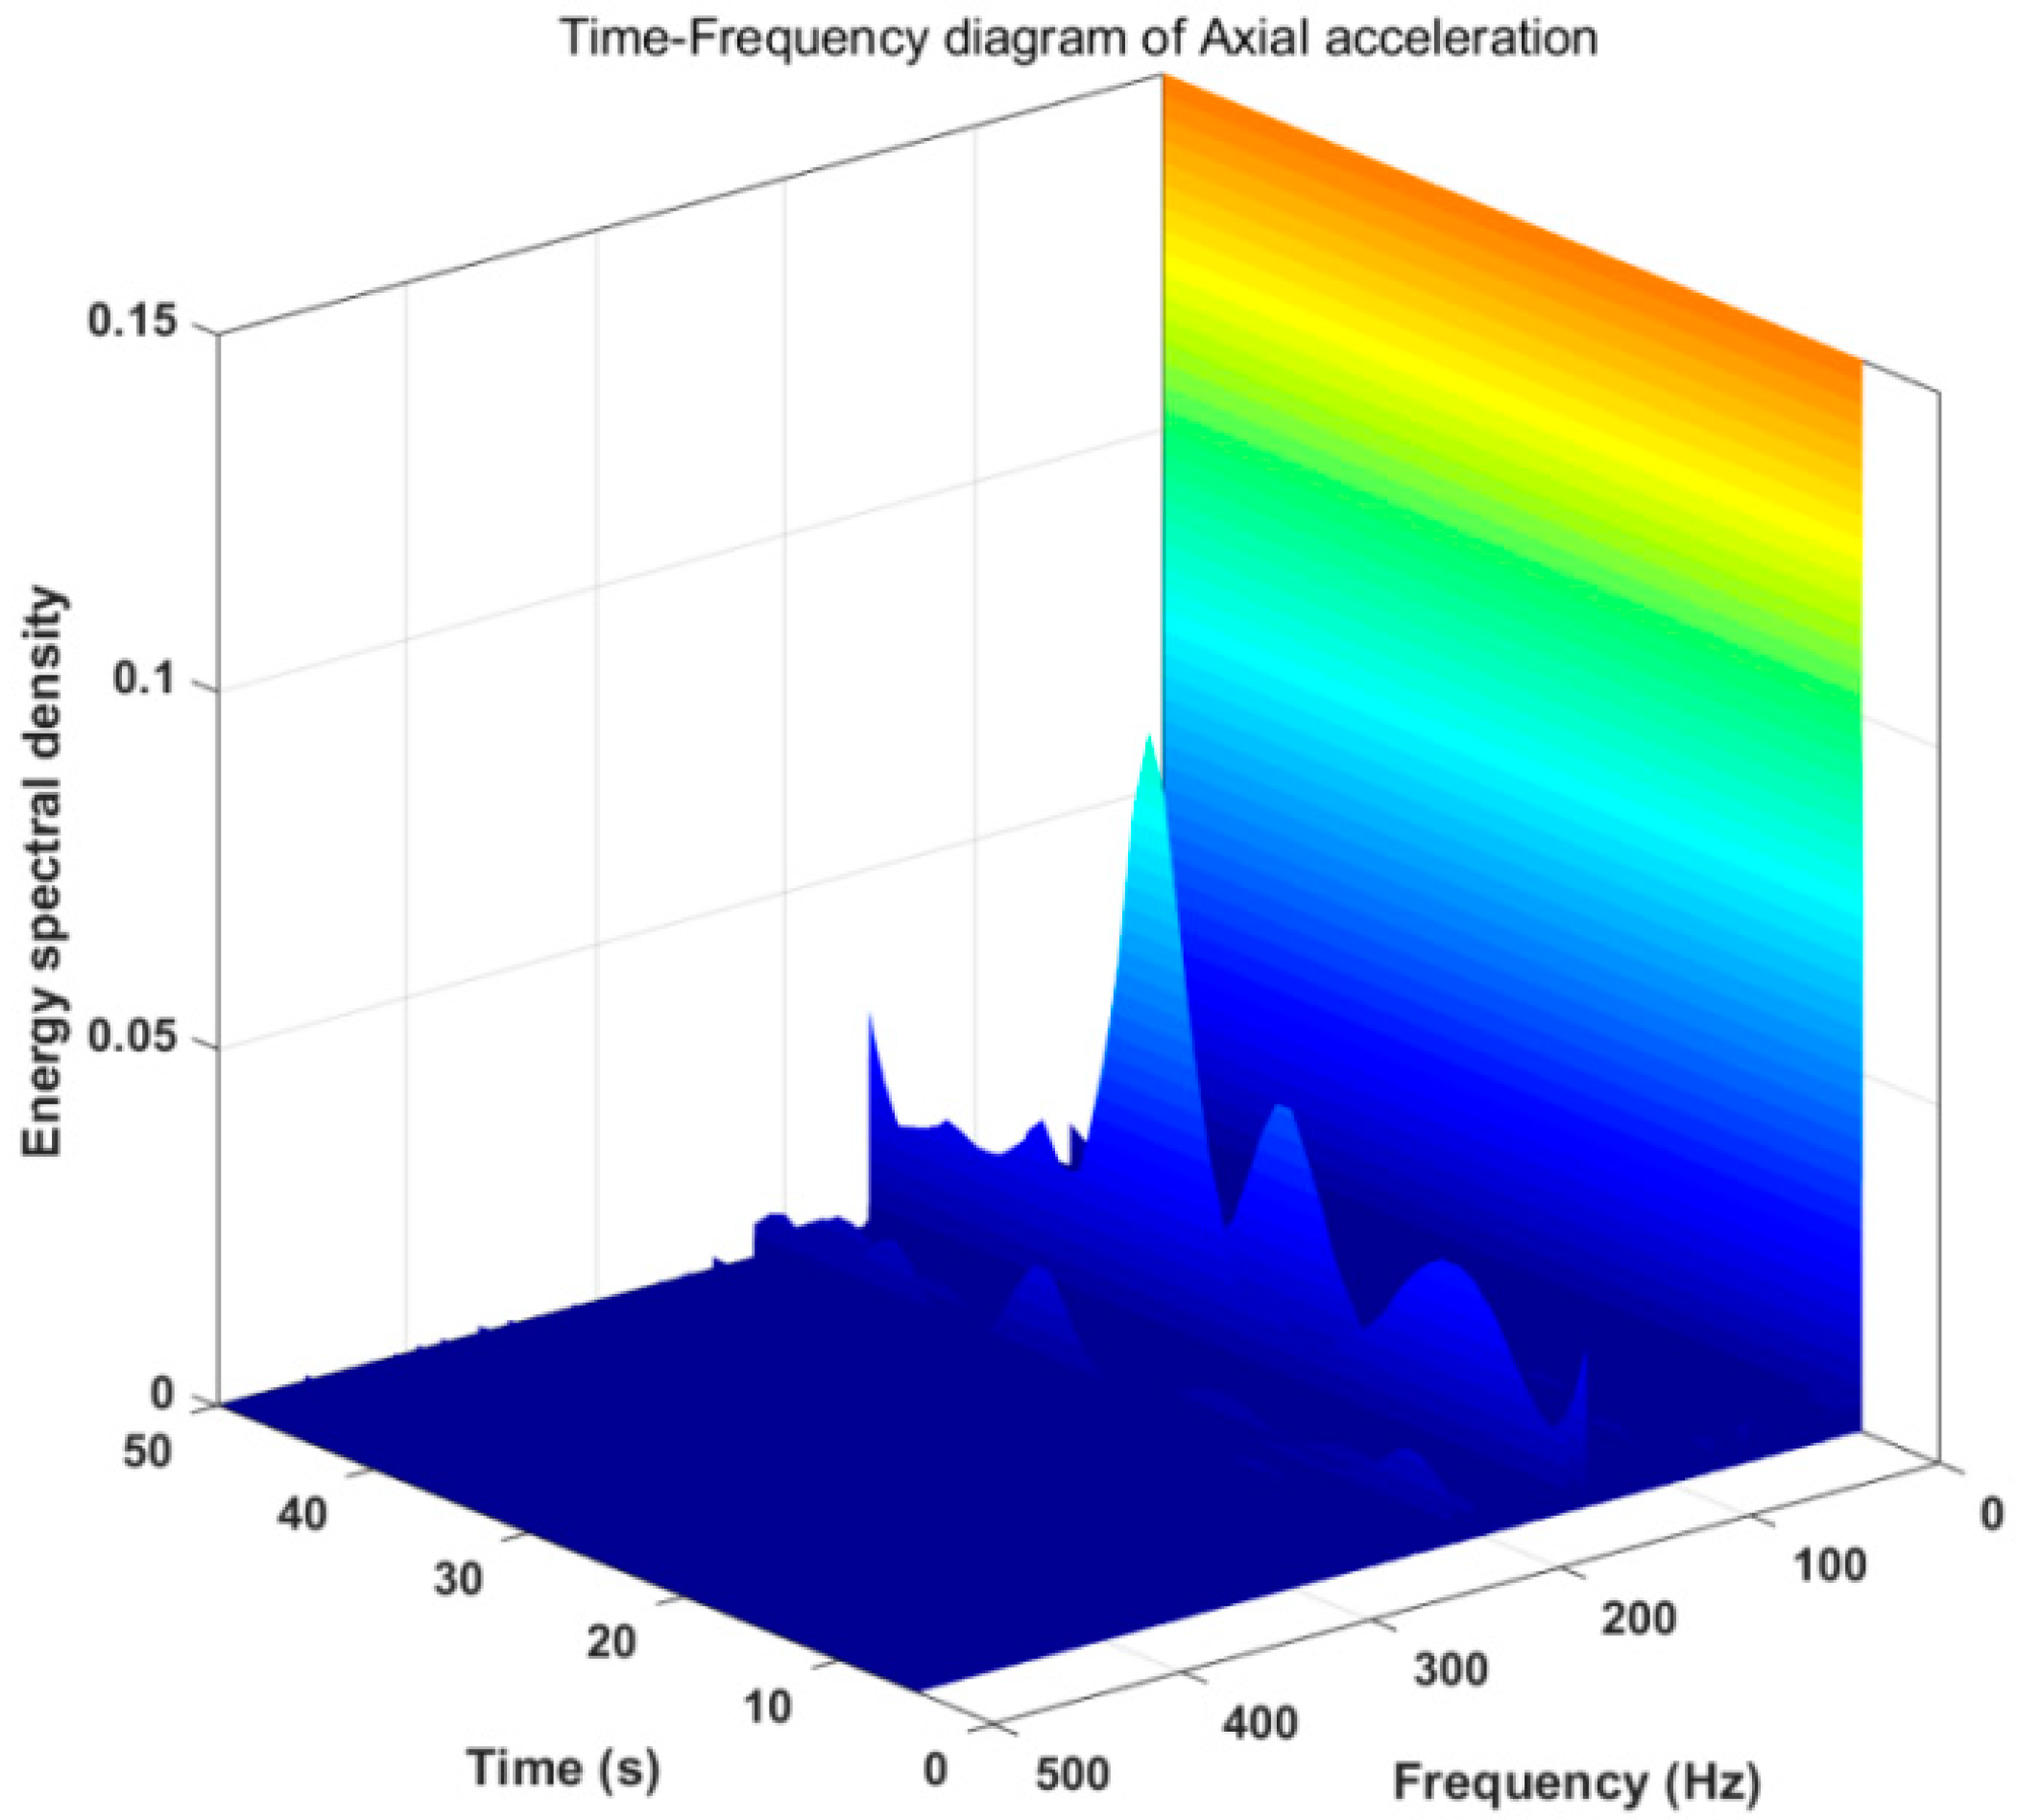
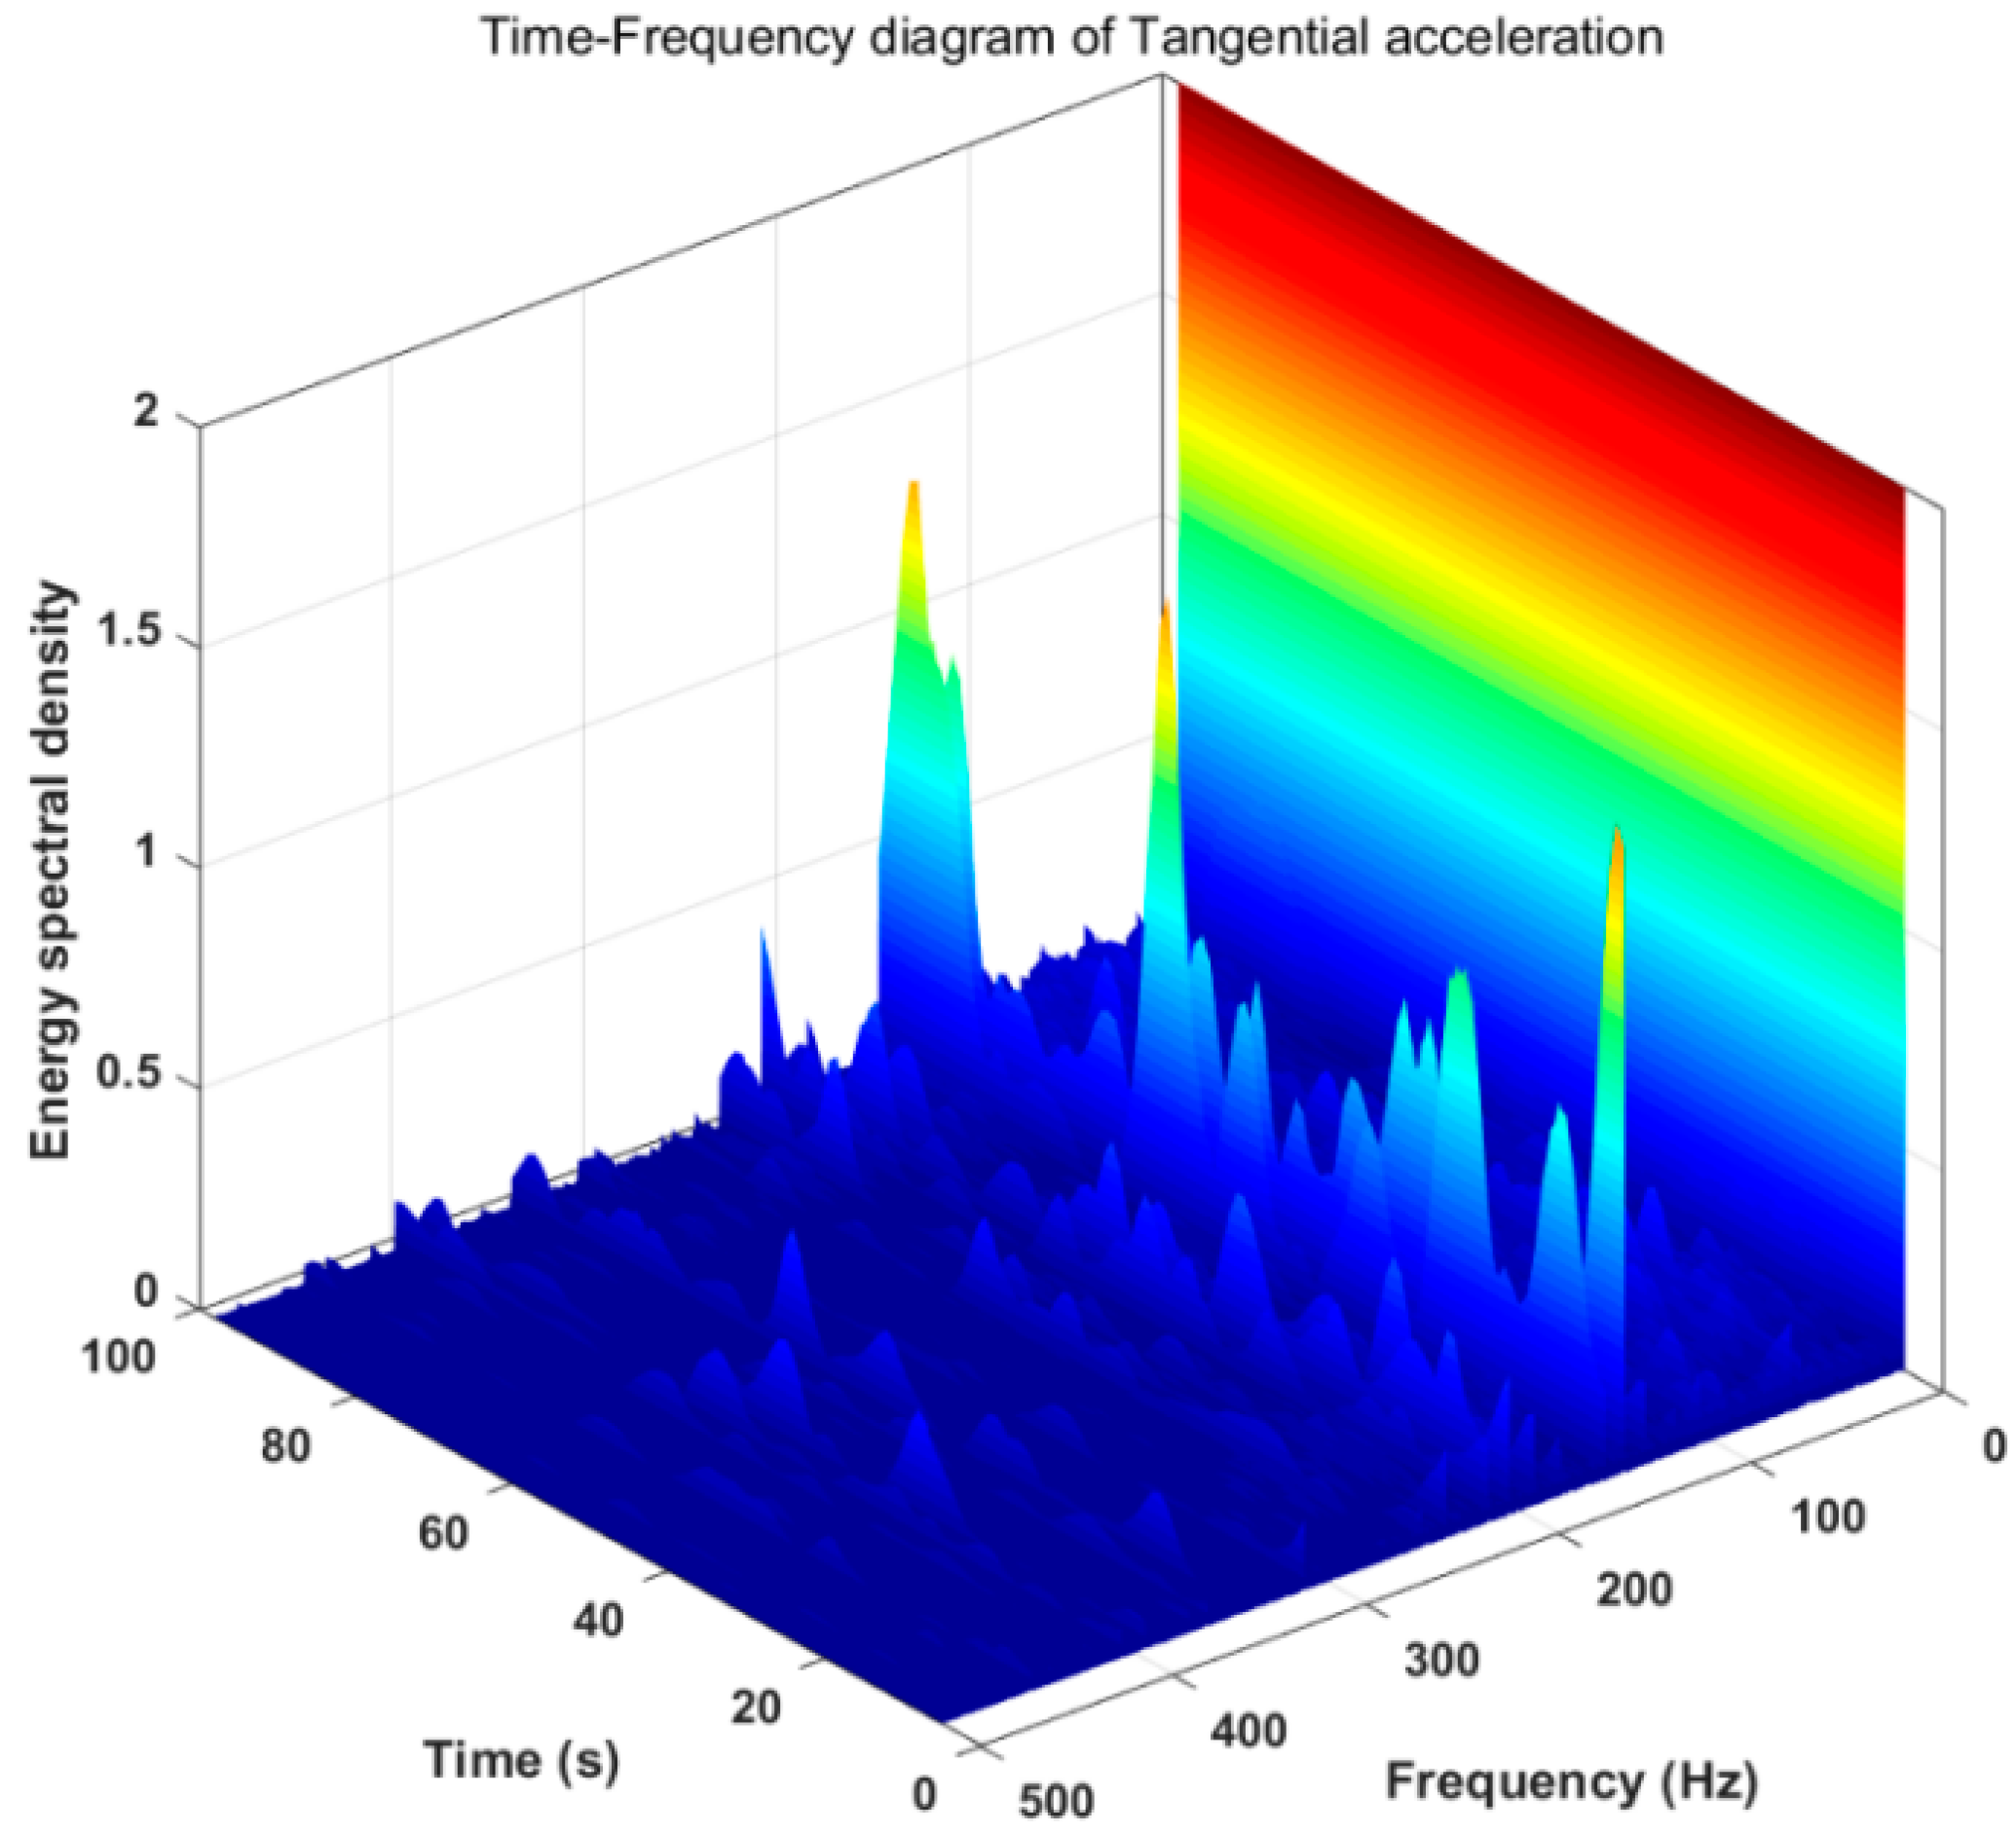
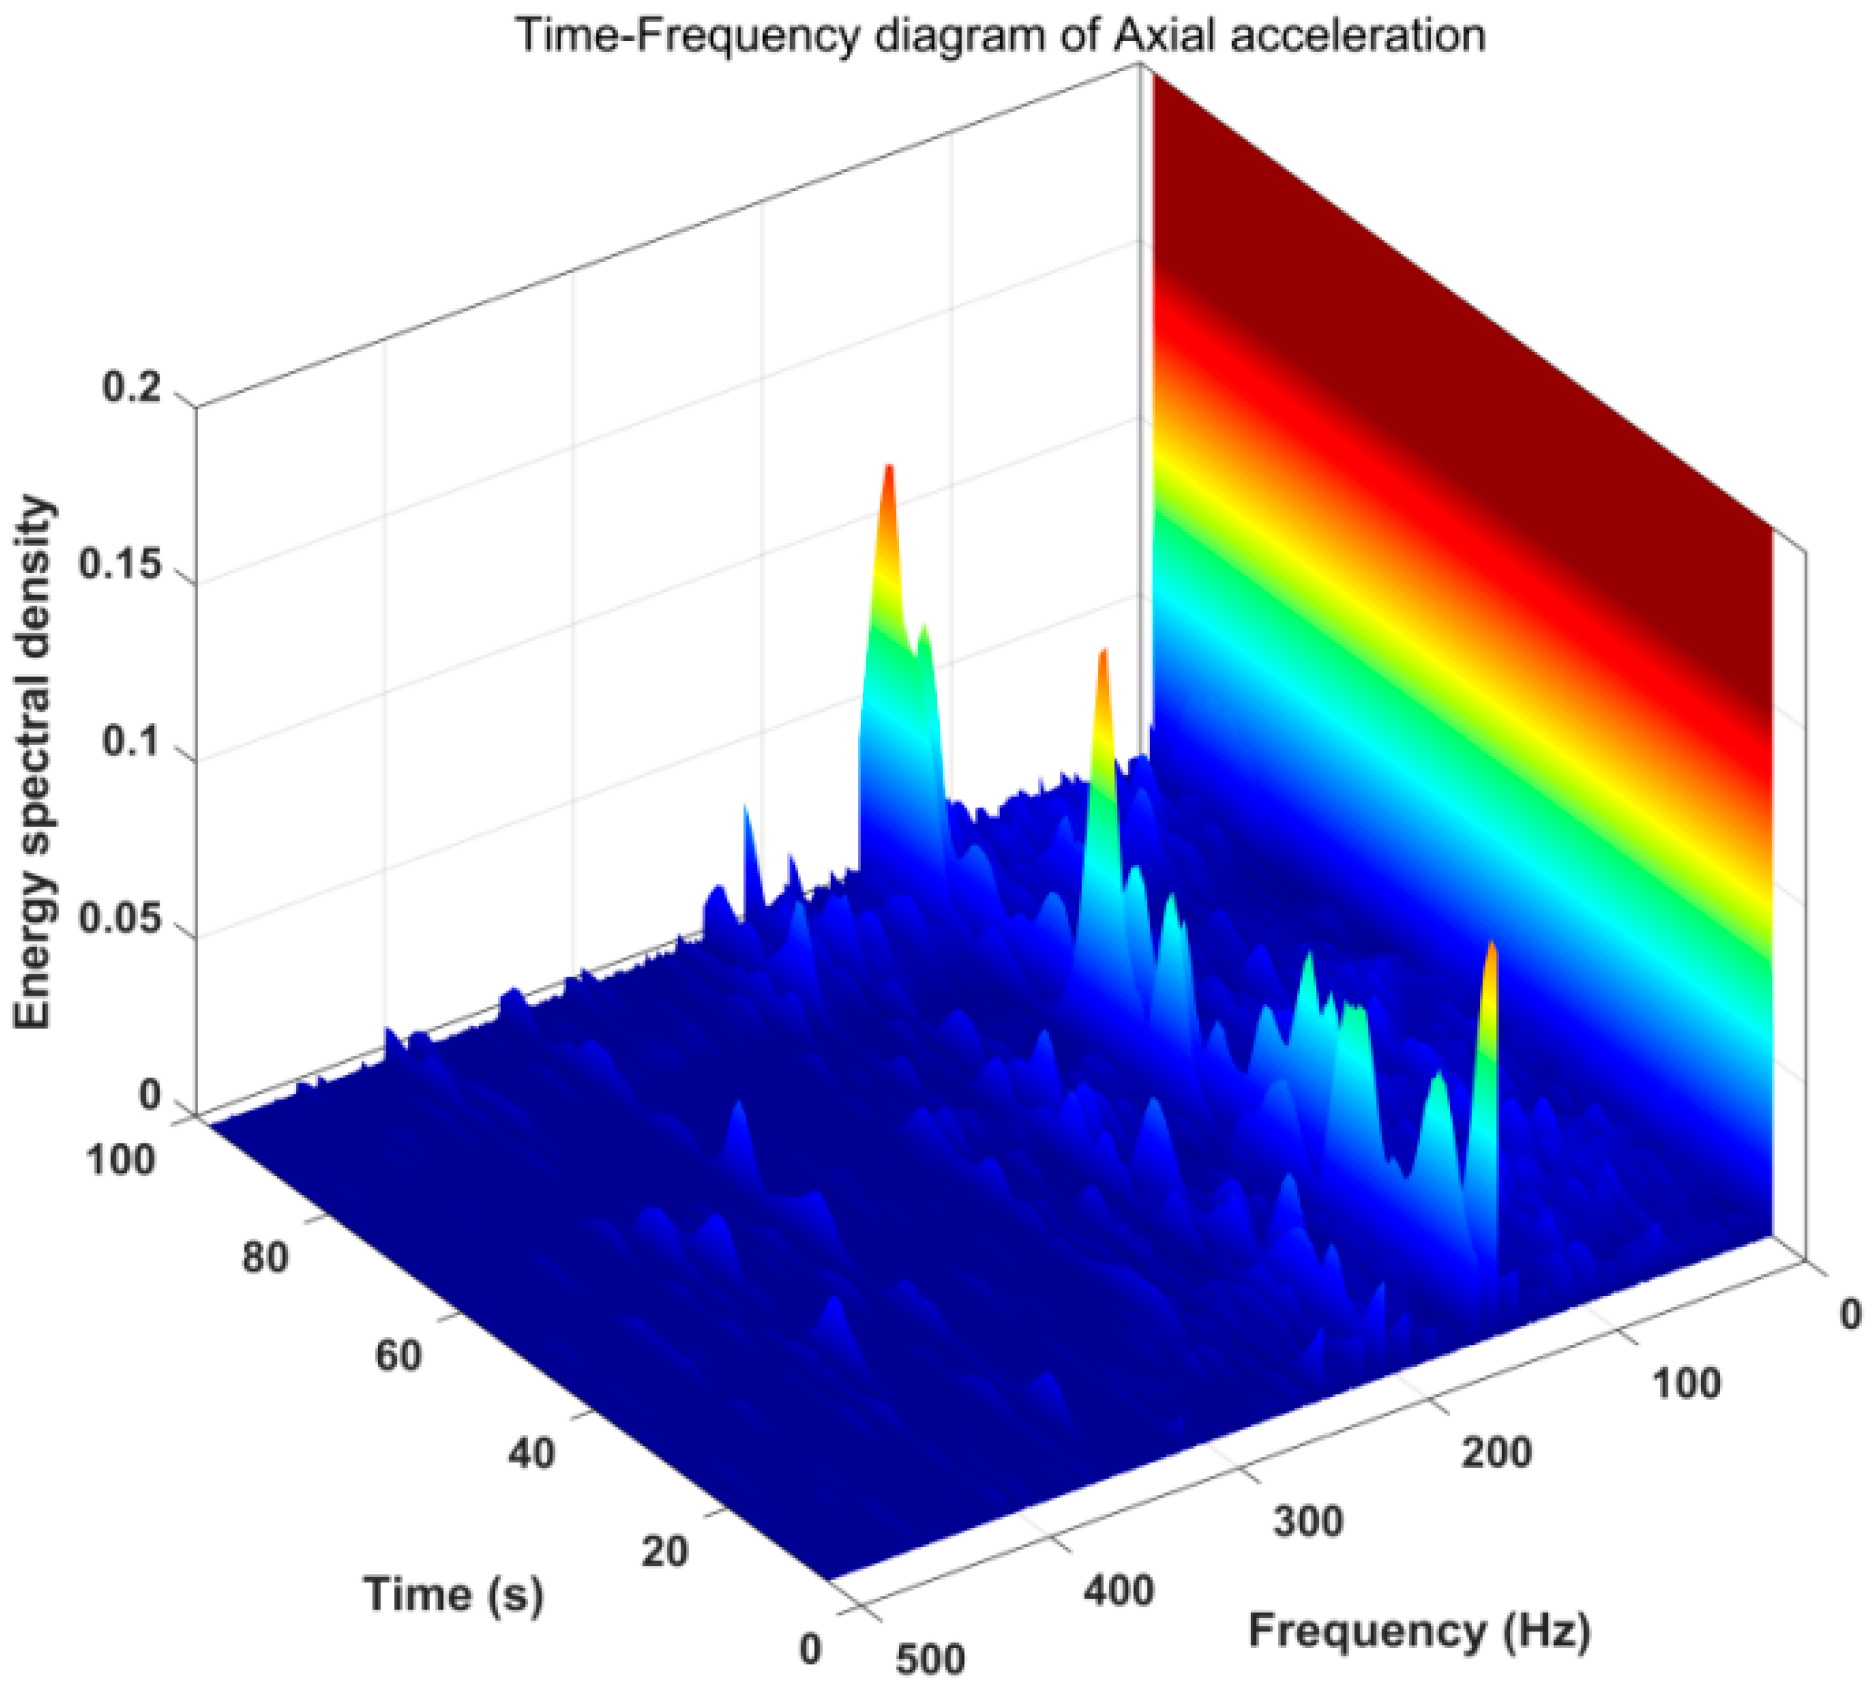
3.2. Frequency Analysis of Vibration Signal

By analyzing the time domain signal, the vibration pattern and intensity of the drill string can be intuitively judged, but the frequency information of the drill string vibration cannot be judged. Through the frequency spectrum analysis and time-frequency analysis of the vibration information, the vibration frequency information of the drill string can be understood in more detail.
The frequency analysis of the drill string vibration signal mainly uses two methods, fast Fourier transform (FFT) and short-time Fourier transform (STFT) [36,37]. Fast Fourier transform can analyze each frequency component in drill string vibration, and short-time Fourier transform can clarify the change law of each frequency with time.
Fast Fourier Transform (FFT) is a signal-processing method proposed on the basis of Discrete Fourier Transform (DFT). For a signal sequence of length L , the form expressed by FFT is:
X L ( n ) = { X L 2 e ( n ) + W L n X L 2 o ( n ) X L 2 e ( n L ) W L n L 2 X L 2 o ( n L 2 ) n = 0 , 1 , L 2 1 n = L 2 , , L 1
where X L is the determined result with N data points after DFT, X L 2 e is the DFT result of the even-numbered branch with L 2 points, and X L 2 o is the DFT result of the odd-numbered branch with L 2 points. Through Fast Fourier Transform (FFT), you can intuitively recognize the frequency distribution of the drill string vibration signal and the energy of each main frequency.
The short-time Fourier transform (DFT) is a time-frequency analysis method. This method uses a sliding time window to stage a signal so that it can be approximated as a short-term stable signal in this time window. The time-stationary signal undergoes Fourier transform to obtain the time-frequency distribution characteristics of this signal. The short-time Fourier transform is expressed as:
F S T F T ( t , f ) = + x ( t ) [ g ( t τ ) e j 2 π f   t ] d t
where x ( t ) is the time domain signal, g ( t τ ) is the window function, f is the frequency, and F S T F T ( t , f ) is the transformed time-frequency signal. In the short-time Fourier transform process, the longer the time window, the better the frequency resolution and the worse the time resolution. Once the window function is determined, it means that the resolution of the STFT is also determined and unchanged; so, the selection of the window function must take into account the resolution of time and frequency.

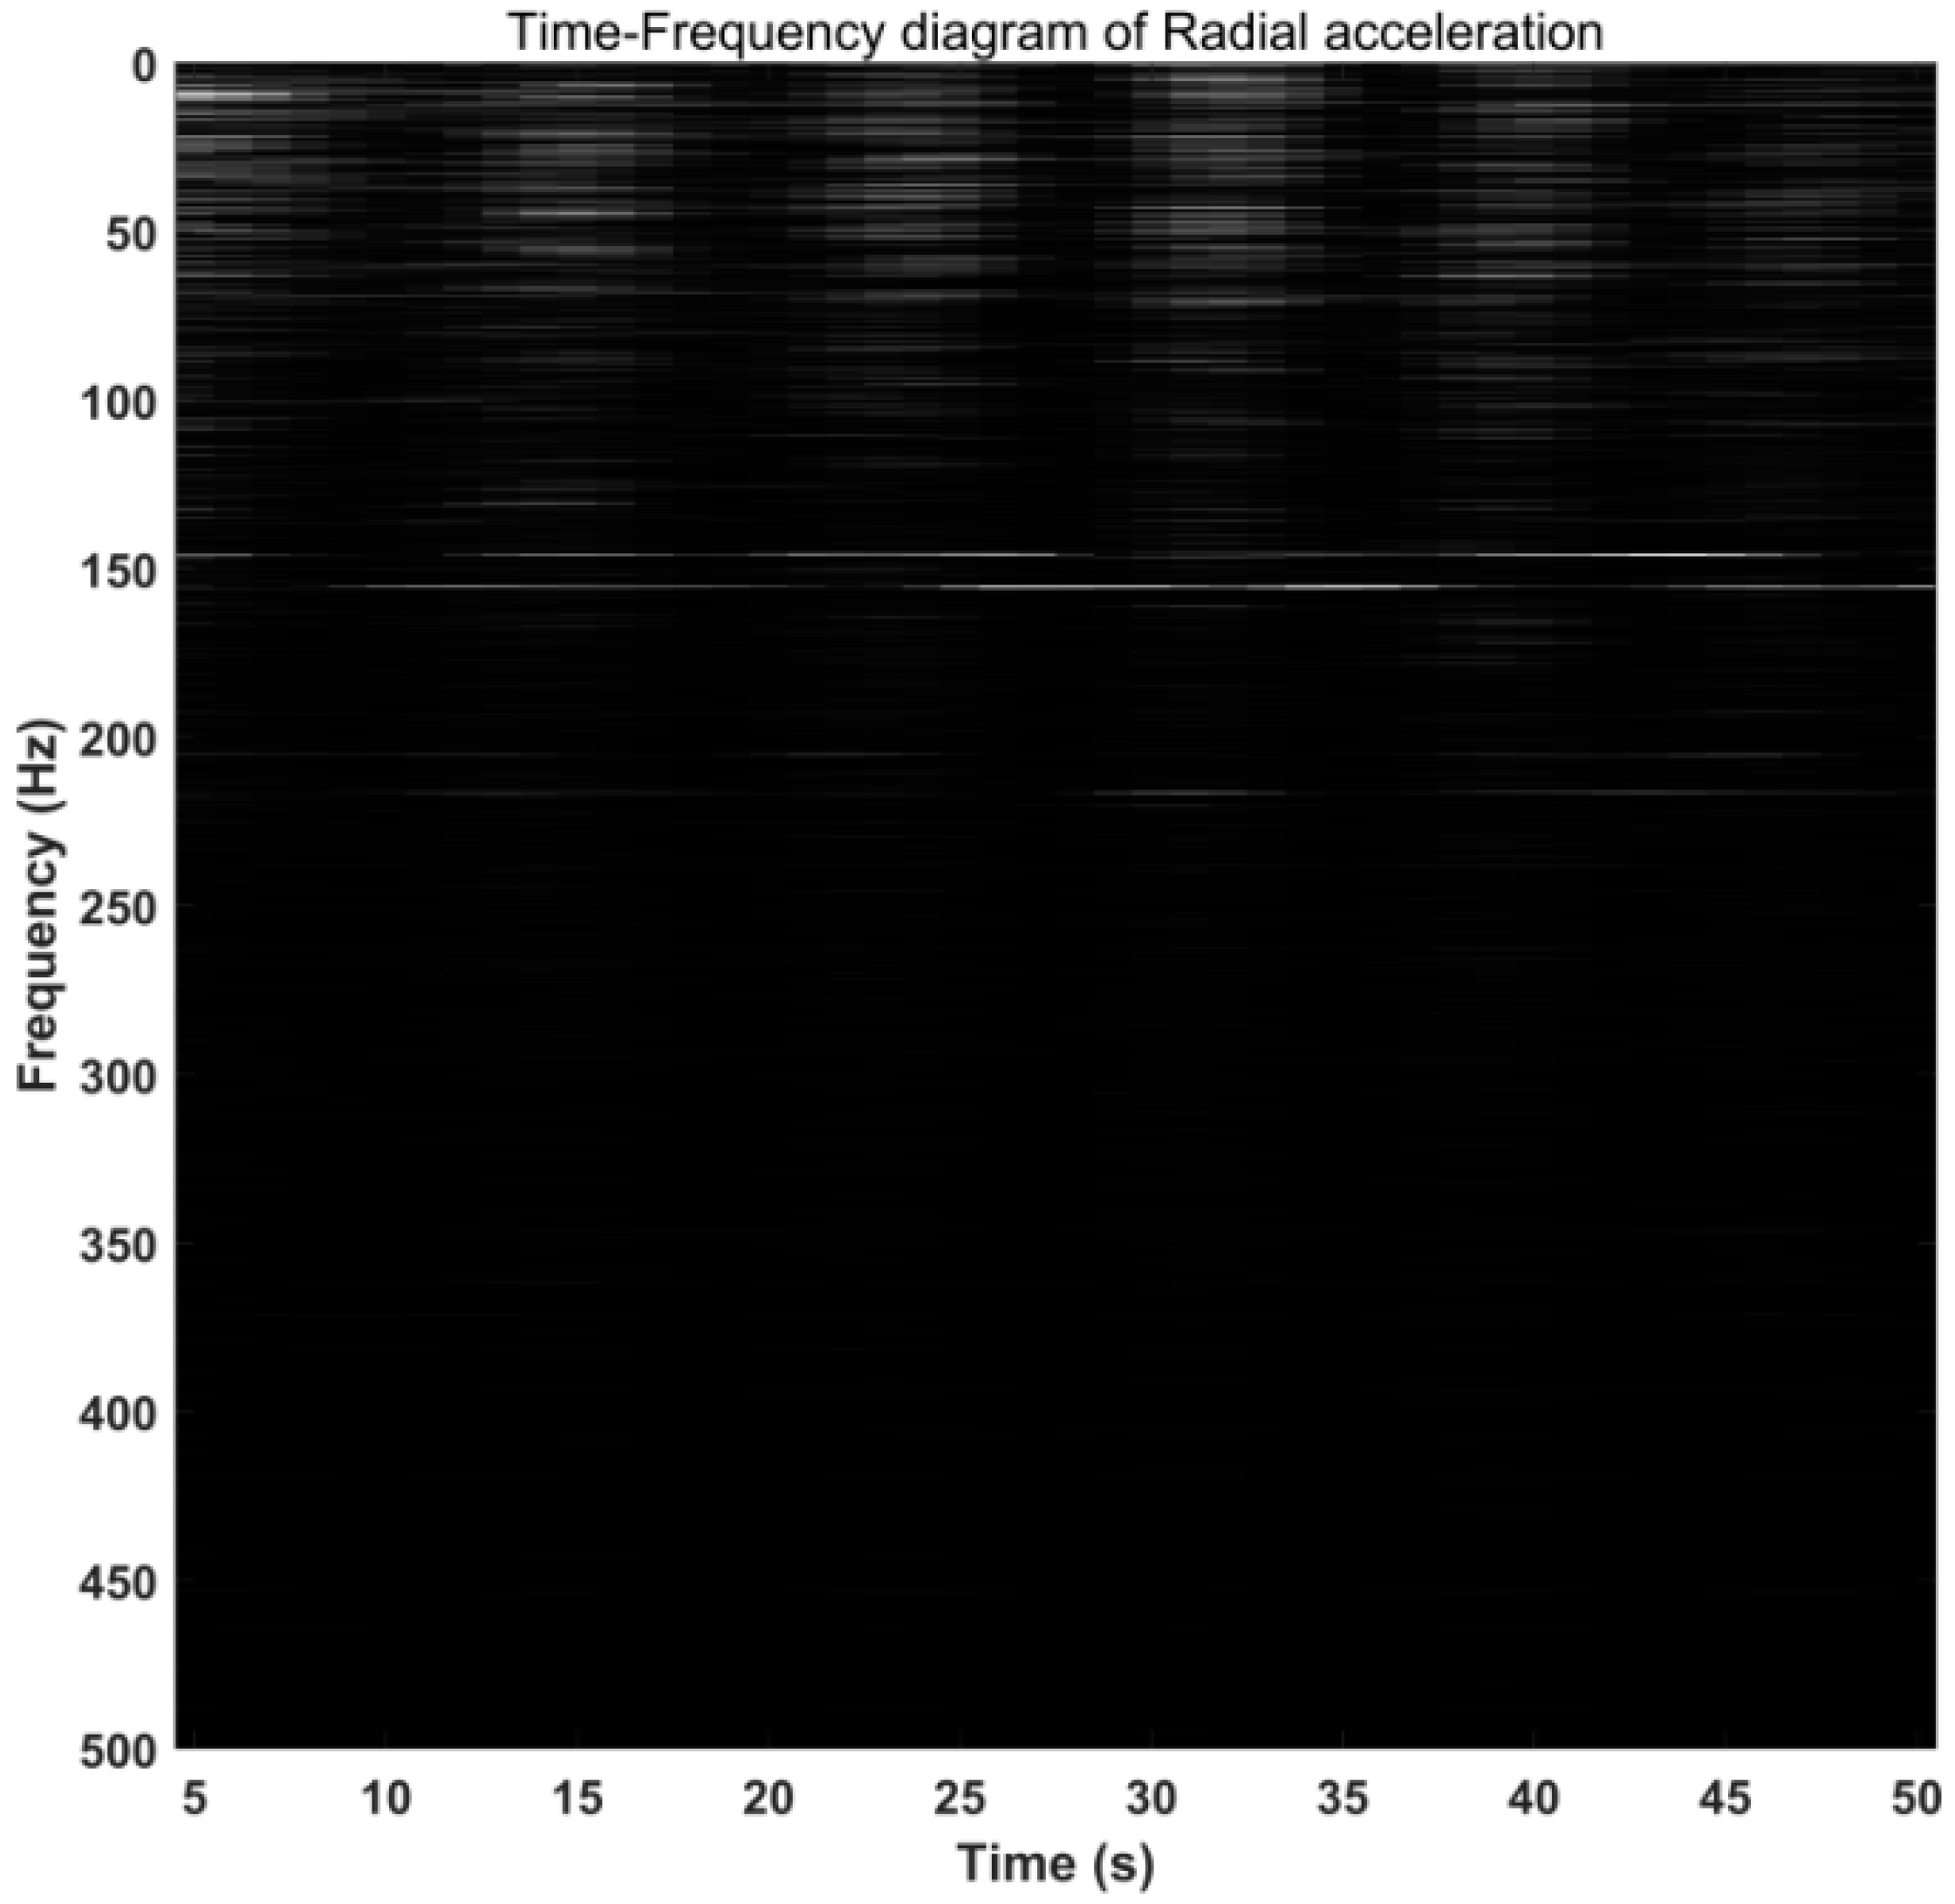
3.2.1. Stick-Slip Vibration
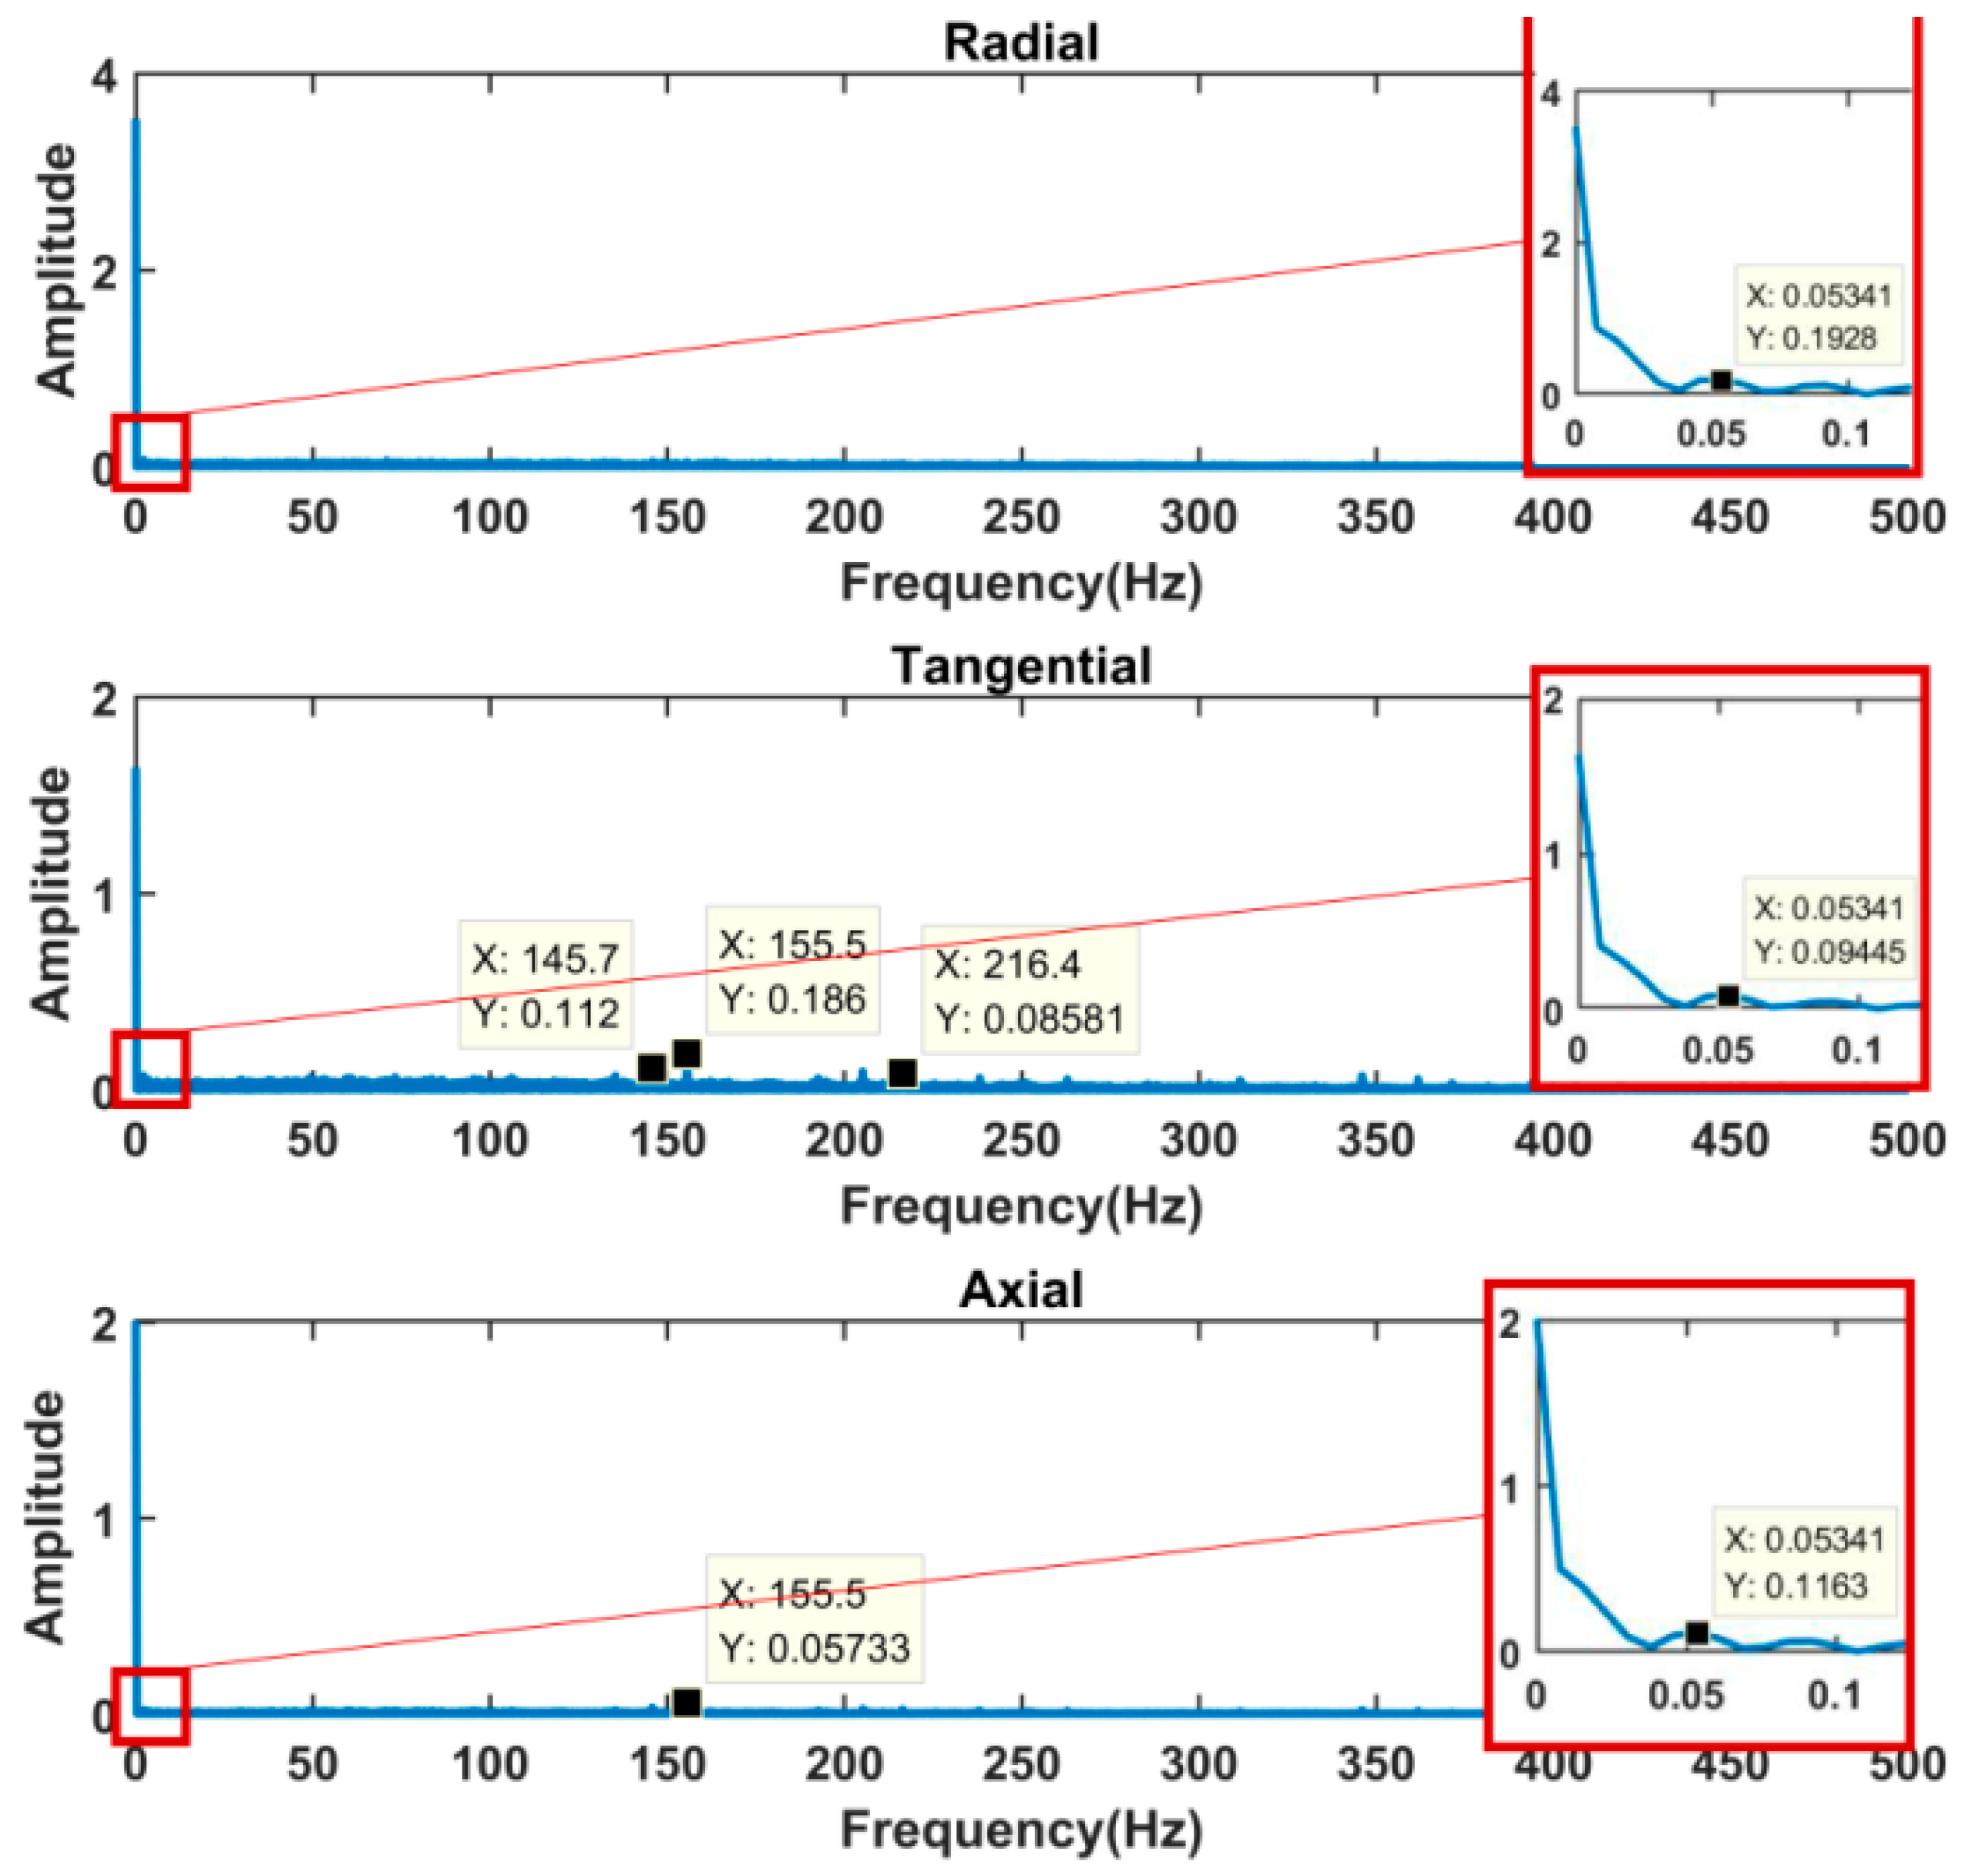
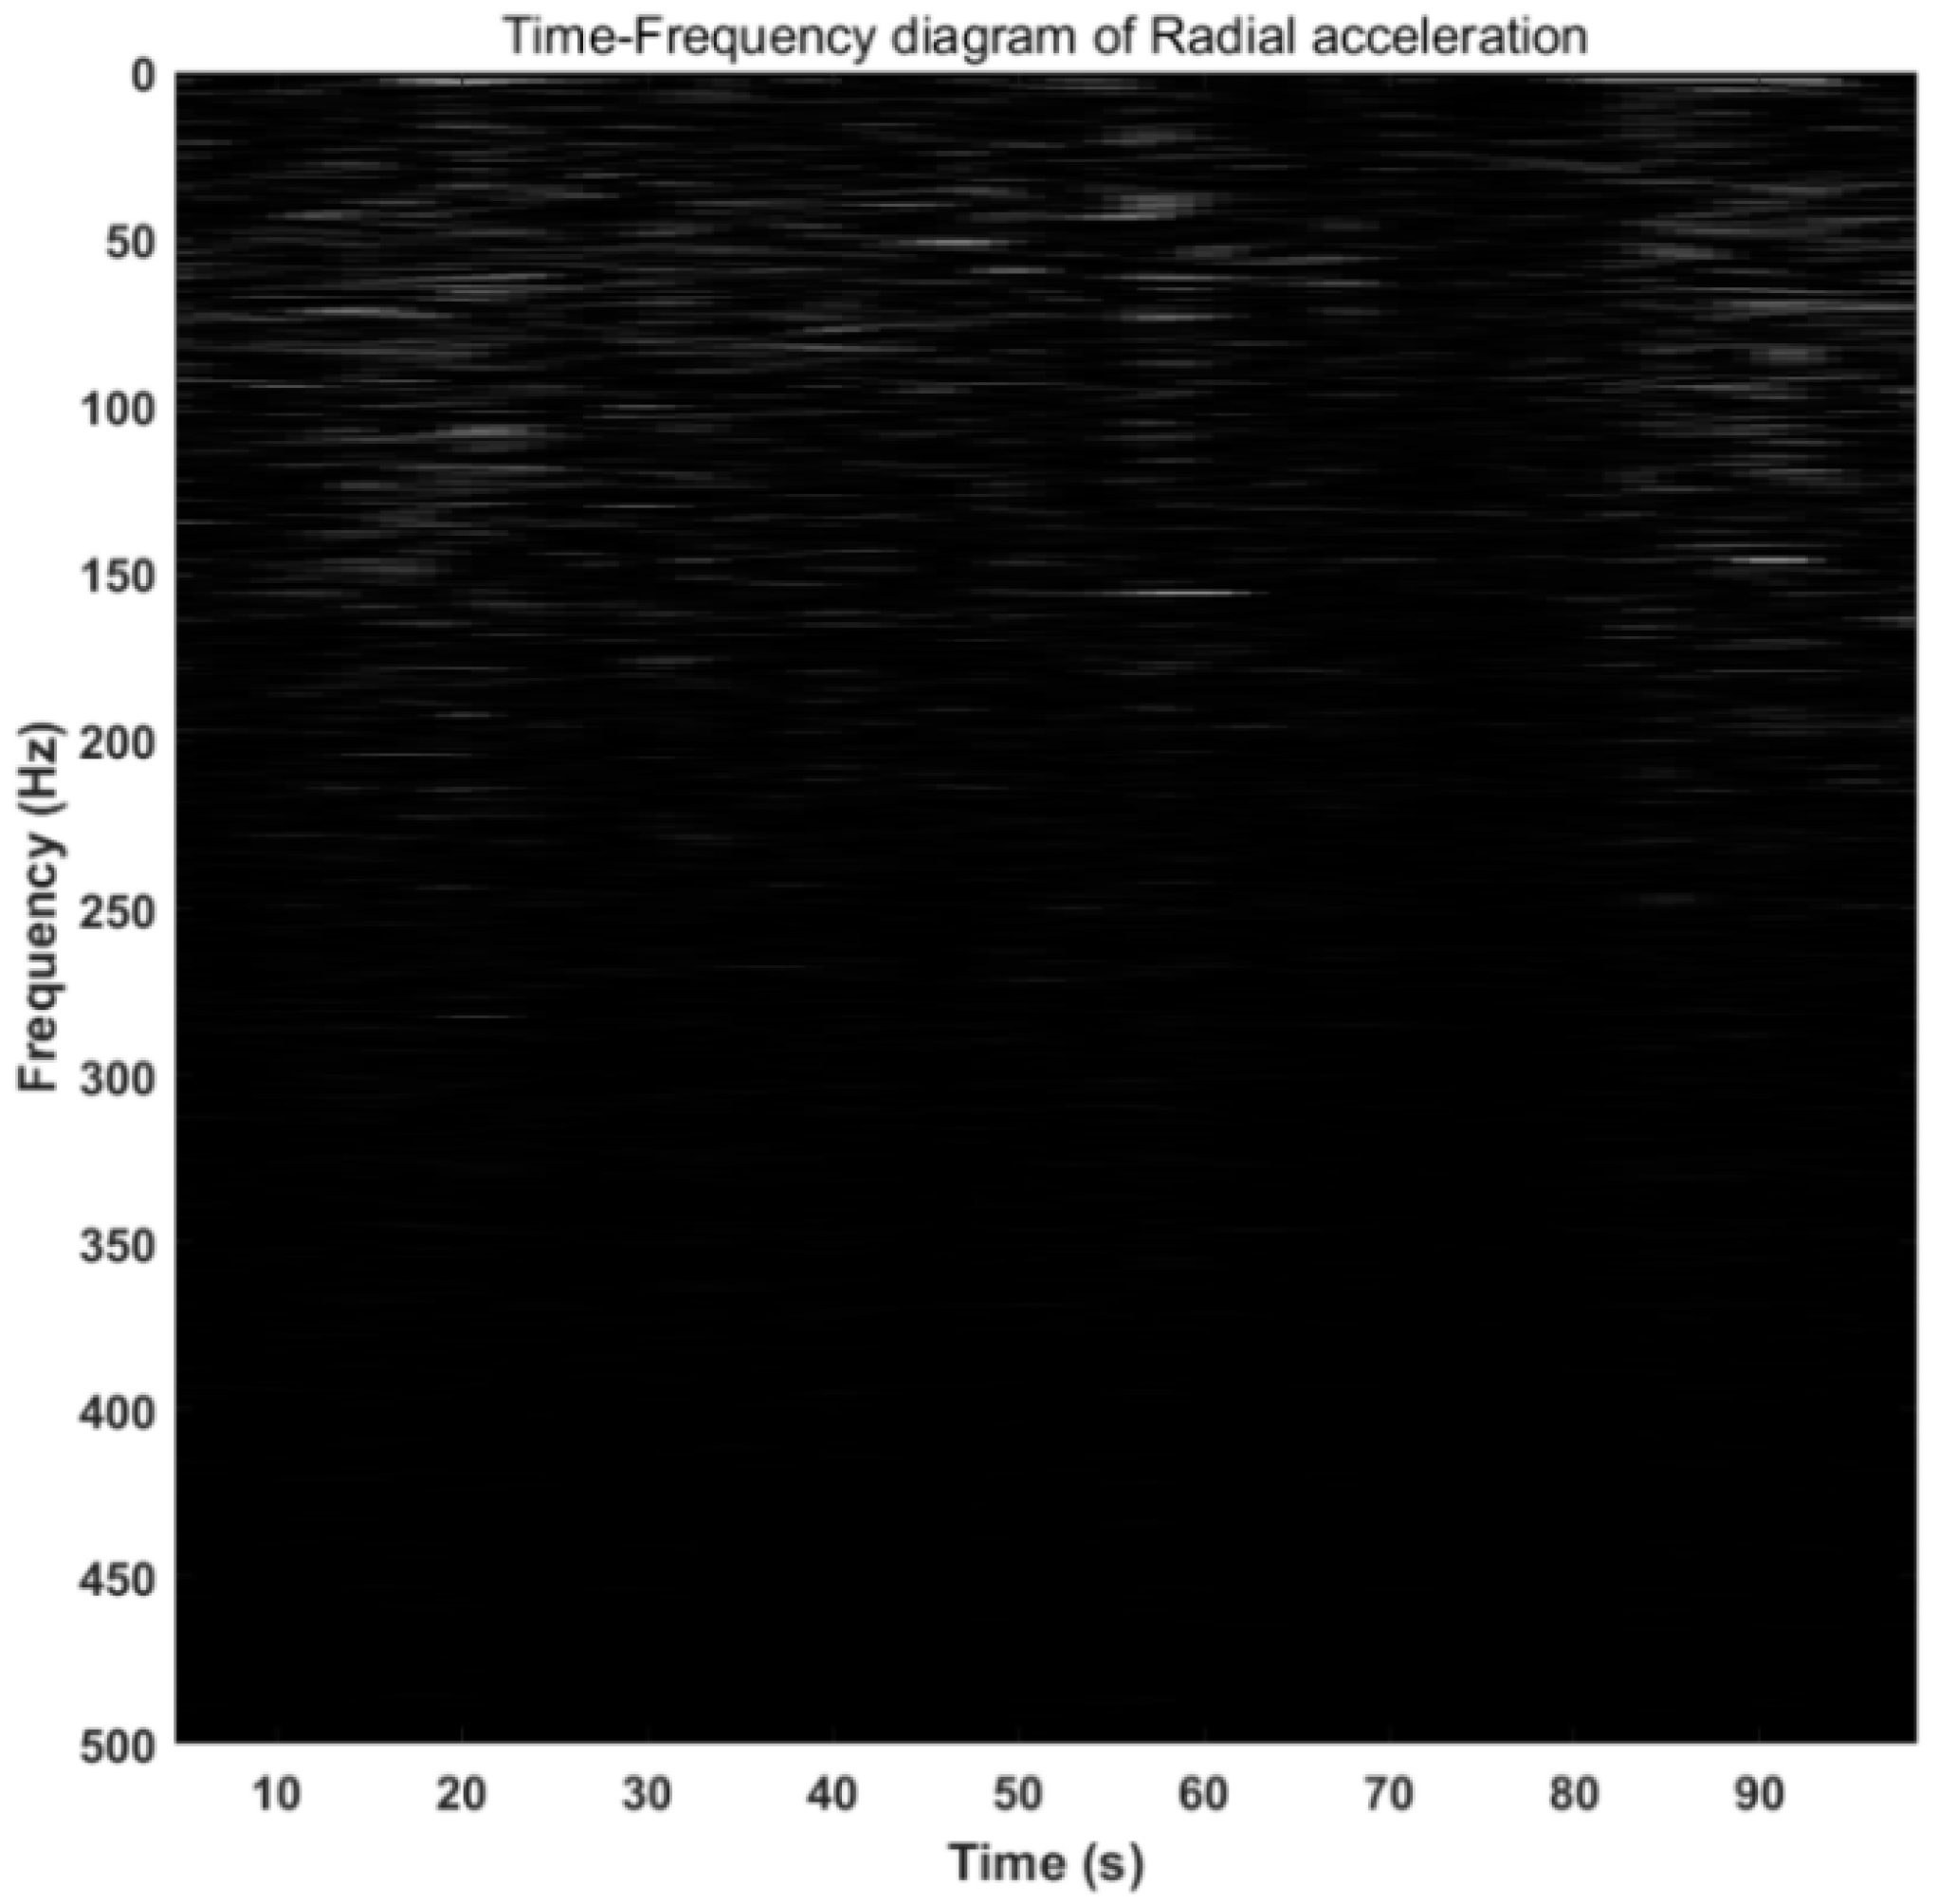
As shown in Figure 10, the frequency spectrum can be obtained by analyzing the measured stick-slip vibration signal using the fast Fourier (FFT) method. It can be seen from Figure 10 that the variety of signals with different frequencies of the radial acceleration is the largest, followed by the tangential acceleration, and the axial acceleration spectrum is the most single. In the frequency spectrum of radial acceleration and tangential acceleration, peaks appeared at 145.9 Hz, 155.6 Hz, and 216.5 Hz, indicating that the drill string had coupled vibration at these frequencies. In the frequency spectrum of 0~1 Hz in Figure 10, the main frequency components of the three-axis vibration acceleration are all at 0.1221 Hz, which is roughly equal to the vibration period of 10 s of stick-slip vibration. The 0.3967 Hz that appeared in the radial acceleration is about the triple frequency of 0.1221 Hz. In Figure 10, the main frequency amplitude of radial acceleration is the largest, and the main frequency amplitudes of tangential acceleration and axial acceleration are similar and both are smaller than radial acceleration. It shows that the centripetal acceleration caused by the change of the rotational speed in the stick-slip vibration had a significant influence on the radial acceleration. It further shows that in stick-slip vibration, the energy of torsional vibration is greater than lateral vibration and axial vibration.
The short-time Fourier method (STFT) is used to analyze the signal of stick-slip vibration, as shown in Figure 11, Figure 12, Figure 13 and Figure 14, and the relationship between time and frequency in the analysis signal is analyzed.
It can be seen in Figure 11 and Figure 12 that the two frequencies of 145.9 Hz and 155.6 Hz in the radial acceleration always exist in this segment of the signal. The light and dark lines in Figure 11 indicate the appearance and disappearance of each frequency, which can intuitively reflect the periodic appearance of other frequencies below 200 Hz, and the period of each appearance and disappearance is about 10 s. This also shows that the period of stick-slip vibration is 10 s. The time-frequency diagram of the tangential acceleration in Figure 13 shows that the two frequencies of 145.9 Hz and 155.6 Hz also always exist in this segment of the signal, and there are also high-frequency signals higher than 200 Hz. The regularity of other frequencies is weaker than that of radial acceleration, which also shows that radial acceleration is more sensitive to the occurrence of stick-slip vibration. In Figure 14, the two main frequencies of 145.9 Hz and 155.6 Hz also appear in axial vibration, and there are very few frequencies in other frequency bands of axial vibration. This shows that the axial vibration is weak during the stick-slip vibration process.

3.2.2. Whirl

Field logging data indicated that the wall of the well was severely dropped in the igneous rock drilling process, indicating that the drill string may have laterally vibrated and collided with the wall of the well. When the lateral vibration and torsional vibration of the downhole drill string are coupled, the motion state of the drill string changes to whirl. Whirl is a motion in which the drill string undergoes both revolution and rotation. The time-frequency analysis of the whirl vibration signal in Figure 6 was performed.
Figure 15 is a spectrum diagram of the whirl time-domain signal drawn by the fast Fourier method (FFT). The amplitude of the three-axis acceleration was not high, but the frequency of the tangential acceleration spectrum was relatively rich. In addition, both tangential acceleration and axial acceleration had a dominant frequency of 155.5 Hz, while the dominant frequency of 155.5 Hz in radial acceleration was not obvious. It can be seen from the frequency spectrum that the lateral vibration occurring in the movement of the drill string was very likely to have coupled vibration with the axial vibration. We extracted the frequency between 0~0.5 Hz in the spectrum for analysis, as shown in Figure 15. All three-axis acceleration signals had a dominant frequency of 0.05341 Hz, which is very likely to be related to the natural frequency of the drilling tool.
Figure 16, Figure 17, Figure 18 and Figure 19 are time-frequency diagrams obtained by analyzing the whirl signal using short-time Fourier transform (DFT). It can be seen from Figure 16 and Figure 17 that the radial acceleration frequency distribution of the drill string presented a disorderly shape in a short period of time. Additionally, the frequency was basically below 200 Hz. However, in the entire time interval, the energy spectrum density changed with a period of slightly less than 20 s. This cycle was also basically consistent with the main frequency of 0.05341 Hz in Figure 16. It can be seen from Figure 18 that the tangential acceleration frequency distribution was irregular, but the two main frequencies of 145.7 Hz and 155.5 Hz always existed, and there was a peak of energy spectral density approximately every 20 s. As shown in Figure 16, the frequency distribution of the axial vibration acceleration signal was similar to that of the tangential acceleration signal. There is always a dominant frequency of 155.5 Hz, and the change law of the energy spectral density was similar to that of the tangential acceleration. To sum up, it can be seen that during the drilling of igneous rock, the drill string motion whirled and it was accompanied by slight axial vibration.

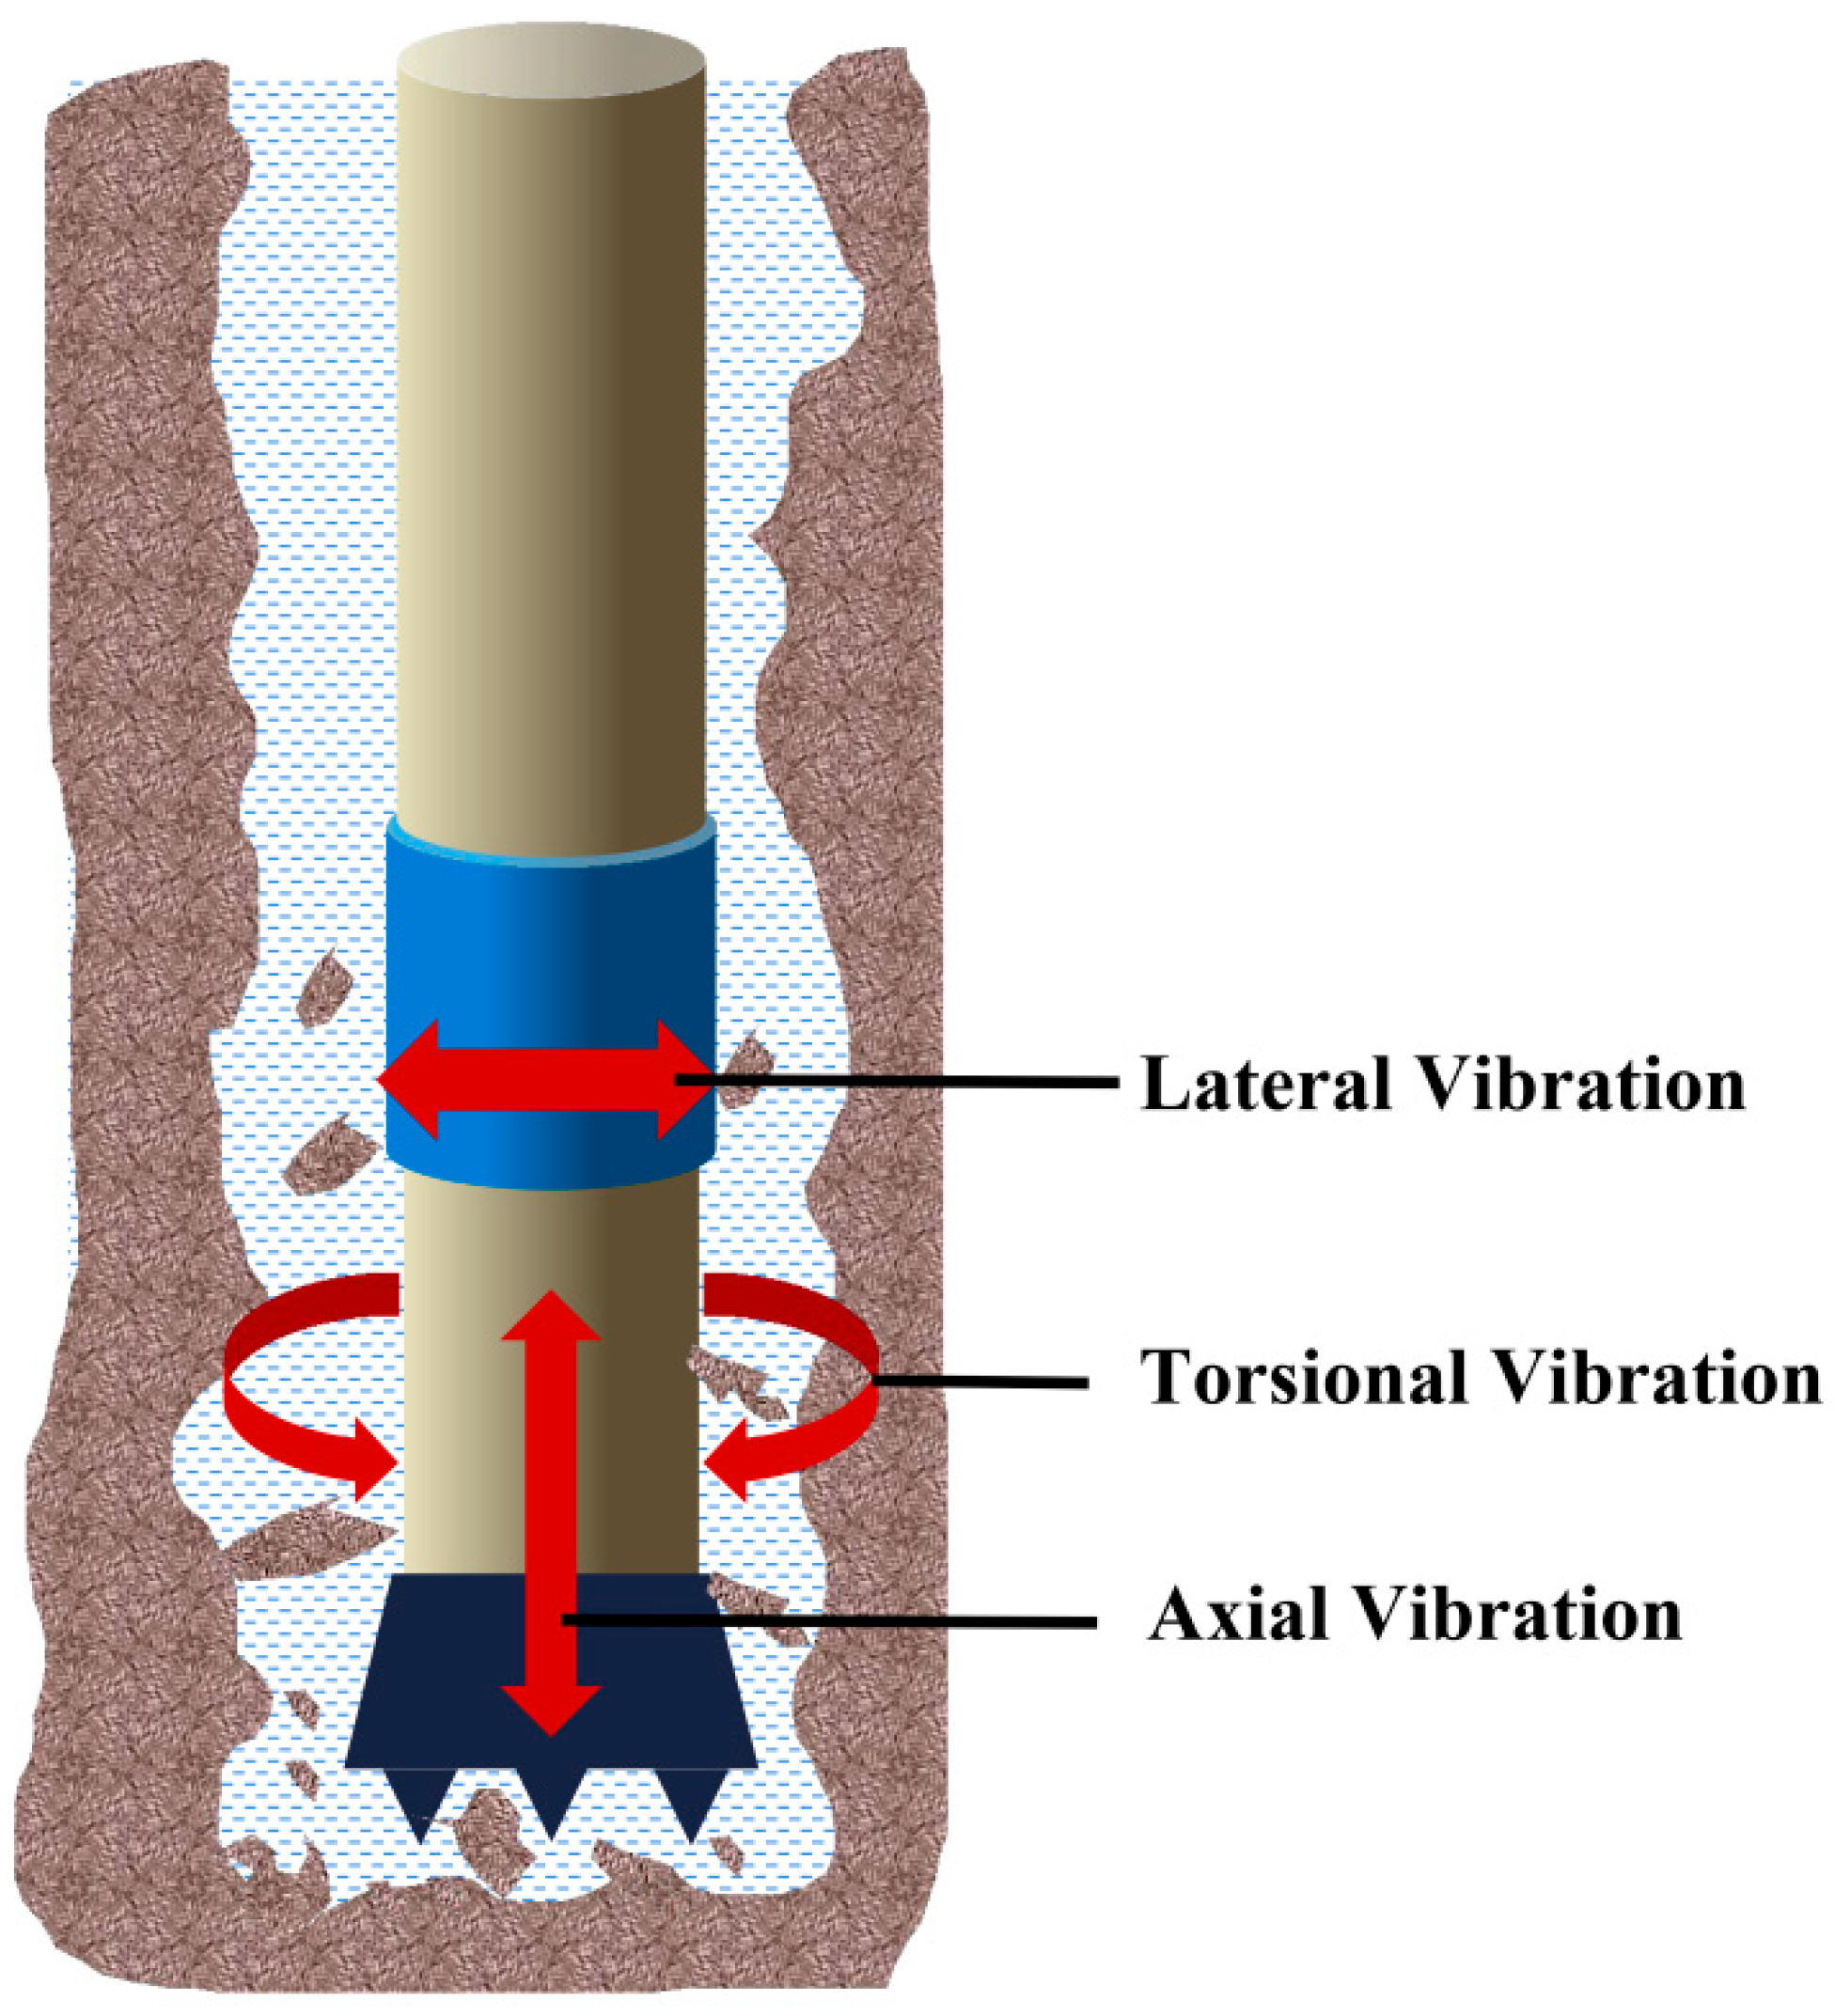
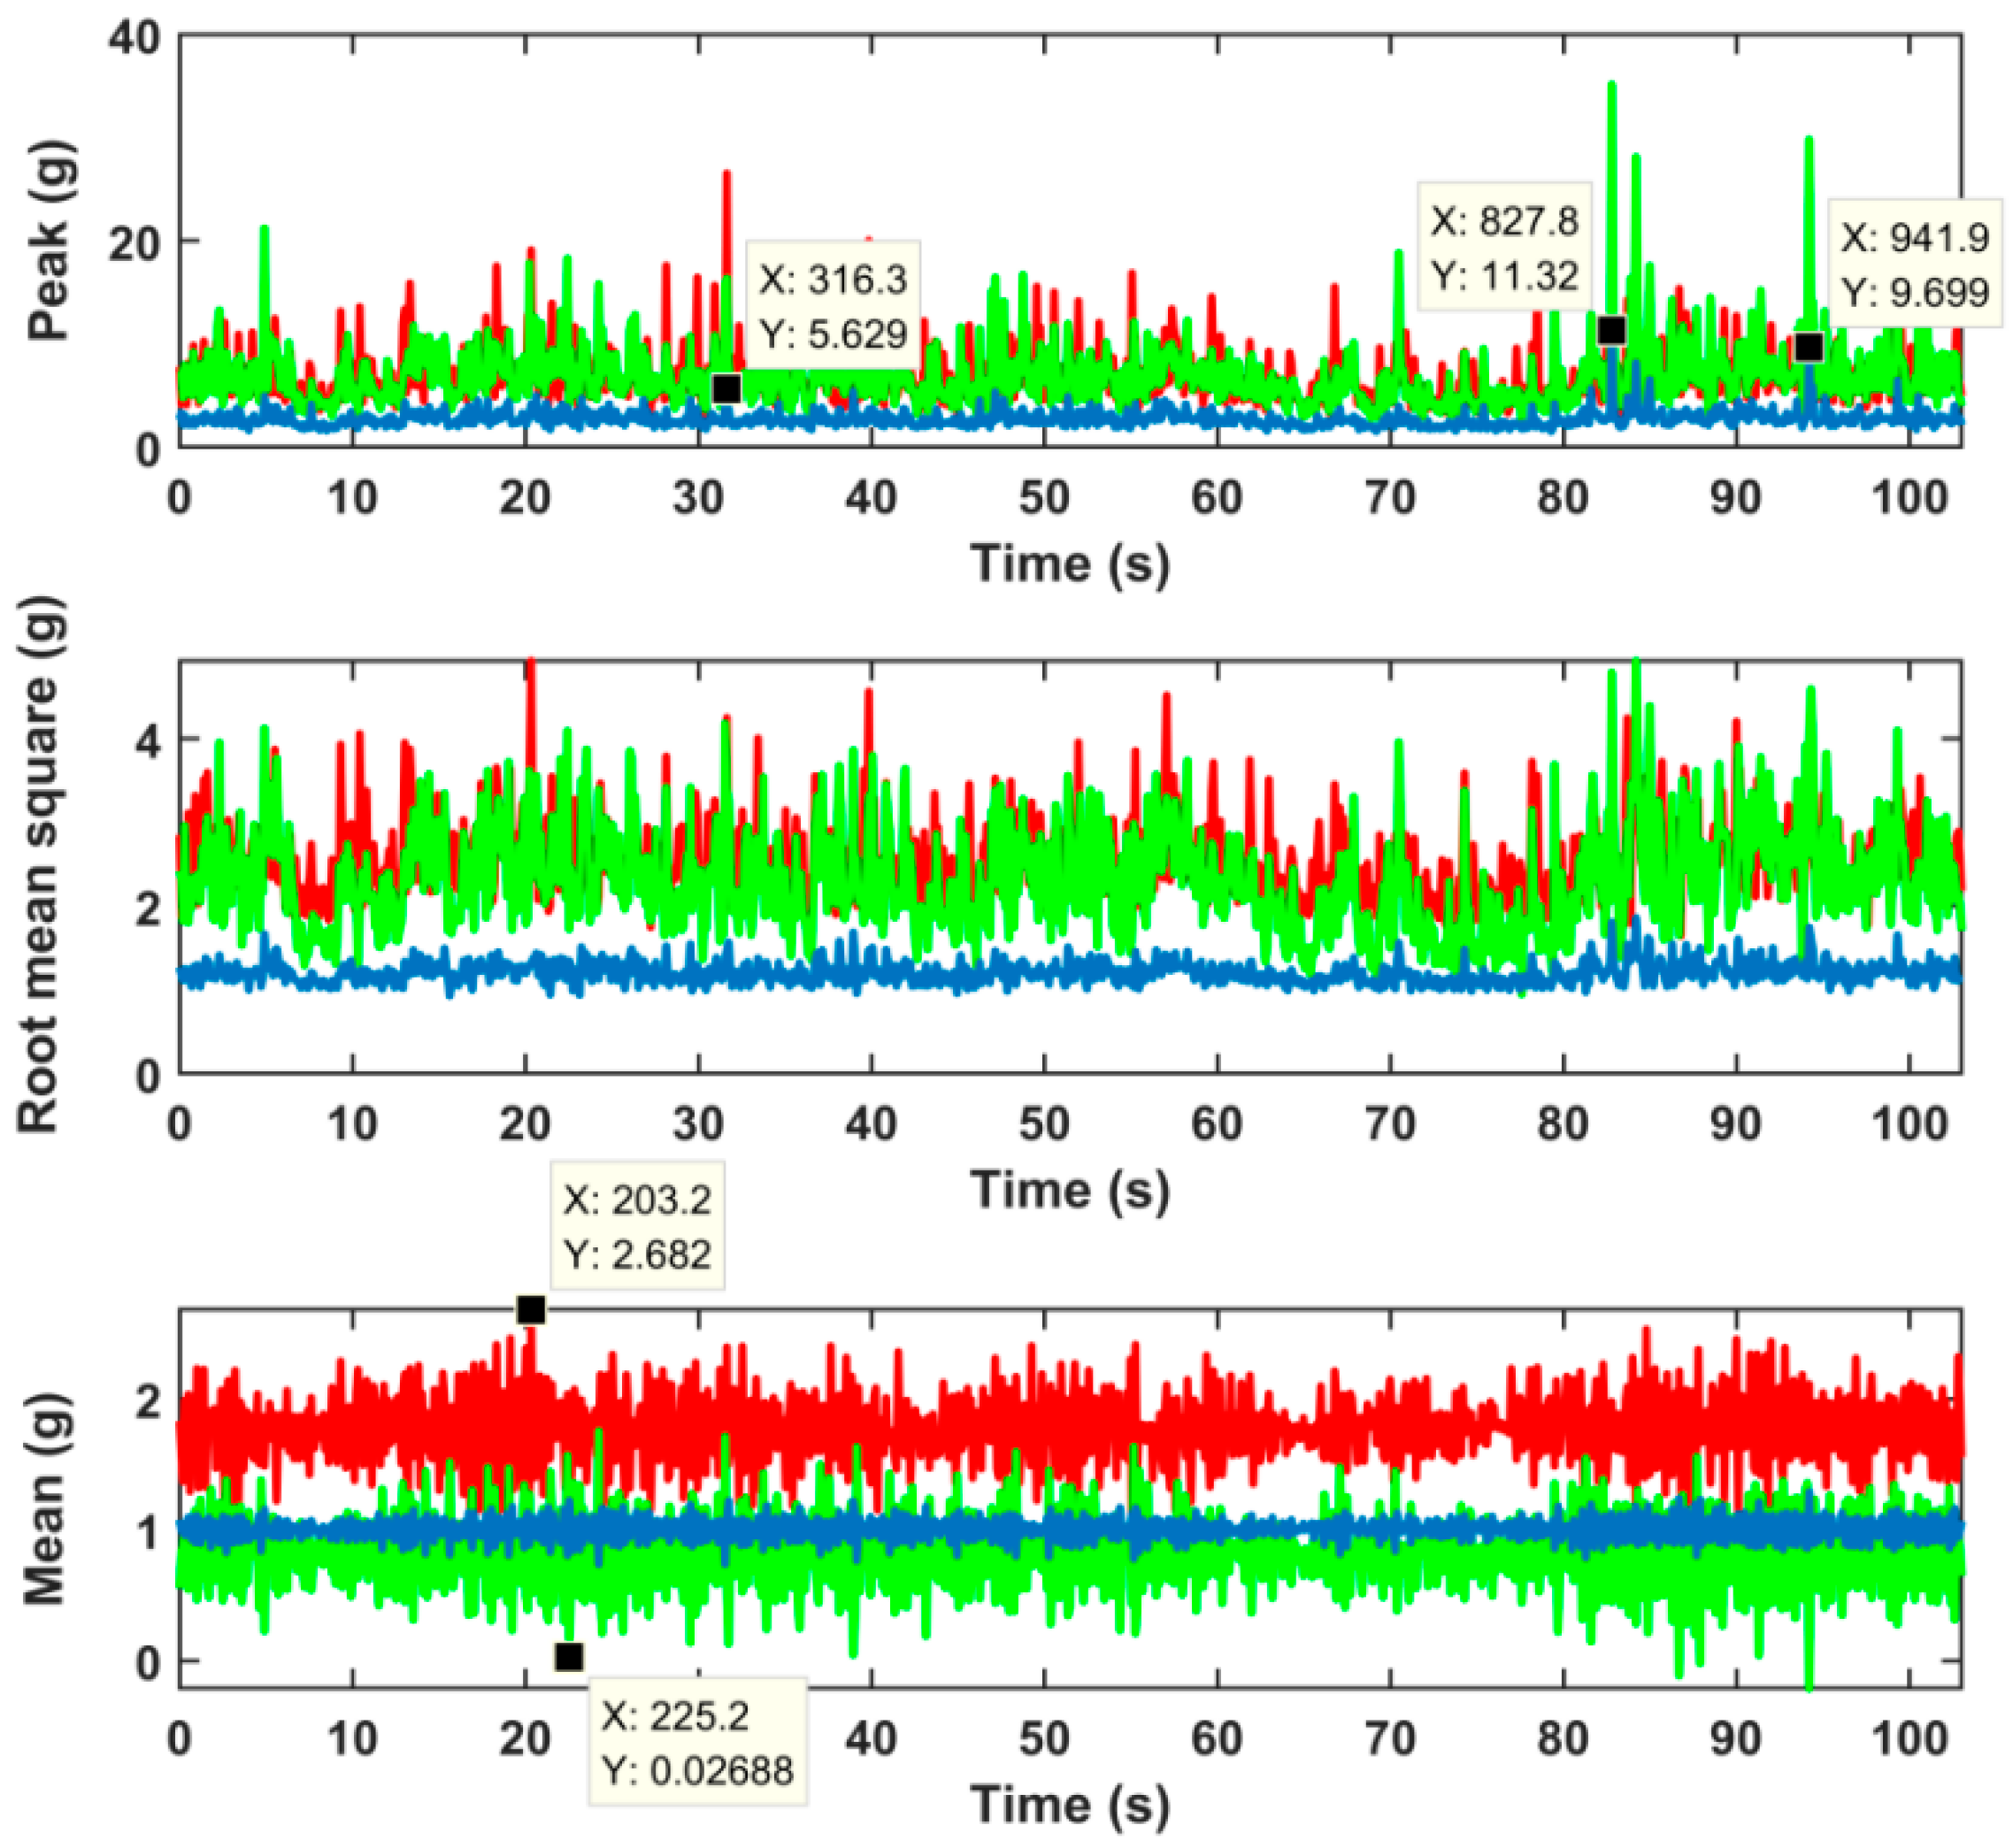
3.3. Vibration Characteristic Analysis

Through the analysis of the stick-slip motion and whirlpool during the drilling of the oil well igneous rock, it was found that during the 4700~4720-m drilling process, stick-slip vibration accounted for more than 60% of the total drilling time. The three-axis acceleration amplitude of stick-slip vibration was obviously smaller than the three-axis acceleration amplitude of vortex motion. The peak, root-mean-square, and mean curve of the stick-slip vibration acceleration signal showed regular changes, and the regularity of radial acceleration was particularly obvious. During the 4740~4750-m drilling process, whirl accounted for about 50% of the total drilling time.
Through the time-frequency analysis of the signal (Table 6), it was found that the frequencies that play a major role in the occurrence of stick-slip vibration are 0.1221 Hz, 145.9 Hz, and 155.9 Hz. Among them, 0.1221 Hz is consistent with the period of stick-slip vibration, and 0.3967 Hz is approximately three times the frequency of 1.221 Hz. When the flow of drilling fluid is stable, the impact frequency of the torsional impactor is 50 Hz. Additionally, 145.9 Hz and 155.9 Hz are close to the triple frequency of the torsional impactor. The remaining high-frequency signals are most likely to be the coupling vibration frequency of the torsional impactor and the jar or the coupling vibration frequency of the drill bit and the jar 0.05341 Hz plays a major role in the occurrence of whirl, and this frequency is close to the whirl period. The effects of 145.9 Hz and 155.9 Hz were weaker than 0.05341 Hz, and the two main frequencies of 145.9 Hz and 155.9 Hz did not appear in the radial acceleration during the whirl. It shows that these two main frequencies are the frequencies of the coupled vibration due to the torsional impactor and the cutting action of the drill bit. Three frequencies of 216.5 Hz, 361.7 Hz, and 391.8 Hz appeared in both vibration patterns. Except that 216.5 Hz is close to the quadruple frequency of torsion impactor, the other two frequencies are the coupled vibration frequency of the jar and the torsional impactor.
Through the above analysis, it was found that the occurrence of downhole harmful vibration is not only related to the formation conditions but also related to the use of speed-up tools in the drill tool assembly. The occurrence of a large number of stick-slips and whirls in igneous rock drilling in this article is very likely to be related to the simultaneous use of jars and torsional impactors. The jar and the torsional impactor can generate axial vibration and torsional vibration, respectively. In the 4740~4750-m drilling of igneous rocks, the WOB changed greatly (Table 4). It is very likely that the downhole drilling tool was in a repeated ‘bend-straighten’ state, creating conditions for the drill string to vibrate laterally. In addition, the torsional impactor can generate torsional vibration, which makes whirl very easy to occur. However, the acceleration amplitude of each axis in the time-domain signal of stick-slip vibration was relatively small. It shows that the torsion impactor can help the drill string get out of the ‘sticky’ state, reduce speed fluctuations, and thereby reduce stick-slip vibration. In summary, in the process of igneous rock drilling in this well, not only proper drilling parameters must be selected, but also downhole speed-increasing tools must be reasonably used.

4. Conclusions

(1) The article analysis results show that the stick-slip vibration can be qualitatively judged by the wave packets appearing regularly in the measured three-axis acceleration signal. And the period of the stick-slip vibration can be determined by the time length of the wave packet ‘appearing-disappearing’ process. Radial acceleration is more sensitive to the change of speed in stick-slip vibration, while tangential acceleration can more intuitively indicate lateral vibration.
(2) Time-frequency analysis of the stick-slip vibration acceleration signal shows that 0.1221 Hz corresponds to the period of stick-slip vibration. Additionally, from the amplitude corresponding to 0.1221 Hz, it can be seen that radial acceleration can more intuitively represent stick-slip vibration than tangential acceleration.
(3) We analyzed the vortex acceleration signal. When whirl occurred, the lateral vibration and torsional vibration of the drill string were of equal severity. The mean value of radial acceleration and tangential acceleration were quite different: 0.05341 Hz is the frequency of whirl, which approximately matches the period of whirl 19 s.
(4) Through time-frequency analysis of the three-axis acceleration signal of drill string vibration, it was found that the occurrence of torsional vibration and whirl in igneous rock drilling is very likely to be related to the use of torsional vibration impactor and jar in the drill tool assembly. It is recommended not to use torsional vibration impactor and jar at the same time in actual drilling.

Author Contributions

Writing—original draft preparation, Y.L.; investigation, J.W.; visualization, Y.S. and C.W.; supervision, Y.H. All authors have read and agreed to the published version of the manuscript.

Funding

The author(s) disclosed receipt of the following financial support for the research, authorship, and/or publication of this article: This work was supported by Natural Science Foundation of China (42072341), National Key R&D Program of China (2016YFE0202200), Basic research fund of Chinese Academy of Geological Sciences (JYYWF20180501), Fundamental Research Funds for the Central Universities (2-9-2018-096).

Institutional Review Board Statement

Not applicable.

Informed Consent Statement

Not applicable.

Data Availability Statement

The study did not report any data.

Conflicts of Interest

The authors declare that they have no conflict of interest.

References

  1. Close, D.A.; Owens, S.C.; MacPherson, J.D. Measurement of BHA vibration using MWD. In Proceedings of the IADC/SPE Drilling Conference, Dallas, TX, USA, 28 February–2 March 1988. [Google Scholar]
  2. Moharrami, M.J.; Hodjat, S. Fatigue Reliability Assessment of Drill String Due to Stick-Slip Vibrations and Wave-Frequency Vessel Motions. In Proceedings of the 31st International Ocean and Polar Engineering Conference, Rhodes, Greece, 20–25 June 2021. [Google Scholar]
  3. Brett, F.J.; Warren, T.M.; Behr, S.M. Bit whirl: A new theory of PDC bit failure. In Proceedings of the SPE Annual Technical Conference and Exhibition, San Antonio, TX, USA, 8–11 October 1989. [Google Scholar]
  4. Dufeyte, M.P.; Henneuse, H. Detection and monitoring of the slip-stick motion: Field experiments. In Proceedings of the SPE/IADC Drilling Conference, Amsterdam, The Netherlands, 11–14 March 1991. [Google Scholar]
  5. Kyllingstad, A.; Halsey, G.W.J. A study of slip/stick motion of the bit. SPE Drill. Eng. 1988, 3, 369–373. [Google Scholar] [CrossRef]
  6. Mitchell, R.F.; Allen, M.B. Case studies of BHA vibration failure. In Proceedings of the SPE Annual Technical Conference and Exhibition, Dallas, TX, USA, 27–30 September 1987. [Google Scholar]
  7. Allen, M.B. BHA lateral vibrations: Case studies and evaluation of important parameters. In Proceedings of the SPE/IADC Drilling Conference, New Orleans, LA, USA, 15–18 March 1987. [Google Scholar]
  8. Ertas, D.; Bailey, J.R.; Wang, L.; Pastusek, P.E. Drillstring mechanics model for surveillance, root cause analysis, and mitigation of torsional vibrations. SPE Drill. Completion 2014, 29, 405–417. [Google Scholar] [CrossRef]
  9. Ghasemloonia, A.; Rideout, D.G.; Butt, S.D. A review of drillstring vibration modeling and suppression methods. J. Pet. Sci. Eng. 2015, 131, 150–164. [Google Scholar] [CrossRef]
  10. Arjun Patil, P.; Teodoriu, C. Model development of torsional drillstring and investigating parametrically the stick-slips influencing factors. J. Energy Resour. Technol. 2013, 135, 013103. [Google Scholar] [CrossRef]
  11. Bailey, J.R.; Biediger, E.; Gupta, V.; Ertas, D.; Elks, W.C.; Dupriest, F.E. Drilling vibrations modeling and field validation. In Proceedings of the IADC/SPE Drilling Conference, Orlando, FL, USA, 4–6 March 2008. [Google Scholar]
  12. Shor, R.J.; Pryor, M.; van Oort, E. Drillstring vibration observation, modeling and prevention in the oil and gas industry. In Proceedings of the Dynamic Systems and Control Conference, San Antonio, TX, USA, 22–24 October 2014. [Google Scholar]
  13. Zannoni, S.A.; Cheatham, C.A.; Chen, C.K.; Golla, C.A. Development and field testing of a new downhole MWD drillstring dynamics sensor. In Proceedings of the SPE Annual Technical Conference and Exhibition, Houston, TX, USA, 3–6 October 1993. [Google Scholar]
  14. Han, G.; Lemesany, L.; Azizov, A.A.; DeLeon, F. Bottomhole Assembly Result Analysis to Improve Drilling Performance in Pinedale Field, Wyoming, USA. In Proceedings of the SPE Unconventional Resources Conference Canada, Calgary, AB, Canada, 5–7 November 2013. [Google Scholar]
  15. Al Sairafi, F.A.; Al Ajmi, K.E.; Yigit, A.S.; Christoforou, A.P. Modeling and control of stick slip and bit bounce in oil well drill strings. In Proceedings of the SPE/IADC Middle East Drilling Technology Conference and Exhibition, Abu Dhabi, United Arab Emirates, 26–28 January 2016. [Google Scholar]
  16. Burgess, T.M.; McDaniel, G.L.; Das, P.K. Improving BHA tool reliability with drillstring vibration models: Field experience and limitations. In Proceedings of the SPE/IADC Drilling Conference, New Orleans, LA, USA, 15–18 March 1987. [Google Scholar]
  17. Shen, Y.; Chen, W.; Zhang, Z.; Bowler, A.; Jeffryes, B.; Chen, Z.; Carrasquilla, M.N.; Smith, D.; Skoff, G.; Panayirci, H.M. Drilling Dynamics Model to Mitigate High Frequency Torsional Oscillation. In Proceedings of the IADC/SPE International Drilling Conference and Exhibition, Galveston, TX, USA, 3–5 March 2020. [Google Scholar]
  18. Xue, Q.; Leung, H.; Huang, L.; Zhang, R.; Liu, B.; Wang, J.; Li, L. Modeling of torsional oscillation of drillstring dynamics. Nonlinear Dyn. 2019, 96, 267–283. [Google Scholar] [CrossRef]
  19. Zhao, D.; Hovda, S.; Sangesland, S. Whirl simulation of drill collar and estimation of cumulative fatigue damage on drill-collar connection. SPE J. 2018, 23, 286–300. [Google Scholar] [CrossRef]
  20. Wu, S.X.; Paez, L.; Partin, U.; Agnihotri, M. Decoupling stick-slip and whirl to achieve breakthrough in drilling performance. In Proceedings of the IADC/SPE Drilling Conference and Exhibition, New Orleans, LA, USA, 2–4 February 2010. [Google Scholar]
  21. Yigit, A.S.; Christoforou, A.P. Coupled axial and transverse vibrations of oilwell drillstrings. J. Sound Vib. 1996, 195, 617–627. [Google Scholar] [CrossRef]
  22. Yigit, A.S.; Christoforou, A.P. Coupled torsional and bending vibrations of drillstrings subject to impact with friction. J. Sound Vib. 1998, 215, 167–181. [Google Scholar] [CrossRef]
  23. Mitchell, R.F. Forces on curved tubulars caused by fluid flow. SPE Prod. Facil. 1996, 11, 30–34. [Google Scholar] [CrossRef]
  24. Perneder, L.; Detournay, E.; Downton, G. Bit/rock interface laws in directional drilling. Int. J. Rock Mech. Min. Sci. 2012, 51, 81–90. [Google Scholar] [CrossRef]
  25. Schen, A.E.; Snell, A.D.; Stanes, B.H. Optimization of bit drilling performance using a new small vibration logging tool. In Proceedings of the SPE/IADC Drilling Conference, Amsterdam, The Netherlands, 23–25 February 2005. [Google Scholar]
  26. Field, D.J.; Swarbrick, A.J.; Haduch, G.A. Techniques for successful application of dynamic analysis in the prevention of field-induced vibration damage in MWD tools. In Proceedings of the SPE/IADC Drilling Conference, Amsterdam, The Netherlands, 22–25 February 1993. [Google Scholar]
  27. Wolf, S.F.; Zacksenhouse, M.; Arian, A. Field measurements of downhole drillstring vibrations. In Proceedings of the SPE Annual Technical Conference and Exhibition, Las Vegas, NV, USA, 22–26 September 1985. [Google Scholar]
  28. Macpherson, J.D.; Mason, J.S.; Kingman, J.E.E. Surface measurement and analysis of drillstring vibrations while drilling. In Proceedings of the SPE/IADC Drilling Conference, Amsterdam, The Netherlands, 22–25 February 1993. [Google Scholar]
  29. Akinniranye, G.; Weber, A.; Elsweisy, H.; Palacio, J.; Poedjono, B.; Goobie, R.B. Implementation of a shock and vibration mitigation process: Achieving real-time solutions and savings. In Proceedings of the SPE/IADC Middle East Drilling and Technology Conference, Cairo, Egypt, 22–24 October 2007. [Google Scholar]
  30. Ashley, D.K.; McNary, X.M.; Tomlinson, J.C. Extending BHA life with multi-axis vibration measurements. In Proceedings of the SPE/IADC Drilling Conference, Amsterdam, The Netherlands, 27 February–1 March 2001. [Google Scholar]
  31. Bowler, A.; Harmer, R.; Logesparan, L.; Sugiura, J.; Jeffryes, B.; Ignova, M. Continuous high-frequency measurements of the drilling process provide new insights into drilling-system response and transitions between vibration modes. SPE Drill. Completion 2016, 31, 106–118. [Google Scholar] [CrossRef]
  32. Cobern, M.E.; Wassell, M.E. Laboratory testing of an active drilling vibration monitoring & control system. In Proceedings of the AADE National Technical Conference & Exhibition, Houston, TX, USA, 5–7 April 2005. [Google Scholar]
  33. Cooley, J.W.; Tukey, J.W. An algorithm for the machine calculation of complex Fourier series. Math. Comput. 1965, 19, 297–301. [Google Scholar] [CrossRef]
  34. Jin, Z.D.; Neng, C.S.; Wang, Z.C.; Dong, L.; Chen, Y.Y. Vibration signal analysis and application of drill stem based on STFT. Coal Min. Technol. 2011, 16, 29–32. [Google Scholar]
  35. Warren, T.M.; Oster, J.H. Torsional resonance of drill collars with PDC bits in hard rock. In Proceedings of the SPE Annual Technical Conference and Exhibition, New Orleans, LA, USA, 27–30 September 1998. [Google Scholar]
  36. Park, Y.-C.; Jang, J.-G.; Kang, U. Fast Partial Fourier Transform. arXiv 2020, arXiv:2008.12559. [Google Scholar]
  37. Grcić, I.; Pandžić, H.; Novosel, D. Fault Detection in DC Microgrids Using Short-Time Fourier Transform. Energies 2021, 14, 277. [Google Scholar] [CrossRef]
Figure 1. Schematic diagram of installation of drilling tool assembly and vibration measuring equipment.
Applsci 11 11484 g001
Figure 2. Schematic diagram of field installation of vibration measuring equipment. (a), c represents the center of the drill string, S is an orthogonal three-axis acceleration sensor, A is the cross section of the column, r is the radius of the drill string, X measures the acceleration of drill string tangential vibration, Y measures the radial vibration acceleration of the drill string, and Z measures the axial vibration acceleration of the drill string. (b) shows the sensor installation method on site.
Applsci 11 11484 g002
Figure 3. Felid situation of vibration collection equipment.
Applsci 11 11484 g003
Figure 4. Schematic diagram of drill string vibration pattern.
Applsci 11 11484 g004
Figure 5. Timing chart of drilling signals intercepted from 4700 m to 4720 m.
Applsci 11 11484 g005
Figure 6. Timing chart of drilling signals intercepted from 4740 m to 4750 m.
Applsci 11 11484 g006
Figure 7. The peak value, root mean square value, and mean value curve of the time domain signal intercepted from the 4700~4720-m section according to a time window with a length of 100 signal points.
Applsci 11 11484 g007
Figure 8. The peak value, root mean square value, and mean value curve of the time domain signal intercepted from the 4740~4750-m section according to a time window with a length 100 of signal points.
Applsci 11 11484 g008
Figure 9. Schematic diagram of stick-slip and whirl.
Applsci 11 11484 g009
Figure 10. Three-axis acceleration frequency spectrum of stick-slip vibration.
Applsci 11 11484 g010
Figure 11. Time-frequency diagram of radial acceleration of stick-slip vibration.
Applsci 11 11484 g011
Figure 12. Radial time-frequency diagram of stick-slip vibration using light and shade to indicate the value of energy spectrum density.
Applsci 11 11484 g012
Figure 13. Time-frequency diagram of tangential acceleration of stick-slip vibration.
Applsci 11 11484 g013
Figure 14. Time-frequency diagram of axial acceleration of stick-slip vibration.
Applsci 11 11484 g014
Figure 15. Triaxial acceleration spectrum of whirl.
Applsci 11 11484 g015
Figure 16. Time-frequency diagram of radial acceleration of whirl.
Applsci 11 11484 g016
Figure 17. The time-frequency diagram of the radial acceleration of the whirl using light and shade to represent the energy spectrum density.
Applsci 11 11484 g017
Figure 18. Time-frequency diagram of tangential acceleration of whirl.
Applsci 11 11484 g018
Figure 19. Time-frequency diagram of axial acceleration of whirl.
Applsci 11 11484 g019
Table 1. Drill tool assembly size.
NumberNameLength (m)Diameter (in)
1DC188
2Vibration Impactor98
3DC998
4Vibration Measuring Equipment0.458
5DC308 × 1 + 9 × 2
6Torsion Impactor0.759.6
7PDC Bit-13
Note: The table only describes the main tool size in the drill tool assembly, which does not include the specific parameters of the adapter.
Table 2. Specific parameters of measuring equipment sensor.
NumberParameter TypeParameter
Acquisition frequency (Hz)0~5000
Range (g)−100~+100
Temperature range (°C)0~125
Battery life (h)100
Memory Capacity (GB)2
Table 3. Sensor acquisition parameters and field working conditions.
NameParameterNameParameter
Rock formationsDacite/BasaltWeight on bit (kN)50
Depth4565~5020 mTorque (kN·m)11.8
Acquisition
frequency (Hz)
1000Rotating speed (RPM)47
Fluid inlet
temperature (°C)
41Pump volume (SPM)140
Fluid outlet
temperature (°C)
52
Table 4. Drilling parameters of vibration data collection section.
Depth
(m)
WOB
(kN)
Rotating Speed
(RPM)
Torque
(kN·m)
Fluid Inlet
Temperature
(°C)
Fluid Outlet Temperature
(°C)
Pump Volume
(SPM)
4700~472030~6843~4911~144655150
4740~4750−1.3~8443~498~154452120
Table 5. Drill string vibration modes and criteria.
Vibration PatternVibration CharacteristicsCriterion
Stick-slipPeriodic ‘sticky-slippage’ of the drill stringThere are periodic fluctuations in the radial acceleration in the mean, root mean square, and peak curves, and the fluctuation period is roughly the same as the wave packet ‘appear-disappear-appear’ period in the time domain signal.
WhirlCoupling of lateral vibration and torsional vibrationThe mean value of radial acceleration is quite different from the mean value of tangential acceleration, and the mean value of tangential acceleration is not zero. The coincidence of the root mean square and peak curve is better.
Table 6. Feature frequency statistics when different vibration patterns occur.
Vibration PatternMain Frequency (Hz)
RadialTangentialAxial
Stick slip0.12210.12210.1221
0.3967
145.9145.9145.9
155.5155.5155.5
216.5216.5
361.7361.7
391.8
Whirl0.053410.053410.05341
145.9145.9
155.5155.5
216.5
361.7
391.8
Publisher’s Note: MDPI stays neutral with regard to jurisdictional claims in published maps and institutional affiliations.

