Article

Deep Learning-Based Community Detection Approach on Multimedia Social Networks

1
Information Technology and Electrical Engineering, University of Naples “Federico”, Via Claudio 21, 80125 Naples, Italy
2
CINI-ITEM National Lab, Via Cinzia, Complesso Universitario Montesantangelo, 80125 Naples, Italy
*
Author to whom correspondence should be addressed.
Appl. Sci. 2021, 11(23), 11447; https://doi.org/10.3390/app112311447
Submission received: 15 October 2021 / Revised: 19 November 2021 / Accepted: 22 November 2021 / Published: 2 December 2021
(This article belongs to the Special Issue Data Mining and Machine Learning in Multimedia Databases)

Abstract

:
Exploiting multimedia data to analyze social networks has recently become one the most challenging issues for Social Network Analysis (SNA), leading to defining Multimedia Social Networks (MSNs). In particular, these networks consider new ways of interaction and further relationships among users to support various SNA tasks: influence analysis, expert finding, community identification, item recommendation, and so on. In this paper, we present a hypergraph-based data model to represent all the different types of relationships among users within an MSN, often mediated by multimedia data. In particular, by considering only user-to-user paths that exploit particular hyperarcs and relevant to a given application, we were able to transform the initial hypergraph into a proper adjacency matrix, where each element represents the strength of the link between two users. This matrix was then computed in a novel way through a Convolutional Neural Network (CNN), suitably modified to handle high data sparsity, in order to generate communities among users. Several experiments on standard datasets showed the effectiveness of the proposed methodology compared to other approaches in the literature.

1. Introduction

With the widespread diffusion of Online Social Networks (OSNs) and more and more powerful mobile devices in recent years, multimedia data have become the most natural means of reporting events, witnessing facts, and sharing user experiences or life moments. Facebook, TikTok, and Instagram are certainly the most striking examples of this phenomenon.
Thanks to the massive sharing of multimedia material (in particular, images and videos), users of social networks now prefer to interact and communicate by posting multimedia information and commenting on, or in general interacting with, the content.
Thus, a series of nondirected ties can be created among people who share the same interests or passions, mainly through the interaction with multimedia content. In other terms, the post of an image or video on one of these social networks can trigger an enormous amount of reactions among users, even if they do not know each other directly.
The exploitation of multimedia data to analyze social networks has resulted in Multimedia Social Networks (MSNs), which support new ways of user-to-user and user-to-content interaction [1,2].
This fact represents a greedy opportunity for Social Network Analysis (SNA), whose goal is to infer useful knowledge from social communities to support various tasks: influence analysis, expert finding, community detection, item recommendation, and so on. Indeed, it is well known that modern influencers publish photos and videos on social networks to condition the behavior of other users, often for marketing or political purposes.
SNA could therefore exploit the relationships that are generated between users who in some way interact with the same multimedia data to discover possible affinities. In addition, the similarity between two multimedia objects could create further useful implicit links among users. As an example, if in a given social network, two users often comment on the photos of sunsets published by a third user, then it could be deduced that: (i) the two users are fascinated by landscapes with sunsets; (ii) the third user could have a certain influence on the first two. If the posted photos are very similar to those published by another user, even the latter could somehow have interests similar to the first three, and more generally, all users could belong to the same community.
In MSNs, due to their continuous growth, it is increasingly complicated to identify communities, jointly considering global information about network interactions and local information about users. From the perspective of connectedness and density, communities are known as locally dense connected subgraphs or clusters of nodes, and in addition to the internal cohesion of subgraphs, their separation from each other should also be taken into account. More recent approaches leverage deep-learning models, often with embedding techniques, to accomplish the task, but several problems remain in their application due to several features of MSNs (e.g., hierarchical structure, unknown communities, network heterogeneity, signed information on edges, community embedding, networks dynamic, etc.) [3].
In this paper, to overcome the above issues, we propose an alternative approach. First of all, to capture and represent all the different kinds of relationships among users, often mediated by multimedia objects, we propose an extension of the hypergraph-based data model, which some of the authors have recently introduced in previous work [4]. Then, only by considering user-to-user paths that exploit particular hyperarcs and are relevant for a given application, we were able to transform the initial hypergraph into a proper adjacency matrix in which each element represents the strength of tie between two users, taking into account the inherent complexity of graph relationships. Each bond considers both direct user-to-user relationships and nondirected links that are generated through user-to-content and content-to-content relationships. This matrix is then computed in a novel way through a neural convolutional network, properly modified to manage the high sparseness of the data, in order to generate communities among the users within an MSN.
Summarizing, the novelty introduced by our work is twofold: on the one hand, the use of a hypergraph-based model to represent in a very effective manner the complex, dynamic, and heterogeneous information within an MSN and to efficiently extract the relevant user-to user paths useful directly transforming the graph into an adjacency matrix, avoiding embedding methods, which can cause the loss of information; on the other hand, the introduction of a semi-supervised approach for community detection using convolutional neural networks to deal with high-dimensional adjacency matrices, which are not suitable as the input to the classical CNN, since they classify images with significantly smaller input matrices.
The paper is organized as follows. Section 2 gives the related work concerning social network modeling and community detection issues. Section 3 describes the proposed methodology for MSN analysis, by detailing the hypergraph-based model and the adopted community detection solution. Section 4 reports the experimental results of our community detection w.r.t. other approaches and standard datasets. Finally, Section 5 discusses some conclusions and future work.

2. Related Works

In the last decade, the growth and complexity of social networks have brought new opportunities and, at the same time, new issues related to their modeling and analysis. In the following, we report the main approaches in the literature for modeling OSNs with the related multimedia information w.r.t. the supported SNA tasks and for discovering communities in such environments.

2.1. Social Network Modeling

The first proposal for modeling an OSN considers only users and their interactions. Exploiting this model, different approaches have been proposed with respect to particular applications, such as lurker identification [5,6], influence analysis [7,8], and expert finding [9,10]. However, these approaches do not consider the contribution made by multimedia content. To this end, more complex models have been proposed for social information networks, which can be classified into four categories, summarized in Table 1.
In the first family, a social network is represented as a graph whose set of vertices is heterogeneous. Using such a model, Qi et al. [11] proposed an algorithm that combines both the content and information context of the network for multimedia data annotation. In turn, Jin et al. [12] used graph modeling and multimedia content information to propose a new concept of image similarity.
The second family models the social network via a bipartite model. Zhu et al. [13] designed a bipartite graph to model the interaction between users and multimedia content to analyze the content diffusion in a social network. In [14], the authors proposed a social recommendation framework based on an embedding method for general bipartite (user–item) graphs.
The third category of approaches uses tripartite graphs, whose set of vertices is typically composed of users, tags, and resources. Zhang et al. [15] presented a recommendation method using a user–image–tag model, whose main novelties concern user preference identification on the basis of users’ interaction with images and re-ranking social images on the basis of the content. In [16], the authors introduced an interaction tripartite graph, composed of heterogeneous vertices (users, interaction behavior, and content), whose edge weights are tuned by using an attention-driven CNN for recommendation. A tripartite graph—whose set of vertices is composed of users, tweets, and topics—was detailed by Liao, Zheng, and Cao [17] for providing coronavirus pandemic analysis through non-negative matrix factorization and sentiment analysis.
Finally, the last group defines the OSN as a hypergraph. In [18], the authors proposed a tensor decomposition approach that guarantees learning via a three-uniform hypergraph. A heterogeneous hypergraph embedding (LBSN2Vec++) was developed by Yang et al. [19] in order to consider complex interactions among users, time, and Points of Interest (POIs) for friendship and location prediction tasks in a location-based social network. Zheng et al. [20] developed a hybrid matrix factorization approach approach exploiting a hypergraph data structure to represent complex interactions in social networks for recommending items.
The chosen model was inspired by hypergraph-based approaches, which surely are the most promising ones. In particular, starting form our preliminary previous work [4], we designed a novel data model based on hypergraphs that considers all the different relationships typical of social networks, focusing on the role of multimedia objects as the main means for connecting two users.

2.2. Community Detection Algorithm

Identifying groups of users who share similar interests has become a relevant topic in different application domains. Nevertheless, the main issues about this task are related to the existence of numerous community definitions and the high time complexity requirements of many community detection algorithms. The definition of modularity considers both an interaction between entities (the nodes) belonging to the same community and contextually also a weak interaction with nodes that are outside of that community. Since there are different structural definitions that satisfy the modularity criterion, no formal definition of community is universally accepted [21,22]. In addition, communities can have different properties, often derived from the domain in question, such as hierarchical organization, and nodes that can belong to multiple communities (overlapped). For all these reasons, community identification has been approached from different perspectives, but still remains one of the outstanding research problems in graph analysis.
In the following, a classification of existing methods for community identification in an OSN is discussed.
We can consider five classes of community and cluster graph discovery methods, which depend on the methodological principle and the adopted community definition [23,24,25]: cohesive sub-graph discovery, which analyzes the topology of a sub-graph of the network that should satisfy being a community (i.e., cliques or k-core); vertex clustering, whose goal is classical cluster discovery (i.e., k-means or hierarchical clustering); community quality optimization, which constructs clusters by optimizing a cluster quality metric (i.e., conductance or modularity); divisive, identifying communities based on the arcs that interconnect them (i.e., Girvan and Newman); model-based, relying on statistical models for generating network divisions (i.e., label propagation analysis).
In the last few years, deep-learning models have been designed for dealing with community detection. Reference [26] designed a method that combines an auto-encoder deep network and K-means for respectively encoding the input data and clustering them in order to identify communities. Yang et al. [27] developed a community detection method based on a modularity function for building a low-dimensional embedding matrix (modularity matrix) by using an auto-encoder scheme. An iterative learning algorithm, named DeepWalk, was designed by Perozzi et al. [28], which is composed of two phases. The first phase is a random walk generator that generates a tree graph starting from a vertex chosen as the root and examining all vertices up to the maximum depth of the tree. In the second phase, SkipGram moves on to the next node and creates the tree from it in order to generate the topological information of the network.
Furthermore, more recently, Reference [29] proposed the GraphGAN framework, which is based on the union of generative and discriminative methods through adversarial training in a minimax game. It was evaluated in three real scenarios, i.e., link prediction, node classification, and recommendation. Instead, Wang et al. [30] propose Community-Aware Network Embedding (CANE), using the adversarial learning framework. The model can sample a set of candidate nodes within the community and relies on dual feedback, one given by the community detection model and the other by the discriminative model. Finally, DNNNC, a novel method for node classification using deep learning, was proposed by [31]. It tries to find the suboptimal solution by pre-existing network embedding methods. It was the first deep node classification model that only relies on the network structure information (and not other information, such as node characteristics).
Nevertheless, these approaches are subject to some limitations in terms of the size and heterogeneity of the dataset or encoding approach that lead to losing some information that could be useful for community detection. For this reason, we propose a CNN model that can handle adjacency matrices without encoding, exploiting their intrinsic sparsity to fully preserve both the local and global structural information about a network’s graph.

3. Methodology

In this section, we describe both the proposed data model of Multimedia Social Networks (MSNs) and the community detection approach based on the deep-learning model for community detection. Furthermore, the proposed convolutional-network-based approach can handle a large number of social relationships, which are established between two users, to identify communities in an MSN.

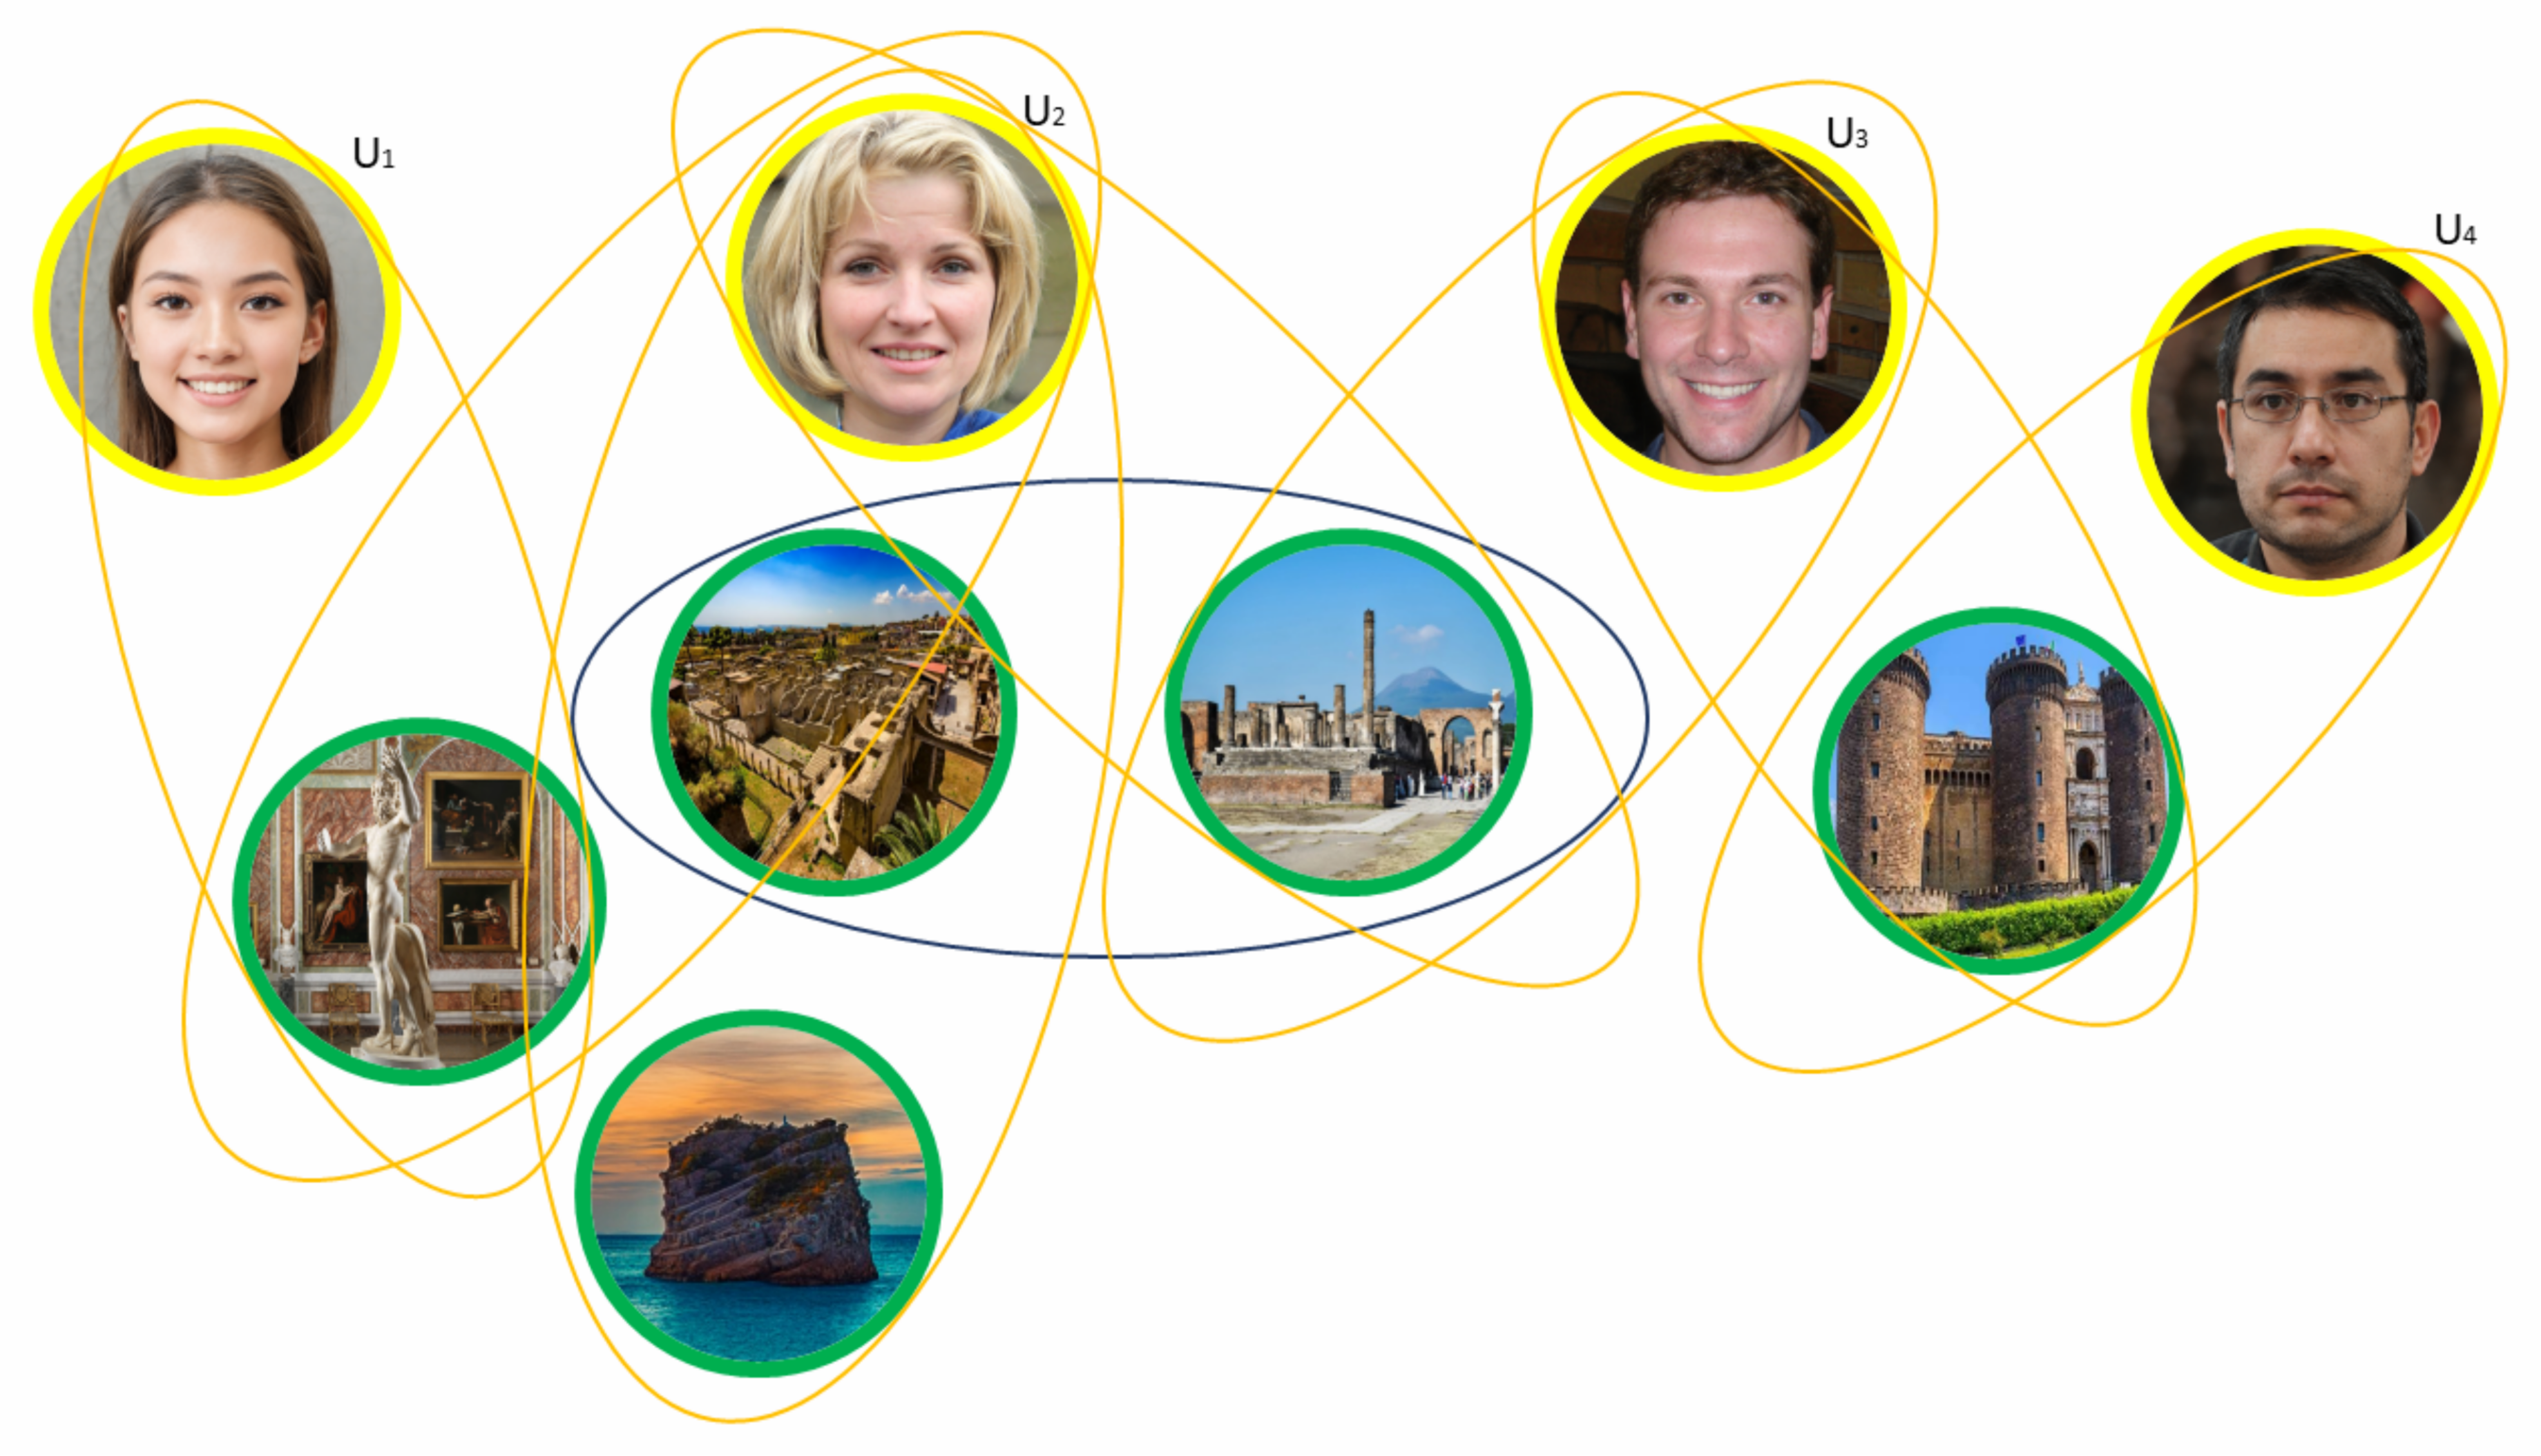
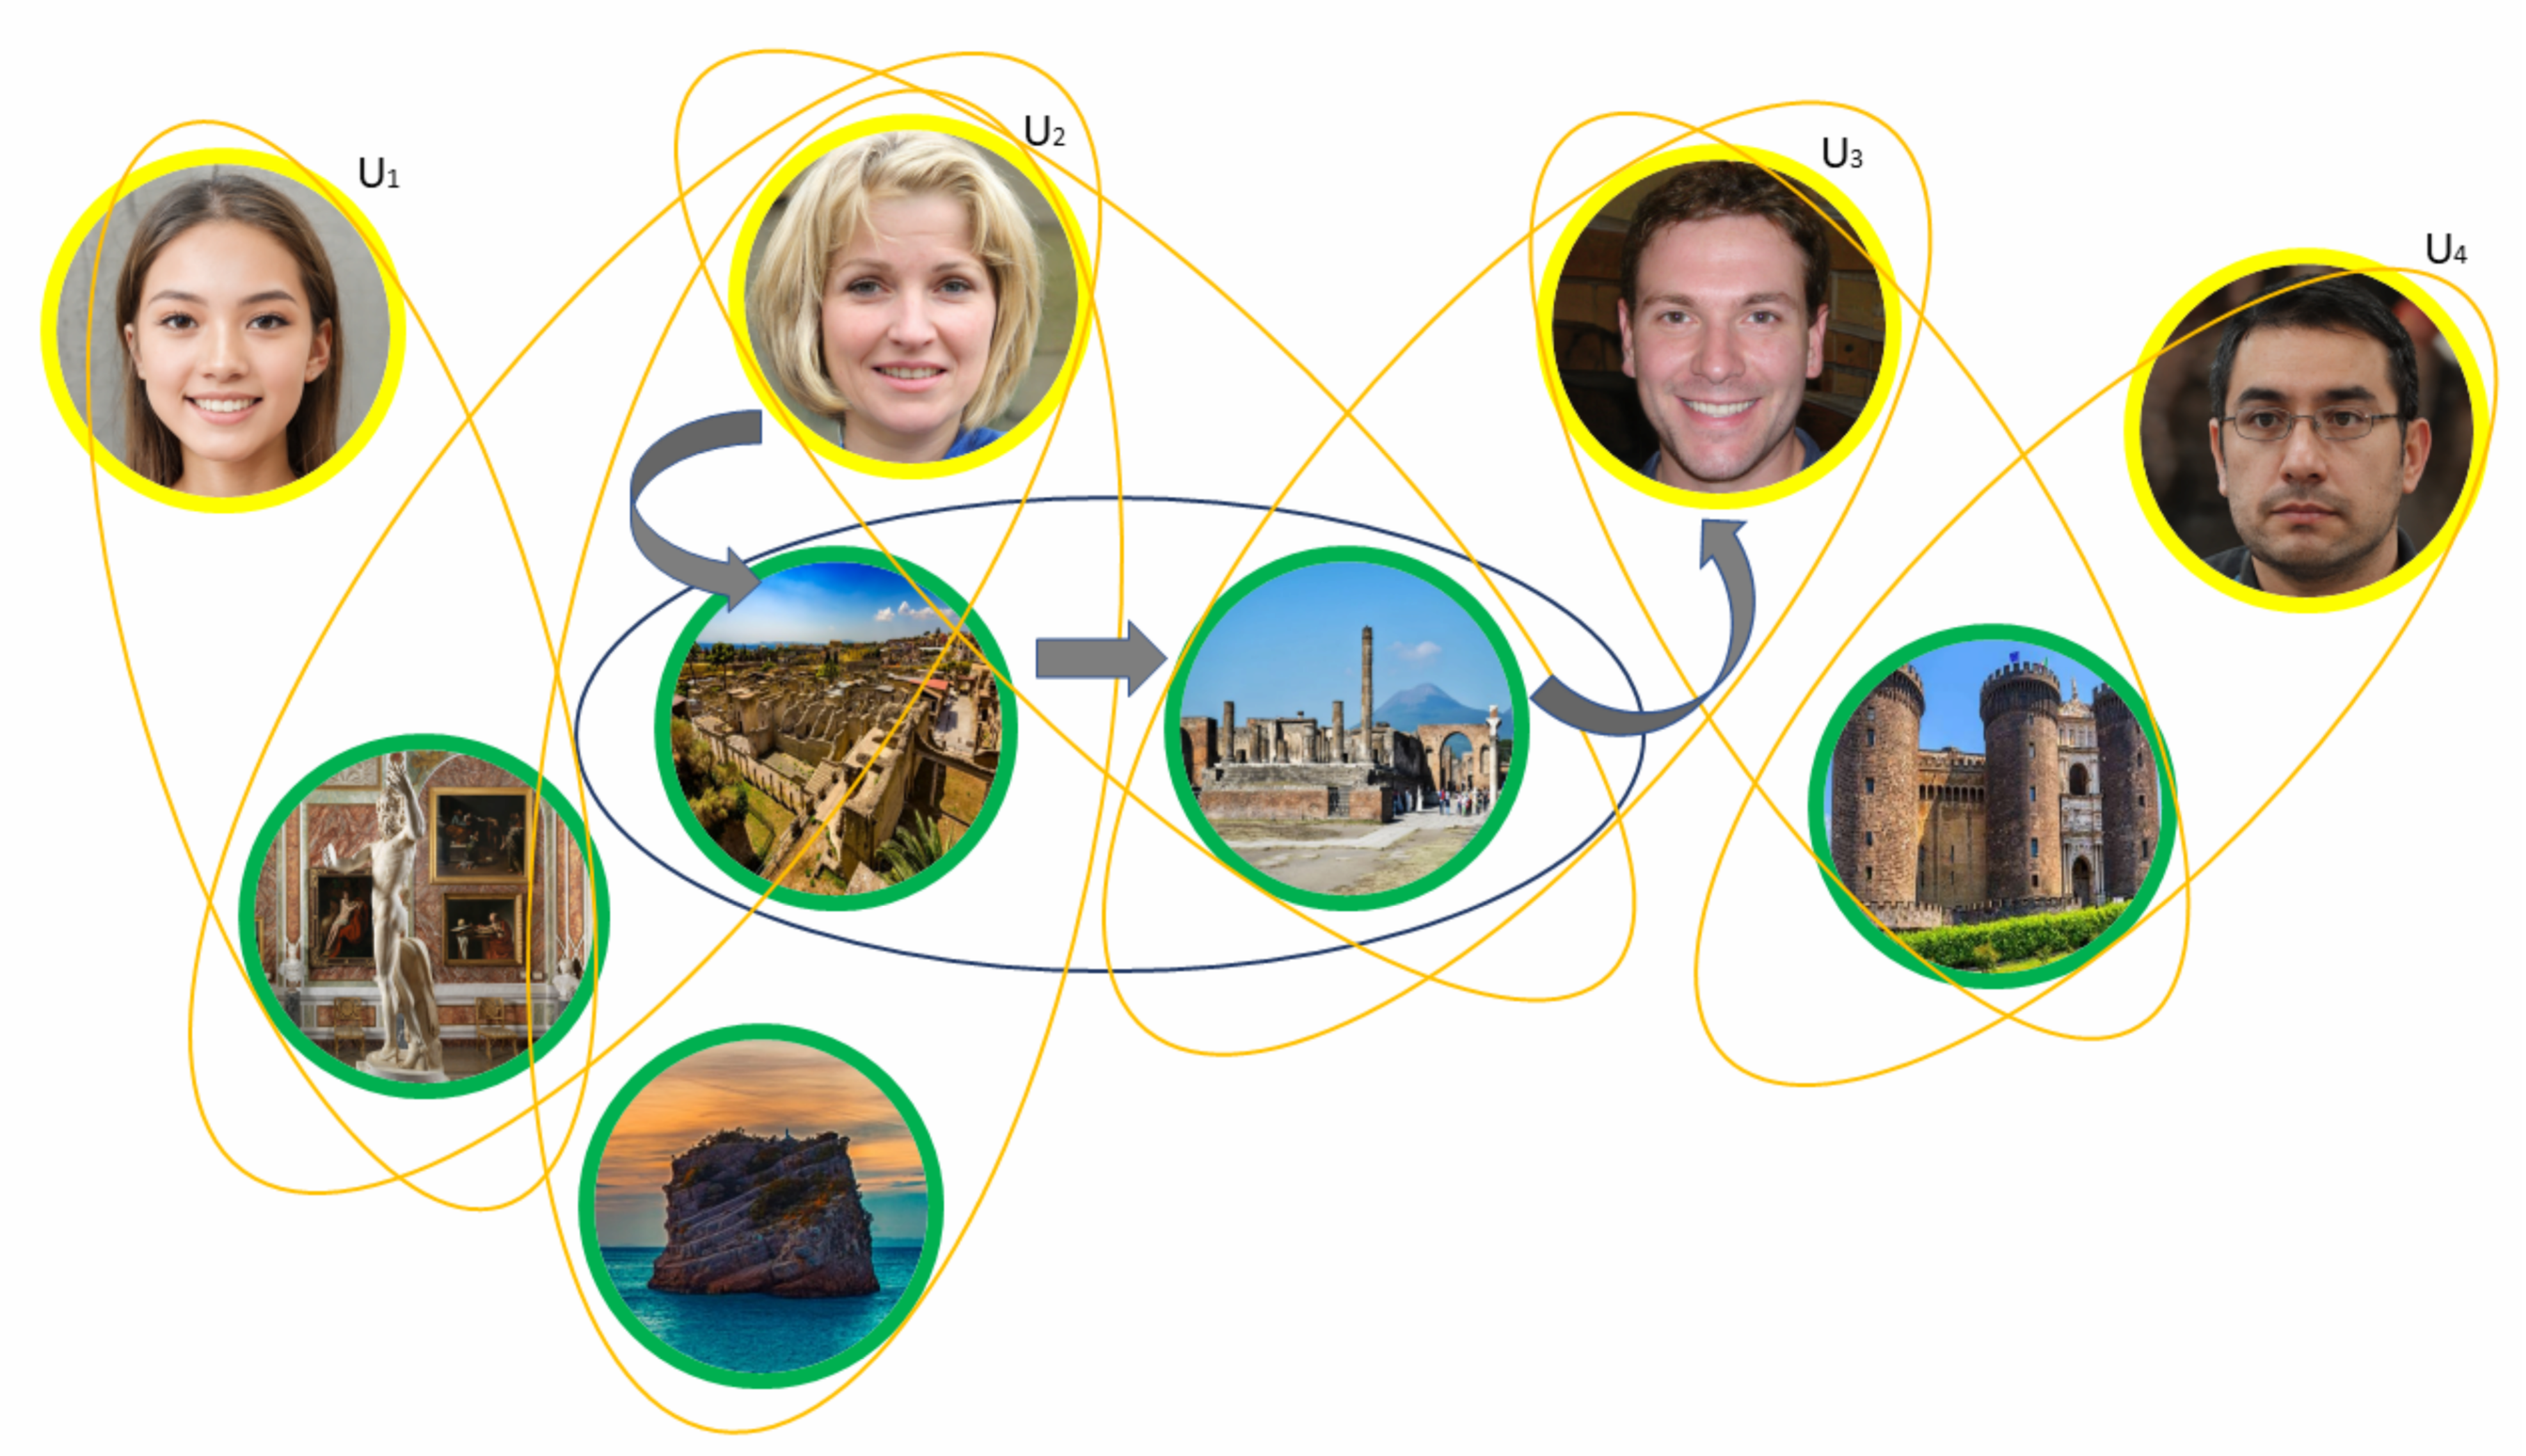
3.1. Multimedia Social Network Model

Our MSN model is characterized by two entities: users, persons or organizations, characterized by some attributes (i.e., profiles, interests, preferences), belonging to one or more communities, and multimedia objects, a set of multimedia entities (i.e., images, text, or videos), described by metadata or low-level features, that can be shared within a social network.
Different relationships can be established between these entities; for instance, a user can establish a relationship with another one (friendship or following); a user can publish a photo, or video or comment on other multimedia objects or two images can be connected according to their similarity.
Definition 1.
Let U and O be, respectively, the set of users and multimedia objects. A multimedia social network can be defined as a triple G = ( V , E = { e i : i I } , ω ) , where V = U O is the set of vertices, H is the set of hyperarcs, and ω : E [ 0 , 1 ] is a function that assigns a weight to each hyperarc.
Each hyperarc is defined as an ordered pair e i = ( e i + = ( V e i + , i ) ; e i = ( i , V e i ) ) , where e i + is called the tail of the hyperarc and e i is the head of the hyperarc. However, it turns out that the set V = V e i + V e i is the set of vertices representing the entire hypergraph. Furthermore, we define the degree of the hyperarc d e i as the cardinality of contained vertices that have incident arcs and the degree of a vertex d v as the cardinality of hyperarcs that are incident to vertex v. It is also possible to define oriented and undirected arcs: in the first case, each arc can be seen as a function that maps two disjoint and nonempty sets of V e i + and V e i .
Furthermore, we can define the main relationships of an MSN, which are classified into the following three main categories:
  • User-to-user: representing a user’s actions with another user, which are, formally, defined as e i = ( ( V e i + , i ) ; ( i , V e i ) ) , where V e i + = { u k } and { u k } U , where V e i = { U { u k } } ;
  • User-to-multimedia object: representing the relationships a user has with other media objects, possibly associated with a weight (depending to the analyzed MSN). The weight ω ( e i ) assigned to such hyperarcs indicates the importance of the relationship of an MSN. Mathematically, it can be described as e i = ( ( V e i + , i ) ; ( i , V e i ) ) with V e i + = { u k } , where u k U and V e i = { o i } , where o i O ;
  • Similarity: represented by the similarity relations between two users or between two objects. Mathematically, it is described as e i = ( ( V e i + , i ) ; ( i , V e i ) ) with V e i + = { v k } and V e i = { v j } with i k . The weight associated with this class of hyperarcs is a function of different factors, such as the metric used and the type of vertex considered.
We chose these types of relationships in our model for representing the complex and heterogeneous interactions between users and/or multimedia objects considering the characteristics of the most diffused OSNs (i.e., Twitter, Facebook, Flickr, Youtube, Instagram, etc.), but also more specific social networks (LinkedIn, ResearchGate, etc.). In our model, each kind of n-ary relationship can be easily implemented; thus, a user can tag another one within an image, different users can belong to the same group, and son on.
We can observe that the weight of a hyperarc is calculated on the basis of the type of relationships that exist between two vertices; in the case of similarity between multimedia data, the weight will correspond to their similarity according to low- and high-level features. In the case of user-to-user and user-to-object relationships, the relative weight can in some way be considered proportional in the first case to the frequency of relationships between users, while in the second case, it is related to the topic published. For simplicity, we can always consider the weight of these arcs to be equal to 1.
Figure 1 shows an example of a given MSN in which users can be connected either because they interact with the same multimedia content (through orange hyperarcs) or because they interact with similar content (through blue hyperarcs). Such kinds of information can be very useful to community detection algorithms to identify the right clusters of users.
Once the MSN model has been defined, it can be seen that there are different paths connecting two users. These paths allow estimating how users interact with each other; obviously, not all of them are eligible for relationship description, but it depends on the considered SNA application.
Therefore, it is necessary to introduce the concept of a relevant path, which is a sequence of hyperarcs that meets a given condition Θ . Such a condition can be defined on nodes and hyperarc attributes and allows us to take full advantage of all the features of social networks. In particular, the estimation of the interaction strength between two users is performed using the concept of a relevant social path, which is a path between two users that can exploit multimedia objects on which they both interact or that are similar or involve other MSN users.
Figure 2 shows an example of a relevant path defined between two users, based on the fact that they are interested in two similar objects.
These paths, then, allow us to construct a weighted adjacency matrix, called the weighted relevant path matrix, whose element ( i , j ) represents the probability of interaction, estimated from the number and weight of relevant social paths, between users i and j. It should be noted that any update of the graph requires a corresponding change in the adjacency matrix; in particular, our method easily handles potential changes in network topology by exploiting the sparsity of the adjacency matrix. Figure 3 describes the generated adjacency matrix for the MSN in Figure 1, considering as relevant paths all those leveraging user-to-content and similarity relationships.

3.2. Community Detection Approach Based on Deep Learning

In this section, we describe the proposed convolutional network, whose details are shown in Figure 4, which uses as the input the user–user adjacency matrix with the goal of identifying communities by combining semantic and topological content.
In MSNs, the number of users is increasing, usually in the order of tens of millions; thus, the proposed network involves the use of sparse matrices in order to reduce the expected computational burden. In particular, this CNN relies on the classical four layers, as shown in [32]: ingestion, convolution, max-pooling, fully connected layer. The ingestion layer deals with the building of the adjacency matrix from the MSN network, which is fed the convolutional layer as the input, performing a set of filters to extract the main features. This layer provides a set of matrices (feature map) as the output, on which a max-pooling operation is performed to reduce the problem resolution. The output of this layer is fed the fully connected layer as the input, whose aim is to define the probability distribution of each node over K classes.
More in detail, the convolutional network takes an adjacency matrix obtained by analyzing the content published or the actions carried out by other users within social networks, forums, etc., as the input. Then, this matrix is analyzed through a series of filters (also called the kernel matrix) in order to extract the feature characteristics that allow discriminating how a user interacts with other nodes. The output of the convolutional layer is processed by the max-pooling layer, reducing the size of the problem. After the max-pooling operation, the convolutional layer aggregates the features of the various feature maps to provide the required prediction. Finally, a learning phase is carried out to optimize the weights of the network for the analyzed task. Regarding the complexity of the convolution operation, it depends on the size of the input, i.e., the matrices, and of the kernel. If M, N represents the input matrix size and k, j the kernel matrix, the computational cost is equal to O ( M N k j ) (worst case).

3.2.1. Ingestion Layer

The ingestion layer allows us to construct the input matrix (adjacency matrix) of the proposed convolutional network. The adjacency of a node (n) with respect to others in the network is expressed as a vector of features of length N, where N is equal to the number of users in the network. In our opinion, each row of the adjacency matrix can express how a user exerts his/her influence with respect to the other nodes in the network on the basis of an influence function inversely proportional to the distance between the nodes in the network. Formally, a function between two generic nodes i and j can be described by the following formula e σ ( 1 s i j × w i j ) , where σ is the attenuation factor and s i j and w i j represent the distance and the path weight (the minimum between the weights of the arcs within the path) between i and j, respectively.
Finally, this module allows the creation of the input for the next layer, decomposing the adjacency matrix into individual rows, which are transformed into a two-dimensional matrix of cardinality w × h = N .

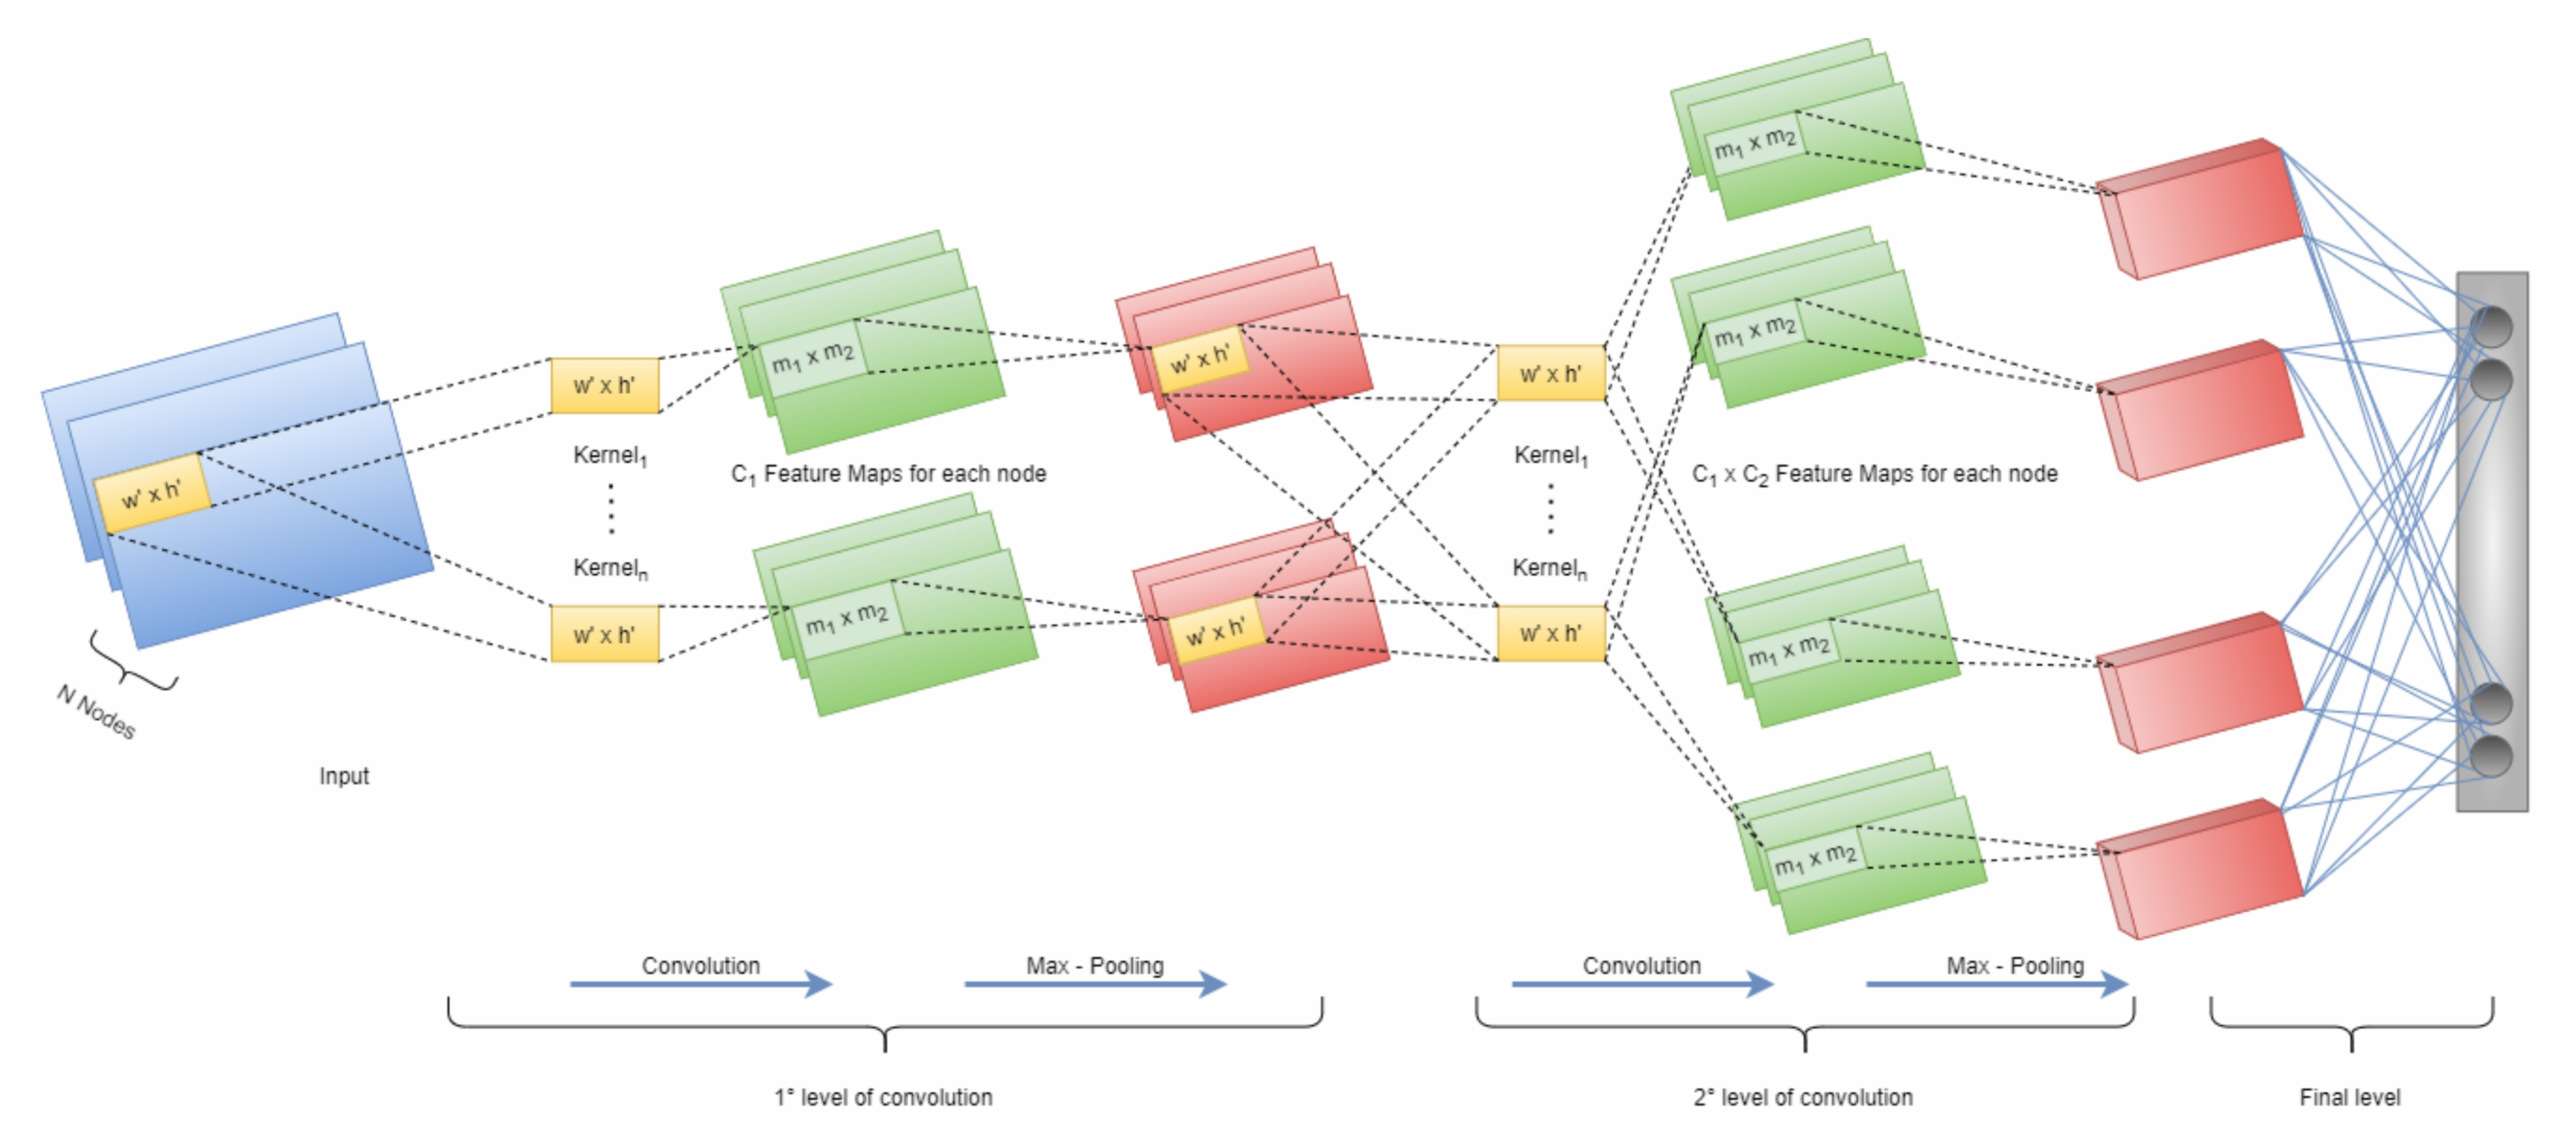
3.2.2. Convolutional Layer

This layer performs the convolution operation with a set of filters (or kernels), especially chosen to extract the main features for the examined problem, generating a set of matrices called the feature map as the output. Formally, each element of each feature map is computed using the following formula:
v i j n = r e l u ( b w + i = 0 w 1 j = 0 h 1 w i j × p ( x + i ) ( y + j ) n )
where p ( x + i ) ( y + j ) n , w i j , and b w represent the value at position ( x + i , y + j ) of the input matrix, the weight at position ( i , j ) , and the bias value for the corresponding convolutional kernel, respectively.
In conclusion, the output of the convolutional layer is a set of feature maps with a number equal to the cardinality of the chosen set of filters, each of size ( w w + 1 ) × ( h h + 1 ) .

3.2.3. Max-Pooling Layer

This layer performs the max-pooling operation on the previously described convolution output. In particular, it performs a subsampling of the given feature map, which allows reducing the resolution of the problem with the use of an equal number of feature maps. Formally, selecting a sliding window of m 1 × m 2 , the max-pooling operation is performed on a feature map of dimension f 1 × f 2 by selecting the maximum in each non-overlapping one of cardinality m 1 × m 2 , producing a matrix of f 1 m 1 × f 2 m 2 dimensions as the output.

3.2.4. Fully Connected Layer

The last layer of the proposed network is the fully connected layer, which consists of K neurons, whose number is equal to the number of communities to be analyzed. Summarizing, the output of this layer represents the probability distribution over K community classes.
Each neuron assigns each input node to the relative community by setting to 1 the output value of the relative neuron, while the others are set to zero. Note that each value in each feature map is connected to all K neurons in the fully connected layer.
Formally, the value of the k-th neuron can be calculated by the following formula:
o n k = r e l u ( b k f + W k f q n c 1 c 2 )
where f denotes the last fully connected layer, while q n c 1 c 2 , W k f , and b k f are the output of the convolutional layer, the weights, and the bias of the k-th neuron in the layer under consideration, respectively.
In conclusion, the learning phase iteratively updates the convolutional layer to improve the accuracy of the proposed system by optimizing the system parameters ( P = ( W , W f , b , b f ) ). Then, a back-propagation step is performed in order to optimize the values of the vector P. Formally, we assume that there is a set T of training sample { ( s n , l n ) 1 n T } , where s n is the adjacency relation of node n and l n k expresses whether or not the node belongs to the particular community. The cost function can be expressed as follows:
J ( P ) = 1 2 n = 1 T o n l n 2 2 = 1 2 n = 1 T k = 1 k ( o n k l n k ) 2
where o n k is the value of the k-th neuron and l n k the k-th size of the corresponding label vector (ground truth).
This iterative process continues until Equation (3) converges by optimizing the parameters of the vector P via the back-propagation operation. The back-propagation criterion used was the sparse softmax cross-entropy, suitably modified to be optimized to work with sparse matrices.
Our approach relies on the semi-supervised strategy, which requires a small sample of training data, on which we tuned the optimal parameters in order to identify communities in an MSN.

4. Experimental Evaluation

In this section, we describe the experimentation performed to evaluate the proposed approach on different datasets.

4.1. Experimental Protocol

Our evaluation aimed to investigate the effectiveness and efficiency of the proposed approach according to the following three criteria:
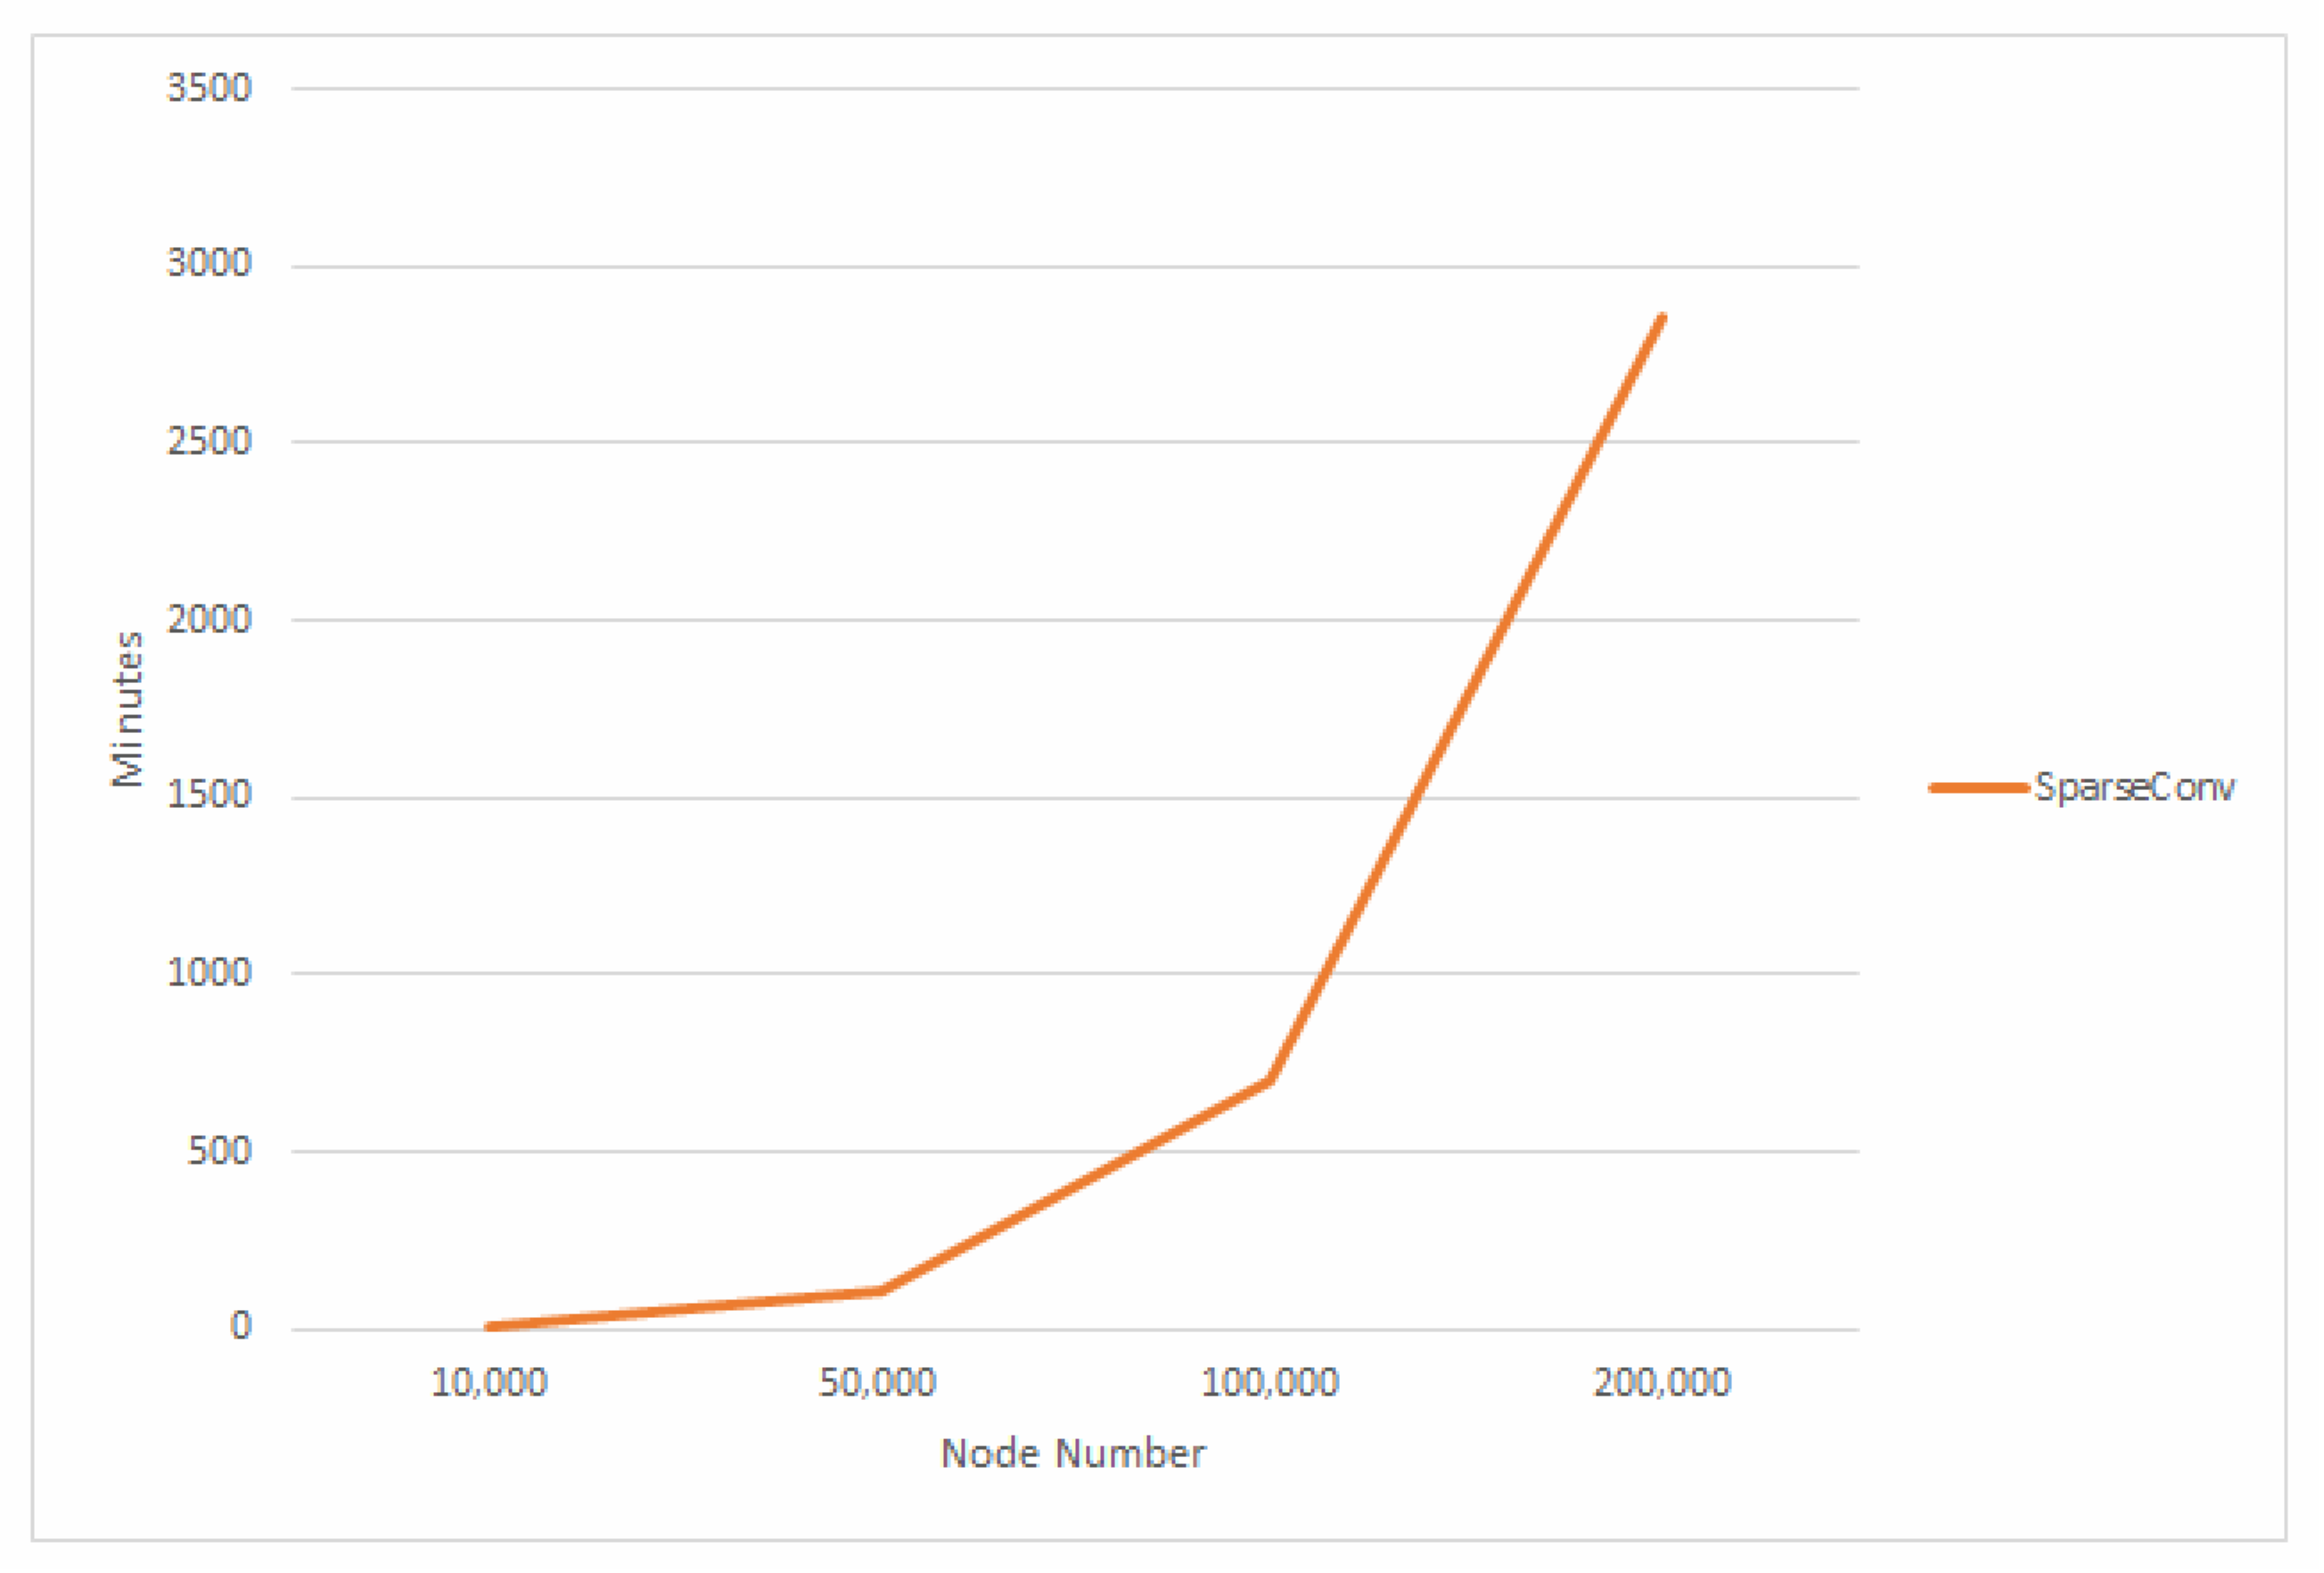
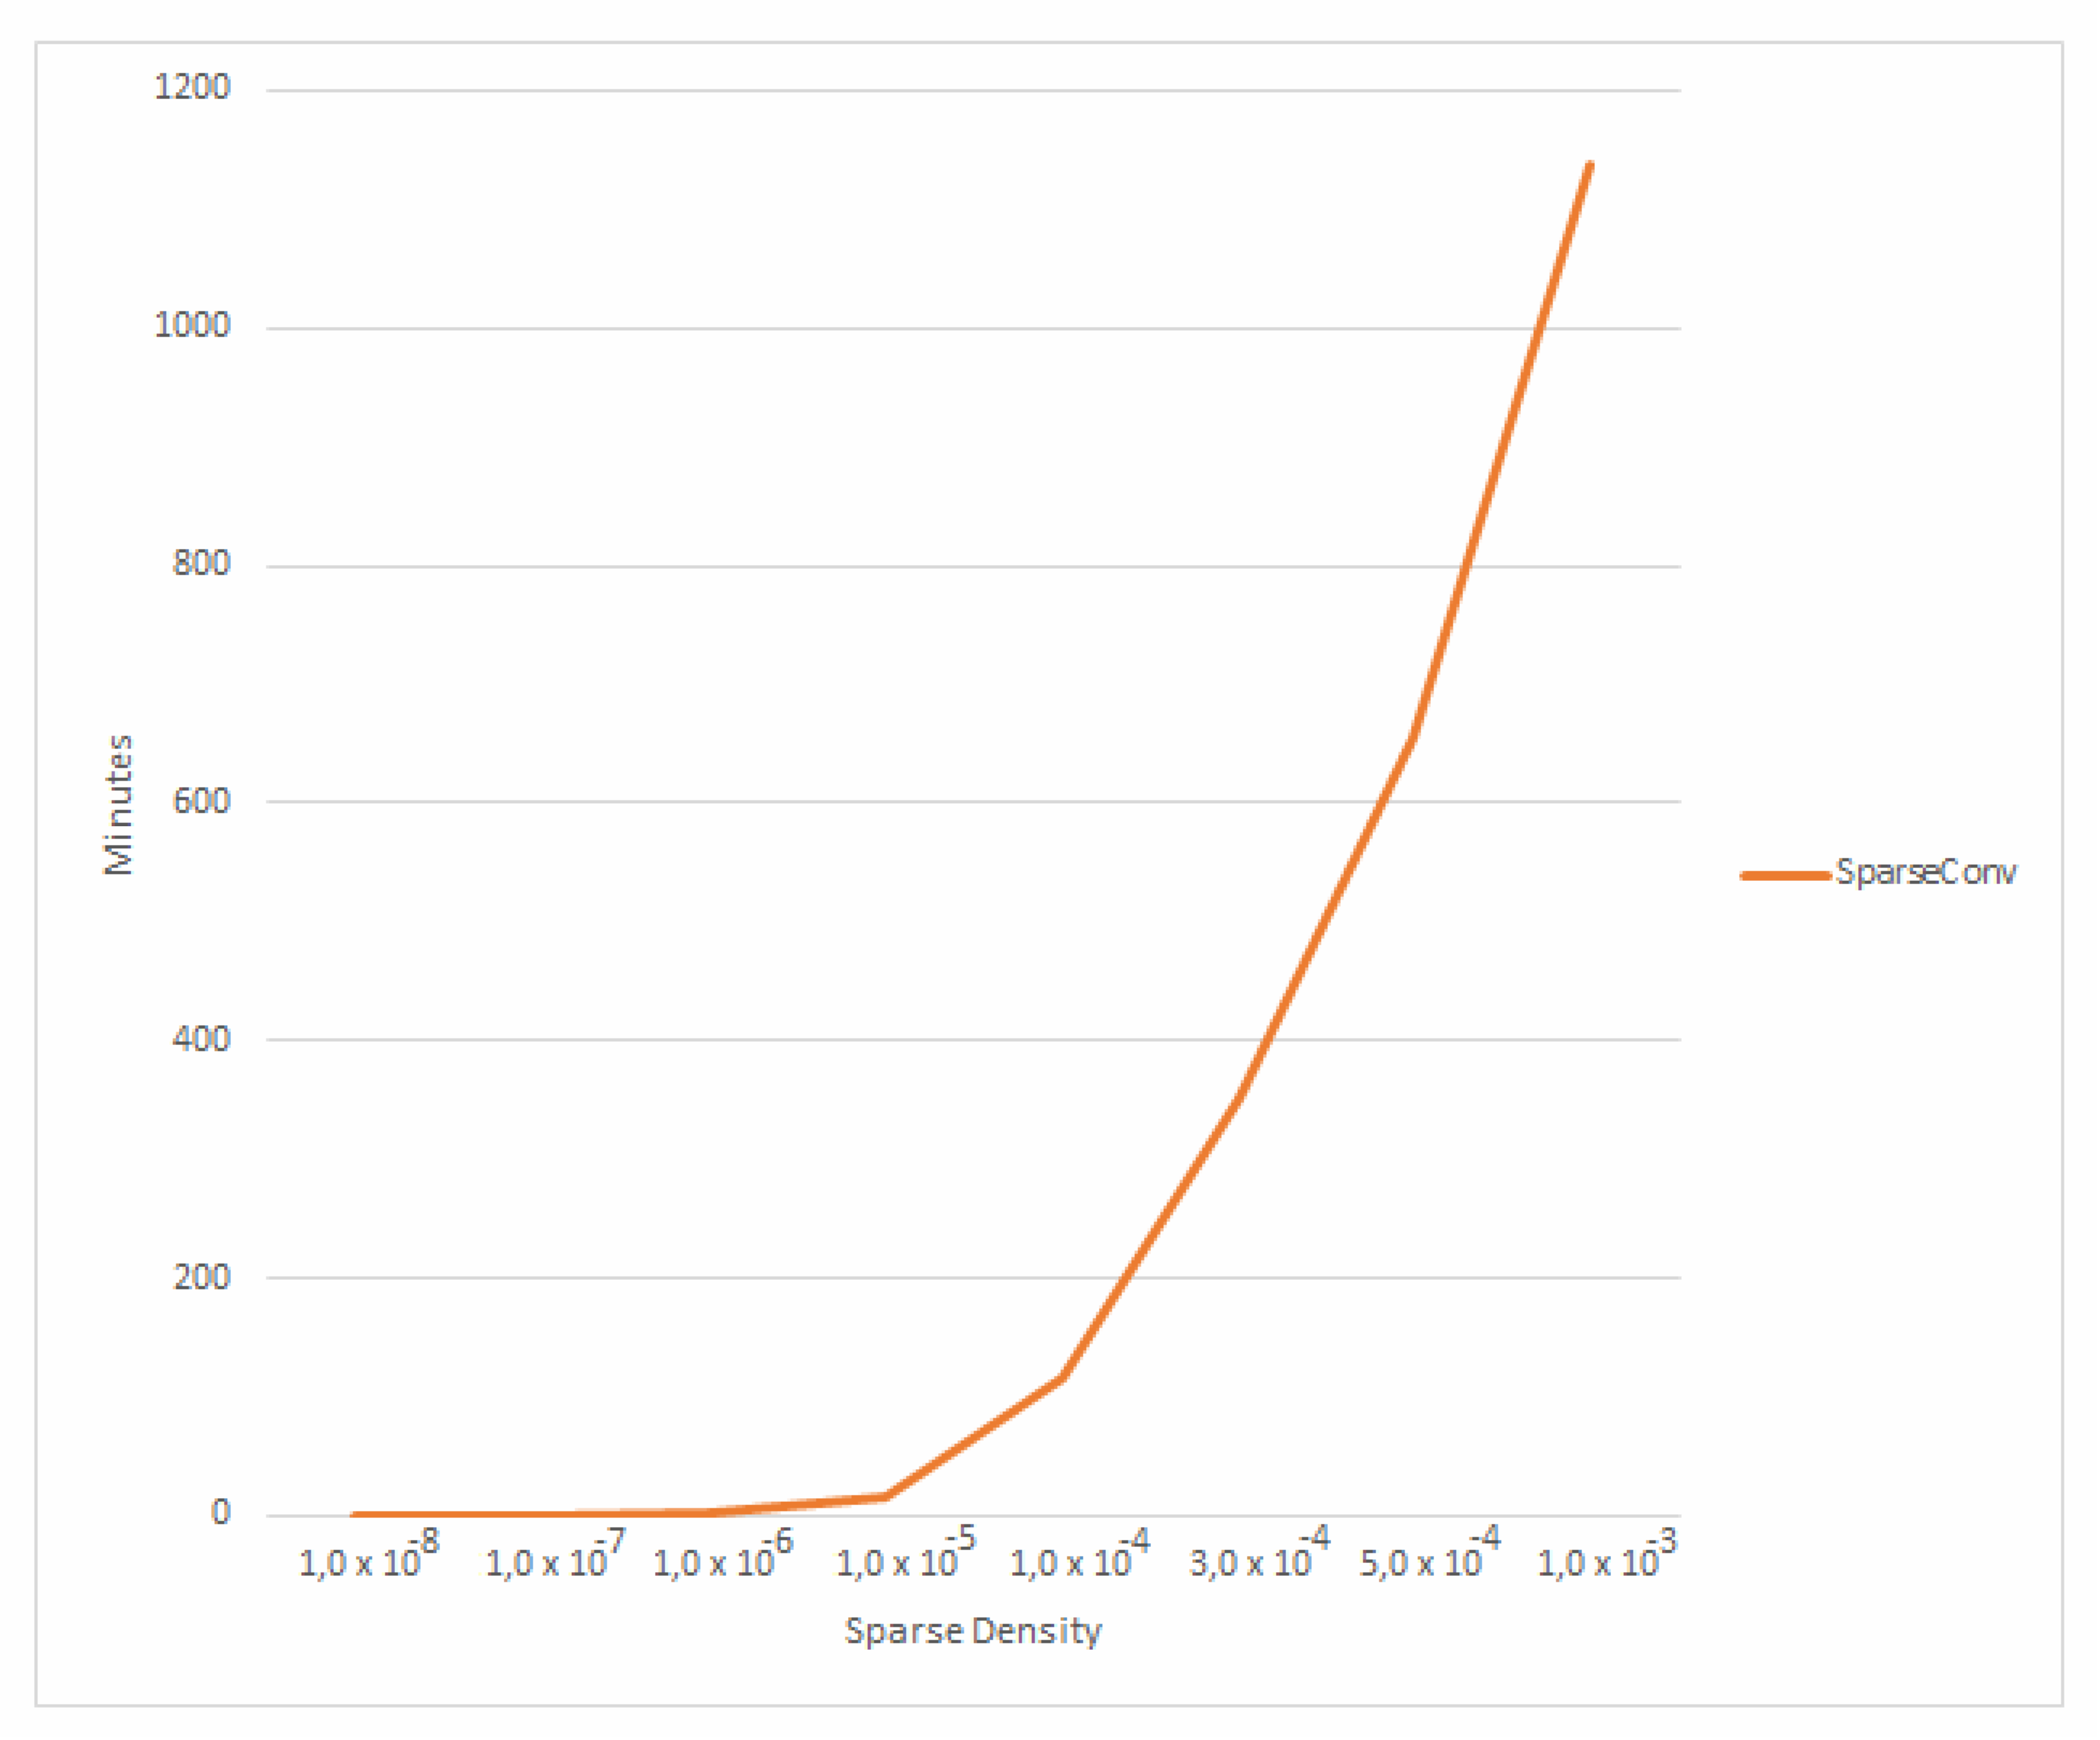
  • Time efficiency analysis of our approach on the artificial dataset, varying the matrix sparsity and number of nodes;
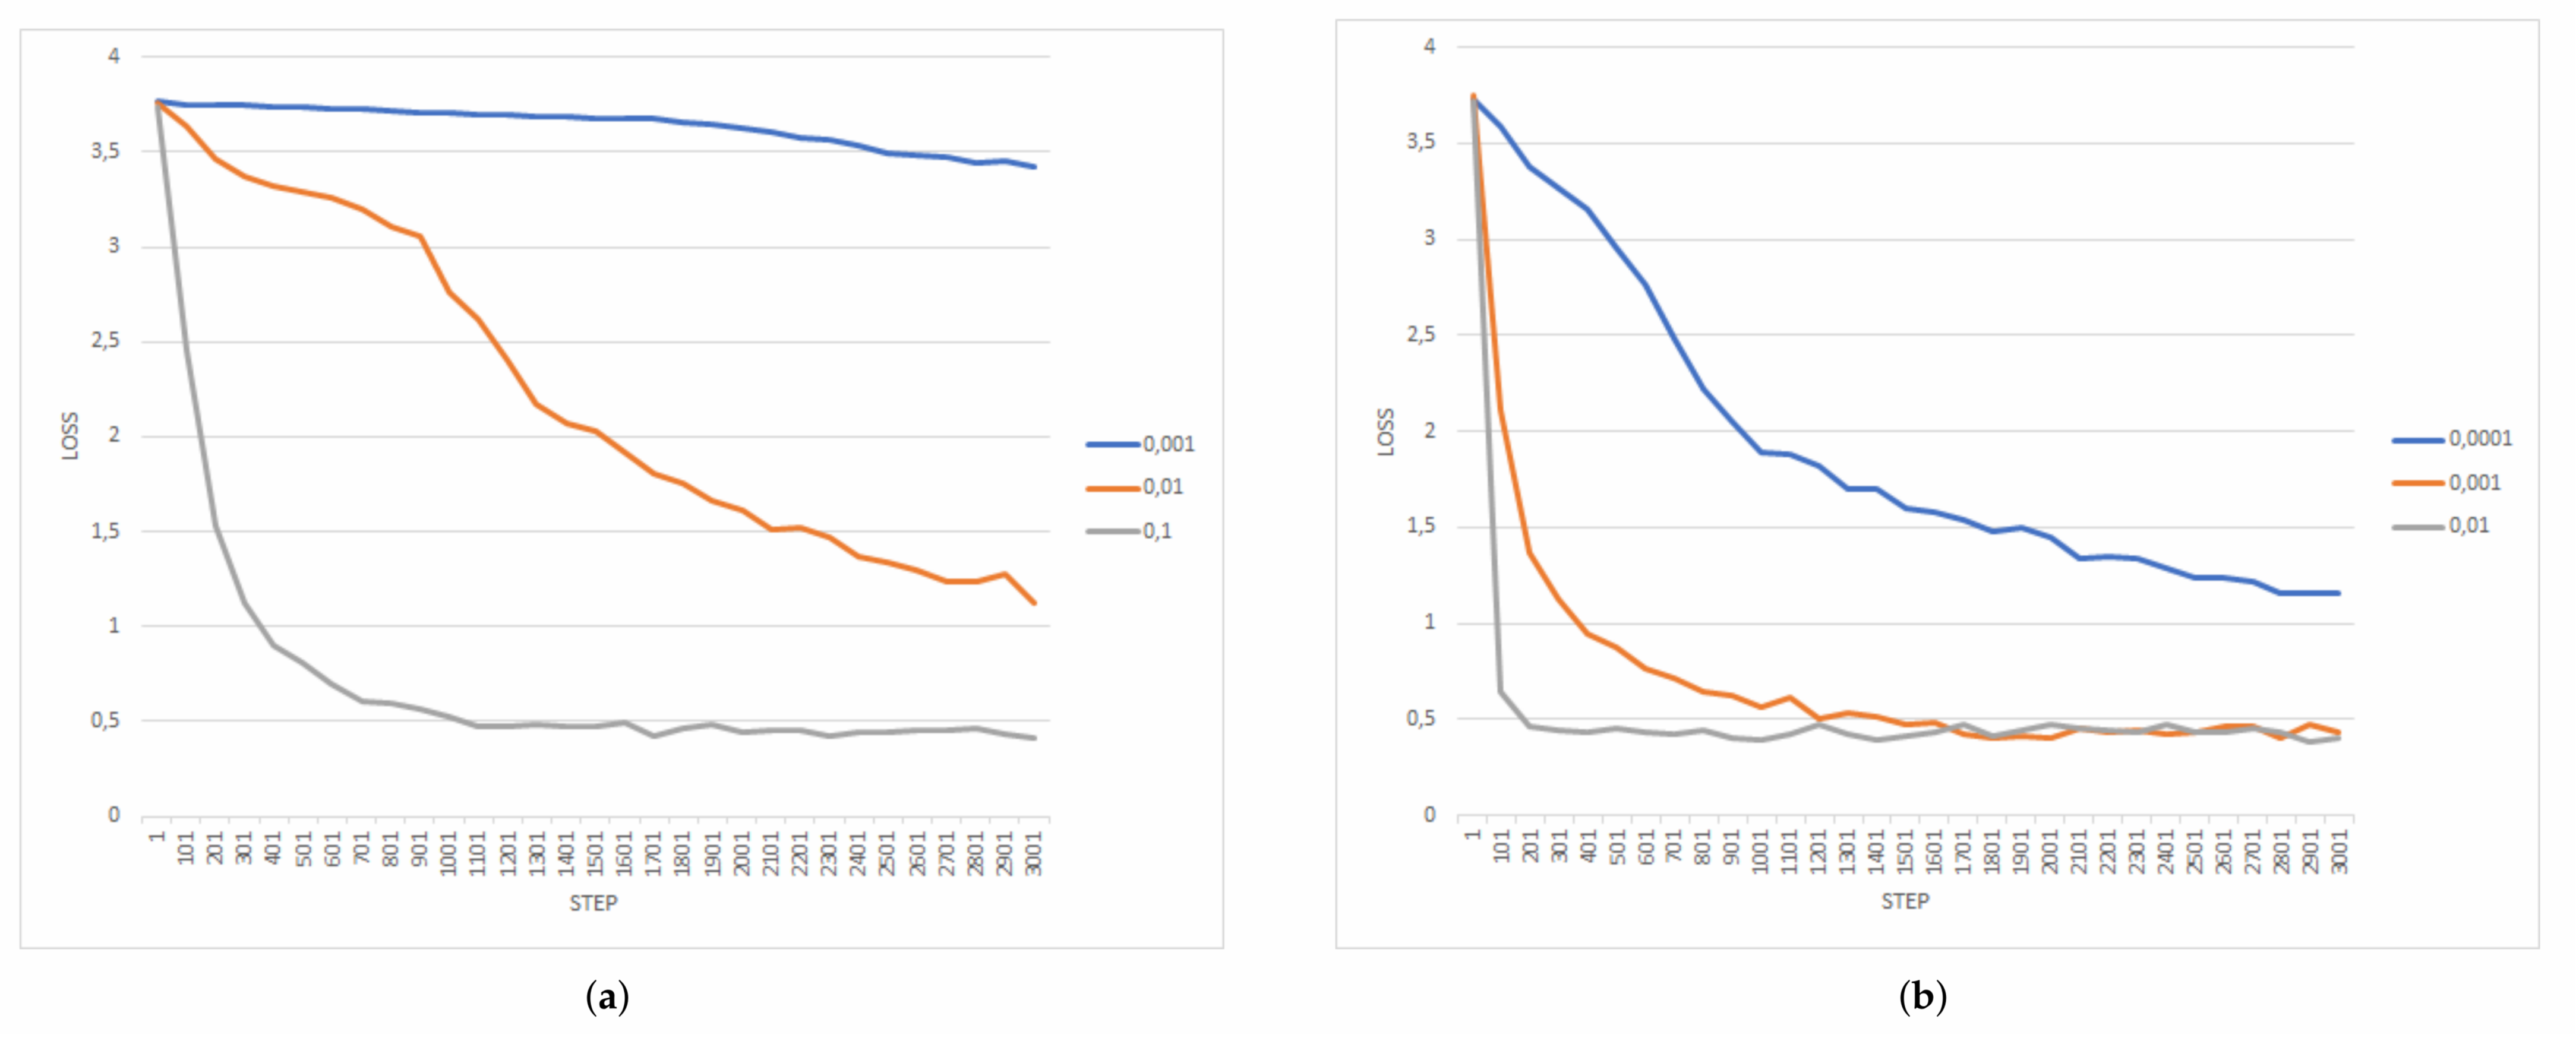
  • Performance analysis during the training phase considering the loss value and different optimization metrics;
  • Effectiveness analysis of the proposed approach with respect to DeepWalk [28], SDNE [33], LINE [34], GraphGAN [29], CANE [30], and DNNNC [31].
The proposed approach was evaluated on three different datasets: an artificial dataset, varying the number of nodes from 50,000 to 200,000 and the related sparsity degree between 10 8 and 10 3 , BlogCatalog3 (http://datasets.syr.edu/datasets/BlogCatalog3.html, accessed on 10 October 2021), and Yahoo Flickr Creative Commons 100M (YCFMM100M) [35], a dataset containing about 100 million photos and videos extracted from Flickr. For the dataset YCFMM100M, images were filtered by tags in order to consider only the ones about cultural heritage, which were, successively, processed according to the methodology described in Section 3. The final dataset was composed of 138,100 nodes and 135,613 non-zero values, thus having a degree of sparsity equal to 7.1 × 10 6 and only 71,605 values different from zero. Finally, we developed our framework on the Microsoft Azure (https://azure.microsoft.com/, accessed on 10 October 2021) cloud computing platform using a E2-64 v3 virtual machine equipped with a 2.3 GHz Intel XEON® E5-2673 v4 (Broadwell) processor and 32 GB of RAM.

4.2. Metrics

We estimated the performance with M a c r o F 1 and M i c r o F 1 [33,36]; the reason for choosing these metrics is that the problem to be solved is a multi-label classification.
Consider X as one of the possible labels. We refer to T P ( X ) , F P ( X ) , and F N ( X ) as the number of true positives, false positives, and false negatives, respectively. Assume then that C is the set of labels. M a c r o F 1 and M i c r o F 1 are defined as follows:
M a c r o F 1 = X C F 1 m e a s u r e ( X ) C
M i c r o F 1 = 2 × P r e c i s i o n × R e c a l l P r e c i s i o n + R e c a l l
where the precision and recall are defined as:
P r e c i s i o n = X C T P ( X ) X C ( T P ( X ) + F P ( X ) )
R e c a l l = X C T P ( X ) X C ( T P ( X ) + F N ( X ) )

4.3. Architecture

We propose a modular and scalable architecture based on Big Data architectures, which consists mainly of two modules: data crawling and data processing.
In particular, the data crawling module is responsible for crawling information from different social networks, on which, subsequently, a data cleaning operation is carried out to remove errors and inconsistencies from the data and tuple dangling in order to improve the quality of data.
The data processing focuses on the building of the multimedia social network based on the Spark framework (https://spark.apache.org/, accessed on 10 October 2021) from the data collected by the data crawling module and on the development of a new machine-learning model based on the TensorFlow framework (https://www.tensorflow.org/, accessed on 10 October 2021) for community detection in MSNs.

4.4. Running Time Analysis

In this section, we analyze the convolution execution times when varying the number of nodes and the sparsity of the input matrix. In particular, in Figure 5, we generated four different datasets with 10,000, 50,000, 100,000, and 200,000 nodes by setting the sparsity to a value of 10 4 .
As can be seen from Figure 5, the proposed approach turned out to be more efficient as the number of nodes increased compared to the one based on dense matrices, which adopts the primitives of the TensorFlow framework. Furthermore, it can be seen that the running time was closely related to the number of nodes, and the results were strictly based on the workstation used.
In Figure 6, we fixed the number of nodes at 50,000 and varied the matrix sparsity between 10 8 and 10 3 .
It can be seen that in this case, the convolution time for the algorithm based on dense matrices was constant as it does not depend on the matrix sparsity. Moreover, the proposed approach turned out to be effective compared to a native method until the degree of sparsity decreased to a value between 10 4 and 10 3 .
Furthermore, there are two points of caution to be noted: (i) the degree of sparsity in real social networks varies between 10 6 and 10 8 ; (ii) the timescales may be subject to a 500–1000-times reduction in their value in case a GPU is used.
Finally, Table 2 shows the running time of the proposed approach with respect to six different state-of-the-art approaches: DeepWalk [28], SDNE [33], LINE [34], GraphGAN [29], CANE [30], and DNNNC [31]. It is easy to note that our approach achieved performances similar to the majority of the state-of-the-art approaches.

4.5. Training Performance Analysis

We evaluated the loss function on the training set with respect to a set of parameters:
  • Learning rate (0.1, 0.01, 0.001);
  • Kernel number (three and ten);
  • Optimizer (gradient descent and Adam);
  • Decaying rate.
In particular, we used two types of optimizers: descending gradient, an iterative first-order optimization algorithm for finding the minimum of a function, and Adaptive Moment Estimation (Adam), an additive first-order gradient optimization algorithm for a stochastic objective function. Figure 7a,b analyzes the learning curves using the two optimizers when varying the number of kernels.
In Figure 7a, it is possible to notice how the choice of the learning rate for the downward gradient had an impact on the value of the loss obtained, while it became less significant for the Adam optimizer. Furthermore, Figure 7a,b shows how in the case of the descending gradient, it was necessary to use a high-level learning rate in order to reach a value of 0.5, a value reached with the Adam optimizer with a learning rate of 0.01 in about 600 epochs.

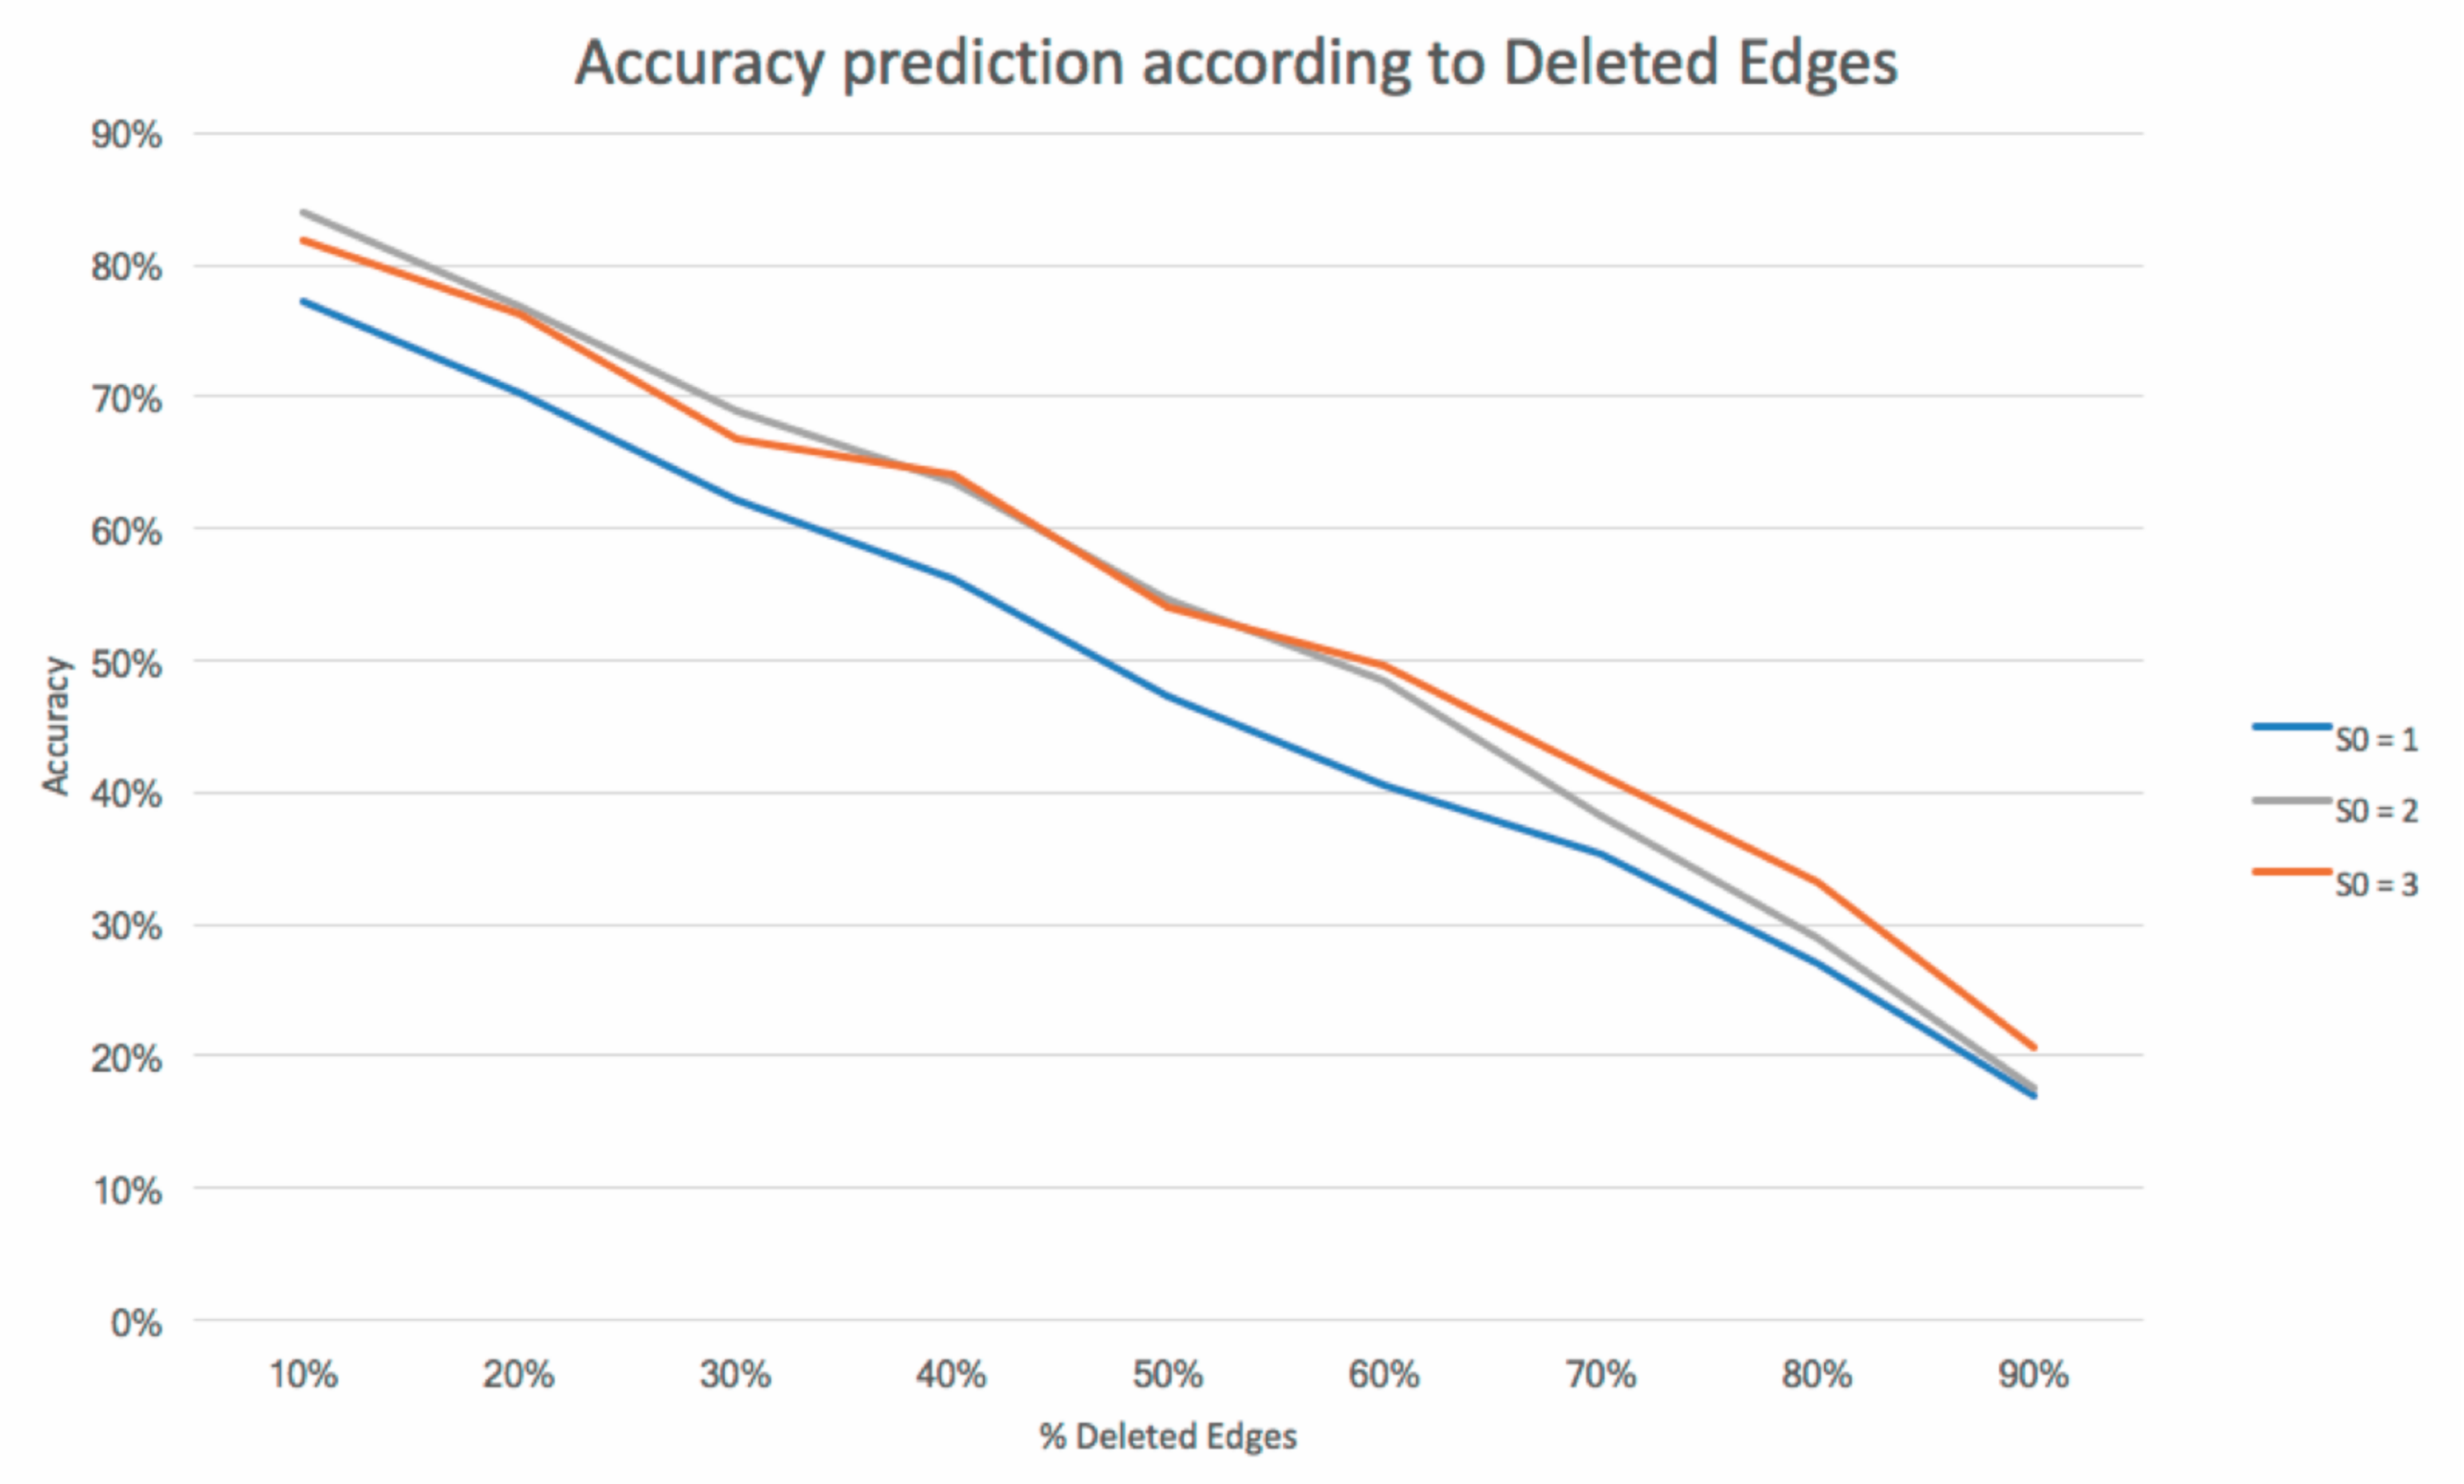
4.6. Effectiveness Evaluation

In this section, we discuss about the effectiveness of our approach with respect to the state-of-the-art ones on two well-known datasets: BlogCatalog3 and Flickr. Firstly, we investigate the performance of the proposed framework when varying the percentage of edges, randomly chosen, setting s 0 = 1 , 2 , and 3 in Figure 8 to choose the maximum length of the relevant path. In particular, it is easy to note in Figure 8 that accuracy decreased when increasing the number of arcs removed, achieving better results when setting s 0 = 2 , while increasing the number of hops did not provide significant improvements in accuracy. Having defined their maximum length, we compared our approach with respect to different baselines on the BlogCatalog3 and Flickr datasets: DeepWalk [28], an iterative algorithm using local information obtained from a random walk to learn latent representation, and SDNE [33], which relies on a deep model using a Laplacian eigenmap, LINE [34], embedding method using a stochastic gradient and negative samples.
Furthermore, we evaluated our method also w.r.t. more recent approaches: the GraphGAN [29] framework, which is based on the union of generative and discriminative methods through adversarial training in a minimax game; CANE [30], which uses a community-aware network embedding together with adversarial learning; DNNNC [31], which exploits a deep node classification model, only relying on the network structure information.
Table 3 and Table 4 show the results of the comparison of our approach w.r.t. SDNE, LINE, Deep Walk, GraphGAN, CANE, and DNNNC on the BlogCatalog3 and Flickr datasets when varying the percentage of labeled nodes. It is easy to note that our approach was close to the best-case performance when the number of training instances increased.

5. Conclusions

Currently, we are inundated with a large amount of data from which it becomes increasingly difficult to infer new information. One of the methods to improve knowledge about a particular field of interest is the analysis of social networks through the analysis of human relationships that are established between people. Given the large number of friendship relationships established on modern social networks today, identifying subsets of users who share common interests is becoming increasingly difficult. The identification of such groups of users can be useful in different fields: marketing, with the suggestion of appropriate advertising campaigns, and recommendation systems, with the suggestion of appropriate tourist/cultural routes based on their preferences.
In this paper, a methodology was proposed for modeling heterogeneous information in a hypergraph-based data model and for identifying user groups by combining their preferences and the common actions performed by users on an MSN. The choice to determine communities based on actions allowed reducing the number of relationships established between users, allowing a more granular analysis of the interests and interactions between users. In particular, the analysis of the actions performed by each user on multimedia objects allowed analyzing this behavior within the social network, providing more details about these preferences and interests compared to those of other people; in fact, the addition of paths between cultural objects also allowed the identification of new ways in which two users can interact and thus share similar interests.
Although our approach is promising, we need to discuss its limitations: to use the CNN, one needs to have a GPU-based infrastructure available; moreover, performing parameter tuning, i.e., choosing the learning rate, kernel, and number of epochs, is an expensive process in terms of computational complexity due to the massive matrix input.
Future works will be devoted to:
  • Extending the testing phase to other datasets such as Facebook, Twitter, etc., not only with respect to Flickr;
  • Optimizing the analysis of influence and recommendation algorithms;
  • Reducing the impact of lurkers (a type of behavior on social media in which a user interrupts an online silence or passive thread-viewing habit to engage in a virtual conversation; the term implies that a user typically does not participate in social media or online social activities) based on communities in social networks;
  • Improving the community detection also using embedding techniques directly on hypergraphs, which transform a state space with high dimensionality into a new space with low-dimensionality (e.g., vectors), having the advantages of being able to lighten the computational complexity and to apply many techniques of machine learning.

Author Contributions

A.F.: Conceptualization, Methodology Software, Validation, Writing—Original Draft, Writing—Review & Editing; V.M.: Conceptualization, Methodology Software, Validation, Writing—Original Draft, Writing—Review & Editing; G.S.: Conceptualization, Methodology Software, Validation, Writing—Original Draft, Writing—Review & Editing. All authors have read and agreed to the published version of the manuscript.

Funding

This research received no external funding.

Institutional Review Board Statement

Not applicable.

Informed Consent Statement

Not applicable.

Data Availability Statement

Not applicable.

Conflicts of Interest

The authors declare no conflict of interest.

References

  1. Rathore, S.; Sharma, P.K.; Loia, V.; Jeong, Y.S.; Park, J.H. Social network security: Issues, challenges, threats, and solutions. Inf. Sci. 2017, 421, 43–69. [Google Scholar] [CrossRef]
  2. Bayrakdar, S.; Yucedag, I.; Simsek, M.; Dogru, I.A. Semantic analysis on social networks: A survey. Int. J. Commun. Syst. 2020, 33, e4424. [Google Scholar] [CrossRef]
  3. Liu, F.; Xue, S.; Wu, J.; Zhou, C.; Hu, W.; Paris, C.; Nepal, S.; Yang, J.; Yu, P.S. Deep learning for community detection: Progress, challenges and opportunities. arXiv 2020, arXiv:2005.08225. [Google Scholar]
  4. Amato, F.; Moscato, V.; Picariello, A.; Sperlí, G. Multimedia social network modeling: A proposal. In Proceedings of the 2016 IEEE Tenth International Conference on Semantic Computing (ICSC), Laguna Hills, CA, USA, 4–6 February 2016; pp. 448–453. [Google Scholar]
  5. Amato, F.; Moscato, V.; Picariello, A.; Piccialli, F.; Sperlí, G. Centrality in heterogeneous social networks for lurkers detection: An approach based on hypergraphs. Concurr. Comput. Pract. Exp. 2018, 30, e4188. [Google Scholar] [CrossRef]
  6. Antelmi, A. Towards an Exhaustive Framework for Online Social Networks User Behaviour Modelling. In Proceedings of the 27th ACM Conference on User Modeling, Adaptation and Personalization, Larnaca, Cyprus, 9–12 June 2019; pp. 349–352. [Google Scholar]
  7. Amato, F.; Moscato, V.; Picariello, A.; Ponti, G.; Sperlì, G. Influence Analysis in Business Social Media. In Proceedings of the MIDAS@ PKDD/ECML, Skopje, Macedonia, 18–22 September 2017; pp. 43–54. [Google Scholar]
  8. Wang, F.; She, J.; Ohyama, Y.; Jiang, W.; Min, G.; Wang, G.; Wu, M. Maximizing positive influence in competitive social networks: A trust-based solution. Inf. Sci. 2021, 546, 559–572. [Google Scholar] [CrossRef]
  9. Li, G.; Dong, M.; Yang, F.; Zeng, J.; Yuan, J.; Jin, C.; Hung, N.Q.V.; Cong, P.T.; Zheng, B. Misinformation-oriented expert finding in social networks. World Wide Web 2020, 23, 693–714. [Google Scholar] [CrossRef]
  10. Wu, D.; Fan, S.; Yuan, F. Research on pathways of expert finding on academic social networking sites. Inf. Process. Manag. 2021, 58, 102475. [Google Scholar] [CrossRef]
  11. Qi, G.J.; Aggarwal, C.; Tian, Q.; Ji, H.; Huang, T. Exploring Context and Content Links in Social Media: A Latent Space Method. IEEE Trans. Pattern Anal. Mach. Intell. 2012, 34, 850–862. [Google Scholar] [CrossRef]
  12. Jin, X.; Luo, J.; Yu, J.; Wang, G.; Joshi, D.; Han, J. Reinforced Similarity Integration in Image-Rich Information Networks. IEEE Trans. Knowl. Data Eng. 2013, 25, 448–460. [Google Scholar] [CrossRef]
  13. Zhu, Z.; Su, J.; Kong, L. Measuring influence in online social network based on the user-content bipartite graph. Comput. Hum. Behav. 2015, 52, 184–189. [Google Scholar] [CrossRef]
  14. Chen, H.; Yin, H.; Chen, T.; Wang, W.; Li, X.; Hu, X. Social Boosted Recommendation with Folded Bipartite Network Embedding. IEEE Trans. Knowl. Data Eng. 2020. online ahead of print. [Google Scholar] [CrossRef]
  15. Zhang, J.; Yang, Y.; Tian, Q.; Zhuo, L.; Liu, X. Personalized Social Image Recommendation Method Based on User-Image-Tag Model. IEEE Trans. Multimed. 2017, 19, 2439–2449. [Google Scholar] [CrossRef]
  16. Hu, Q.; Han, Z.; Lin, X.; Huang, Q.; Zhang, X. Learning peer recommendation using attention-driven CNN with interaction tripartite graph. Inf. Sci. 2019, 479, 231–249. [Google Scholar] [CrossRef]
  17. Liao, X.; Zheng, D.; Cao, X. Coronavirus pandemic analysis through tripartite graph clustering in online social networks. Big Data Min. Anal. 2021, 4, 242–251. [Google Scholar] [CrossRef]
  18. Anandkumar, A.; Sedghi, H. Learning mixed membership community models in social tagging networks through tensor methods. arXiv 2015, arXiv:1503.04567. [Google Scholar]
  19. Yang, D.; Qu, B.; Yang, J.; Cudre-Mauroux, P. LBSN2Vec++: Heterogeneous Hypergraph Embedding for Location-Based Social Networks. IEEE Trans. Knowl. Data Eng. 2020. online ahead of print. [Google Scholar] [CrossRef]
  20. Zheng, X.; Luo, Y.; Sun, L.; Ding, X.; Zhang, J. A novel social network hybrid recommender system based on hypergraph topologic structure. World Wide Web 2018, 21, 985–1013. [Google Scholar] [CrossRef]
  21. Chakraborty, T.; Dalmia, A.; Mukherjee, A.; Ganguly, N. Metrics for community analysis: A survey. ACM Comput. Surv. (CSUR) 2017, 50, 54. [Google Scholar] [CrossRef]
  22. Cavallari, S.; Cambria, E.; Cai, H.; Chang, K.; Zheng, V. Embedding both finite and infinite communities on graph. IEEE Comput. Intell. Mag. 2019, 14, 39–50. [Google Scholar] [CrossRef]
  23. Danon, L.; Diaz-Guilera, A.; Duch, J.; Arenas, A. Comparing community structure identification. J. Stat. Mech. Theory Exp. 2005, 2005, P09008. [Google Scholar] [CrossRef]
  24. Lancichinetti, A.; Fortunato, S. Consensus clustering in complex networks. Sci. Rep. 2012, 2, 336. [Google Scholar] [CrossRef]
  25. Kovács, I.A.; Palotai, R.; Szalay, M.S.; Csermely, P. Community landscapes: An integrative approach to determine overlapping network module hierarchy, identify key nodes and predict network dynamics. PLoS ONE 2010, 5, e12528. [Google Scholar] [CrossRef] [Green Version]
  26. Vilcek, A. Deep Learning with K-Means Applied to Community Detection in Networks; CS224W Project Report; Golden Gate University: Stanford, CA, USA, 2014. [Google Scholar]
  27. Yang, L.; Cao, X.; He, D.; Wang, C.; Wang, X.; Zhang, W. Modularity Based Community Detection with Deep Learning. IJCAI 2016, 16, 2252–2258. [Google Scholar]
  28. Perozzi, B.; Al-Rfou, R.; Skiena, S. DeepWalk: Online Learning of Social Representations. In Proceedings of the 20th ACM SIGKDD International Conference on Knowledge Discovery and Data Mining, New York, NY, USA, 24–27 August 2014; Association for Computing Machinery: New York, NY, USA, 2014; pp. 701–710. [Google Scholar] [CrossRef] [Green Version]
  29. Wang, H.; Wang, J.; Wang, J.; Zhao, M.; Zhang, W.; Zhang, F.; Xie, X.; Guo, M. Graphgan: Graph representation learning with generative adversarial nets. In Proceedings of the AAAI Conference on Artificial Intelligence, New Orleans, LA, USA, 2–7 February 2018; Volume 32. [Google Scholar]
  30. Wang, J.; Cao, J.; Li, W.; Wang, S. CANE: Community-aware network embedding via adversarial training. Knowl. Inf. Syst. 2021, 63, 411–438. [Google Scholar] [CrossRef]
  31. Li, B.; Pi, D. Learning deep neural networks for node classification. Expert Syst. Appl. 2019, 137, 324–334. [Google Scholar] [CrossRef]
  32. Goodfellow, I.; Bengio, Y.; Courville, A. Deep Learning; MIT Press: Cambridge, MA, USA, 2016; Available online: http://www.deeplearningbook.org (accessed on 10 October 2021).
  33. Wang, D.; Cui, P.; Zhu, W. Structural deep network embedding. In Proceedings of the 22nd ACM SIGKDD International Conference on Knowledge Discovery and Data Mining, San Francisco, CA, USA, 13–17 August 2016; pp. 1225–1234. [Google Scholar] [CrossRef]
  34. Tang, J.; Qu, M.; Wang, M.; Zhang, M.; Yan, J.; Mei, Q. Line: Large-scale information network embedding. In Proceedings of the 24th International Conference on World Wide Web, Florence, Italy, 18–22 May 2015; pp. 1067–1077. [Google Scholar] [CrossRef] [Green Version]
  35. Thomee, B.; Shamma, D.A.; Friedland, G.; Elizalde, B.; Ni, K.; Poland, D.; Borth, D.; Li, L.J. YFCC100M: The new data in multimedia research. Commun. ACM 2016, 59, 64–73. [Google Scholar] [CrossRef]
  36. Tang, L.; Liu, H. Relational learning via latent social dimensions. In Proceedings of the 15th ACM SIGKDD International Conference on Knowledge Discovery and Data Mining, Paris, France, 28 June–1 July 2009; pp. 817–826. [Google Scholar] [CrossRef]
Figure 1. Example of an MSN with 4 users (yellow), 5 multimedia objects (green), 7 user–multimedia object relationships (orange), and 1 similarity relationship (blue).
Applsci 11 11447 g001
Figure 2. Example of a relevant path within the MSN defined in Figure 1.
Applsci 11 11447 g002
Figure 3. User-to-user sparse matrix related to the MSN shown in Figure 2.
Applsci 11 11447 g003
Figure 4. Architectural overview of the proposed convolutional neural network.
Applsci 11 11447 g004
Figure 5. Running time of the convolutional operation when varying the number of nodes.
Applsci 11 11447 g005
Figure 6. Running time of the convolutional operation when varying sparsity degree.
Applsci 11 11447 g006
Figure 7. Loss analysis when varying the number of kernels. (a) Loss analysis with 2 convolutional layers and 3 kernels using gradient descent without decaying. (b) Loss analysis with 2 convolutional layers and 10 kernels using gradient descent without decaying.
Applsci 11 11447 g007
Figure 8. Accuracy evaluation when removing different percentages of edges.
Applsci 11 11447 g008
Table 1. OSN models.
TypeRef.EntitiesApplication
Graph[11]Multimedia objects, conceptsMultimedia annotation
[12]Images, users, and tagsLink-based similarity
Bipartite[13]Users and contentsInfluence diffusion
[14]Users and contentsSocial recommendation
Tripartite[15]Users, tags, and imagesRecommendation
[16]Users, interaction behavior, and tagsRecommendation
[17]Users, Tweets, and topicsCoronavirus analysis
Hypergraph[18]Users, tags, and resourcesConsensus maximization
[19]Users, time, and POIsLocation prediction
[20]Users and itemsRecommendation
Table 2. Running time comparison among the proposed approach w.r.t. six different state-of-the-art models.
ModelDataset
Blogcatalog3Flickr
CNN41 min315 min
DeepWalk21 min159 min
SDNE47 min366 min
LINE42 min326 min
GraphGAN49 min382 min
CANE55 min432 min
DNNNC39 min298 min
Table 3. Performance of our approach w.r.t. DeepWalk, SDNE, LINE, GraphGAN, CANE, and DNNNC on the BlogCatalog3 dataset.
% Labeled Nodes10%30%60%90%
Micro-F1 (%)CNN30.5139.6744.7047.92
DeepWalk36.0039.6041.3042.00
SDNE31.1136.7041.8844.88
LINE30.4335.9941.4143.46
GraphGAN28.7839.0142.7144.76
CANE28.9939.2142.9845.01
DNNNC28.1538.9141.8944.59
Macro-F1 (%)CNN14.7224.9831.9235.12
DeepWalk21.3025.3027.6028.90
SDNE19.8824.9428.1131.22
LINE18.6724.8127.9130.64
GraphGAN17.8823.5429.8733.01
CANE18.1223.8530.0433.42
DNNNC17.5523.2129.4532.83
Table 4. Performance of our approach w.r.t. DeepWalk, SDNE, LINE, GraphGAN, CANE, and DNNNC on the Flickr dataset.
% Labeled Nodes1%3%6%9%
Micro-F1 (%)CNN25.9435.8839.4344.51
DeepWalk32.4035.9037.7038.50
SDNE23.7434.7637.8341.14
LINE23.0134.4437.7540.65
GraphGAN23.0133.1037.7742.32
CANE23.4733.4937.8942.54
DNNNC22.7932.9937.1442.16
Macro-F1 (%)CNN12.1520.9126.4629.74
DeepWalk14.0019.6022.9024.60
SDNE11.6919.8723.2926.13
LINE11.5219.7623.0125.78
GraphGAN13.9219.9125.6327.39
CANE14.0819.9725.7327.56
DNNNC13.7819.6625.2127.01
Publisher’s Note: MDPI stays neutral with regard to jurisdictional claims in published maps and institutional affiliations.

