Article

Biosynthesis of Zinc Oxide Nanoparticles Using Leaf Extract of Prosopis juliflora as Potential Photocatalyst for the Treatment of Paper Mill Effluent

1
Biology Department, Faculty of Science, King Khalid University, Abha 61321, Saudi Arabia
2
Department of Botany and Microbiology, Faculty of Science, South Valley University, Qena 83523, Egypt
3
Department of Chemistry, Faculty of Science, South Valley University, Qena 83523, Egypt
4
Department of Theriogenology, Faculty of Veterinary Medicine, South Valley University, Qena 83523, Egypt
5
Biology Department, College of Arts and Science, King Khalid University, Muhayl Asir 62529, Saudi Arabia
6
Biology Department, College of Science, Ibb University, Ibb 70270, Yemen
7
Botany Department, Faculty of Science, Aswan University, Aswan 81528, Egypt
8
Department of Horticulture, Faculty of Agriculture and Natural Resources, Aswan University, Aswan 81528, Egypt
9
School of Engineering, University of Petroleum and Energy Studies, Bidholi, Dehradun 248007, India
10
Physics Department, College of Science, Jouf University, Sakaka 72311, Saudi Arabia
11
Physics Department, Faculty of Science, South Valley University, Qena 83523, Egypt
*
Authors to whom correspondence should be addressed.
Appl. Sci. 2021, 11(23), 11394; https://doi.org/10.3390/app112311394
Submission received: 30 October 2021 / Revised: 27 November 2021 / Accepted: 29 November 2021 / Published: 1 December 2021

Abstract

:
This paper reports on the manufacture of ZnO nanoparticles (ZnO NPs) from Prosopis juliflora leaf extracts. Various methods of characterization were used, including X-ray diffraction (XRD), Fourier-transform infrared spectroscopy (FT-IR), scanning electron microscope (SEM), and transmission electron microscope TEM. ZnO NPs has a hexagonal wurtzite structure with a preferred orientation of 101 planes, according to XRD. The functional groups found in ZnO NPs isolated from leaves are responsible for the FT-IR peaks that correspond to them. The morphology of the produced nanoparticles is a sphere-like form, as shown in the SEM pictures. TEM examination revealed ZnO NPs with a size of 50–55 nm. These ZnO NPs were used to remediate pollutants in paper mill effluents, and they were able to remove 86% of the organic pollutants from the sample at 0.05 mg/L dose and reduce 89% of the organic pollutants during a 5-h reflex time. Meanwhile, for the photocatalysis of paper mill effluents, it has been noted that COD was removed by 74.30%, 63.23%, and 57.96% for the first, second, and third cycles, respectively.

1. Introduction

Environmental risks involved with harmful pollutants that exist in effluents are one of the most important concerns facing modern society [1]. Wastewater discharge from urban industrial activity is considered as a major pollutant source in natural habitats [2]. The paper industry is classified as one of the most water-use and wastewater-producing industries [2,3,4]. Paper mill effluent contains a high concentration of contaminants as pathogens, and heavy metals, as well as chlorinated organics, lignin, aromatic hydrocarbons, unsaturated fatty acids. which cause aquatic and non-aquatic life to deteriorate [2,3,5]. As a result, untreated paper mill effluent poses harm to the natural environment, requiring the development of a treatment approach. Chemical decomposition, coagulation, adsorption, and biological processes, as well as UV radiation disinfection, are applied for treating paper mill effluent [6]. These methods, however, have several significant drawbacks, chemicals used in chemical treatment operations, for example, have a high toxicity [7]. The reagents’ biocompatibility and biodegradability [3]. To combat the conventional limitations, nanotechnology has emerged as an alternative efficient and effective method for wastewater treatment [8]. The majority of nanomaterials research has concentrated on nanoparticles because they are easy to prepare. Metal nanoparticles have gotten a lot of considerable attention in recent decades because of their wide range of uses in medicine, biology, physics, chemistry, and materials science [9]. ZnO nanoparticles are recognized to be one of the more useful nano sizes. ZnO is important for industrial and medical applications due to its wide bandgap and strong excitonic binding energy [10].
Photocatalysis is a term that refers to the combination of photochemistry and catalysis [11]. It means that a chemical reaction should be started or accelerated with assistance of light and a catalyst. To put it another way, photocatalysis is the “a photoreaction that is accelerated in the presence of a catalyst”. This definition covers photosensitization, which is a process in which one chemical species undergoes a photochemical change because of radiation absorption by another chemical species known as the photosensitizer. As a result of the above, heterogeneous photocatalysis involves photoreactions that take place on a catalyst’s surface. The process is known as sensitized photoreaction when the adsorbate is first photoexcited before interacting with the catalyst substrate’s ground state. If the catalyst is photoexcited first and then interacts with the ground state adsorbate molecule, the process is called a “catalyzed photoreaction”. Heterogeneous photocatalysis refers to semiconductor photocatalysis or semiconductor-sensitized photoreactions in most cases [12]. Due to various disadvantages of conventional techniques, such as the use of harmful compounds, the requirement of extremely high temperatures, high cost, and time consumption, research has recently turned to the development of clean and ecologically friendly synthesis protocols [13]. Because of its simplicity and environmentally friendly nature, plant-mediated biological nanoparticle synthesis is becoming more popular. Zinc oxide nanoparticles are biosynthesized by plant leaf extract like as Calotropis gigantean [14], Acalypha indica [15], Parthenium hysterophorus [16], Hibiscus rosasinensis [17]. Azadirachta indica [18], and Punica granatum [19].
Prosopis juliflora (Sw.) D.C. (Fabaceae—Mimosoideae), often known as mesquite, velvet mesquite, or Ghaf Bahri, is a tropical and subtropical tree that is invasive in many tropical and subtropical areas, including North Africa and the Arab Gulf region [20]. P. juliflora (Sw.) D.C, is often used and promoted as a food source for livestock due to its abundance, palatability and high protein content [21,22]. The goal of this study synthesis of zinc oxide nanoparticles from the P. juliflora by the green route method and evaluation of its photocatalyst activity for the treatment of paper mill effluent.

2. Materials and Methods

Fresh P. juliflora were collected from a rangeland farm, (26°11′00.6″ N–32°44′46.2″ E), The leaves were dried in oven at 60 °C for 48 h. The taxonomic identification was made by the Herbarium of Botany and Microbiology Department, South Valley University. Zinc acetate dihydrate Zn(O2CCH3)2 (Lot # MKBQ7110v) was obtained from Sigma-Aldrich, UK. The paper mill effluent was obtained from the South Egypt paper industry.

2.1. Preparation of P. juliflora Extract

About 20 g of cleaned P. juliflora leaves were put in 200 mL of boiled distilled water for ∼1 h at 50 °C with a magnetic stirrer. After cooling to room temperature, the mixture was centrifuged for 10 min at 6000 rpm before being decanted. The extract was filtered through (Whatman No. 1 filter paper).

2.2. Synthesis of the Targeted Zinc Oxide Nanoparticles

The zinc salts (zinc acetate) (2.5 g), were completely dissolved in distilled water and then treated with plant extract in sun light using magnetic stirrer at 50 °C. However, there was an evident precipitate, indicating that any zinc complex formation was in the form of a suspension. Accordingly, the mixture was centrifuged at 6000 rpm for 10 min and washed one time with distilled water and one time with ethanol to get remove of any residual extract. The obtained powders were subjected to a heat treatment at 600 °C for 2 h.

2.3. Characterization of the Synthesized Zinc-Based Nano Particles

2.3.1. X-ray Diffraction (XRD)

X-ray diffraction was used to investigate the formation and quality of compounds. Synthesized zinc oxide NPs were centrifuged (1400 rpm; 8 °C) for 15 min, then washed three times in ethanol before being washed three times with sterile Milli-Q water. ZnO NPs were cleaned and pulverized using a ceramic mortar–pestle in a 60 °C oven. An X-ray diffractometer (X’Pert PROPAN Analytical, Europe) was used to analyze the powdered sample of characteristic Co-kα1 radiation (λ = 1.78 Å) in the range of 20° to 90° at a scan rate of 0.05°/min with the time constant of 2 s.

2.3.2. Fourier-Transform Infrared Spectroscopy (FT-IR)

FT-IR was used to identify the possible functional groups involved in zinc ion reduction and capping of reduced zinc oxide nanoparticles. Shimadzu’s infrared (IR) doublebeam spectrophotometer was used to record the FT-IR spectrum. The spectra of dried ZnO nanoparticles (NPs) was recorded in transmittance mode at a resolution of 4 cm−1 using the potassium bromide (KBr) pellet method in 1:30 ratios (NPs:KBr). The resulting peaks (stretching) were plotted on the Y-axis as the transmittance and the X-axis as the wave number (cm−1). The spectrum was recorded in the 500–4500 cm−1 wavenumber range and analyzed by removing the pure KBr spectrum.

2.3.3. Transmission Electron Microscopy (TEM)

Transmission electron microscopy (TEM) was used to examine the structural characteristics and particle size of zinc oxide nanoparticles (JEM-1230, JEOL, Akishima, Japan). The samples were placed on the carbon-coated copper grid for 1 min to form a thin coating. A filter paper was used to remove the extra liquid, which was then placed in a grid box in order.

2.3.4. SEM Analysis

Scanning electron microscopy (SEM) analysis was carried out using a Carl Zeiss Japan model machine. Thin film of nanoparticle powder sample was established on carbon-coated tape, a small amount of dried fine powder of the sample adhered to the grid, and blotting paper was used to remove any excess material. After 5 min under a mercury lamp, the film on the SEM grid was allowed to dry. The surface structure of biogenically produced ZnO NPs was determined by SEM analysis.

2.3.5. Energy-Dispersive X-ray Spectroscopy

The sample used for SEM was used as it was and the same instrument that was used. EDX analysis was carried out to determine the chemical purity, elemental composition, and stoichiometry of the synthesized zinc oxide nanoparticles.

2.4. Photocatalytic Experiments

With 0.05 g of ZnO NPs add to 100 mL pollutant (0.5 g/L), the action of photocatalysis of the produced ZnO nanospheres was studied under sunlight. To verify the adsorption efficiency, the experiment was first carried out in the dark for 1, 2, 3, 4, and 5 h with constant stirring. The reaction mixture was then kept under a sunlight radiation, to examine the photocatalytic activity. photocatalytic reactor was measured the value of chemical oxygen demand (COD). The initial value of paper mill water was 450 mg/L. Varying concentrations 100, 300, 500, 1000 and 1500 mg/L of the ZnO NPs. The shaking of the reaction system was carried out at 200 rpm for various time intervals (1, 2, 3, 5, and 6 h). The values of pollution indicators of paper mill effluents were measured before and after the adsorption process under all of the adsorption proposed approach is evaluated here, and then the percent reduction of pollution reduction (percent PR) was calculated as follows:
%   P R = P R i P R f P R i × 100
where P R i is the value of pollution before starting the photocatalyst process, and P R f is the value of pollution indicator after the contact with photocatalyst process for time t.

2.5. The Reusability of ZnO NPs

ZnO NPs were tested for their reusability as a photocatalyst for the degradation of COD. After the reaction, the ZnO NPs were separated by centrifugation at 10,000 rpm for 25 min, washed three times with doubly distilled water, dried for two min at 100 °C, and maintained for the next reaction [23].

2.6. Statistical Analysis

One-way analysis of variance (ANOVA) was used to test the statistical significance between groups. SPSS (San Diego, CA, USA) was used.

3. Results and Discussion
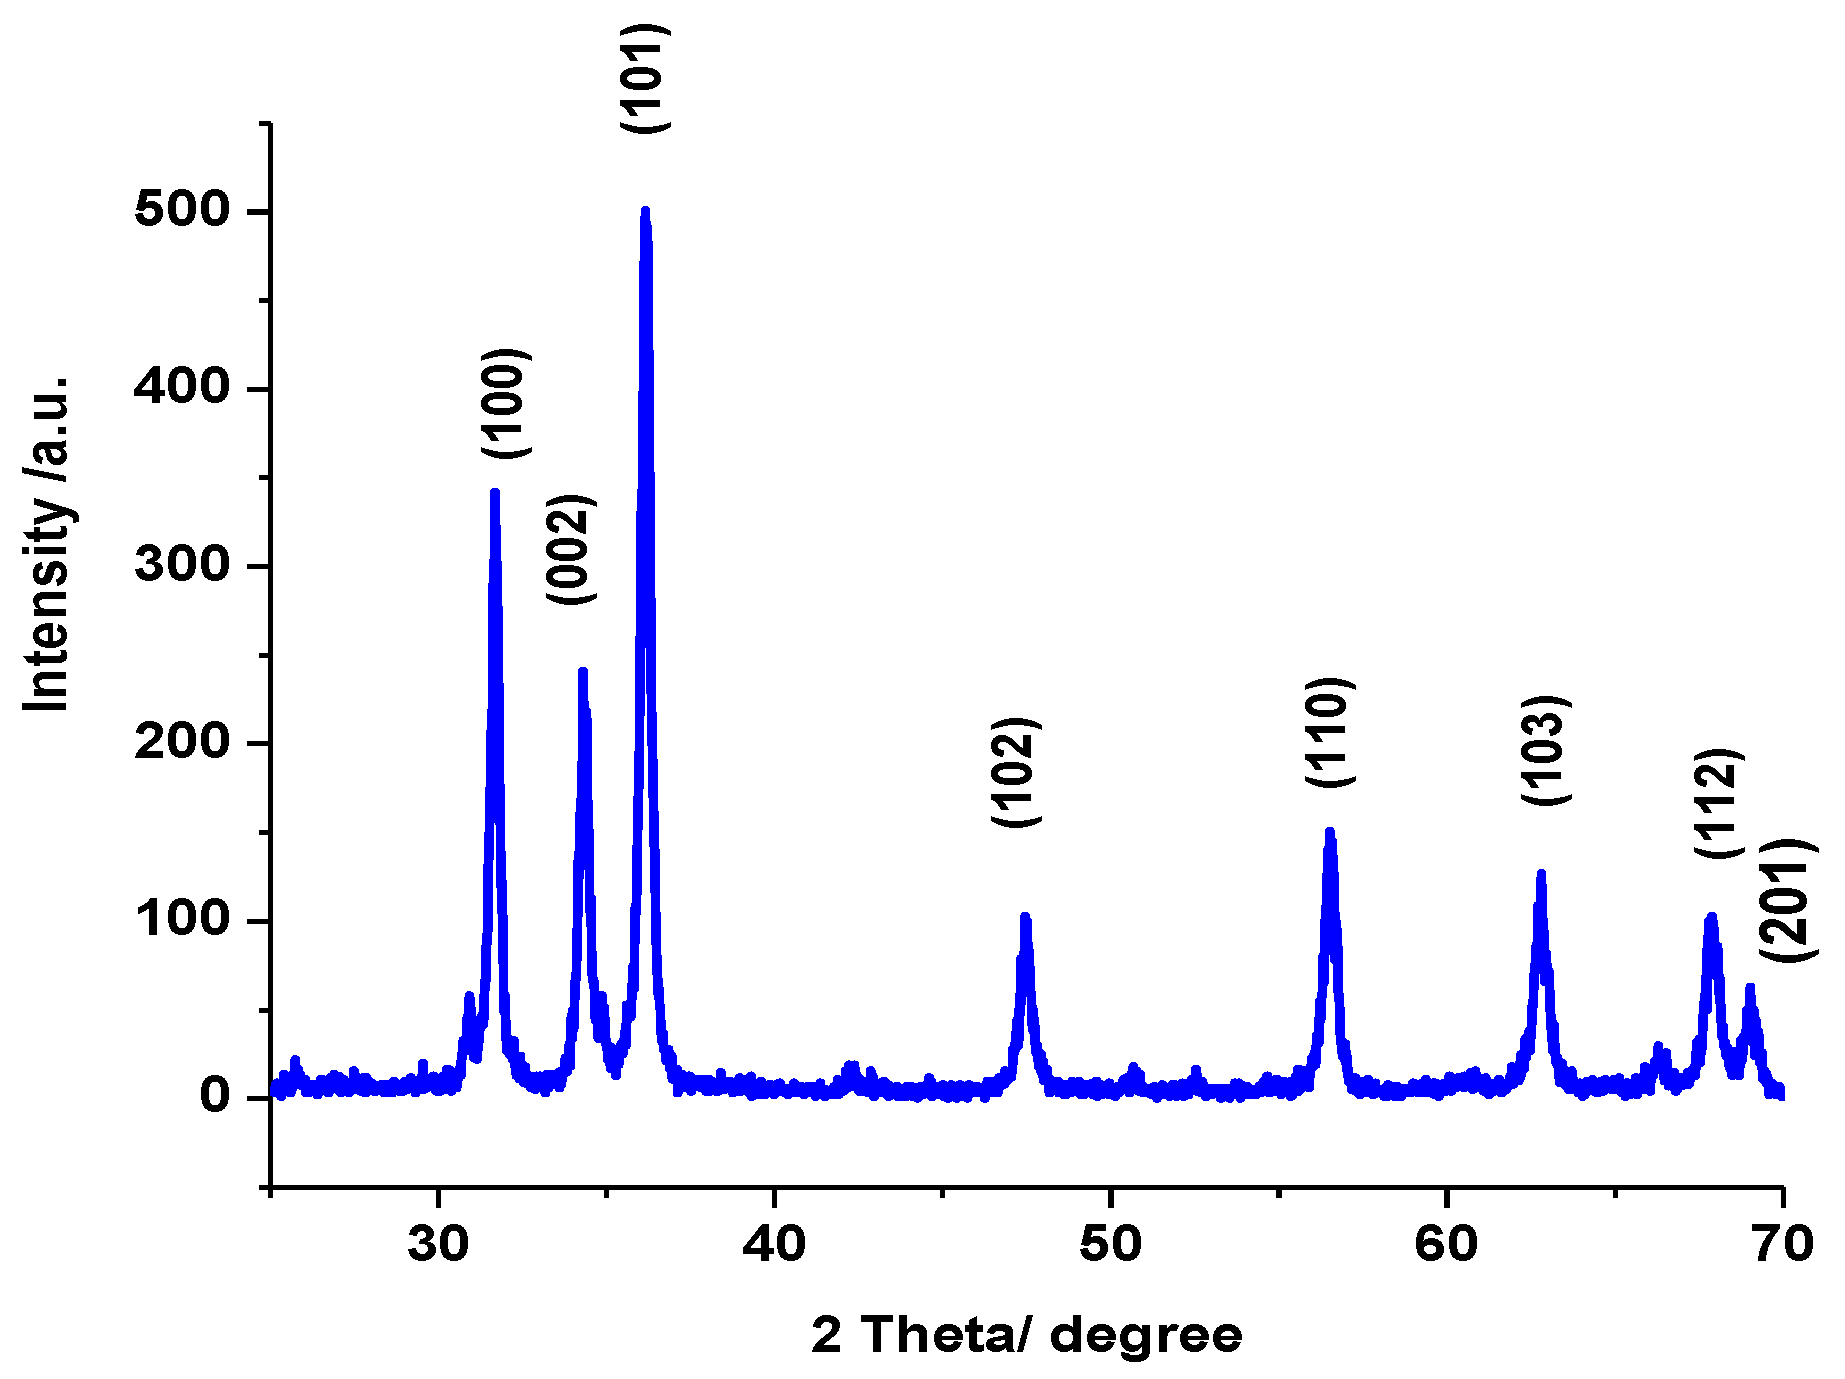
3.1. XRD

Figure 1 shows the powder X-ray diffraction pattern of ZnO. The XRD peaks had a specific line sharpness, indicating that the formed material particles had a good crystal structure. The presence of characteristic diffraction peaks in ZnO was proved by XRD patterns. Figure 1 depicts the X-ray diffraction (XRD) pattern required to validate the structure of ZnO NPs with a wurtzite structure. The crystalline nature of ZnO NPs is indicated by the intensity of peaks diffraction. The diffraction peaks at 31.69°, 34.34°, 36.18°, 47.51°, 56.53°, 62.78°, 67.84°, and 68.99° indicate (1 0 0), (0 0 2), (10 1), (1 0 2), (1 1 0), (1 0 3), (1 1 2) and (2 0 1) planes, respectively, of the ZnO similar to the standard data of the JCPDS card number: 36-1451. The calculated average crystalline size of the ZnO NPs was determined using Debye–Scherrer’s formula [24]:
t = 0.9λ/βCosθ
where λ is the wavelength, β is the full width at half maximum (FWHM), and θ is the diffraction angle. The calculated crystalline size of the ZnO NPs, the strain, and cell parameter are listed in Table 1. The crystallite size of prepared ZnO nanoparticles was calculated around 33 nm; additionally, the lattice parameters (a, c) were found to be about 3.25 and 5.2, respectively.

3.2. Structure Refinements

X-ray powder diffraction with the Rietveld refinement method was used to acquire the atomic locations, and the zinc site was shown to be connected to the oxygen content. The FULLPROF Rietveld type program was used to model the least-squares structural refinements. The observed, calculated, and various profiles for the final Rietveld refinement for biogenically produced ZnO nanoparticles are plotted in Figure 2. (NPs). The blue line in Figure 2 depicts the agreement between the observations and the model as the Rietveld refinements progressed. The analysis is carried out using the P63mc space group for the hexagonal Wurtzite structure. The pseudo-voigt function is used to fit the XRD data’s various parameters. The refining parameters of biogenically generated ZnO nanoparticles (NPs), the following parameters were determined and are listed in Table 2: occupancy, atomic functional position, crystal system, space group, cell parameter, and cell volume. The lattice parameters (a, c) were found to be around 3.22 and 5.2. The volume of the cell is 47.5 A. ZnO Nps has a hexagonal wurtzite structure and is extremely crystalline, according to the final Rietveld refinement study for the XRD pattern [25].

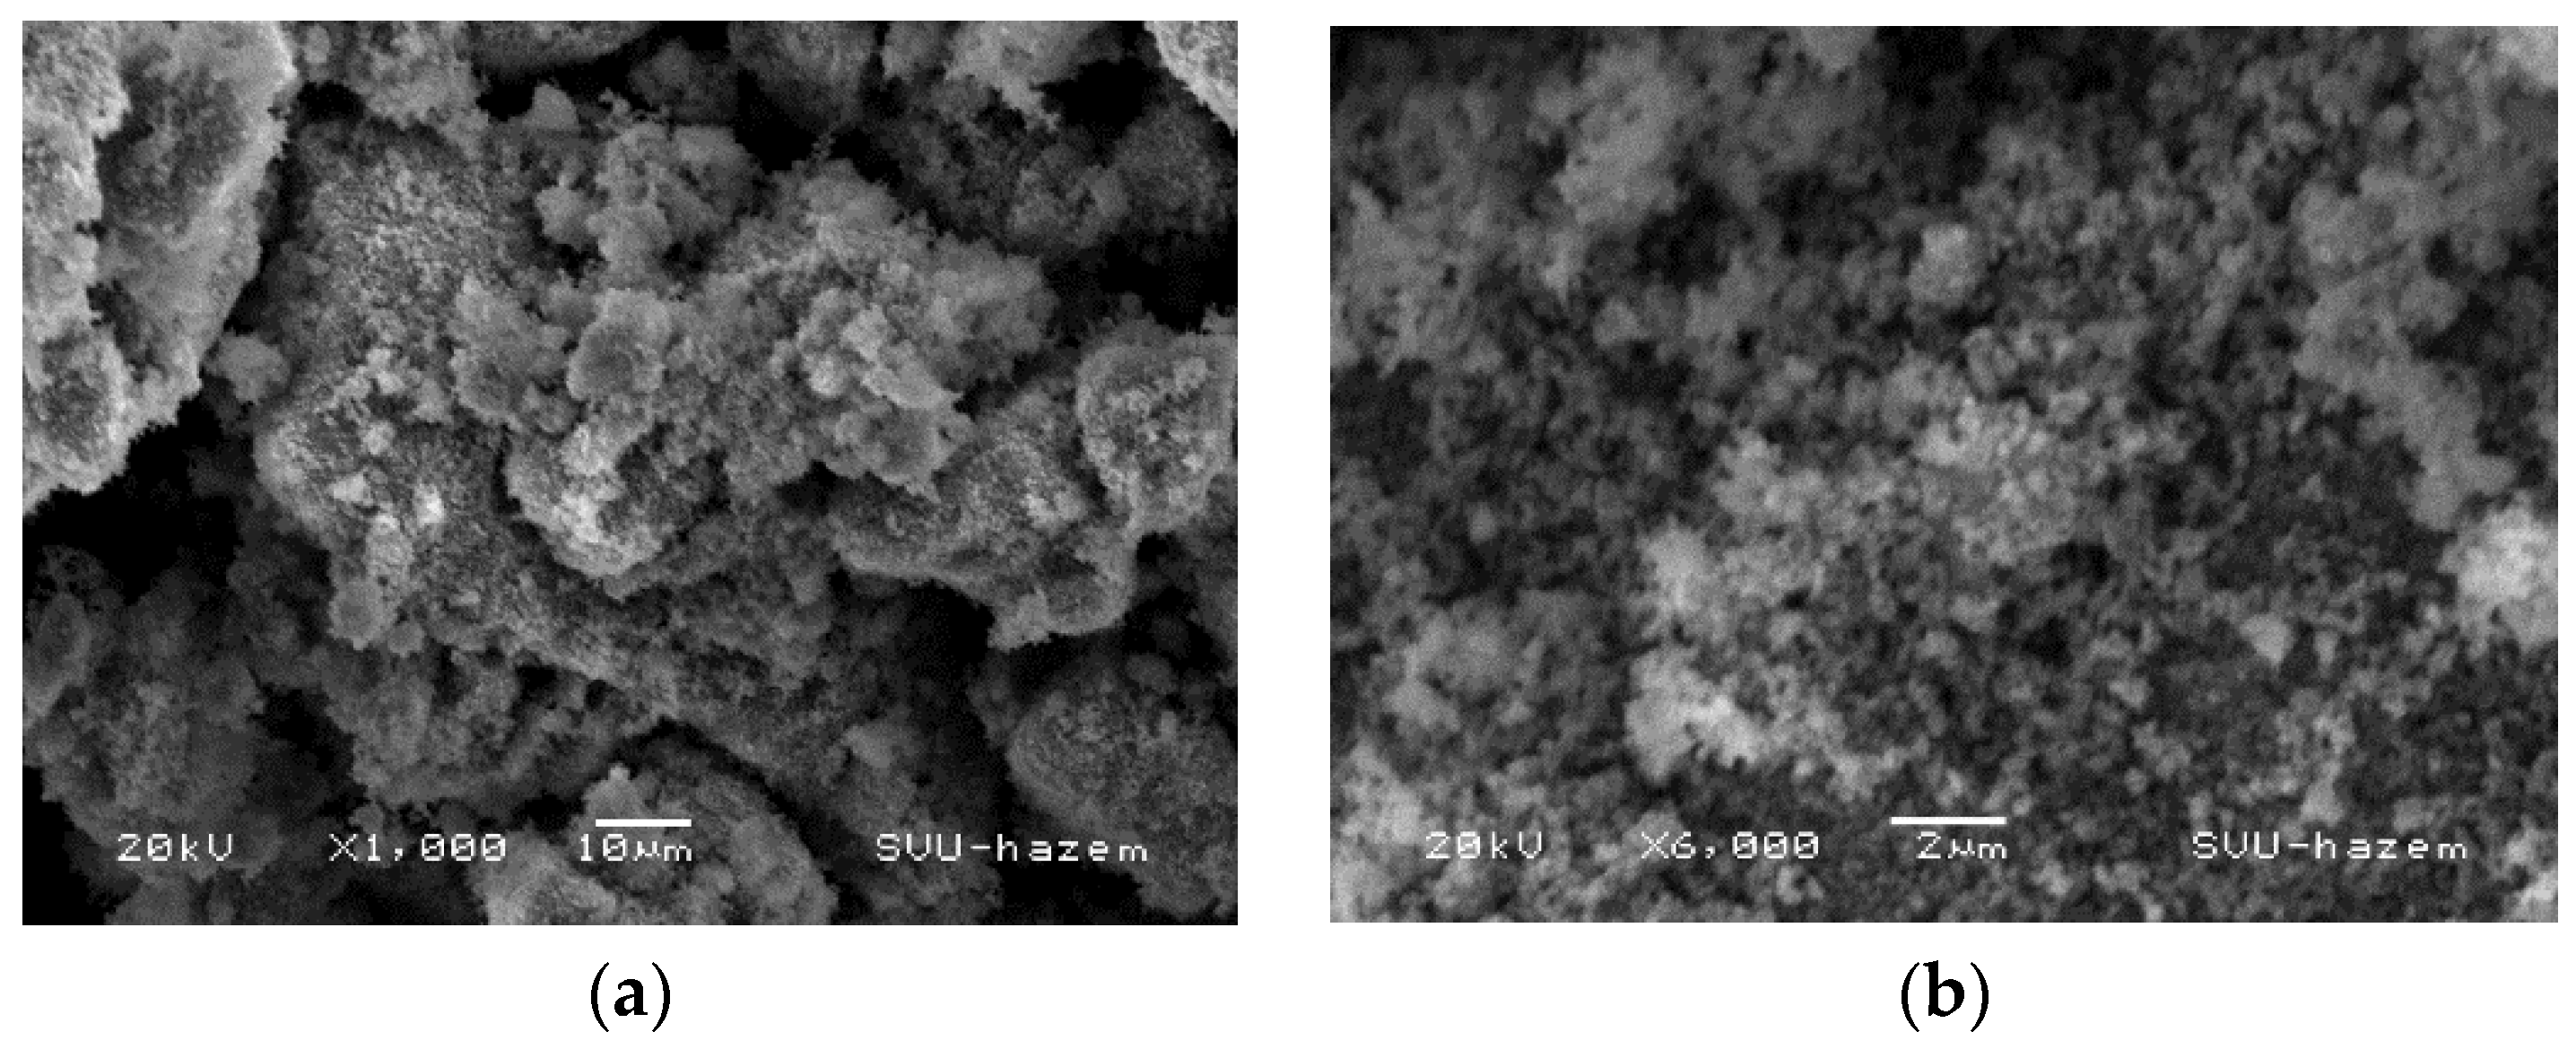
3.3. SEM Study and Nanoparticle

The typical SEM images of the sample at 10 μm and 2 μm are shown in Figure 3a,b. The photographs show the sample’s morphology, which is prone to aggregation due to the spherical and granular nature of the surface area to volume ratio for both resolutions. Because of the nanostructure’s bigger particle size, the dye attached to it has a larger surface area, allowing more light to be absorbed and captured. Furthermore, the ZnO format enables electrons to move across the cell in direct routes, enhancing the rate of energy conversion, shown in Figure 3.

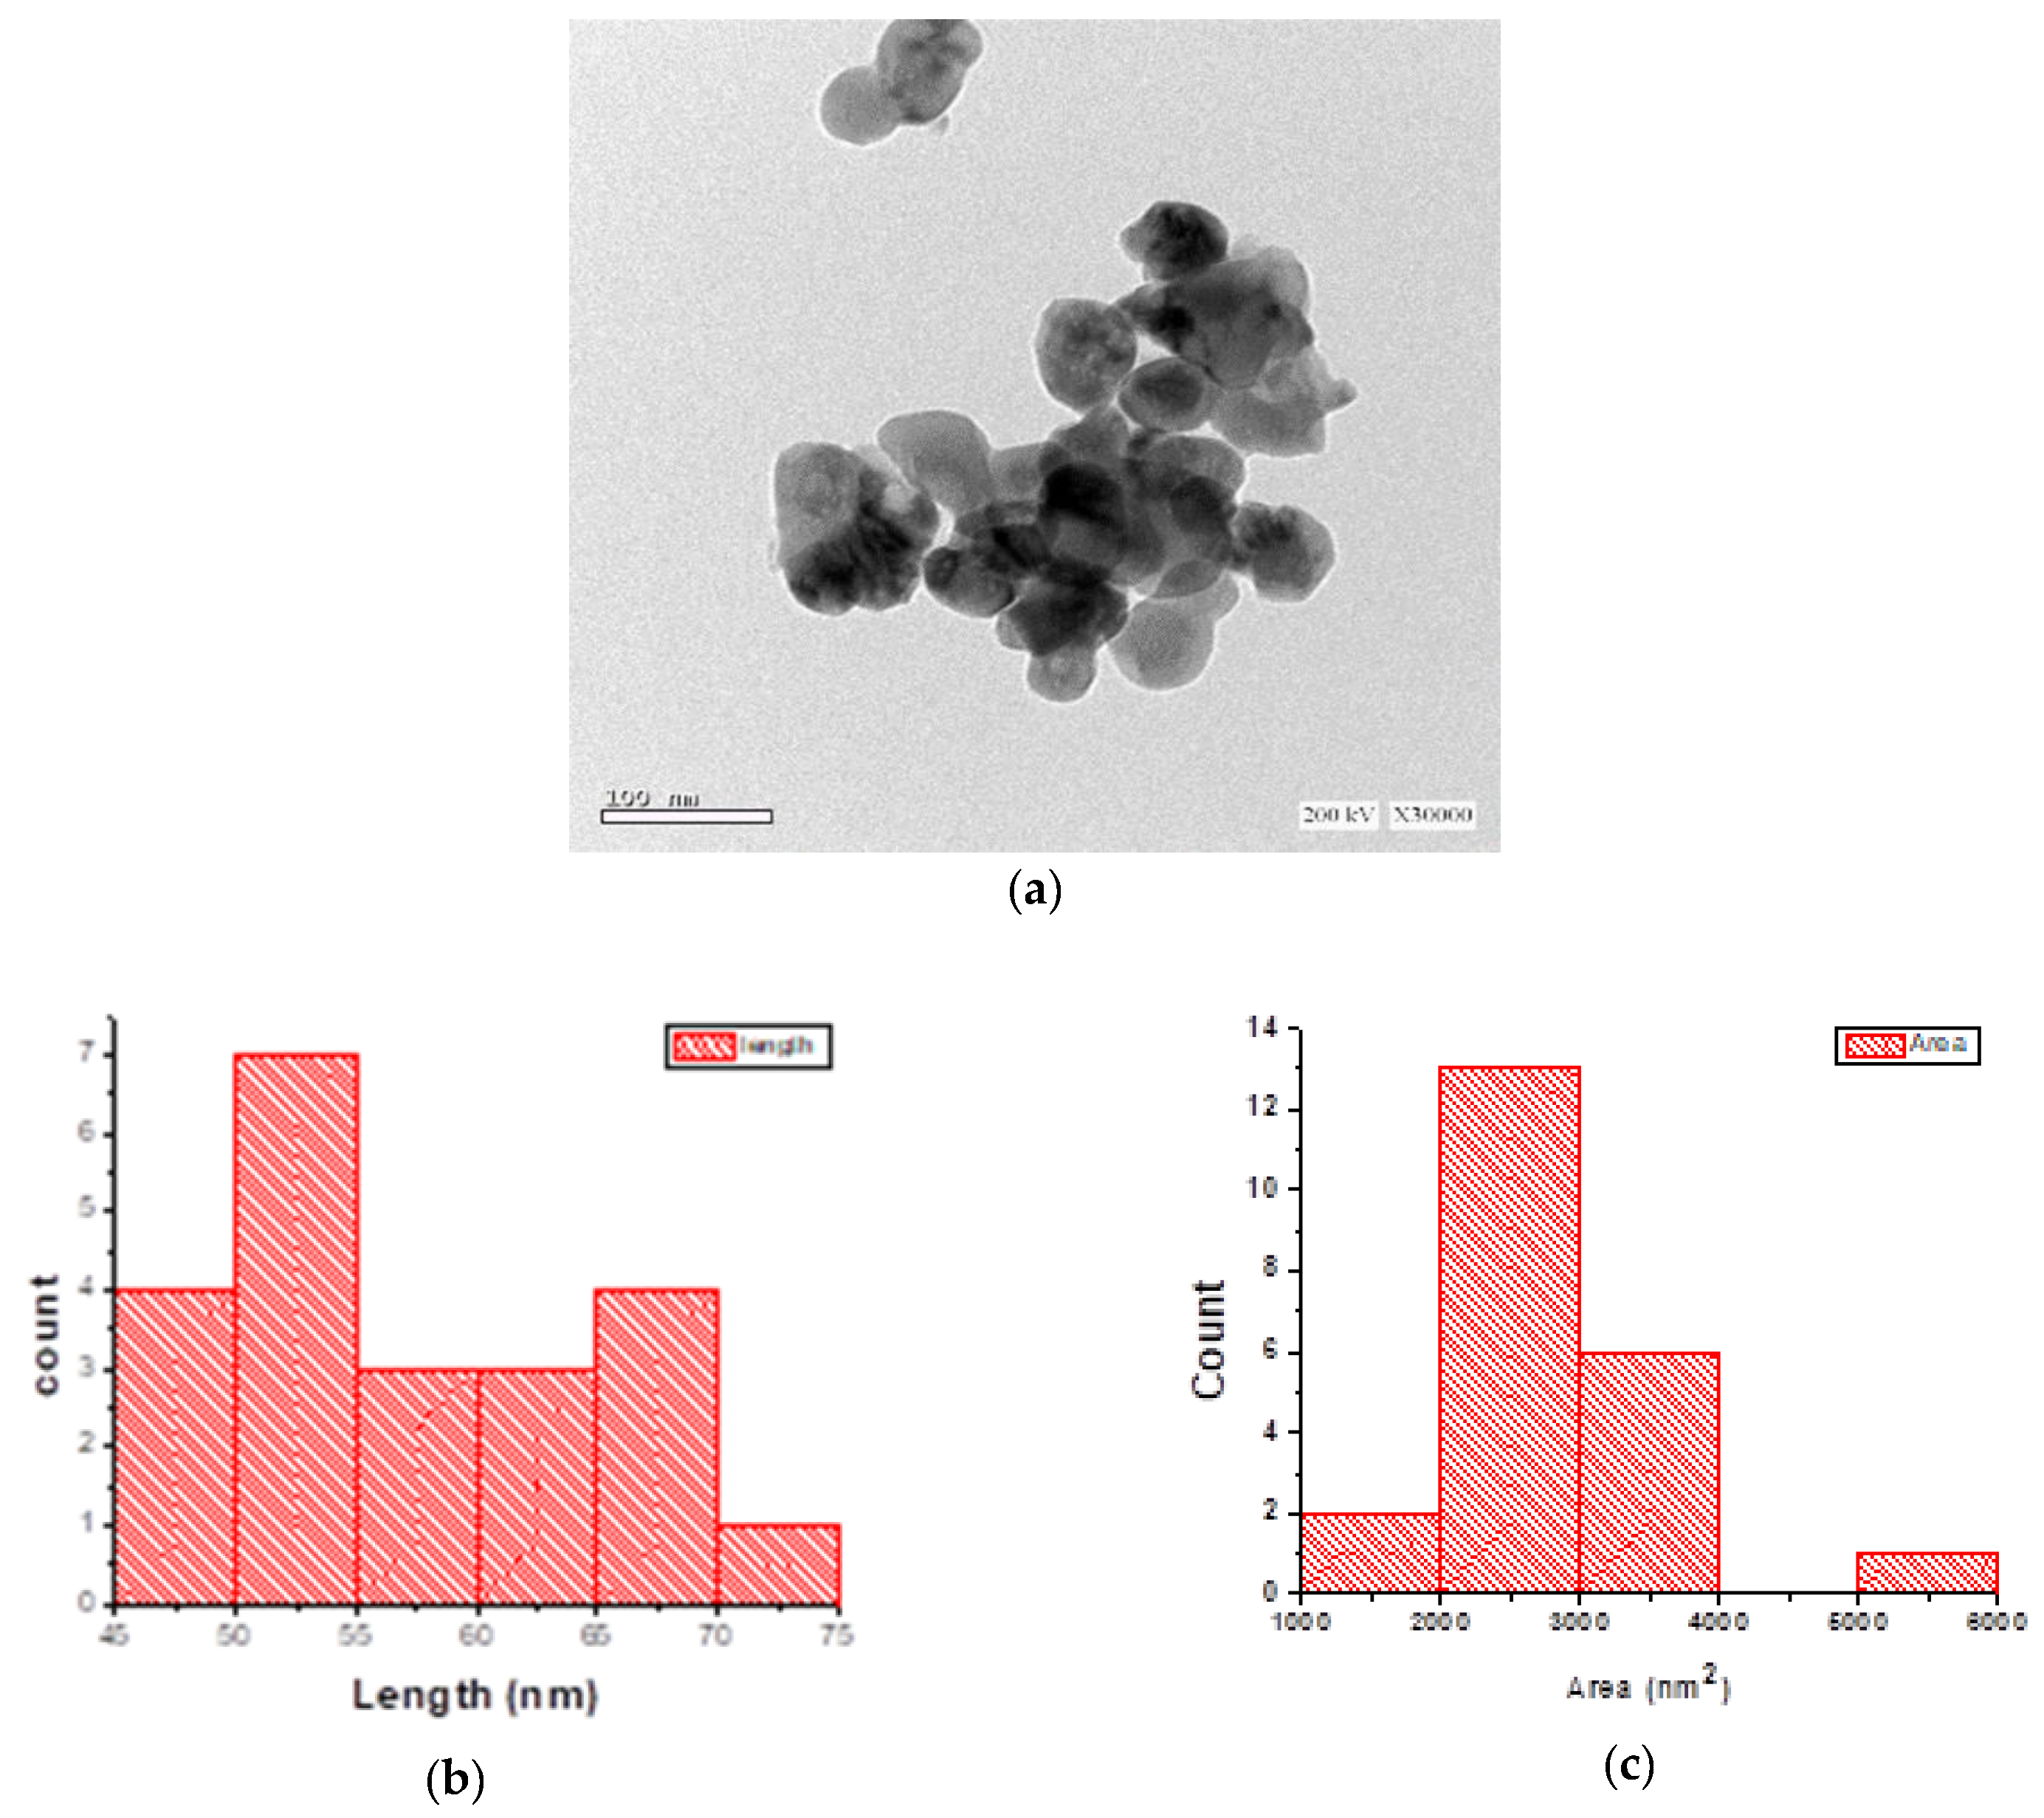
3.4. TEM Study and Nanoparticle

Figure 4 shows TEM images of the produced ZnO Nps, which reveal a spherical morphology, all particles less than 75 nm in size, and some agglomerated particles. The particle diameters range from 45 to 75 nanometers. Figure 4b,c show the particle size distribution histograms for the nb-ZnO particle size and the Np-ZnO particle area, respectively. The average particle size of Np-ZnO is bigger, with an average size of 50–55 nm and an average area of 2000–3000 nm2. The TEM image of Np-ZnO in (Figure 4a) shows that the material has high crystallinity.

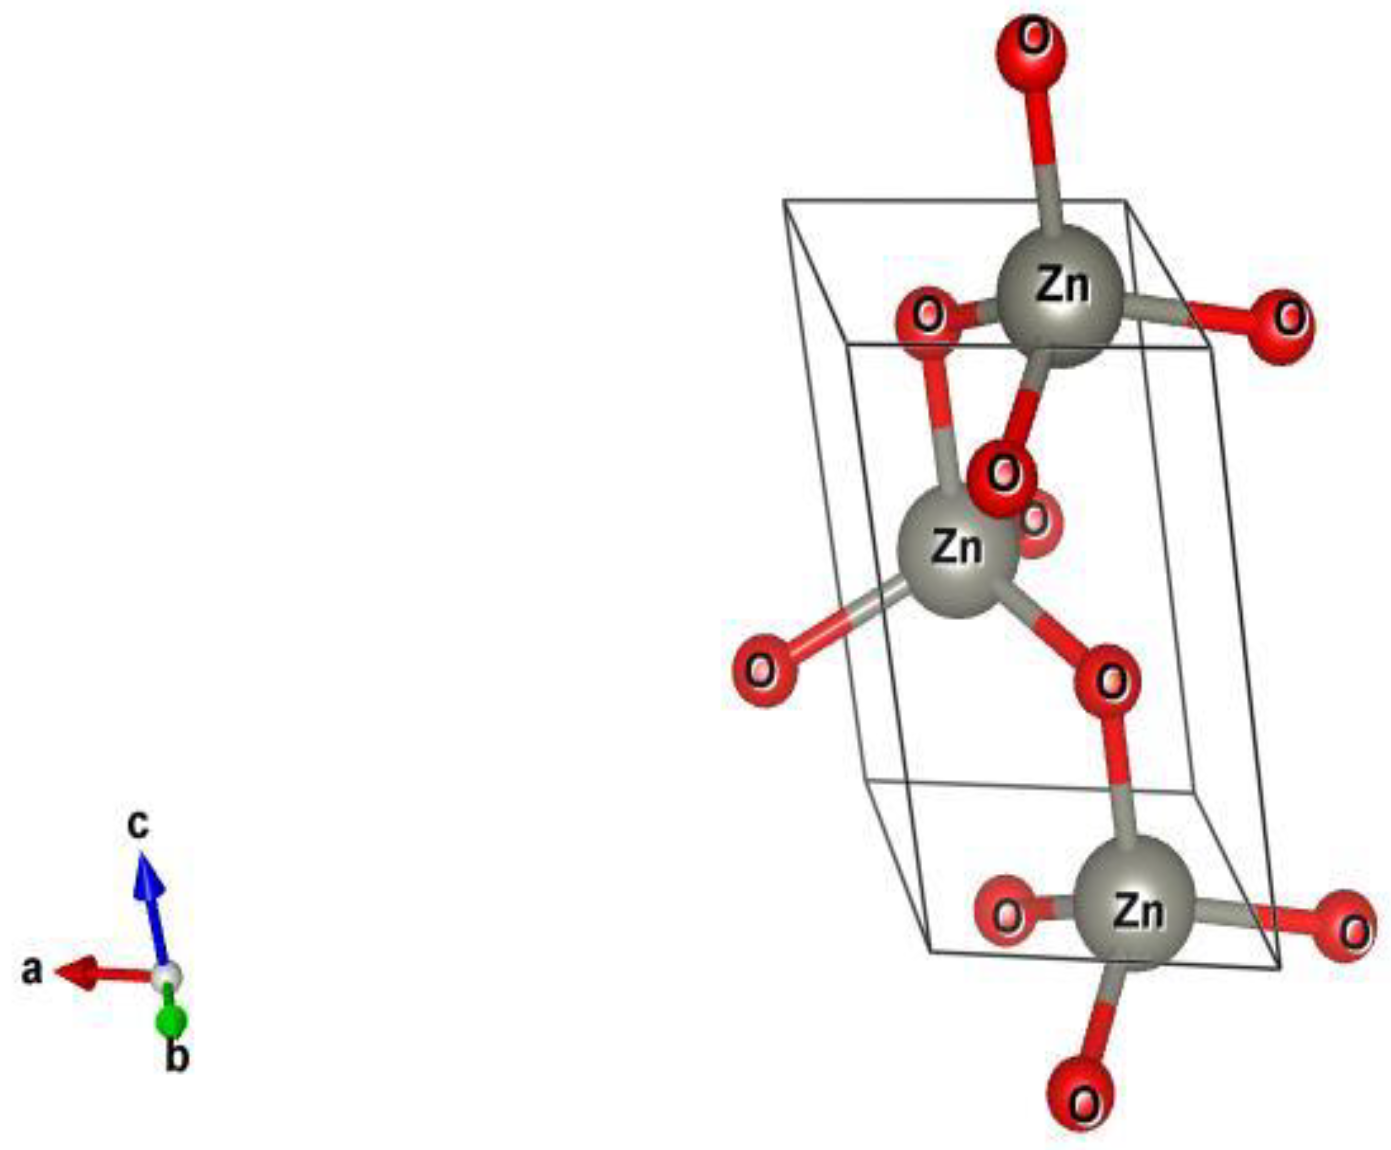
3.5. The Crystal Structure of Hexagonal Wurtzite ZnO NPs
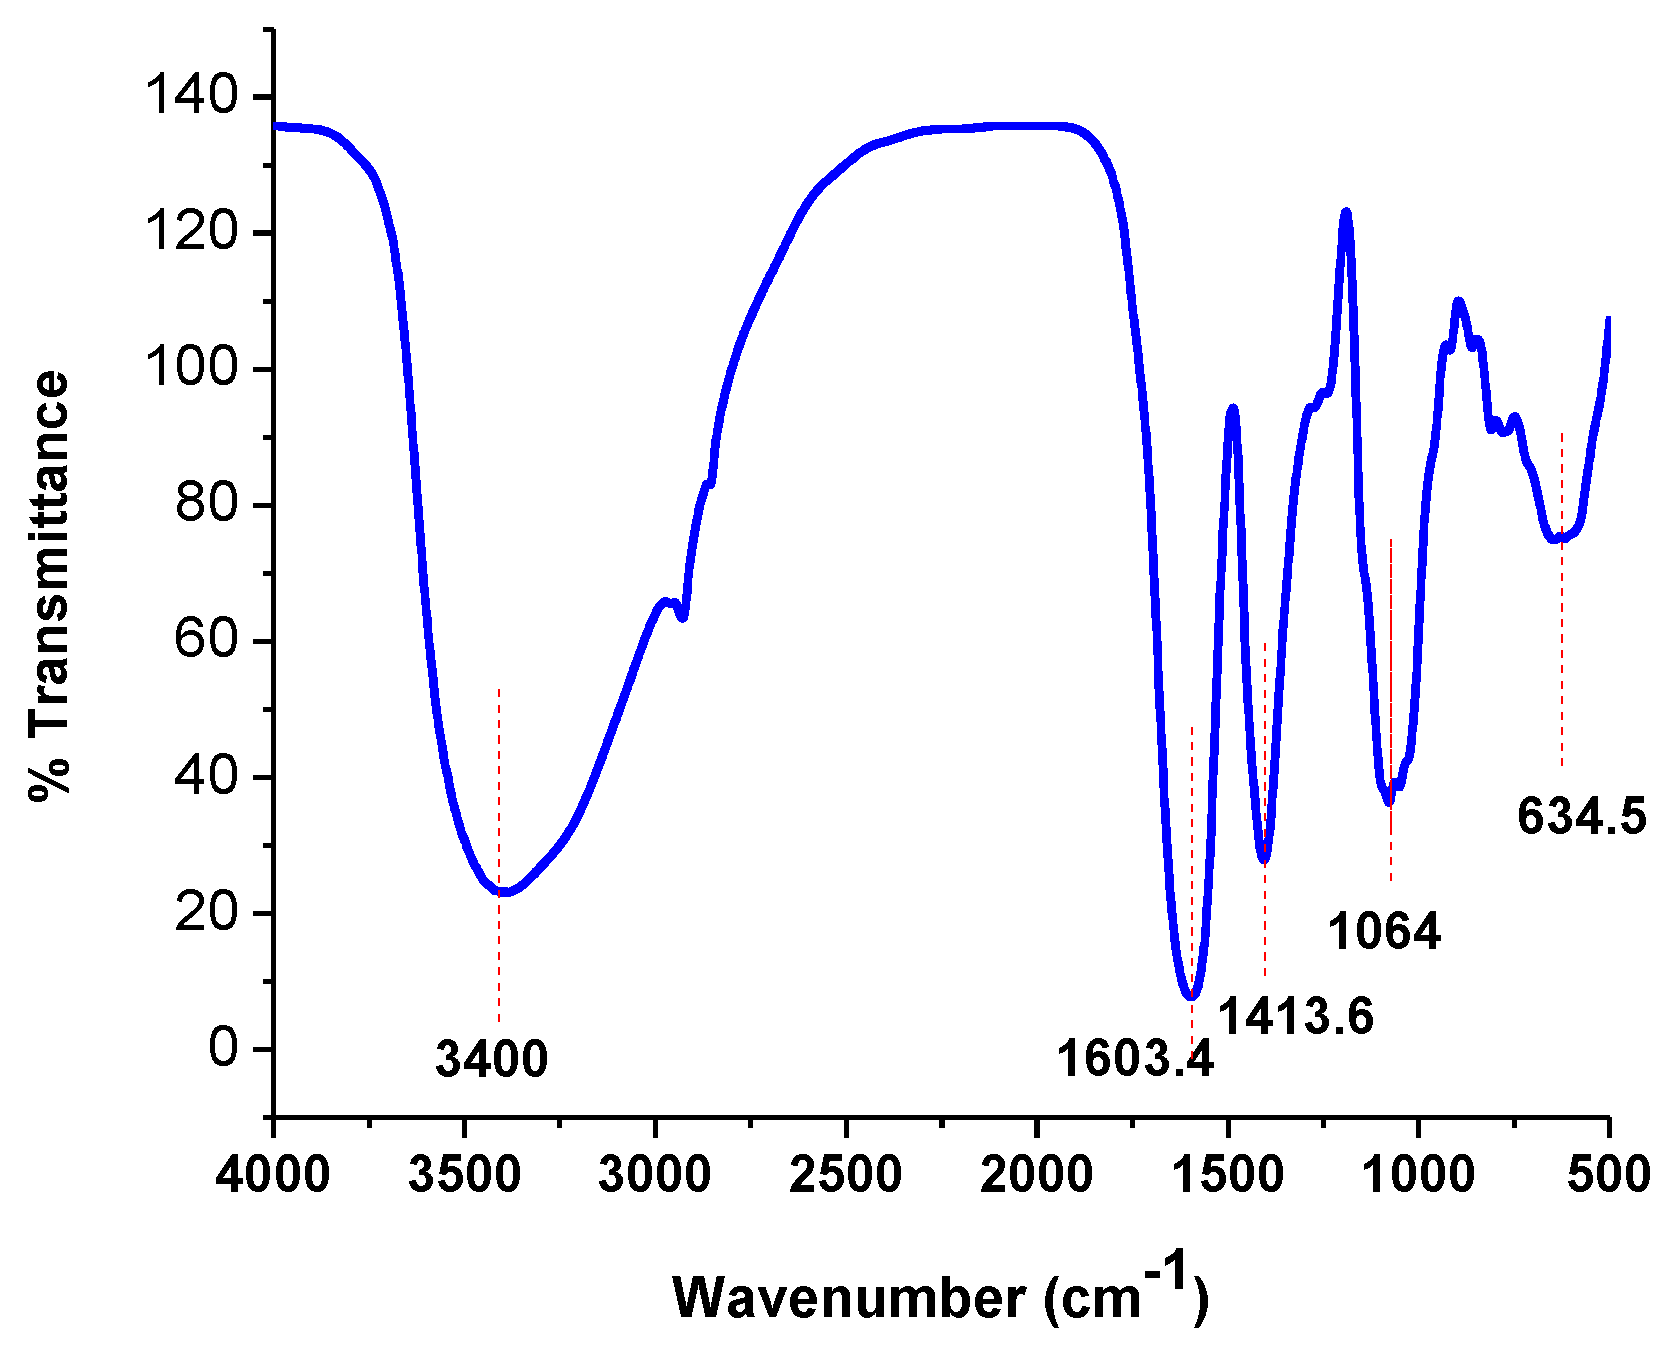
The final Rietveld refinement settings were used to standardize crystal structure and fractional coordinates modeled by the VESTA (visualization for electronics and structural analysis) tool, as illustrated in Figure 5 [26] ZnO NPs have a well-known crystal structure of hexagonal wurtzite, which corresponds to the space group P63mc. The hexagonal unit cell of wurtzite has two lattice parameters, a and c, with a ratio of c/a = 1.6. (in an ideal wurtzite structure). Figure 5 shows a schematic representation of the wurtzitic ZnO structural model with the final Rietveld refinement parameters. The structure is made up of two interpenetrating hexagonal close packed (hcp) sublattices, each of which is made up of one kind of atom displaced by u = 3/8 = 0.375 along the three-fold of the c-axis, as shown in Table 2 (in fractional coordinates in an ideal wurtzite structure). The internal parameter u is the length of the link parallel to the c-axis (anion–cation bond length or nearest-neighbor distance) divided by the c lattice parameter.

3.6. FTIR Study

The existence of functional groups in the samples was confirmed by Fourier-transform infrared spectroscopy, which also revealed evidence of intramolecular and intermolecular interactions. Figure 6 showed the FT-IR spectral peaks of green technique manufactured ZnO-NPs in the range of 4000–500 cm−1. The typical vibrational mode of Zn-O bonding is given to a band at 634.5 cm−1. The asymmetry and symmetry vibrations of the –COOH group and C-N stretch, respectively, correspond to the peaks near 1413.6 cm−1 and 1064 cm−1. C=O stretching could be linked to the band at 1603 cm−1. The absorbed moisture [27] is responsible for the large peak at 3400 cm−1. The activity of P. juliflora leaf extracts identified a strong and high-intensity peak of Zn-O band generated by green manufactured nanoparticles.

3.7. Photocatalytic Studies

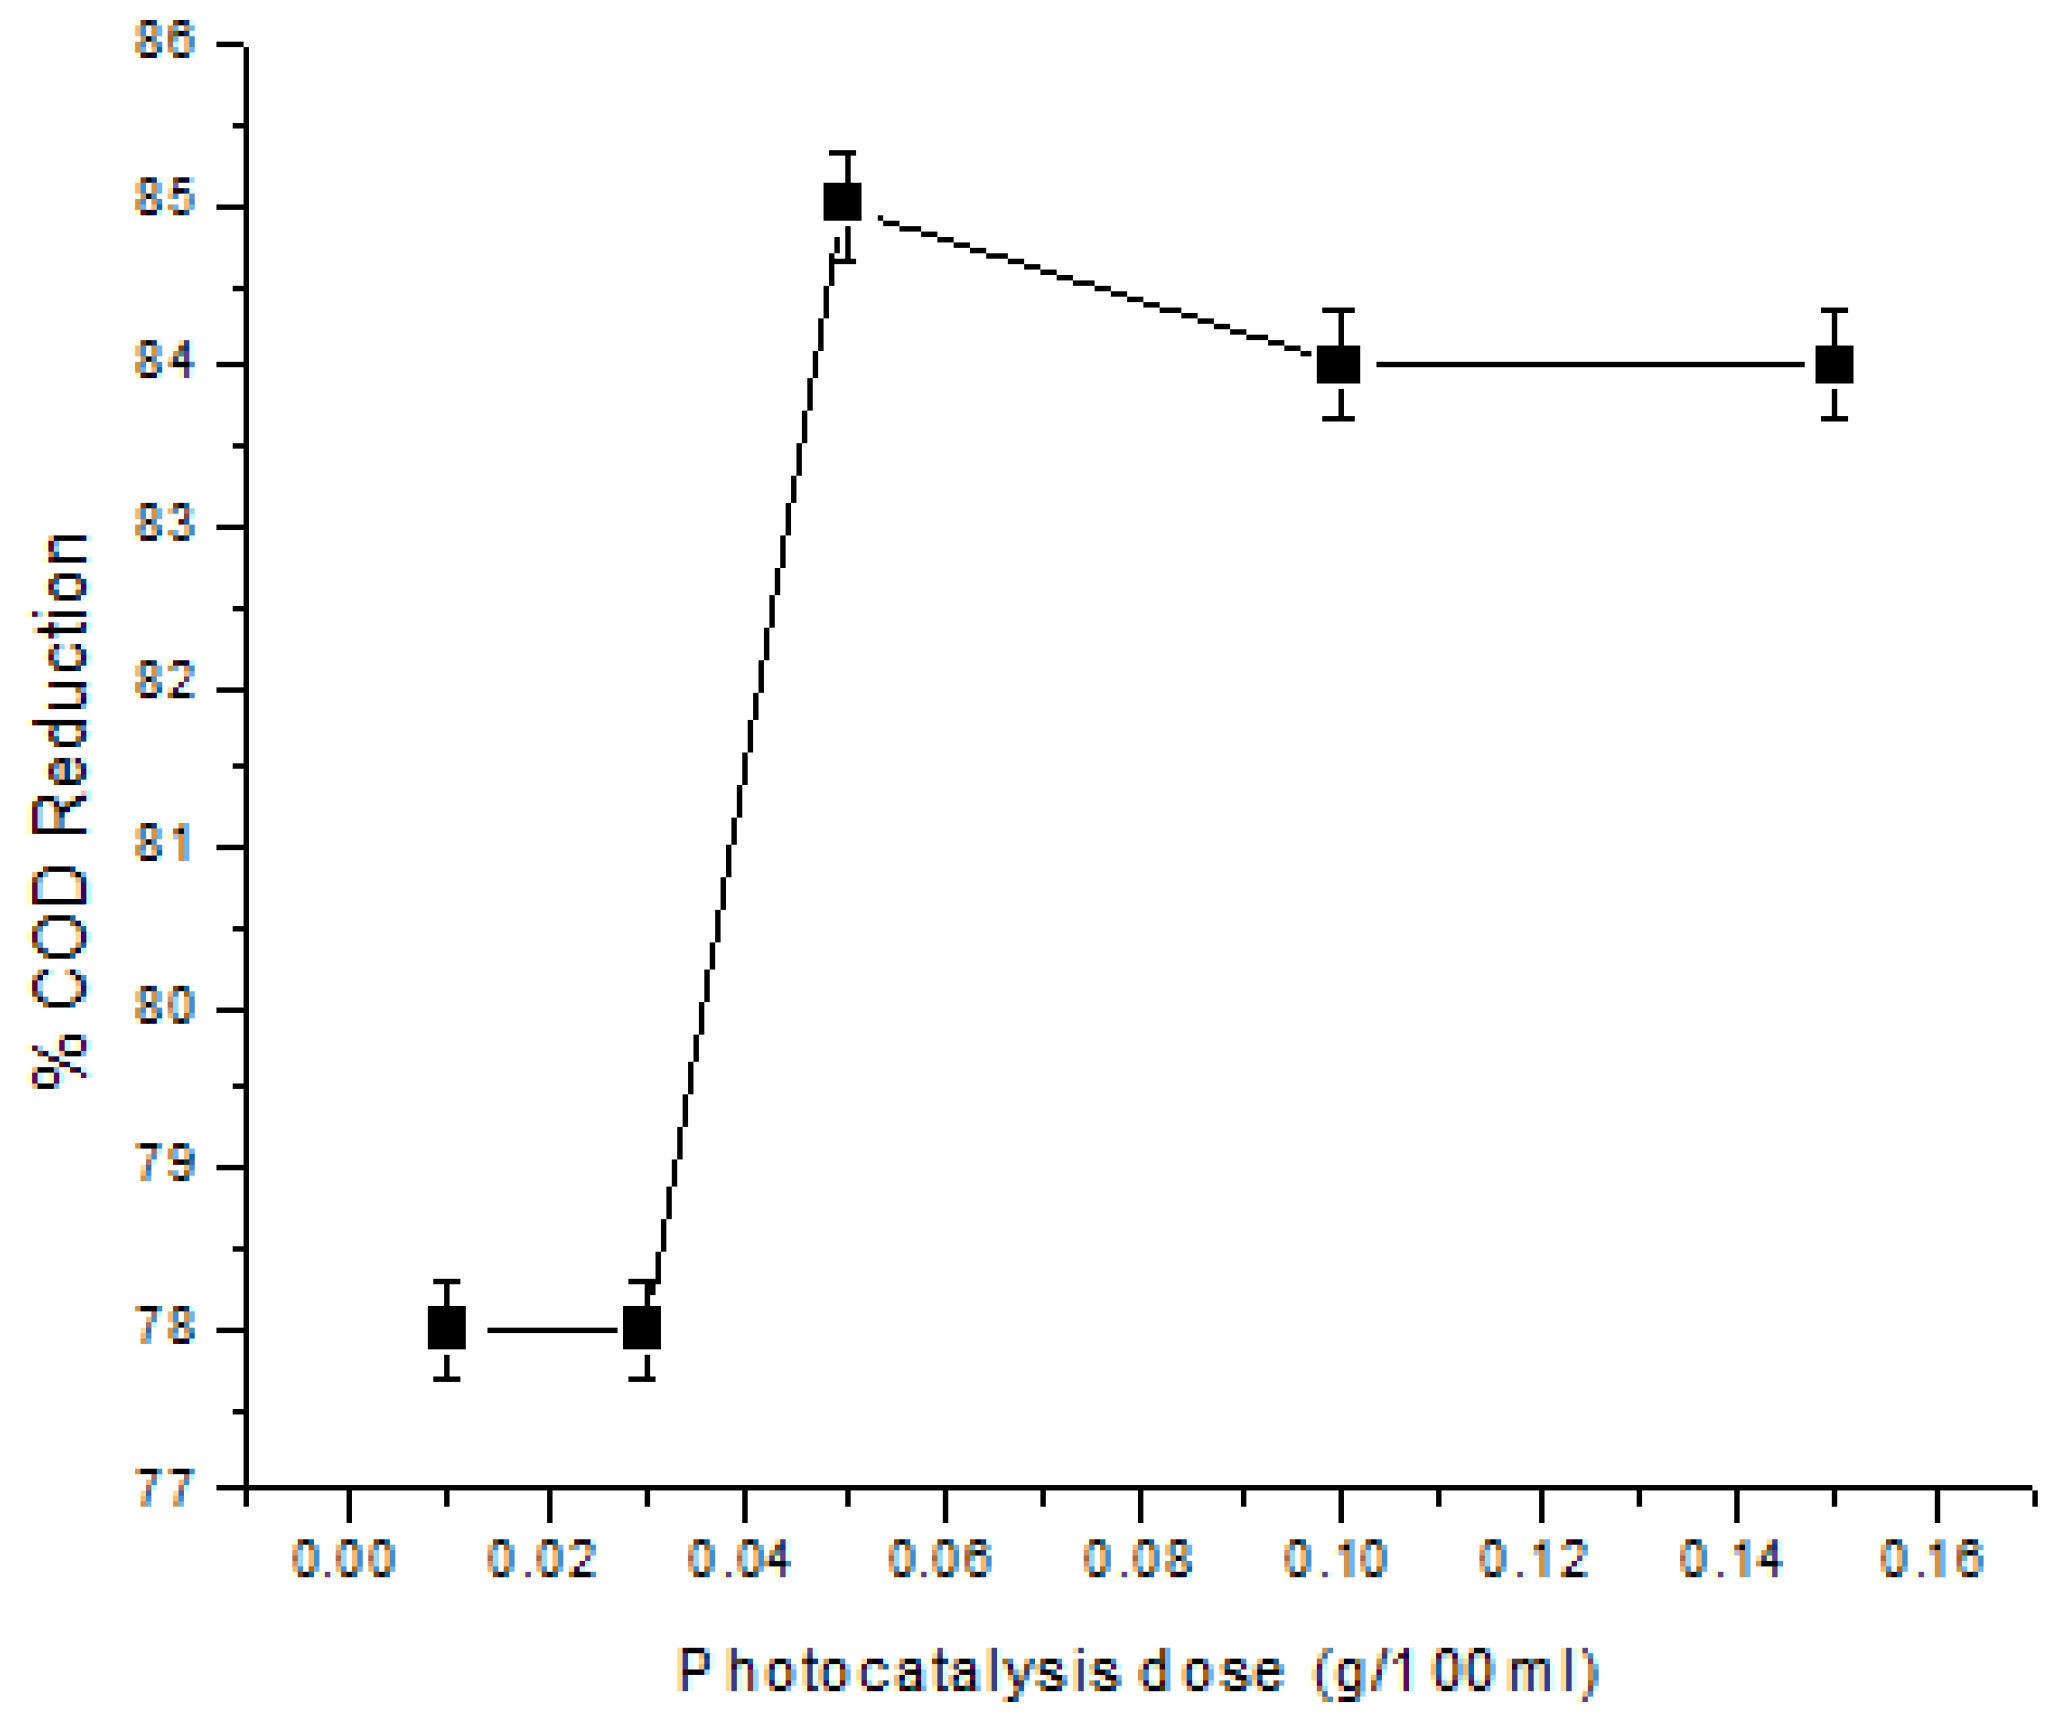
3.7.1. The Effect of Catalyst Dosage

The photocatalytic activity of ZnO NPs was estimated by measuring the reduction of paper mill aqueous solution under solar light irradiations. The experiments for the effect of catalyst dosage were carried out three times, each time using the same catalyst (n = 3). The effect of catalyst dosage on the % of COD reduction by ZnO NPs reveals the maximum COD reduction in paper mill effluent studied, as illustrated in Figure 7, by comparison with the majority previous studies, which have looked on the impact of catalyst loading on photocatalytic efficiency [28]. These findings showed that when the number of catalysts loaded rises, the photodegradation rate increases until it reaches an optimum dose (500 mg/L as shown in Figure 7). The reason for this may be because increasing the catalyst dosage increases the total surface area of the catalyst, the active surface area, and the number of reaction sites. As a result, the quantity of hydroxyl and superoxide radicals rose, making the degradation of organic pollutants easier. Hence, the percentage of degradation was increased. Because of the effects of light scattering and screening, the percentage of photodegradation decreases with greater loadings (>500 mg/L) when the photocatalyst dosage is higher than the optimum level. Furthermore, high catalyst dosage increases agglomeration (particle–particle interaction), limiting photo catalytic efficiency by reducing the amount of catalyst surface area available for light absorption and pollutant adsorption.
The shape, surface area, and crystallinity of a material are all known to play a role in its photocatalytic activity [29]. The photocatalytic activity of a material can be increased by increasing its surface area and crystallinity. Nonetheless, when the calcination temperature increases, the crystallinity of the material increases while the surface area of the material decreases. As a result, morphology could be a major determinant of the final degree-radiation efficiency. Sphere-shaped ZnO nanoparticles (Figure 4a) had a high removal efficiency, according to the findings. Saravanan et al. [30] found similar findings.

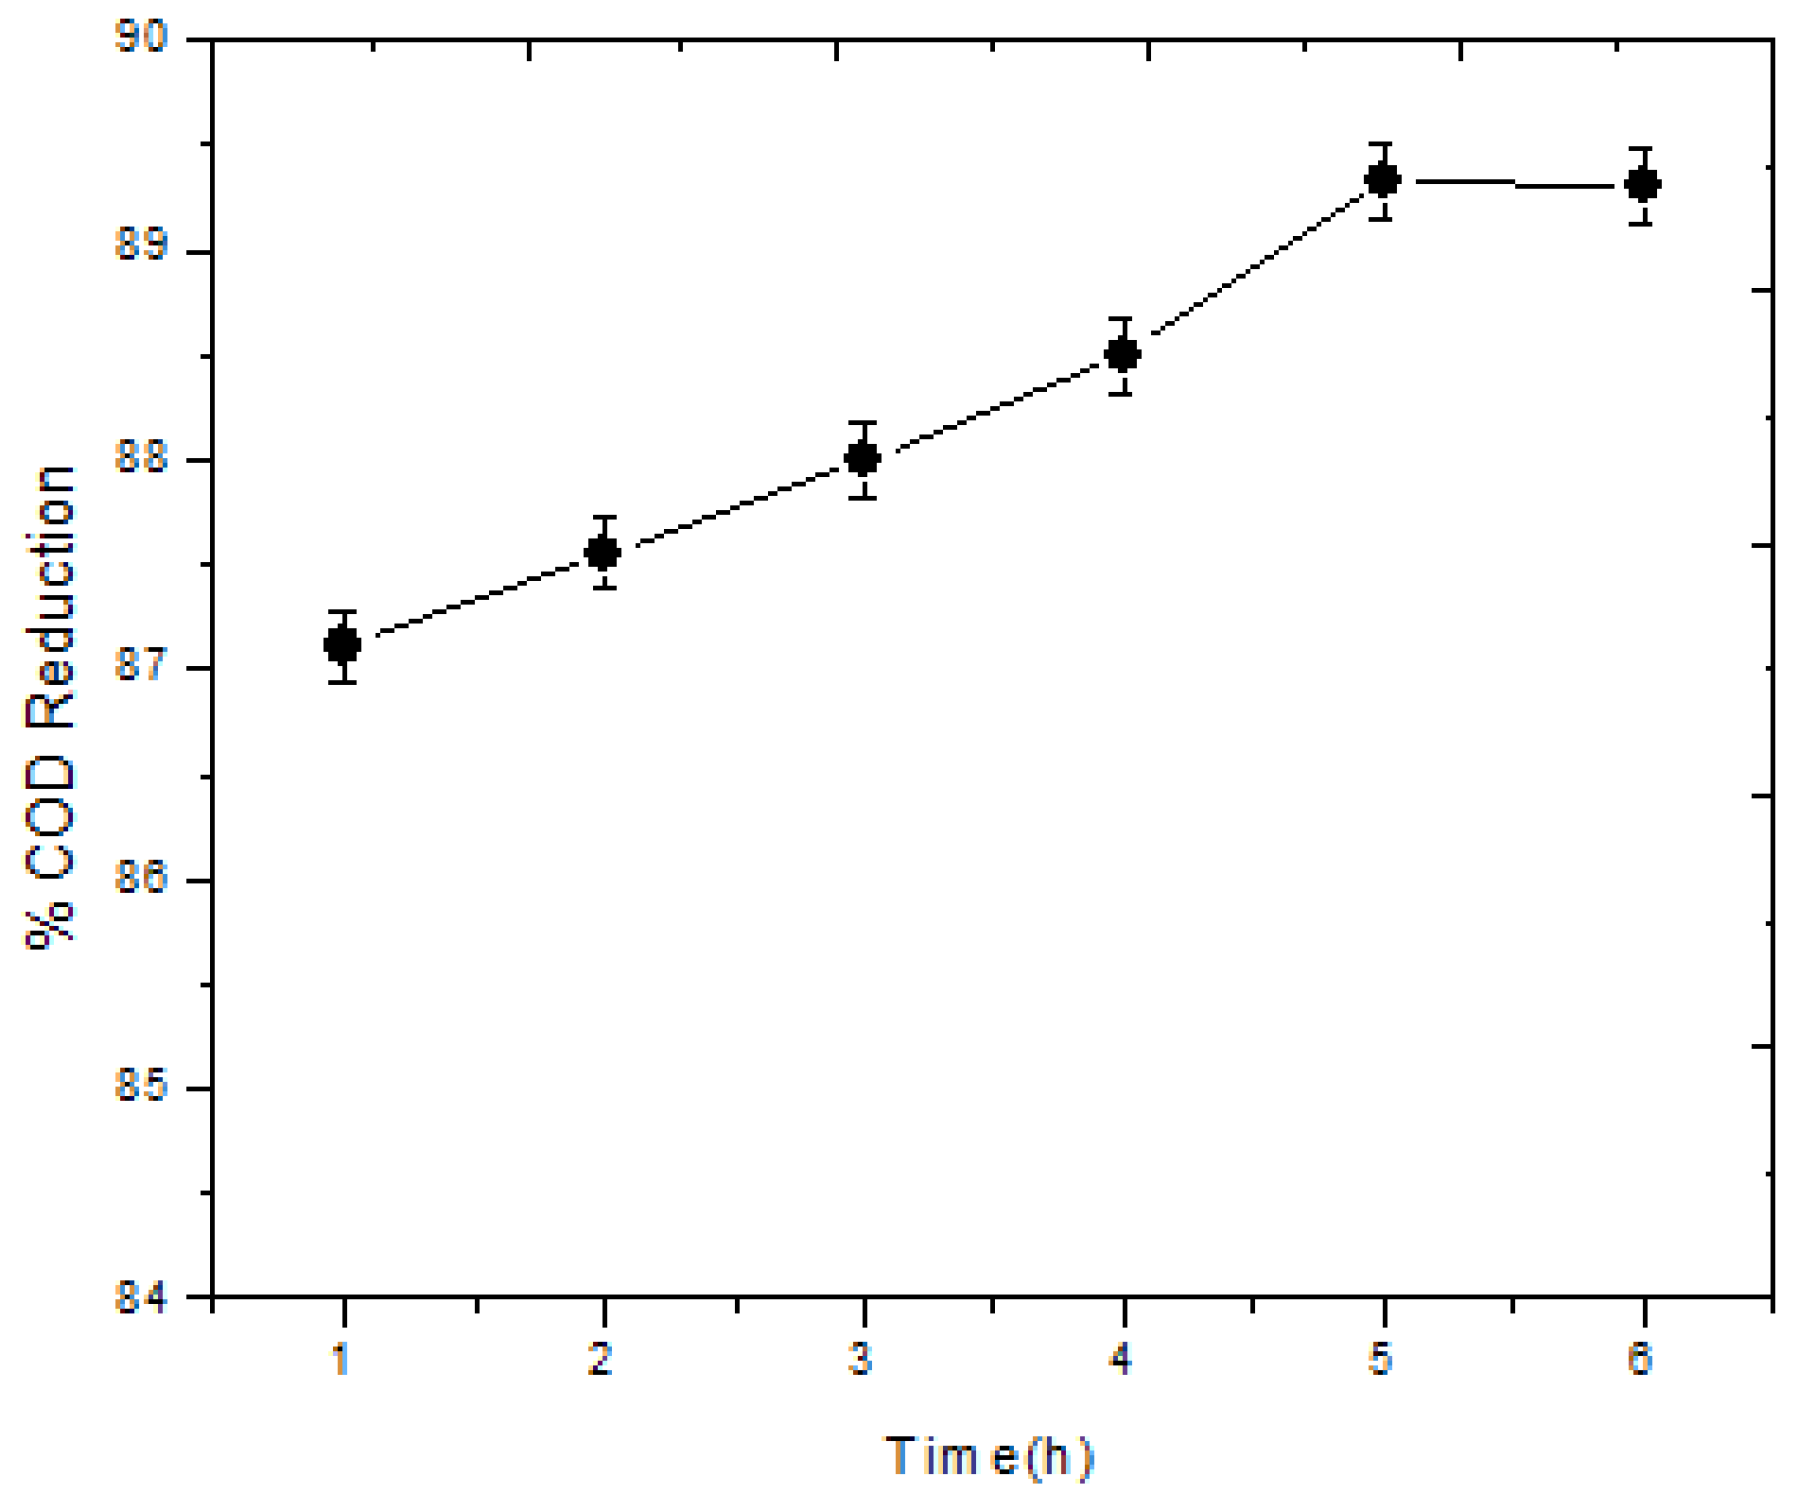
3.7.2. ZnO NPs Structure and Reflux Time Effects

As previously stated, the calculated average size for the prepared ZnO crystal is in the 50–55 nm range. The goal of preparing ZnO in the nanoscale range was motivated by the fact that the efficiency of photodegradation can be enhanced by advancements in ZnO structure. Because of its unique architectures and capabilities, ZnO nanostructure has sparked a lot of interest in photocatalytic research. Nanostructured ZnO has a nanoscale size and a larger surface area. The physicochemical qualities of a material with a high surface-to-volume ratio are better. Nano ZnO has a stronger surface effect and quantum effect, which means that it has a larger specific surface area and so has a higher photodegradation efficiency. The solution was eventually kept under sunshine with constant stirring to optimize photodegradation efficiency for the optimum dose, and aliquots of samples were collected at intervals of 1, 2, 3, 4, 5, and 6 h. As shown in Figure 8, the deterioration of the paper mill effluent increased with reflux time and peaked at 5 h. This may be due to prevent more of the light penetrating power, when the ZnO crystal complete interaction is enhanced, which saturated the rate of photodegradation. Furthermore, this behavior is sometimes explained as the reach by degradation to some complicated organic compounds which are more difficult to be oxidized by photocatalysis especially in the case of industrial wastes.
Rupa et al. [31] reported that the photocatalytic activity, the photodegradation of Congo red and methyl orange was maximum at 80 min of irradiation. Chauhan et al. [32] found that the photodegradation efficiency increased as the photocatalytic process is exposed to more light for longer periods of time.

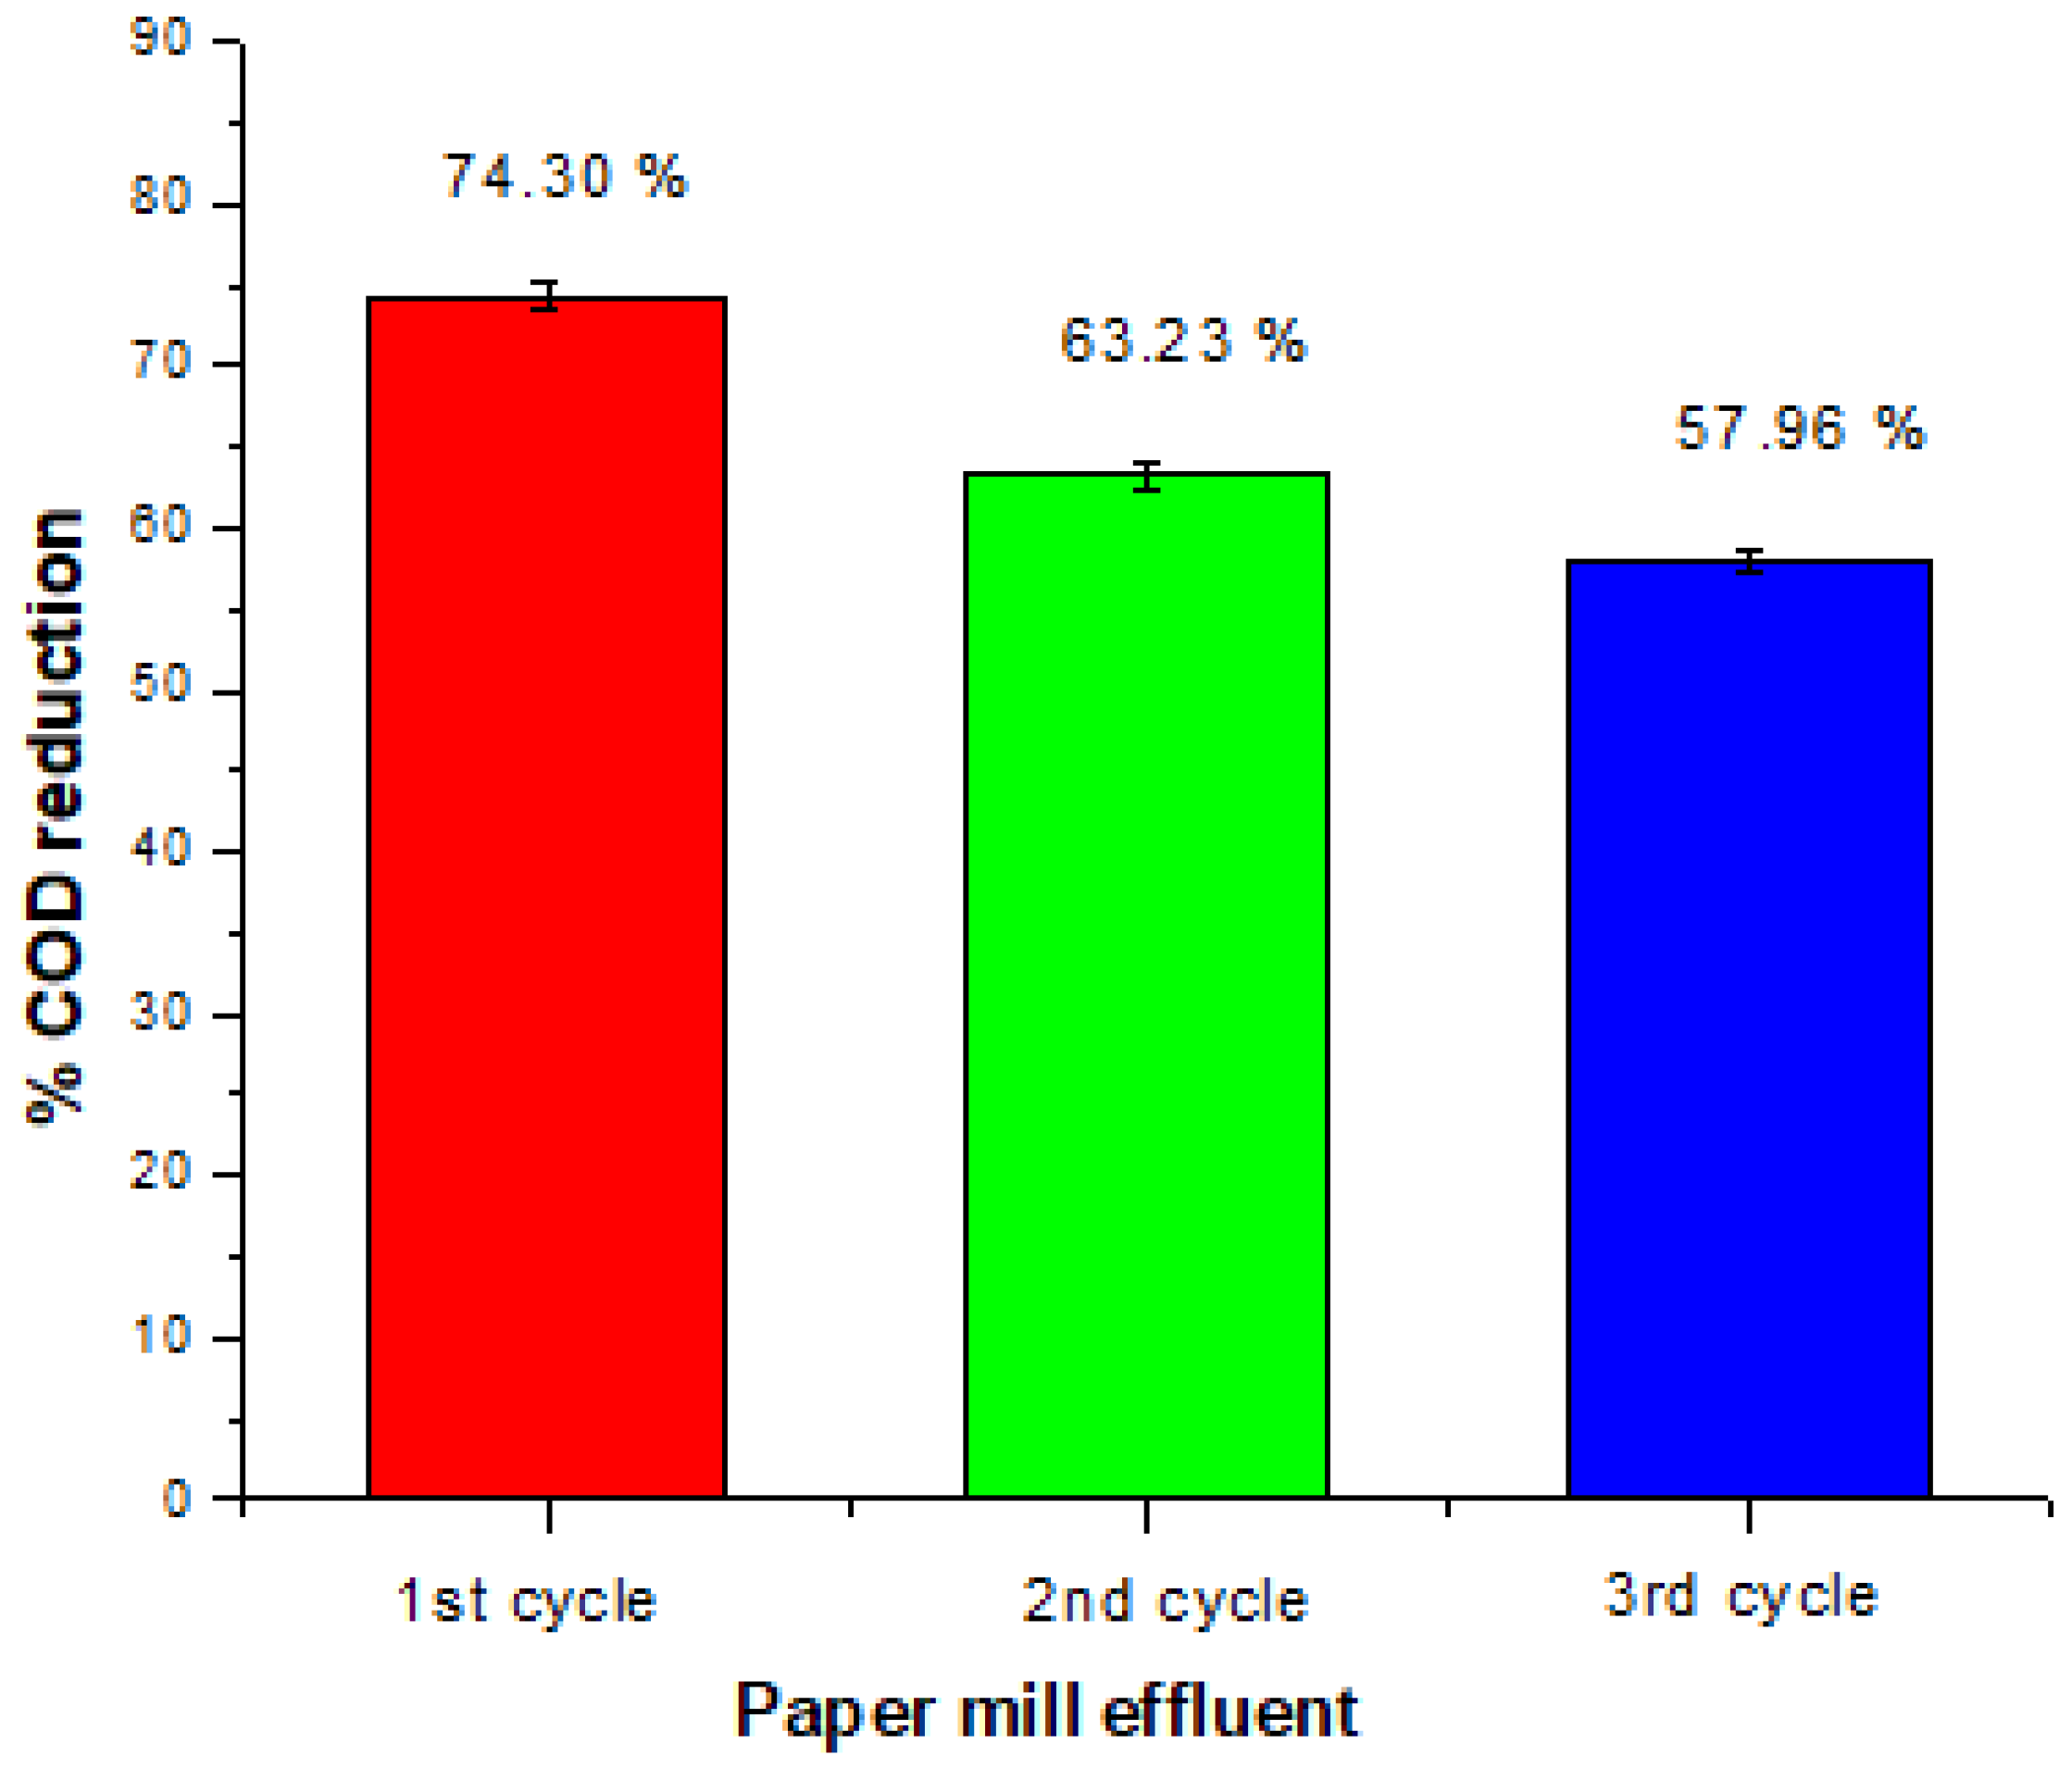
3.7.3. Reusability Performance of ZnO NPs in Removal Efficiency of COD in Paper Mill Effluent

To address the catalysts’ reusability issue, the recovered catalyst was added with fresh paper mill water solutions after centrifugation. All of the experimental conditions were kept constant, and the procedures were repeated three times with fresh water from a paper mill. It was noticed that the recovered weight of catalyst is decreased gradually in each set due to the adherence of part of the catalyst on the container wall, thus the author settled for only four reusable sets. Therefore, after centrifugation, washing and drying the catalyst, the weight was decreased slightly but still could be collected and reused. Reusing ZnO NPs three times in the degradation of paper mill effluent was used to test their reusability. As demonstrated in Figure 9, the photocatalytic treatment of paper mill effluent with ZnO NPs reduces COD concentrations by 74.30%, 63.23%, and 54.96% for the first, second, and third cycles, respectively. Due to the larger number of active sites on the ZnO NPs surface available for efficient photon absorption, good COD removal efficiency is observed. However, the photocatalytic activity of ZnO NPs was reduced due to the photocorrosion effect that occurs when exposed to UV light. After three cycles, the photocatalysis of COD decreased by around 20%, indicating that ZnO NPs can be reused as an efficient photocatalyst numerous times because photo corrosion is negligible [33].

4. Conclusions

We successfully generated ZnO NPs utilizing a green synthesis approach in this study, involving aqueous Prosopis juliflora leaf extract. The hexagonal wurtzite structure of the nanoparticles was confirmed by XRD, with absorption bands in the FT-IR maximum at 5000 cm−1. The removal capacity of COD for three consecutive runs is also represented in this study. These results support the hypothesis that ZnO NPs could be reused multiple times. Based on the phytotoxicity analysis, it can be stated that photocatalytically treated paper mill effluent has been degraded to safer chemicals. Consequently, ZnO NPs have a lot of potential for photocatalysis of paper mill effluent.

Author Contributions

Conceptualization, A.M.A., methodology, A.E.A. and L.M.; software, W.S.S.; validation, W.S.S., formal analysis, W.S.S.; investigation, M.M.; resources, S.K.A. and M.A.T.; data curation, A.M.A.; writing—original draft preparation, T.-A.; writing—review and editing, H.S., S.A.H., L.M., M.K.A. and S.M.A.; visualization, W.S.S.; supervision, S.A.A. and M.A.A.; project administration, A.M.A.; funding acquisition, A.M.A. All authors have read and agreed to the published version of the manuscript.

Funding

The authors extend their appreciation to the Deanship of Scientific Research at the King Khalid University for funding this work through Research Group Project (Number R.G.P.1/169/42).

Institutional Review Board Statement

Not applicable.

Informed Consent Statement

Not applicable.

Data Availability Statement

The data presented in this study are available on request from the corresponding author.

Acknowledgments

The authors would like to express their gratitude to the King Khalid University, Saudi Arabia, for providing administrative and technical support.

Conflicts of Interest

The authors declare no conflict of interest.

References

  1. Garcia-Segura, S.; Ocon, J.D.; Chong, M.N. Electrochemical oxidation remediation of real wastewater effluents—A review. Process Saf. Environ. Prot. 2018, 113, 48–67. [Google Scholar] [CrossRef]
  2. Hossain, K.; Ismail, N. Bioremediation and detoxification of pulp and paper mill effluent: A review. Res. J. Environ. Toxicol. 2015, 9, 113–134. [Google Scholar] [CrossRef] [Green Version]
  3. Subramonian, W.; Wu, T.Y.; Chai, S.-P. A comprehensive study on floc characterization and coagulant performance of natural. Ind. Crop. Prod. 2014, 61, 317–324. [Google Scholar] [CrossRef] [Green Version]
  4. Ashrafi, O.; Yerushalmi, L.; Haghighat, F. Wastewater treatment in the pulp-and-paper industry: A review of treatment processes and the associated greenhouse gas emission. J. Environ. Manag. 2015, 158, 146–157. [Google Scholar] [CrossRef]
  5. Monte, M.C.; Fuente, E.; Blanco, A.; Negro, C. Waste management from pulp and paper production in the European Union. Waste Manag. 2009, 29, 293–308. [Google Scholar] [CrossRef] [Green Version]
  6. Särkkä, H.; Bhatnagar, A.; Sillanpää, M. Recent developments of electro-oxidation in water treatment—A review. J. Electroanal. Chem. 2015, 754, 46–56. [Google Scholar] [CrossRef]
  7. Peterson, H.G.; Hrudey, S.E.; Cantin, I.A.; Perley, T.R.; Kenefick, S.L. Physiological toxicity, cell membrane damage and the release of dissolved organic carbon and geosmin by Aphanizomenon flos-aquae after exposure to water treatment chemicals. Water Res. 1995, 29, 1515–1523. [Google Scholar] [CrossRef]
  8. Pranjali, G.; Deepa, M.; Nair, A.B. Nanotechnology in waste water treatment: A review. Int. J. ChemTech Res. 2013, 5, 2303–2308. [Google Scholar] [CrossRef]
  9. Nanomaterials. In Essentials in Nanoscience and Nanotechnology; John Wiley & Sons, Inc.: Hoboken, NJ, USA, 2016; pp. 149–188. [CrossRef]
  10. Jiang, T.; Liang, Y.; He, Y.; Wang, Q. Activated carbon/NiFe2O4 magnetic composite: A magnetic adsorbent for the adsorption of methyl orange. J. Environ. Chem. Eng. 2015, 3, 1740–1751. [Google Scholar] [CrossRef]
  11. Serpone, N. Pelizzetti, Ezio, Photocatalysis: Fundamentals and Applications; Wiley: New York, NY, USA, 1989. [Google Scholar]
  12. Mills, A.; Le Hunte, S. An overview of semiconductor photocatalysis. J. Photochem. Photobiol. A Chem. 1997, 108, 1–35. [Google Scholar] [CrossRef]
  13. Herlekar, M.; Barve, S.; Kumar, R. Plant-Mediated Green Synthesis of Iron Nanoparticles. J. Nanoparticles 2014, 2014, 1–9. [Google Scholar] [CrossRef] [Green Version]
  14. Vidya, C.; Hiremath, S.; Chandraprabha, M.N.; Antonyraj, M.L.; Gopal, I.V.; Jain, A.; Bansal, K. Green synthesis of ZnO nanoparticles by Calotropis Gigantea. Int. J. Curr. Eng. Technol. 2013, 1, 118–120. Available online: https://d1wqtxts1xzle7.cloudfront.net/43661237/11-with-cover-page-v2.pdf?Expires=1638518185&Signature=Hvz0a0X5fAheKapHUPeozpG5s6FY0~ksMI~oNLcF4KeJIdYApCveWdkmFr7En69joHG0EpM6yxyX2NvHF9xhKI4R2C8NX9Ebn1OdcekRY5PqKufAN7V6qe~2gKu2CobkPM0u4XPH2NgYTofpWdF3XiP6Xb~GNQvMQdDFJyYc3jKPIam21MyPYZ0XK16iy-sCA4vdcKEHbpsvwNbFsb7-V5hr2OL7oZ2nIyPtHNm5CwcOpq8DjXIdzBPK-8v6N7eetRoN1KCDkyiNVngJDV9Nq7uVHclqzhGrG2A858c1cGUPfCFvHC-vw~awJ1eXS1CsYromI~Jkjr2oMwd5Fv06Bw__&Key-Pair-Id=APKAJLOHF5GGSLRBV4ZA (accessed on 5 November 2021).
  15. Gnanasangeetha, D.; Thambavani, D. Biological and Physical Sciences Biogenic Production of Zinc Oxide Nanoparticles Using Acalypha Indica. J. Cjemical, Biol. Phys. Sci. 2014, 4, 238–246. [Google Scholar]
  16. Sindhura, K.S.; Prasad, T.N.V.K.V.; Selvam, P.P.; Hussain, O.M. Synthesis, characterization and evaluation of effect of phytogenic zinc nanoparticles on soil exo-enzymes. Appl. Nanosci. 2014, 4, 819–827. [Google Scholar] [CrossRef] [Green Version]
  17. Devi, R.; Gayathri, R. Green Synthesis of Zinc Oxide Nanoparticles by using Hibiscus rosa-sinensis. Int. J. Curr. Eng. Technol. 2014, 44, 2444–2446. Available online: https://citeseerx.ist.psu.edu/viewdoc/download?doi=10.1.1.1047.1343&rep=rep1&type=pdf (accessed on 5 November 2021).
  18. Oudhia, A.; Kulkarni, P.; Sharma, S. Green Synthesis of ZnO Nanotubes for Bioapplications. Int. J. Curr. Eng. Technol. 2005, 1, 280–281. [Google Scholar]
  19. Srikar, S.K.; Giri, D.D.; Pal, D.B.; Mishra, P.K.; Upadhyay, S.N. Green Synthesis of Silver Nanoparticles: A Review. Green Sustain. Chem. 2016, 6, 34–56. Available online: https://scirp.org/journal/PaperInformation.aspx?PaperID=63969 (accessed on 5 November 2021). [CrossRef] [Green Version]
  20. Abbas, A.M.; Mancilla-Leytón, J.M.; Castillo, J.M. Can camels disperse seeds of the invasive tree Prosopis juliflora? Weed Res. 2018, 58, 221–228. [Google Scholar] [CrossRef]
  21. Sawal, R.K.; Ratan, R.; Yadav, S.B.S. Mesquite (Prosopis juliflora) pods as a feed resource for livestock—A review. Asian-Australas. J. Anim. Sci. 2004, 17, 719–725. [Google Scholar] [CrossRef]
  22. Chaturvedi, O.H.; Sahoo, A. Nutrient utilization and rumen metabolism in sheep fed Prosopis juliflora pods and Cenchrus grass. Springerplus 2013, 2, 1–7. [Google Scholar] [CrossRef] [Green Version]
  23. Chauhan, A.K.; Kataria, N.; Garg, V.K. Green fabrication of ZnO nanoparticles using Eucalyptus spp. leaves extract and their application in wastewater remediation. Chemosphere 2020, 247, 125803. [Google Scholar] [CrossRef]
  24. Mostafa, M.; Alrowaili, Z.A.; Rashwan, G.M.; Gerges, M.K. Ferroelectric behavior and spectroscopic properties of La-Modified lead titanate nanoparticles prepared by a sol-gel method. Heliyon 2020, 6, e03389. [Google Scholar] [CrossRef] [PubMed] [Green Version]
  25. Mobarak, M.; Zied, M.A.; Mostafa, M.; Ashari, M. Effects of growth technique on the microstructure of CuInSe2 ternary semiconductor compound. Heliyon 2020, 6, e03196. [Google Scholar] [CrossRef]
  26. Momma, K.; Izumi, F. VESTA3 for three-dimensional visualization of crystal, volumetric and morphology data. J. Appl. Crystallogr. 2011, 44, 1272–1276. [Google Scholar] [CrossRef]
  27. Singh, J.; Verma, N.K. Synthesis and Characterization of Fe-Doped CdSe Nanoparticles as Dilute Magnetic Semiconductor. J. Supercond. Nov. Magn. 2012, 25, 2425–2430. [Google Scholar] [CrossRef]
  28. Hayat, K.; Gondal, M.A.; Khaled, M.M.; Ahmed, S. Effect of operational key parameters on photocatalytic degradation of phenol using nano nickel oxide synthesized by sol–gel method. J. Mol. Catal. A Chem. 2011, 336, 64–71. [Google Scholar] [CrossRef]
  29. Tian, G.; Fu, H.; Jing, L.; Xin, B.; Pan, K. Preparation and characterization of stable biphase TiO2 photocatalyst with high crystallinity, large surface area, and enhanced photoactivity. J. Physics. Chem. 2008, 112, 3083–3089. [Google Scholar] [CrossRef]
  30. Saravanan, R.; Gupta, V.K.; Narayanan, V.; Stephen, A. Comparative study on photocatalytic activity of ZnO prepared by different methods. J. Mol. Liq. 2013, 181, 133–141. [Google Scholar] [CrossRef]
  31. Rupa, E.J.; Kaliraj, L.; Abid, S.; Yang, D.C.; Jung, S.K. Synthesis of a zinc oxide nanoflower photocatalyst from sea buckthorn fruit for degradation of industrial dyes in wastewater treatment. Nanomaterials 2019, 9, 1692. [Google Scholar] [CrossRef] [PubMed] [Green Version]
  32. Chauhan, A.; Verma, R.; Kumari, S.; Sharma, A.; Shandilya, P.; Li, X.; Batoo, K.M.; Imran, A.; Kulshrestha, S.; Kumar, R. Photocatalytic dye degradation and antimicrobial activities of Pure and Ag-doped ZnO using Cannabis sativa leaf extract. Sci. Rep. 2020, 12, 1–6. [Google Scholar] [CrossRef]
  33. Tsoumachidou, S.; Velegraki, T.; Antoniadis, A.; Poulios, I. Greywater as a sustainable water source: A photocatalytic treatment technology under artificial and solar illumination. J. Environ. Manag. 2017, 195, 232–241. [Google Scholar] [CrossRef] [PubMed]
Figure 1. XRD-pattern of biogenically synthesized ZnO nanoparticles (NPs).
Applsci 11 11394 g001
Figure 2. Rietveld refinement results of Hexagonal Wurtzite Structure of ZnO NPs.
Applsci 11 11394 g002
Figure 3. (a) SEM image of (ZnO NPs) at 10 μm (b) SEM image of (ZnO NPs) at 2 μm.
Applsci 11 11394 g003
Figure 4. TEM image (a) and the particle size distribution histogram (b) and the area distribution histogram (c).
Applsci 11 11394 g004
Figure 5. Schematic model of a wurtzitic ZnO structure with lattice constants a, b and c.
Applsci 11 11394 g005
Figure 6. FTIR spectra of ZnO-NPs.
Applsci 11 11394 g006
Figure 7. Effect of catalyst dosage on % COD reduction by ZnO NPs (n = 3).
Applsci 11 11394 g007
Figure 8. Effect of the contact time on % COD reduction by ZnO NPs (n = 3).
Applsci 11 11394 g008
Figure 9. Reusability performance of ZnO NPs in removal efficiency of COD (n = 3).
Applsci 11 11394 g009
Table 1. The lattice constant values for the samples.
SampleACc/aStrainCrystallite Size
ZnO3.25305.21301.0790.4433
Table 2. Final Rietveld refinement parameter of Hexagonal wurtzite ZnO NPs.
CompoundSpace Groupa = b (Å)c (Å)α = βγη = c/aCell Volume (Å)AtomxYz
ZnOP63mc3.225.290°120°1.647.5Zn0.3330.66670.000
O0.3330.6670.375
Publisher’s Note: MDPI stays neutral with regard to jurisdictional claims in published maps and institutional affiliations.

