
Mechanical Behavior of Sand Mixed with Rubber Aggregates

 and
and
Abstract
:1. Introduction
Environment Impact
2. Materials and Methods
2.1. Materials
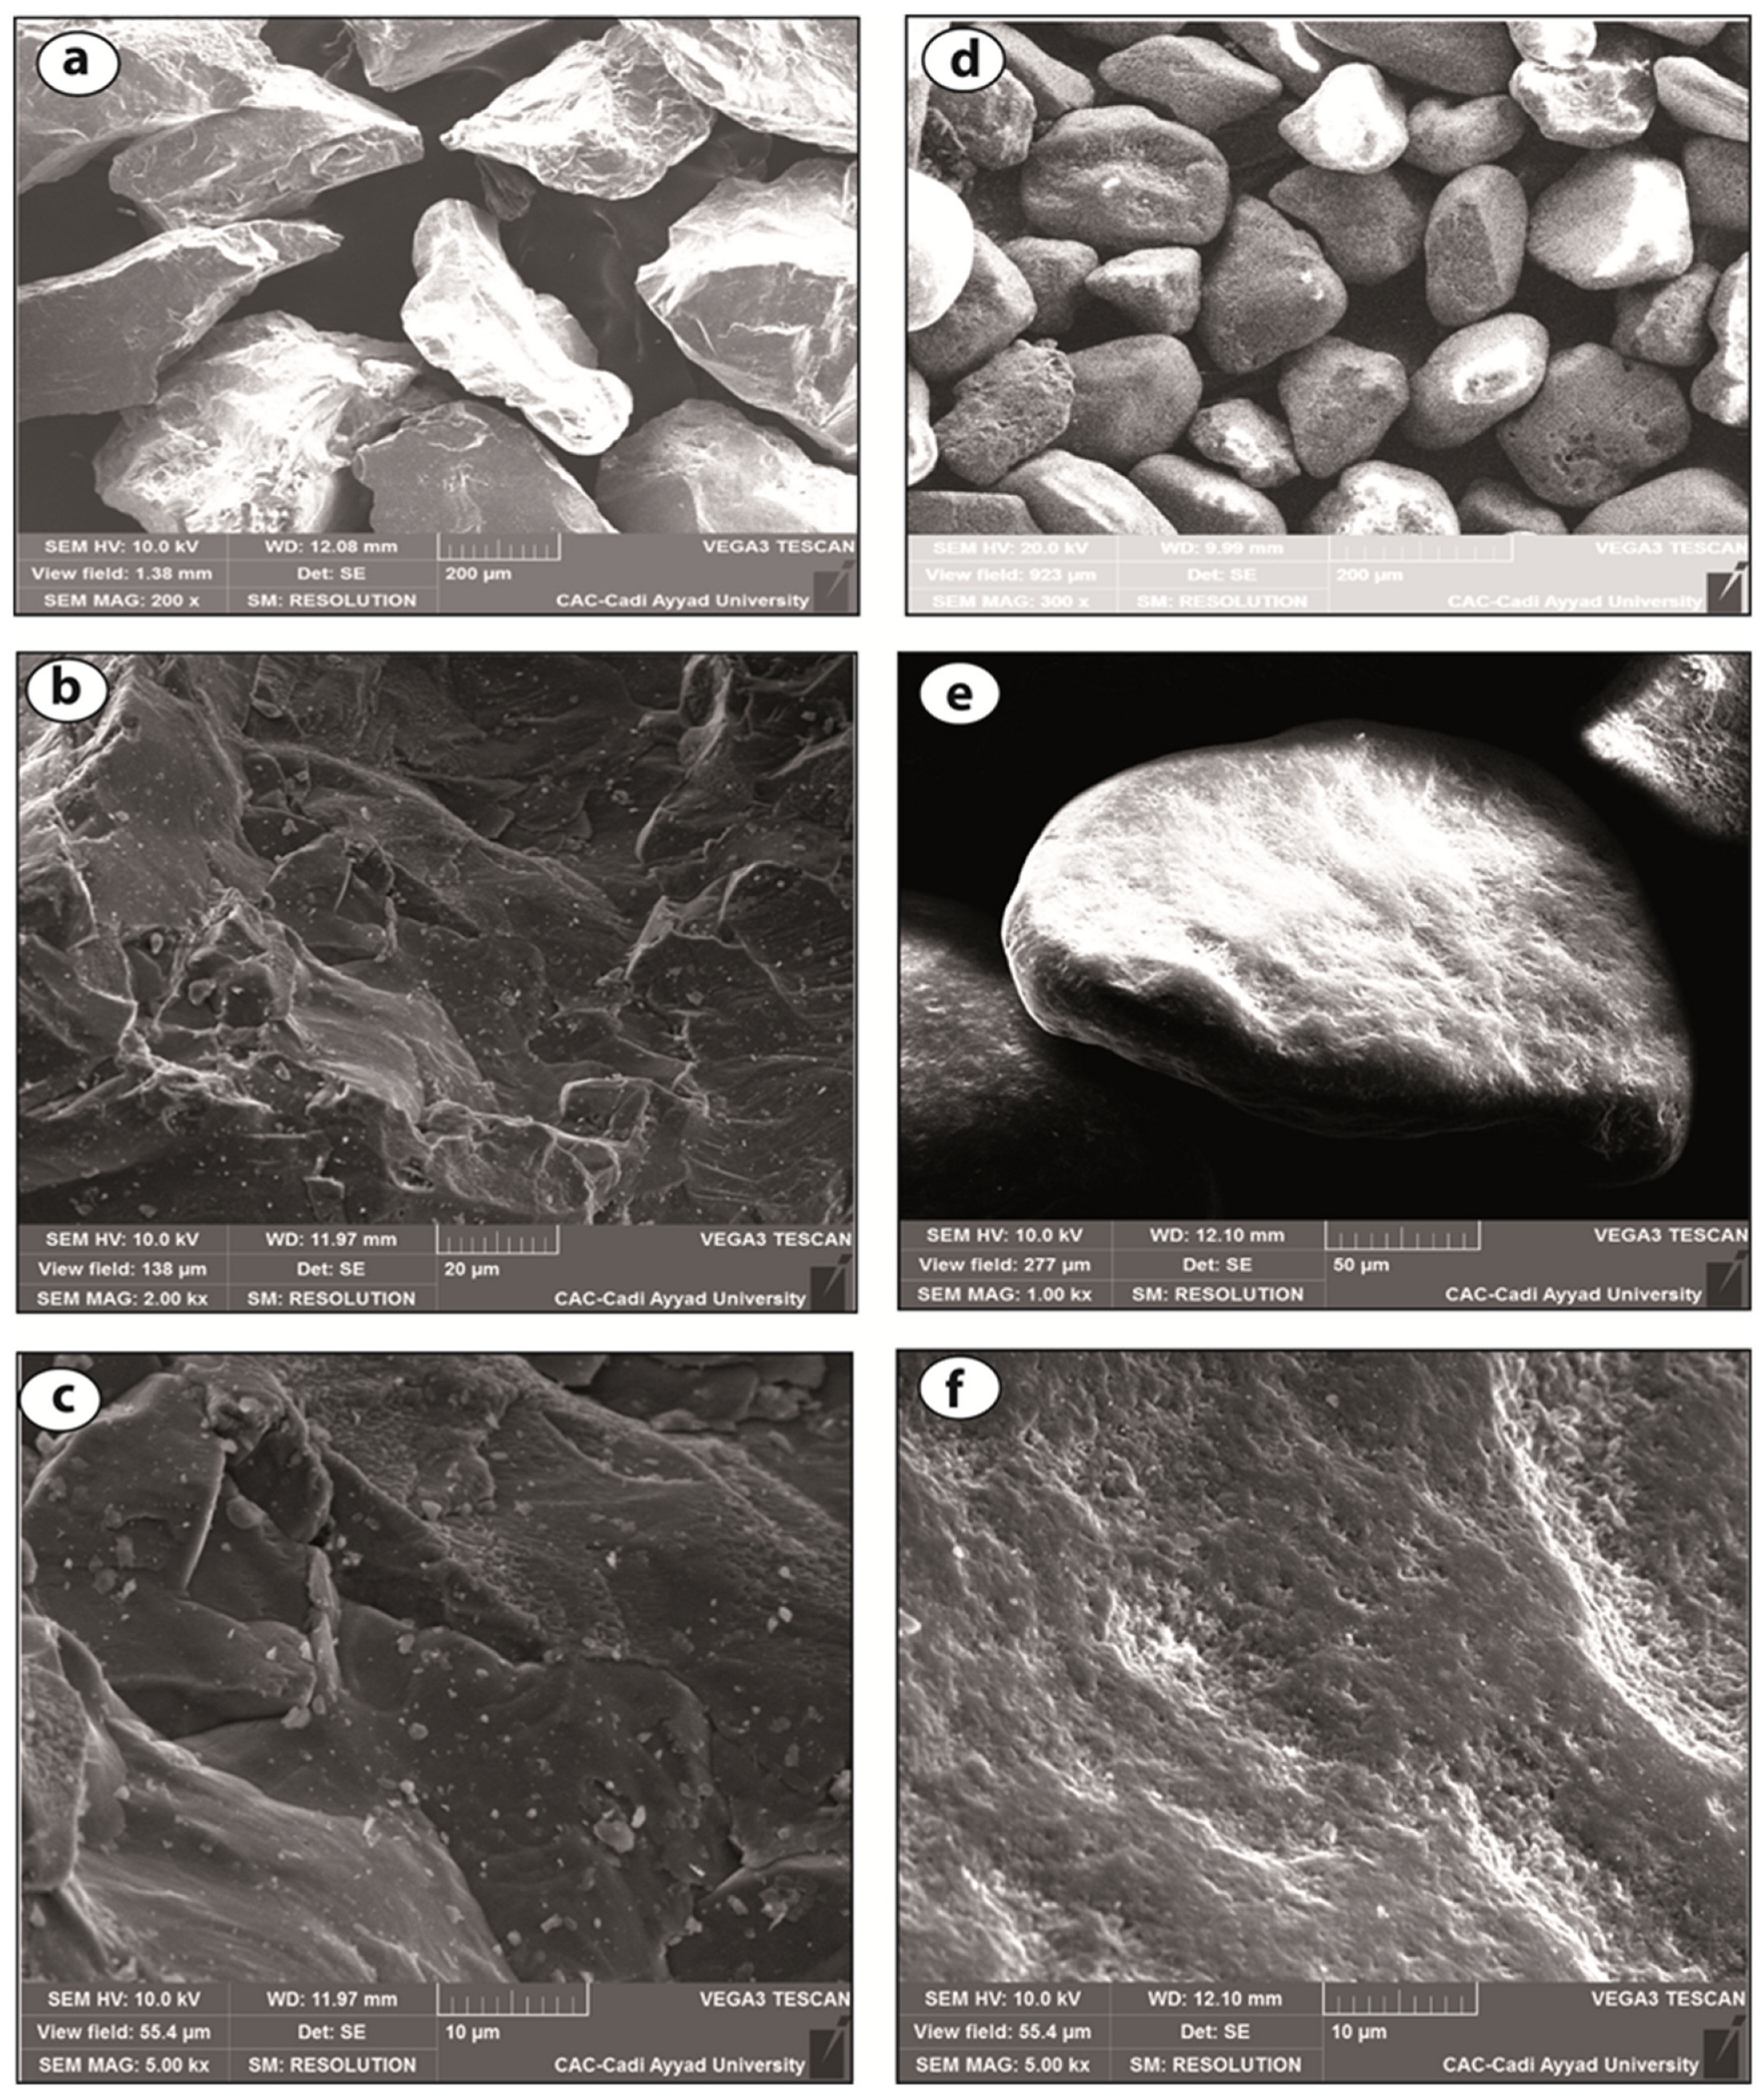
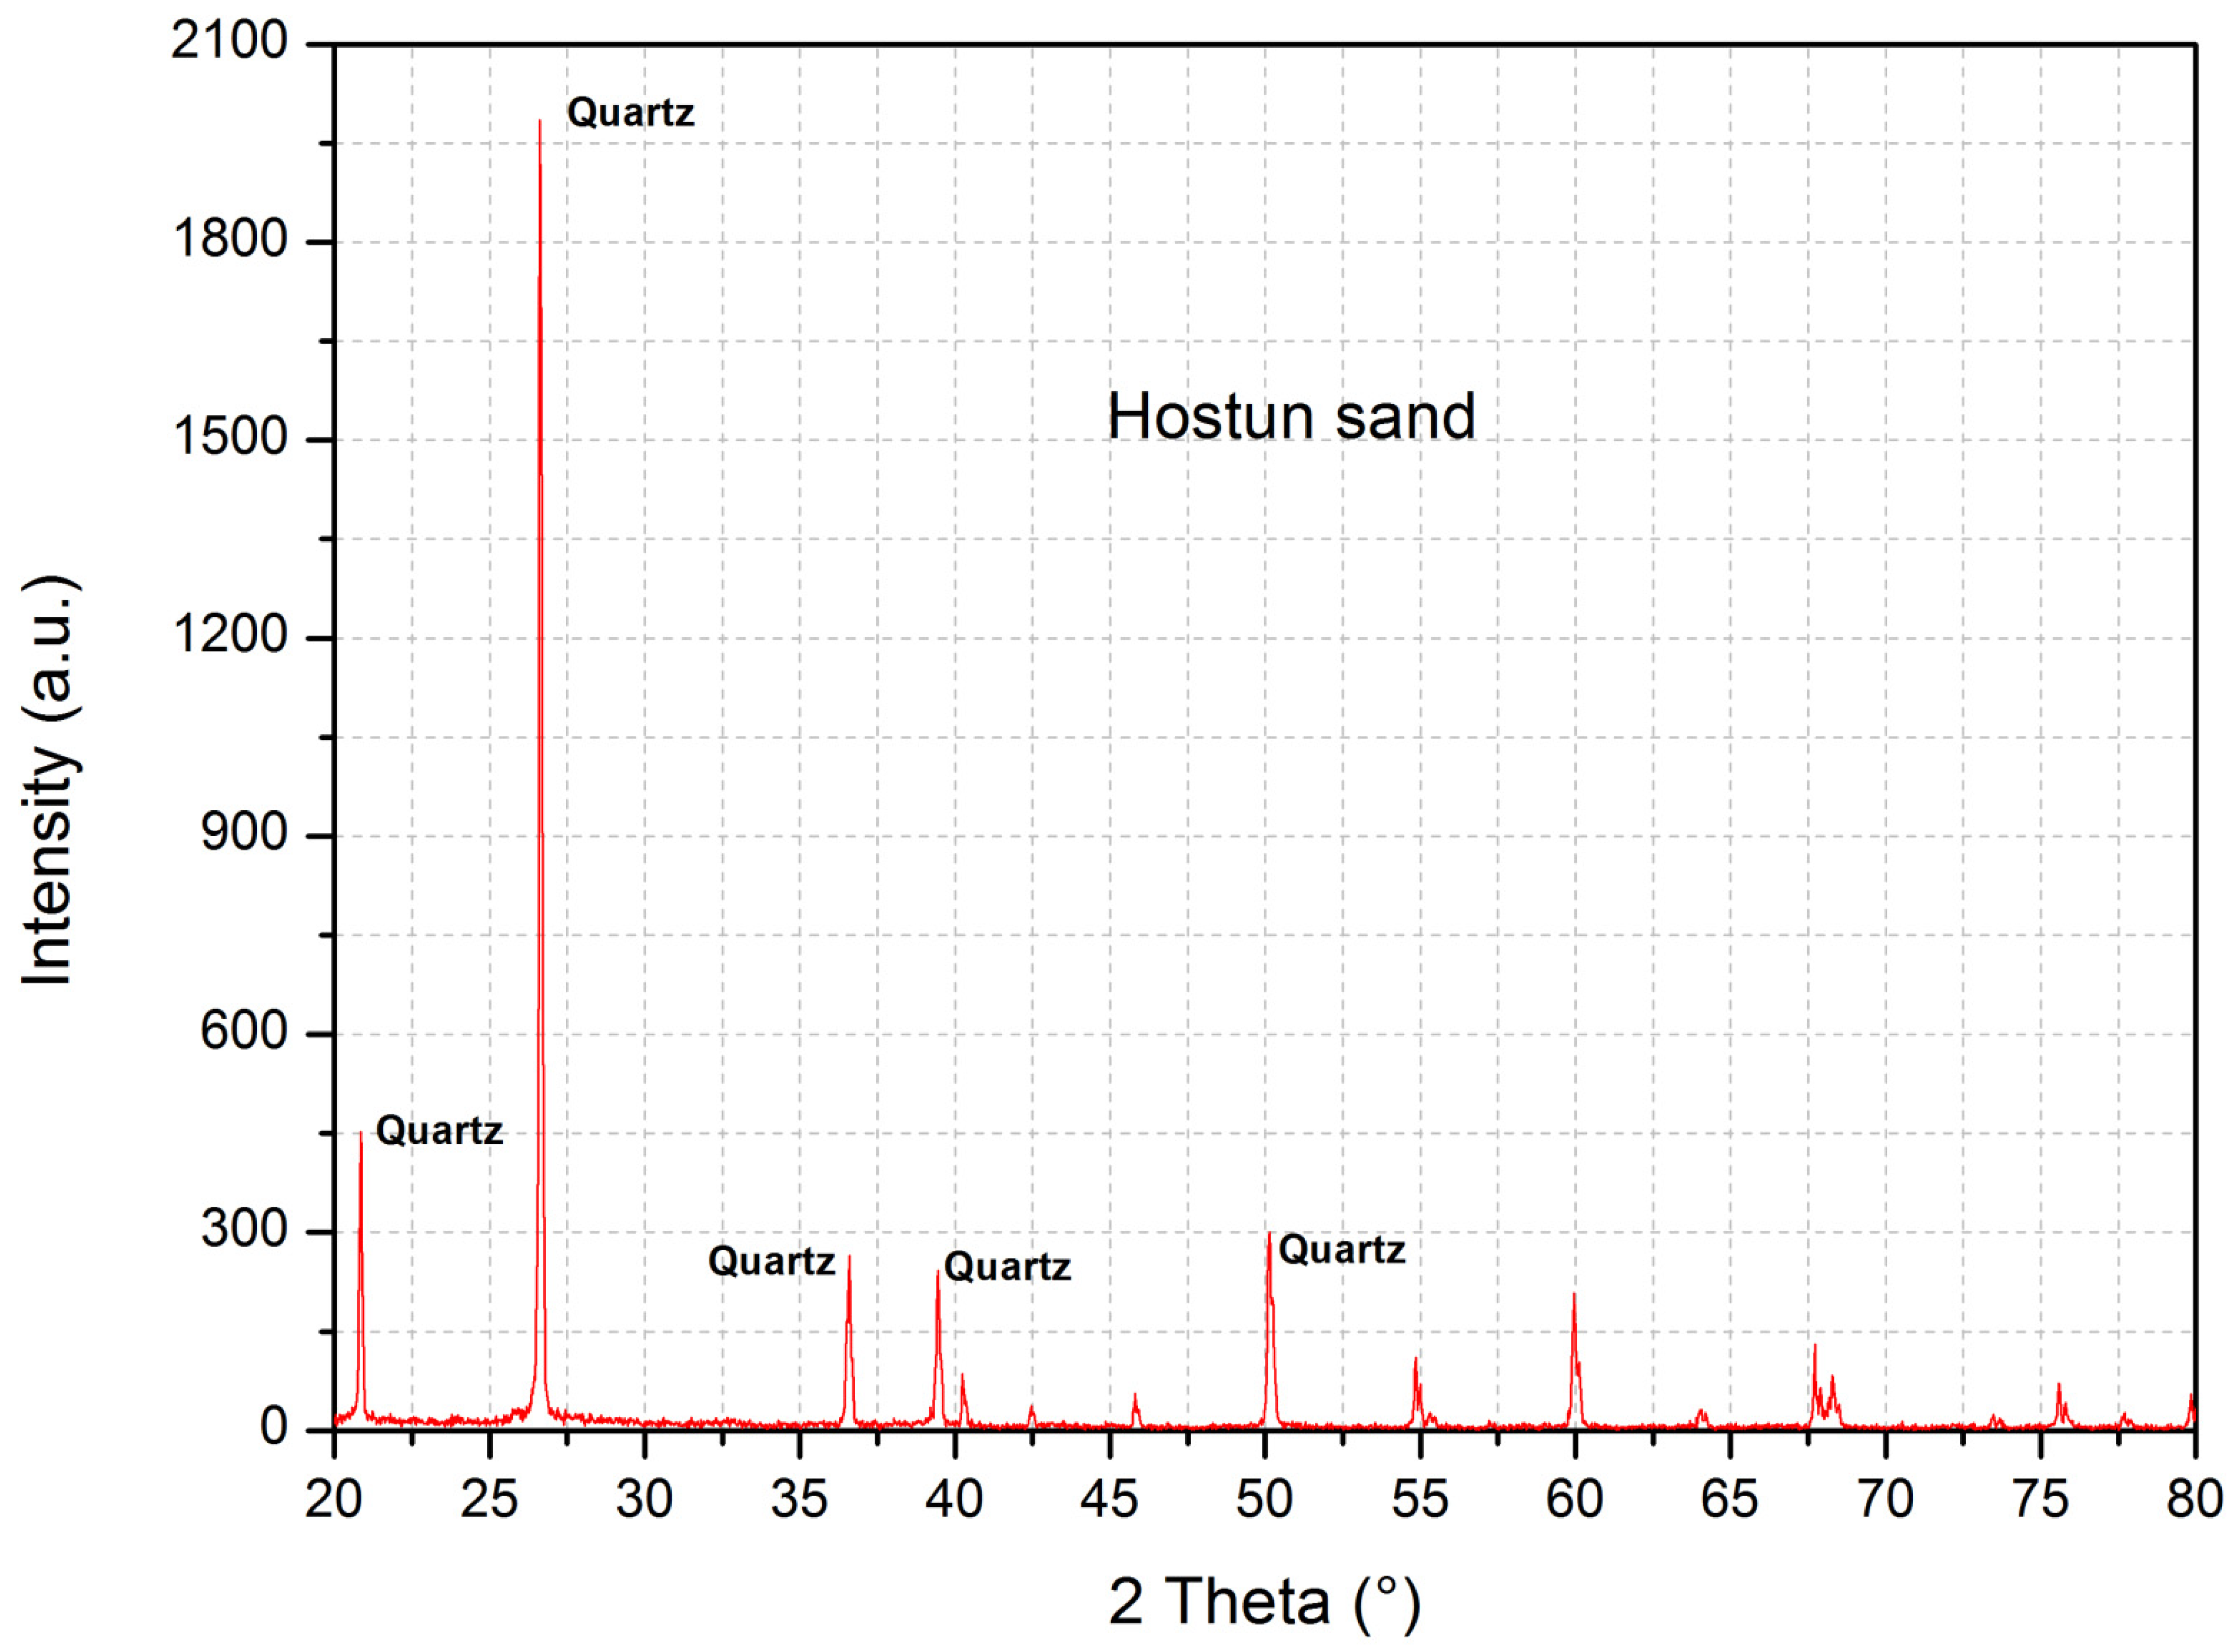
2.1.1. Hostun Sand
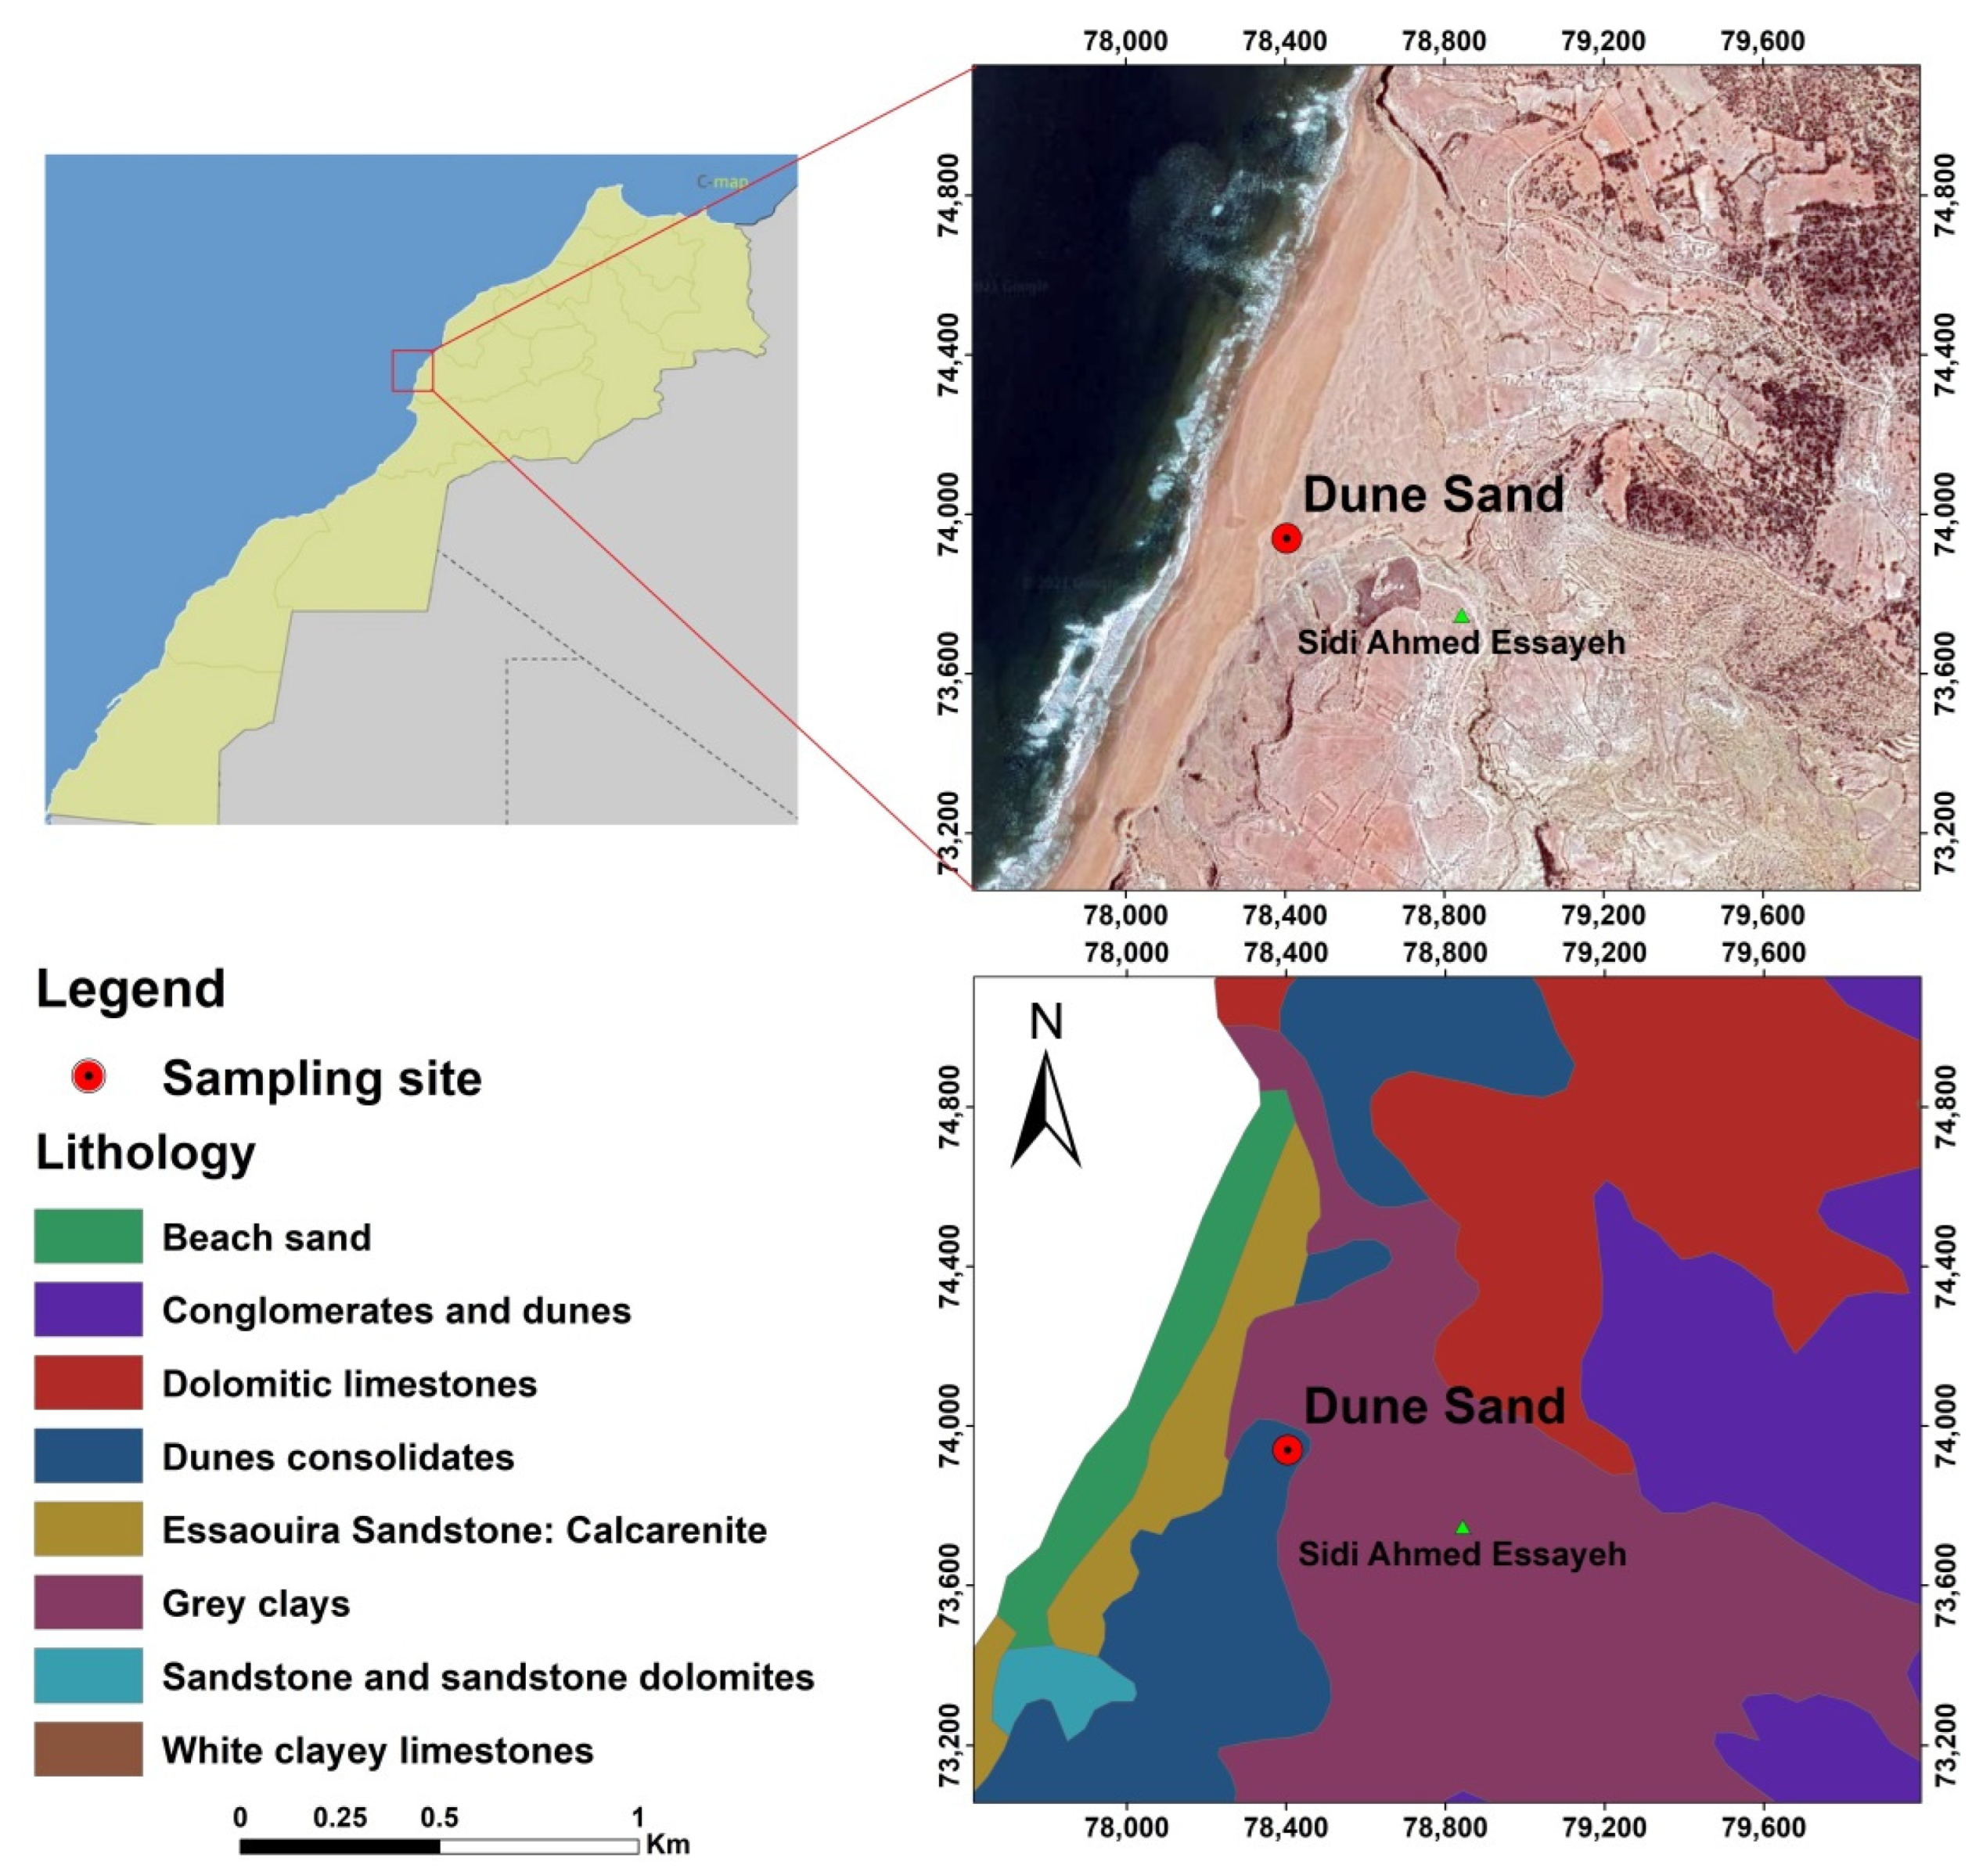
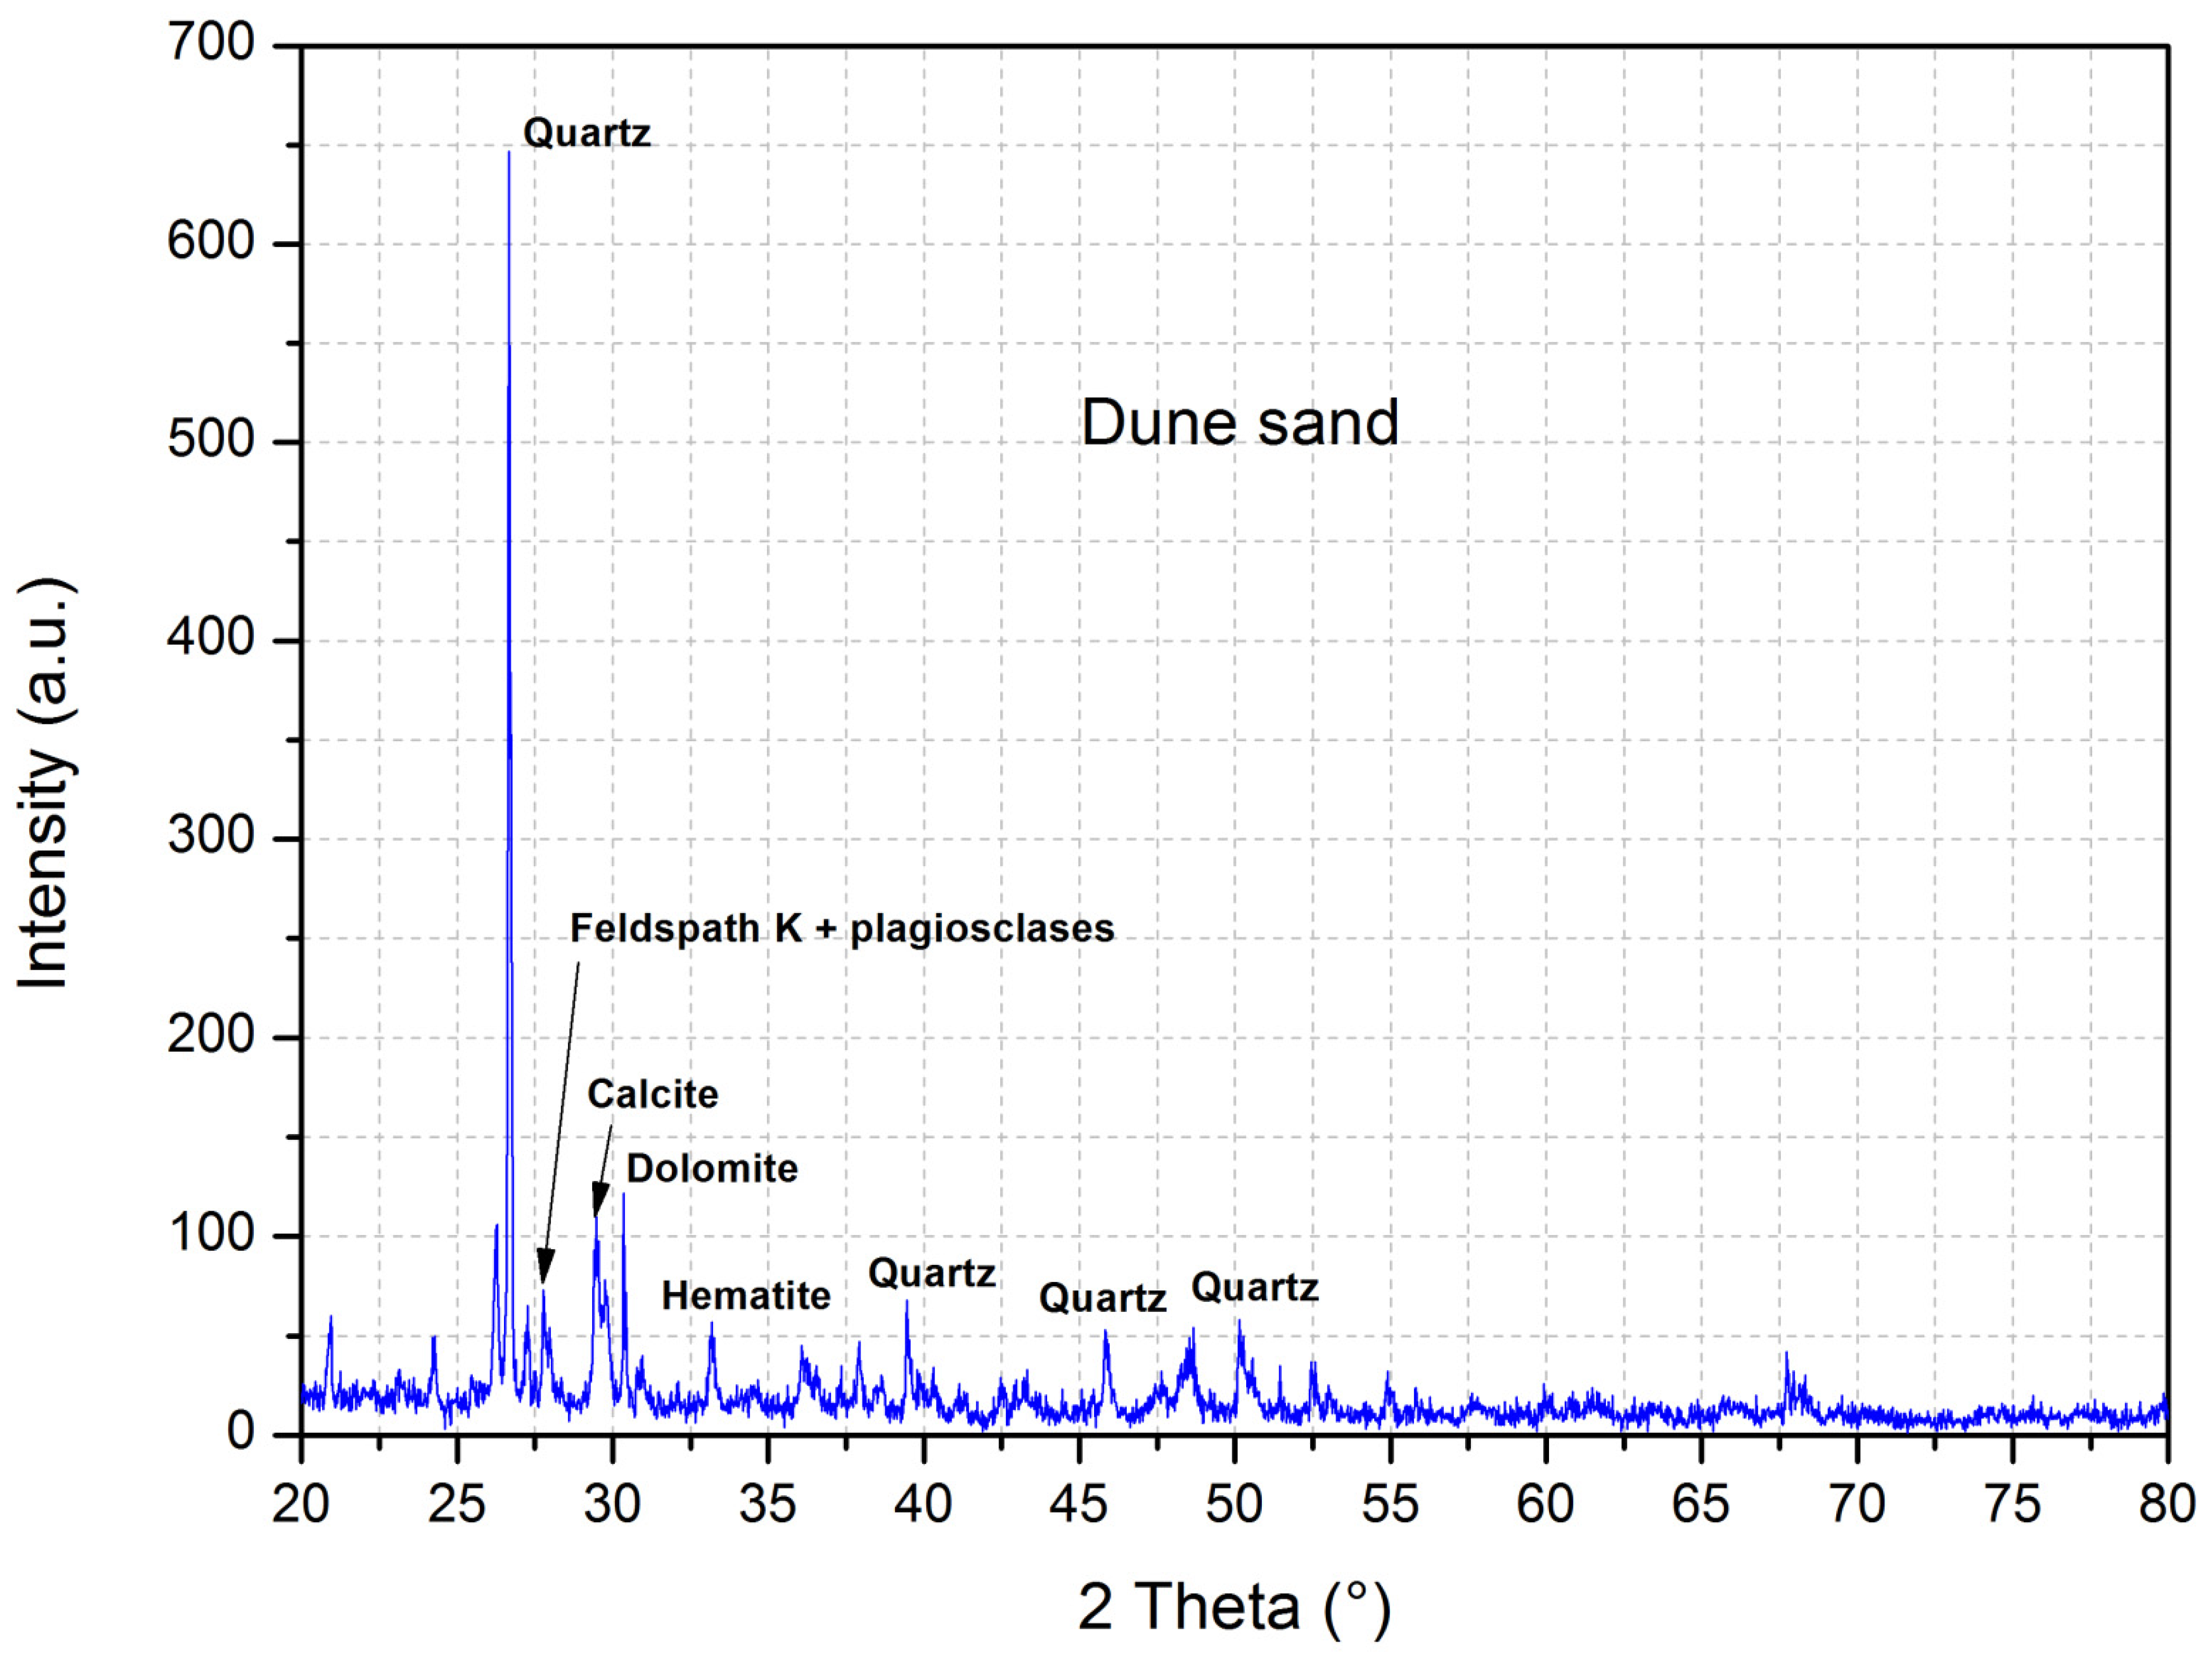
2.1.2. Dune Sand
2.1.3. Aggregate Rubber
2.2. Methods
Standard Direct Shear Test and Sample Preparation
3. Results and Discussion
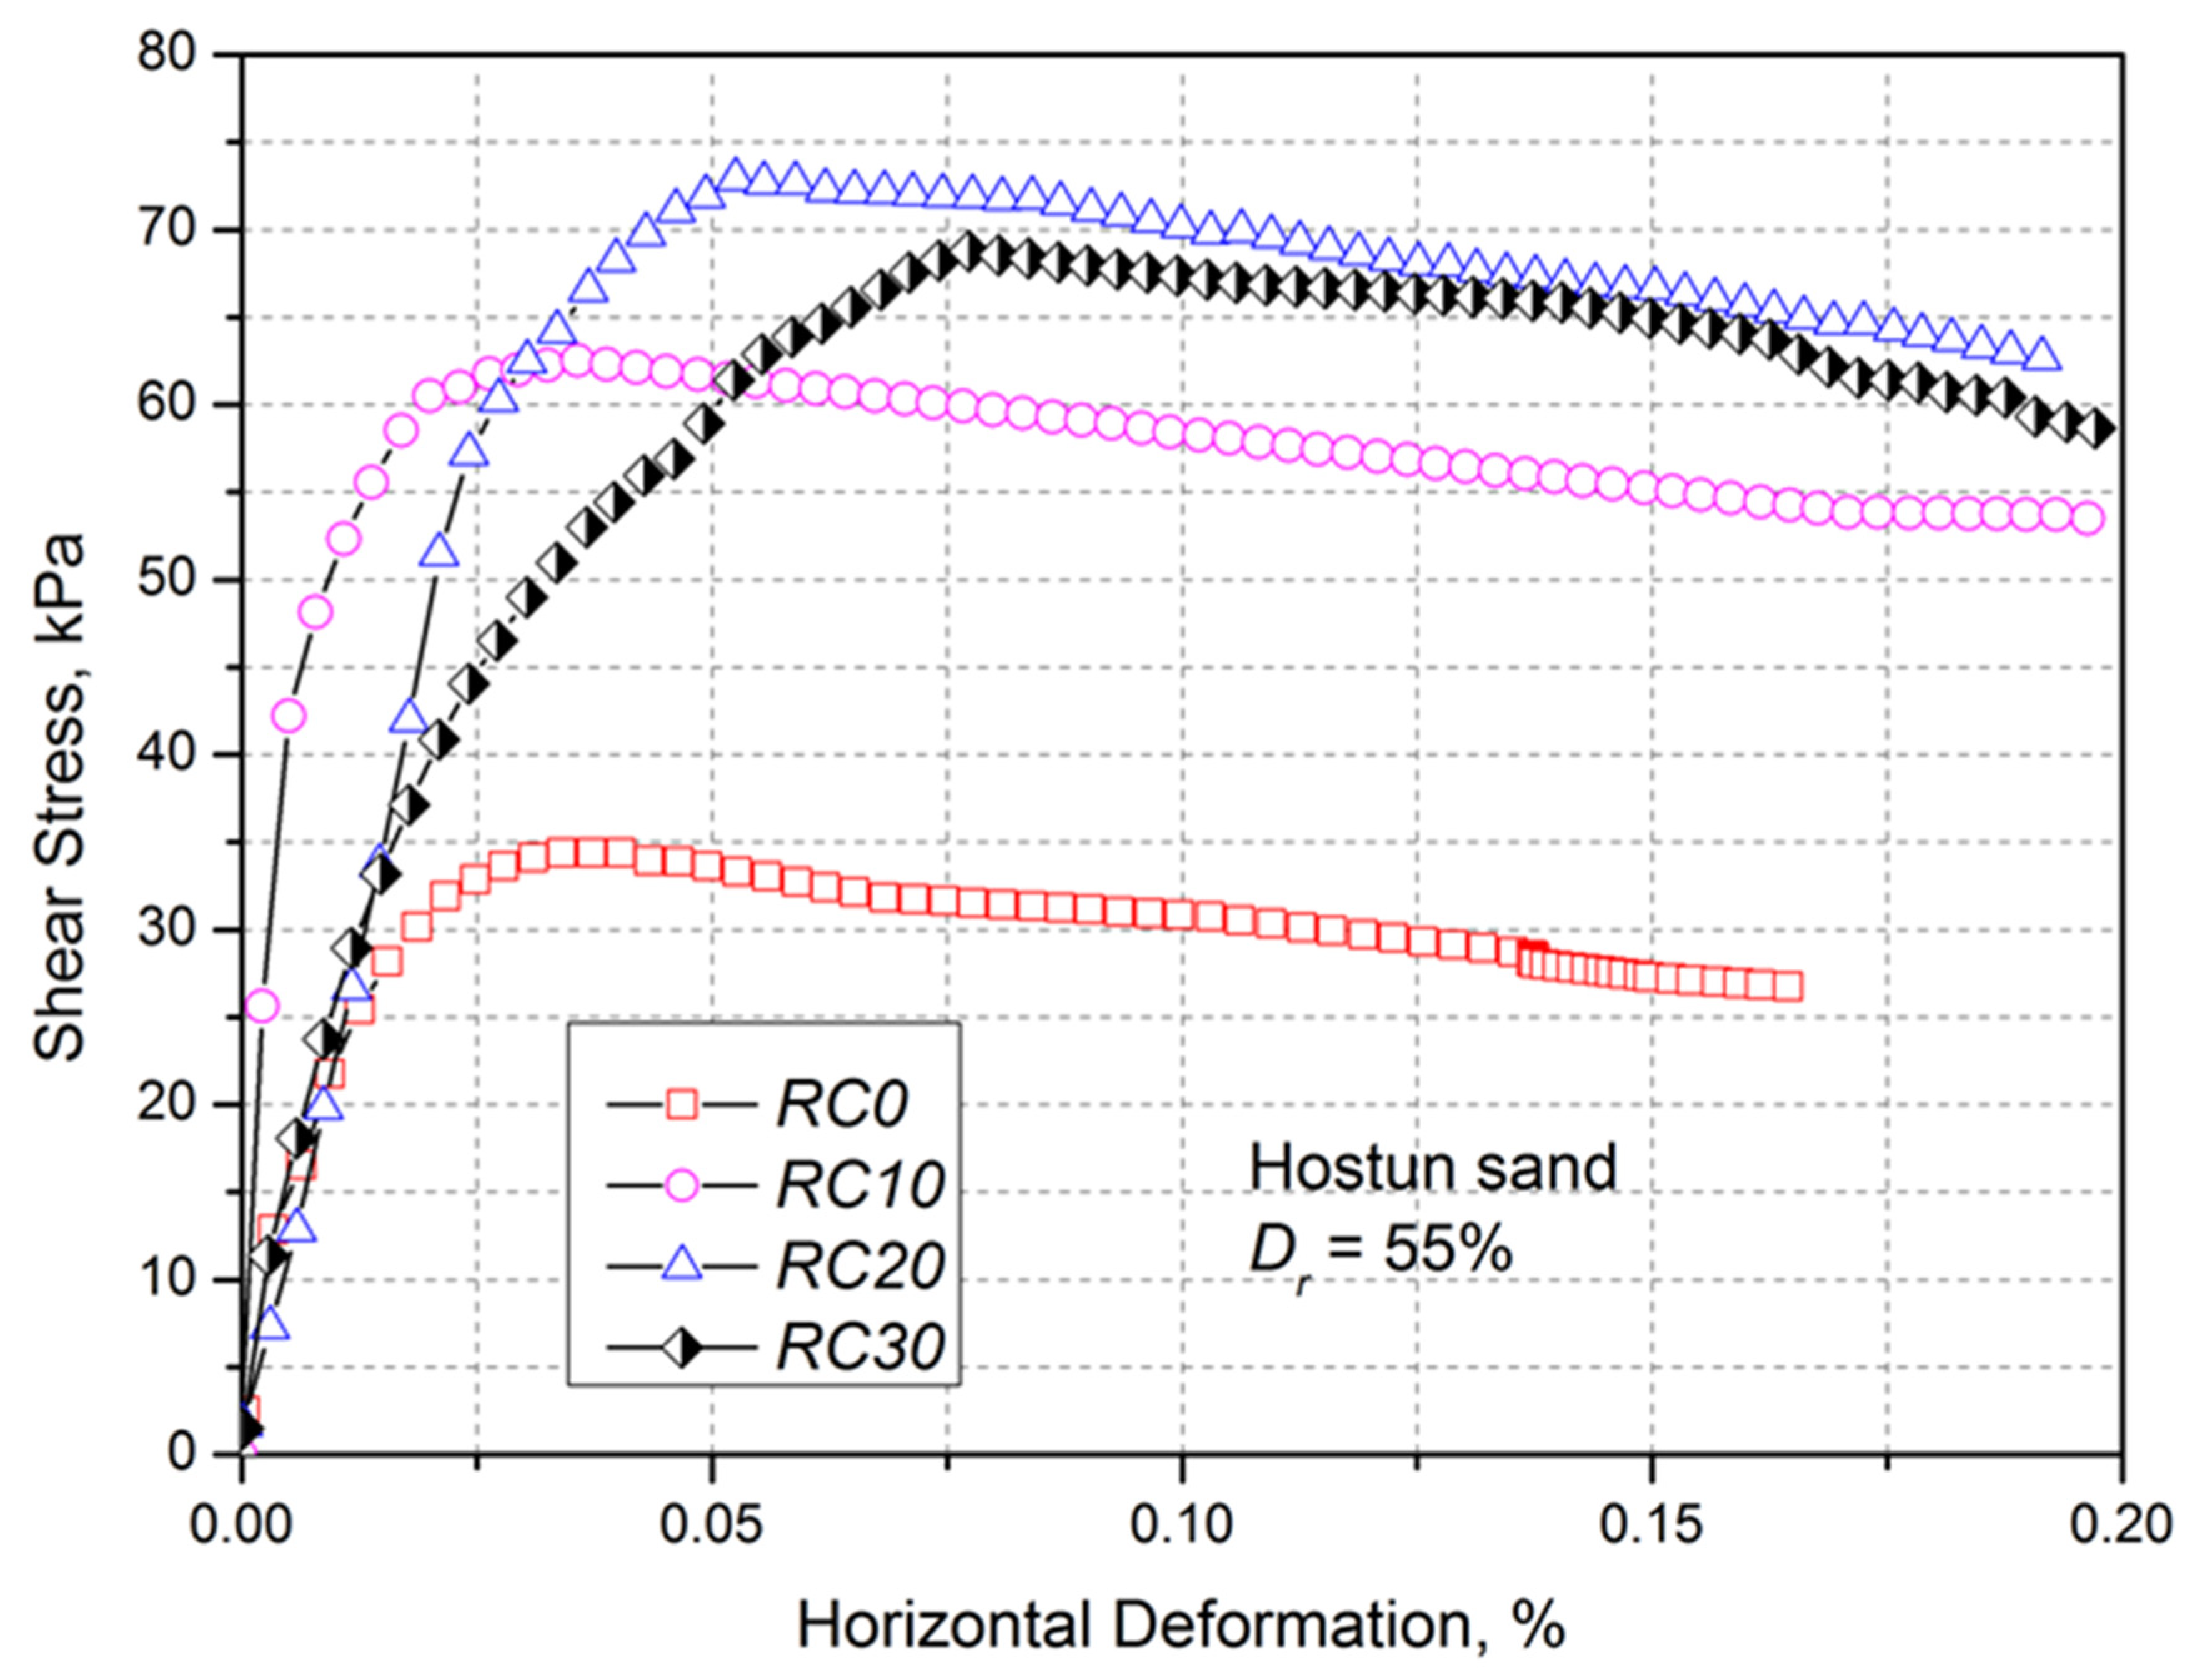
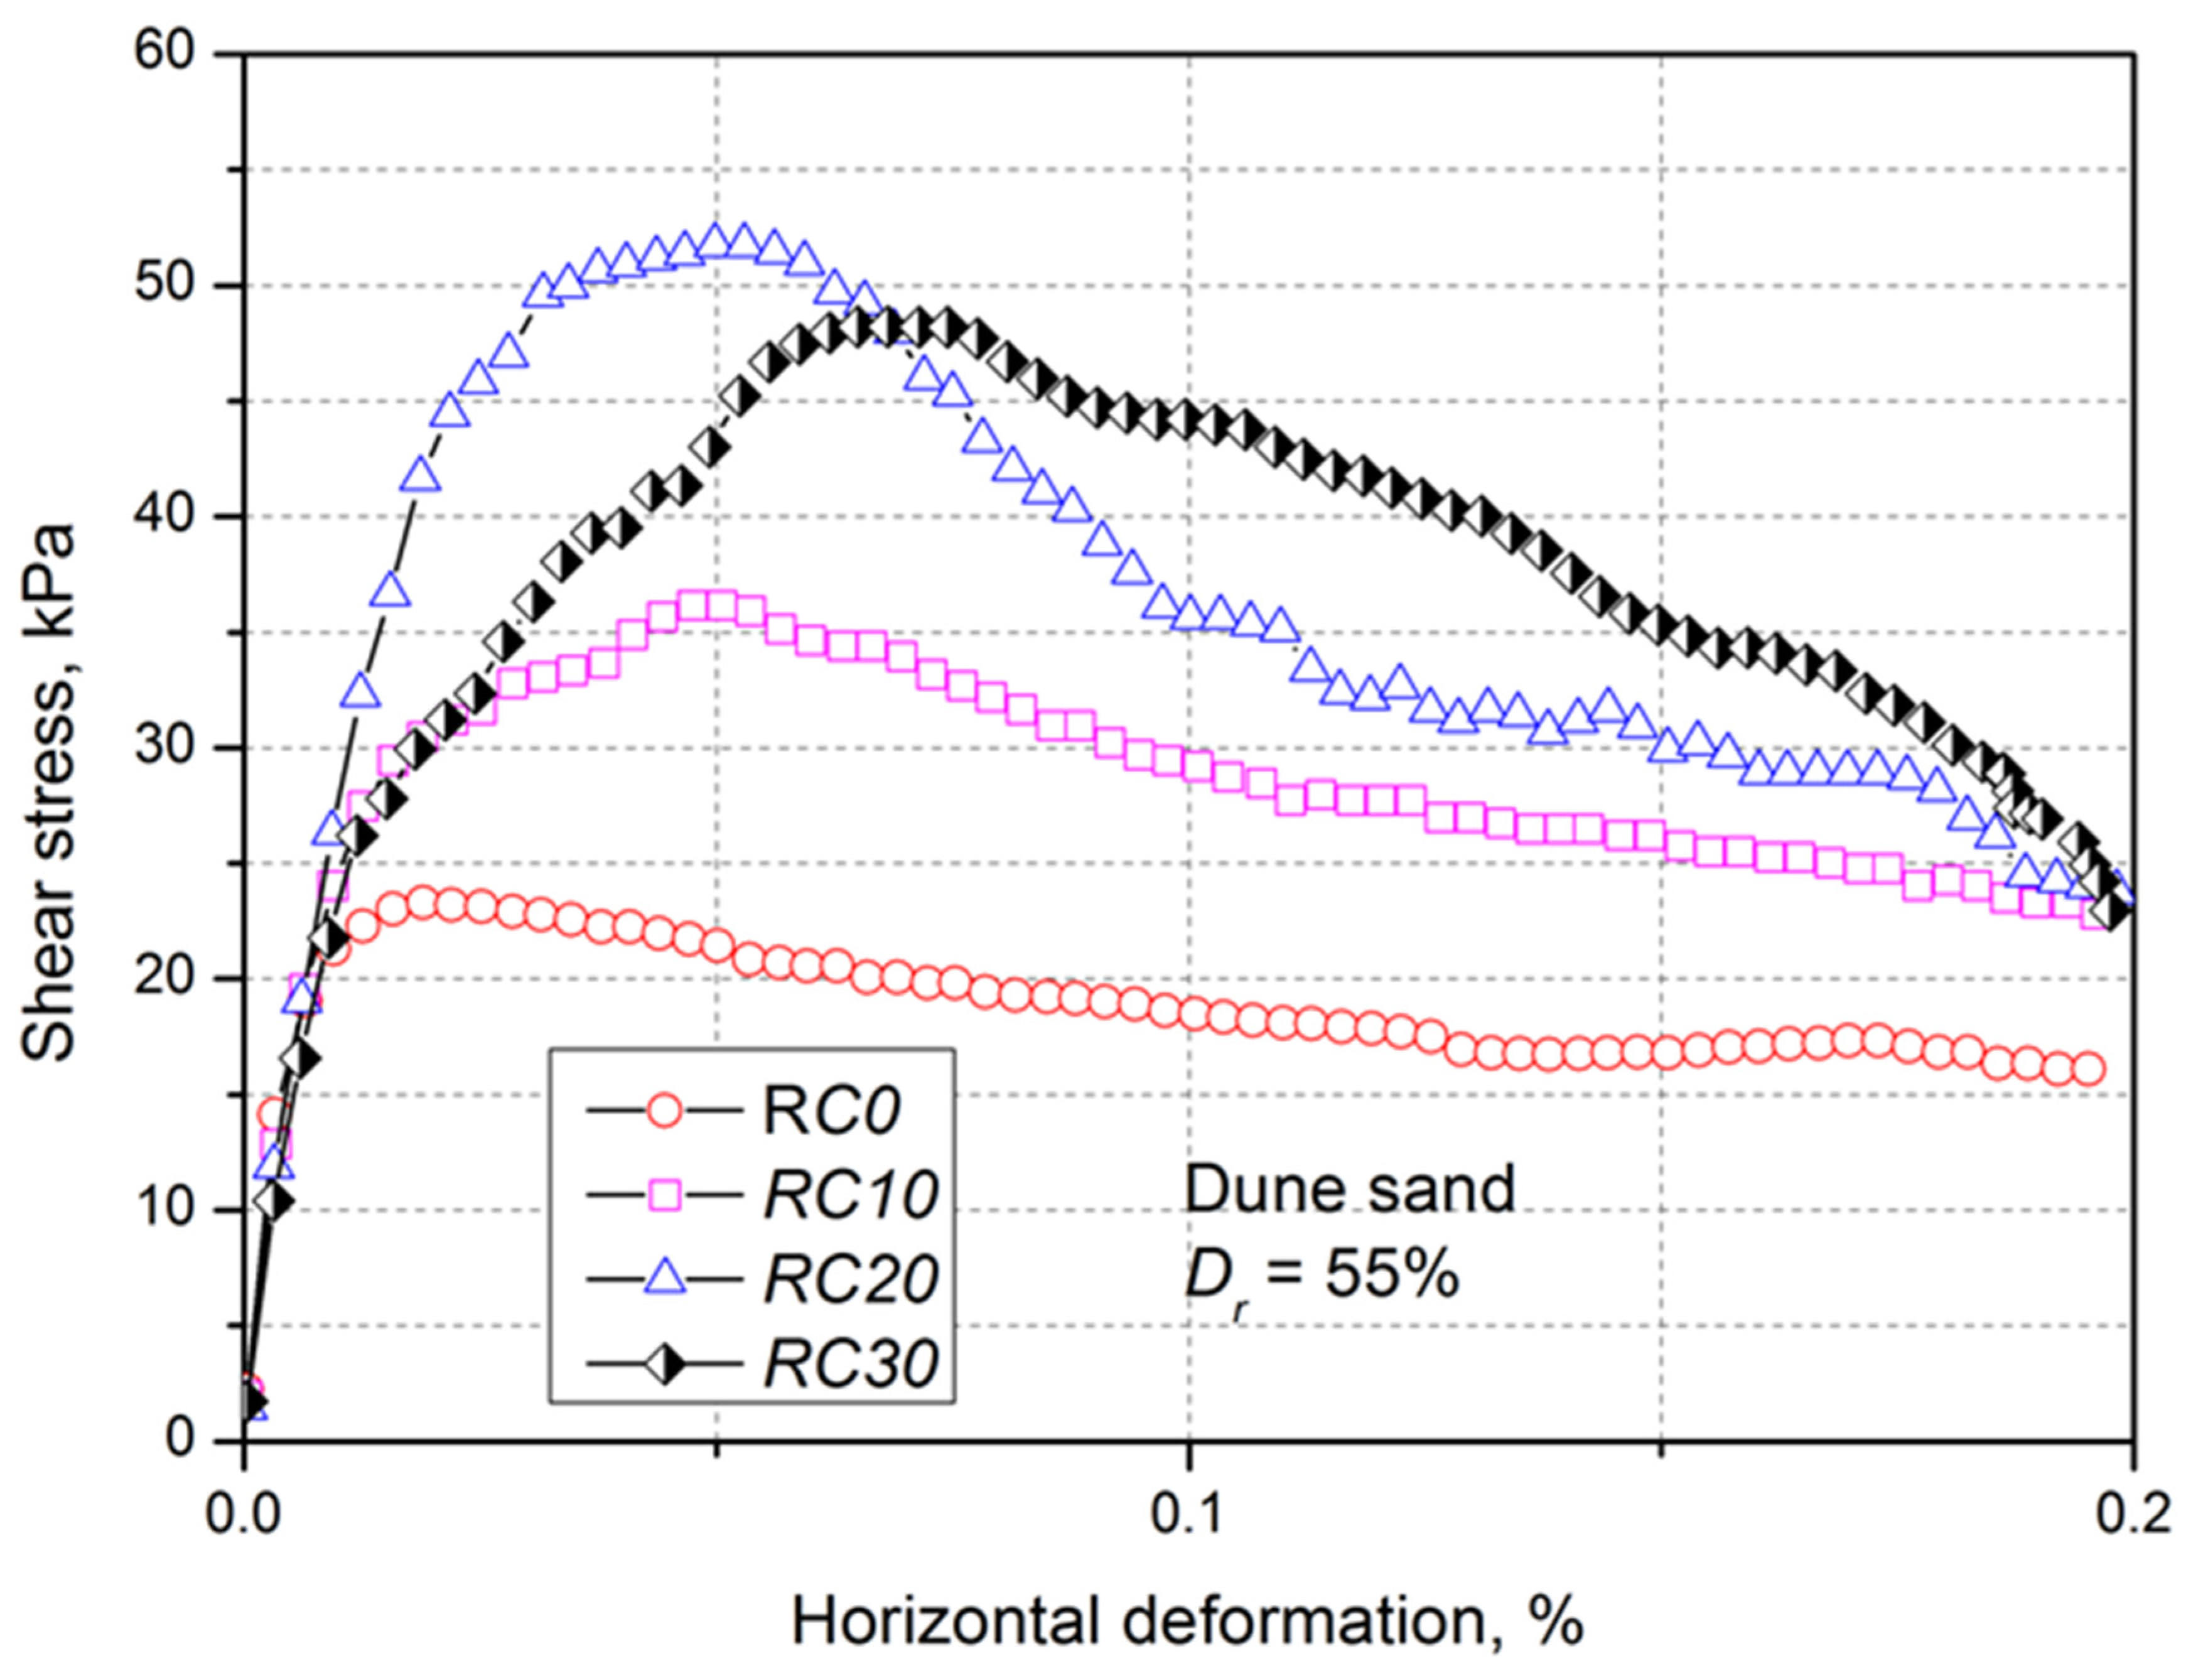
3.1. Effect of Aggregate Rubber Content on Shear Strength of Sand
3.2. Effect of Normal Stress on Shear Strength of Sand
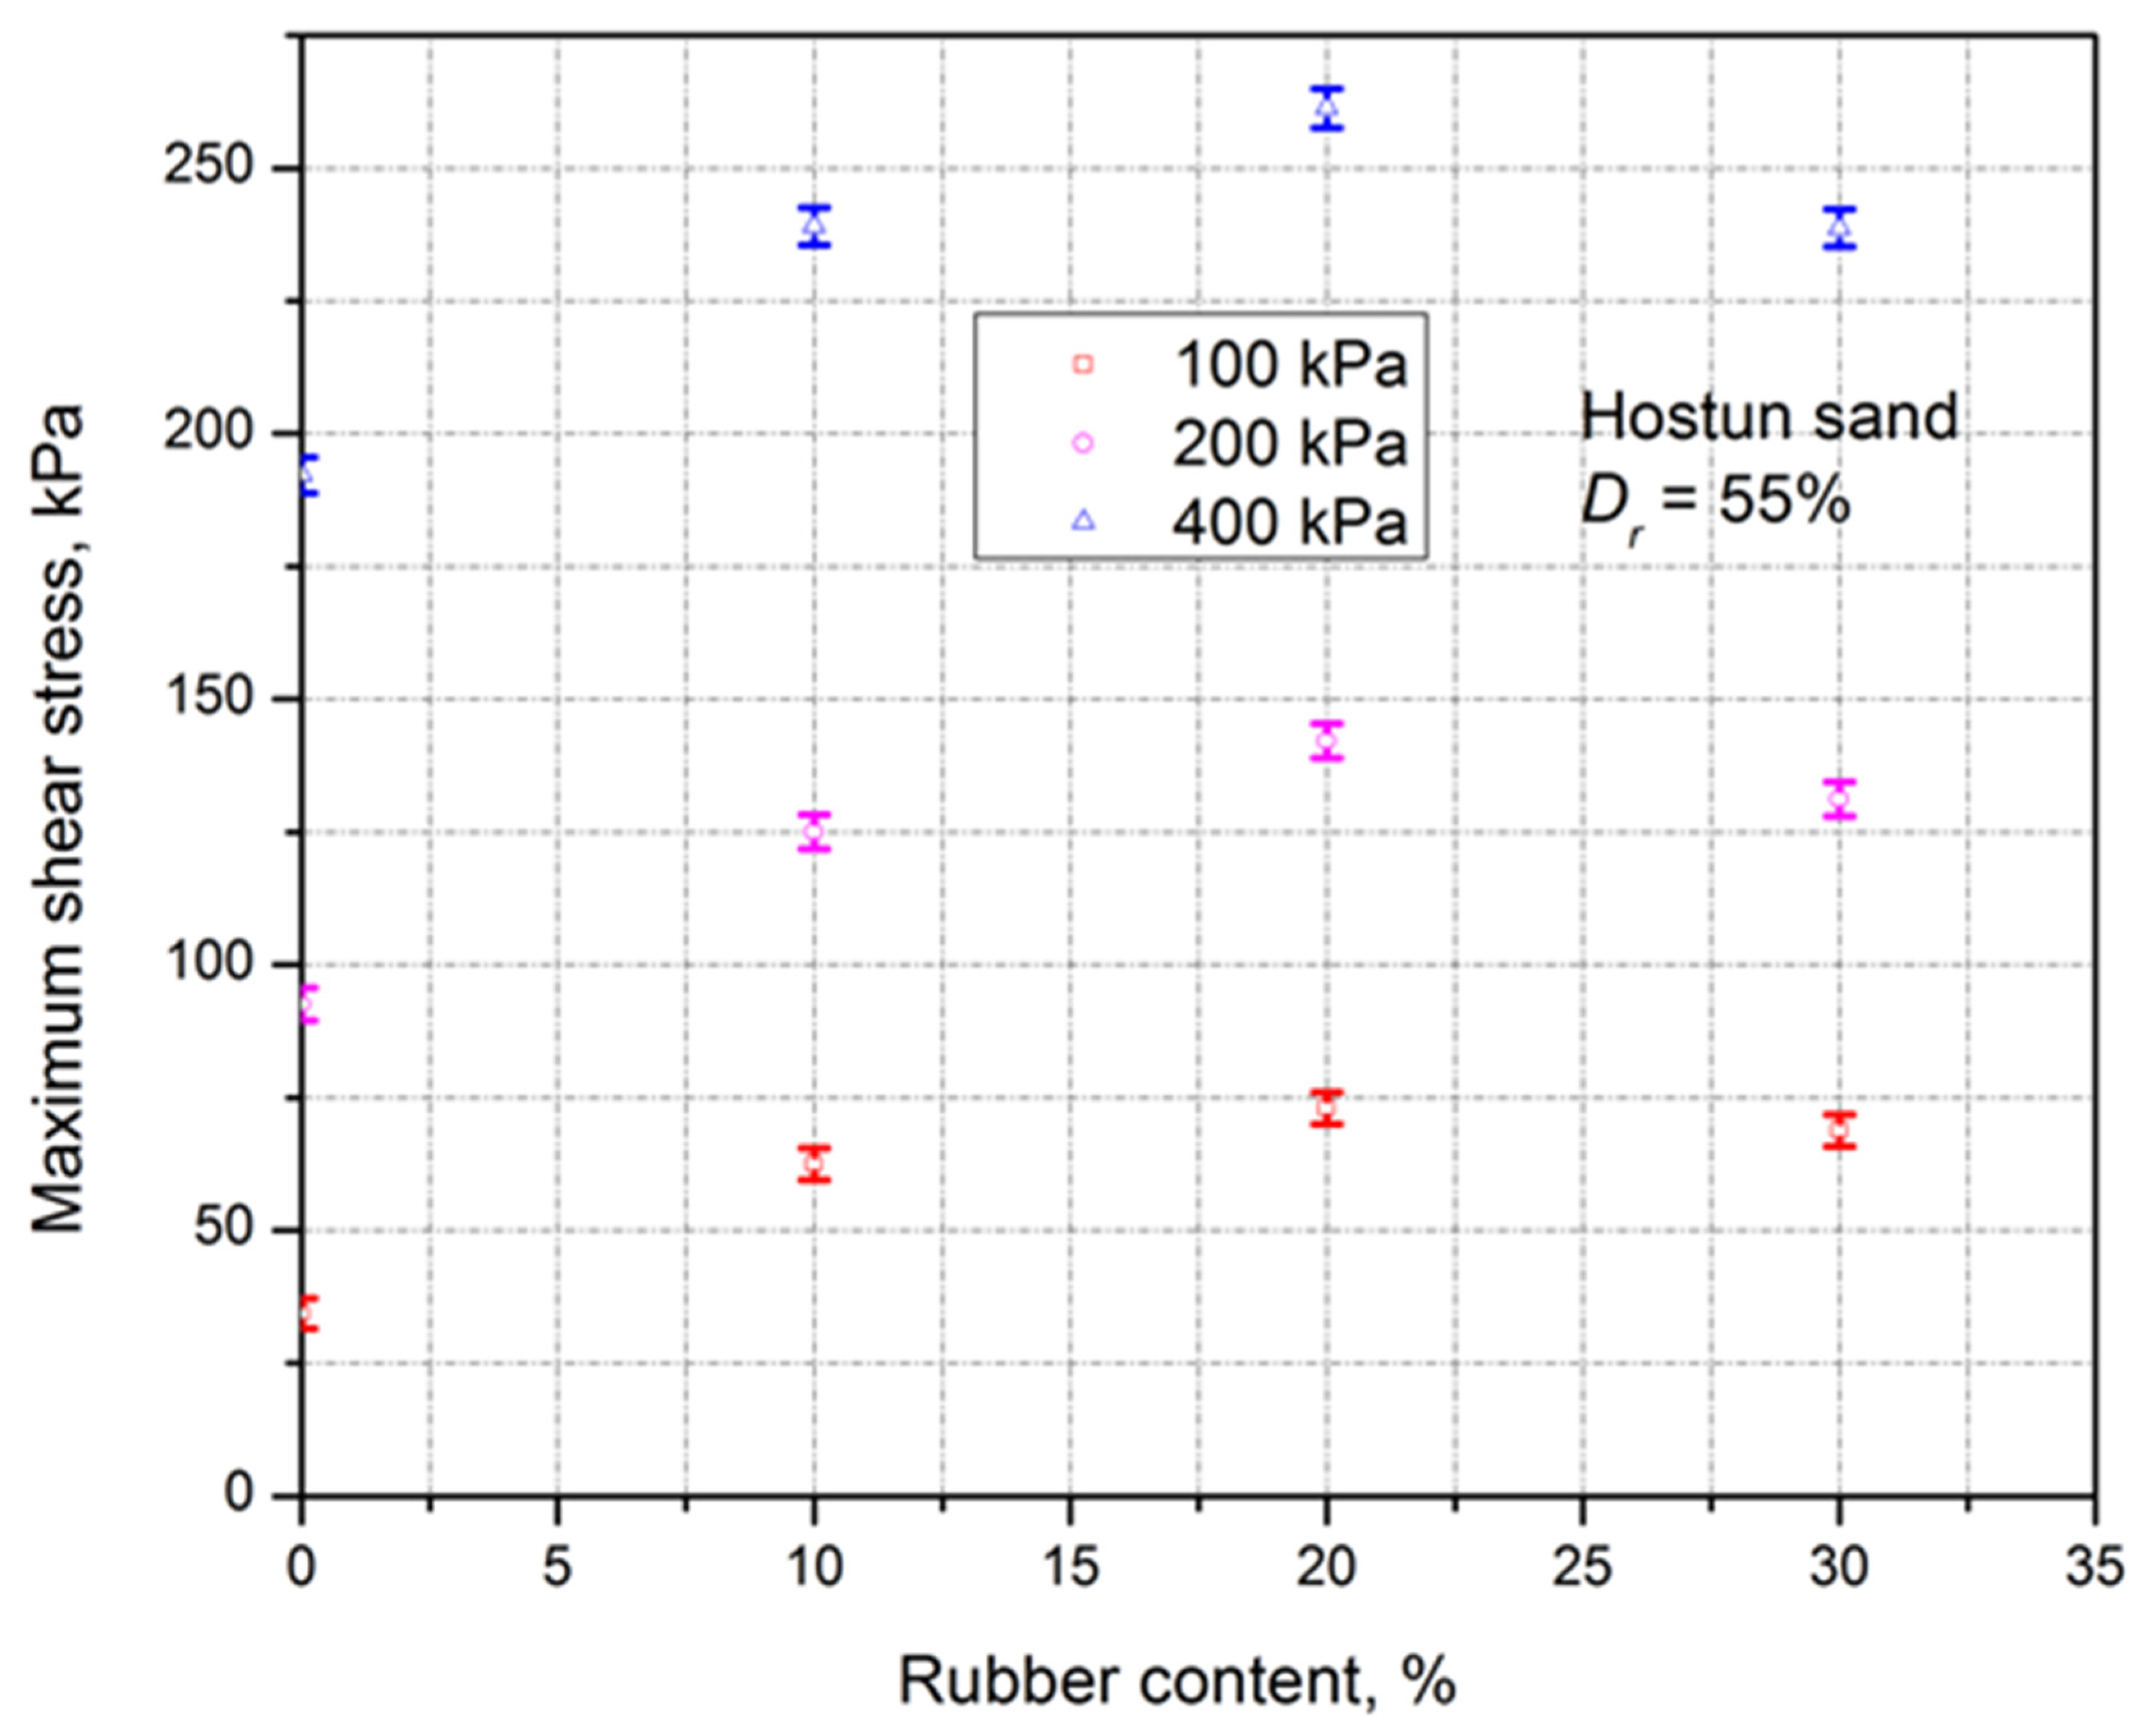
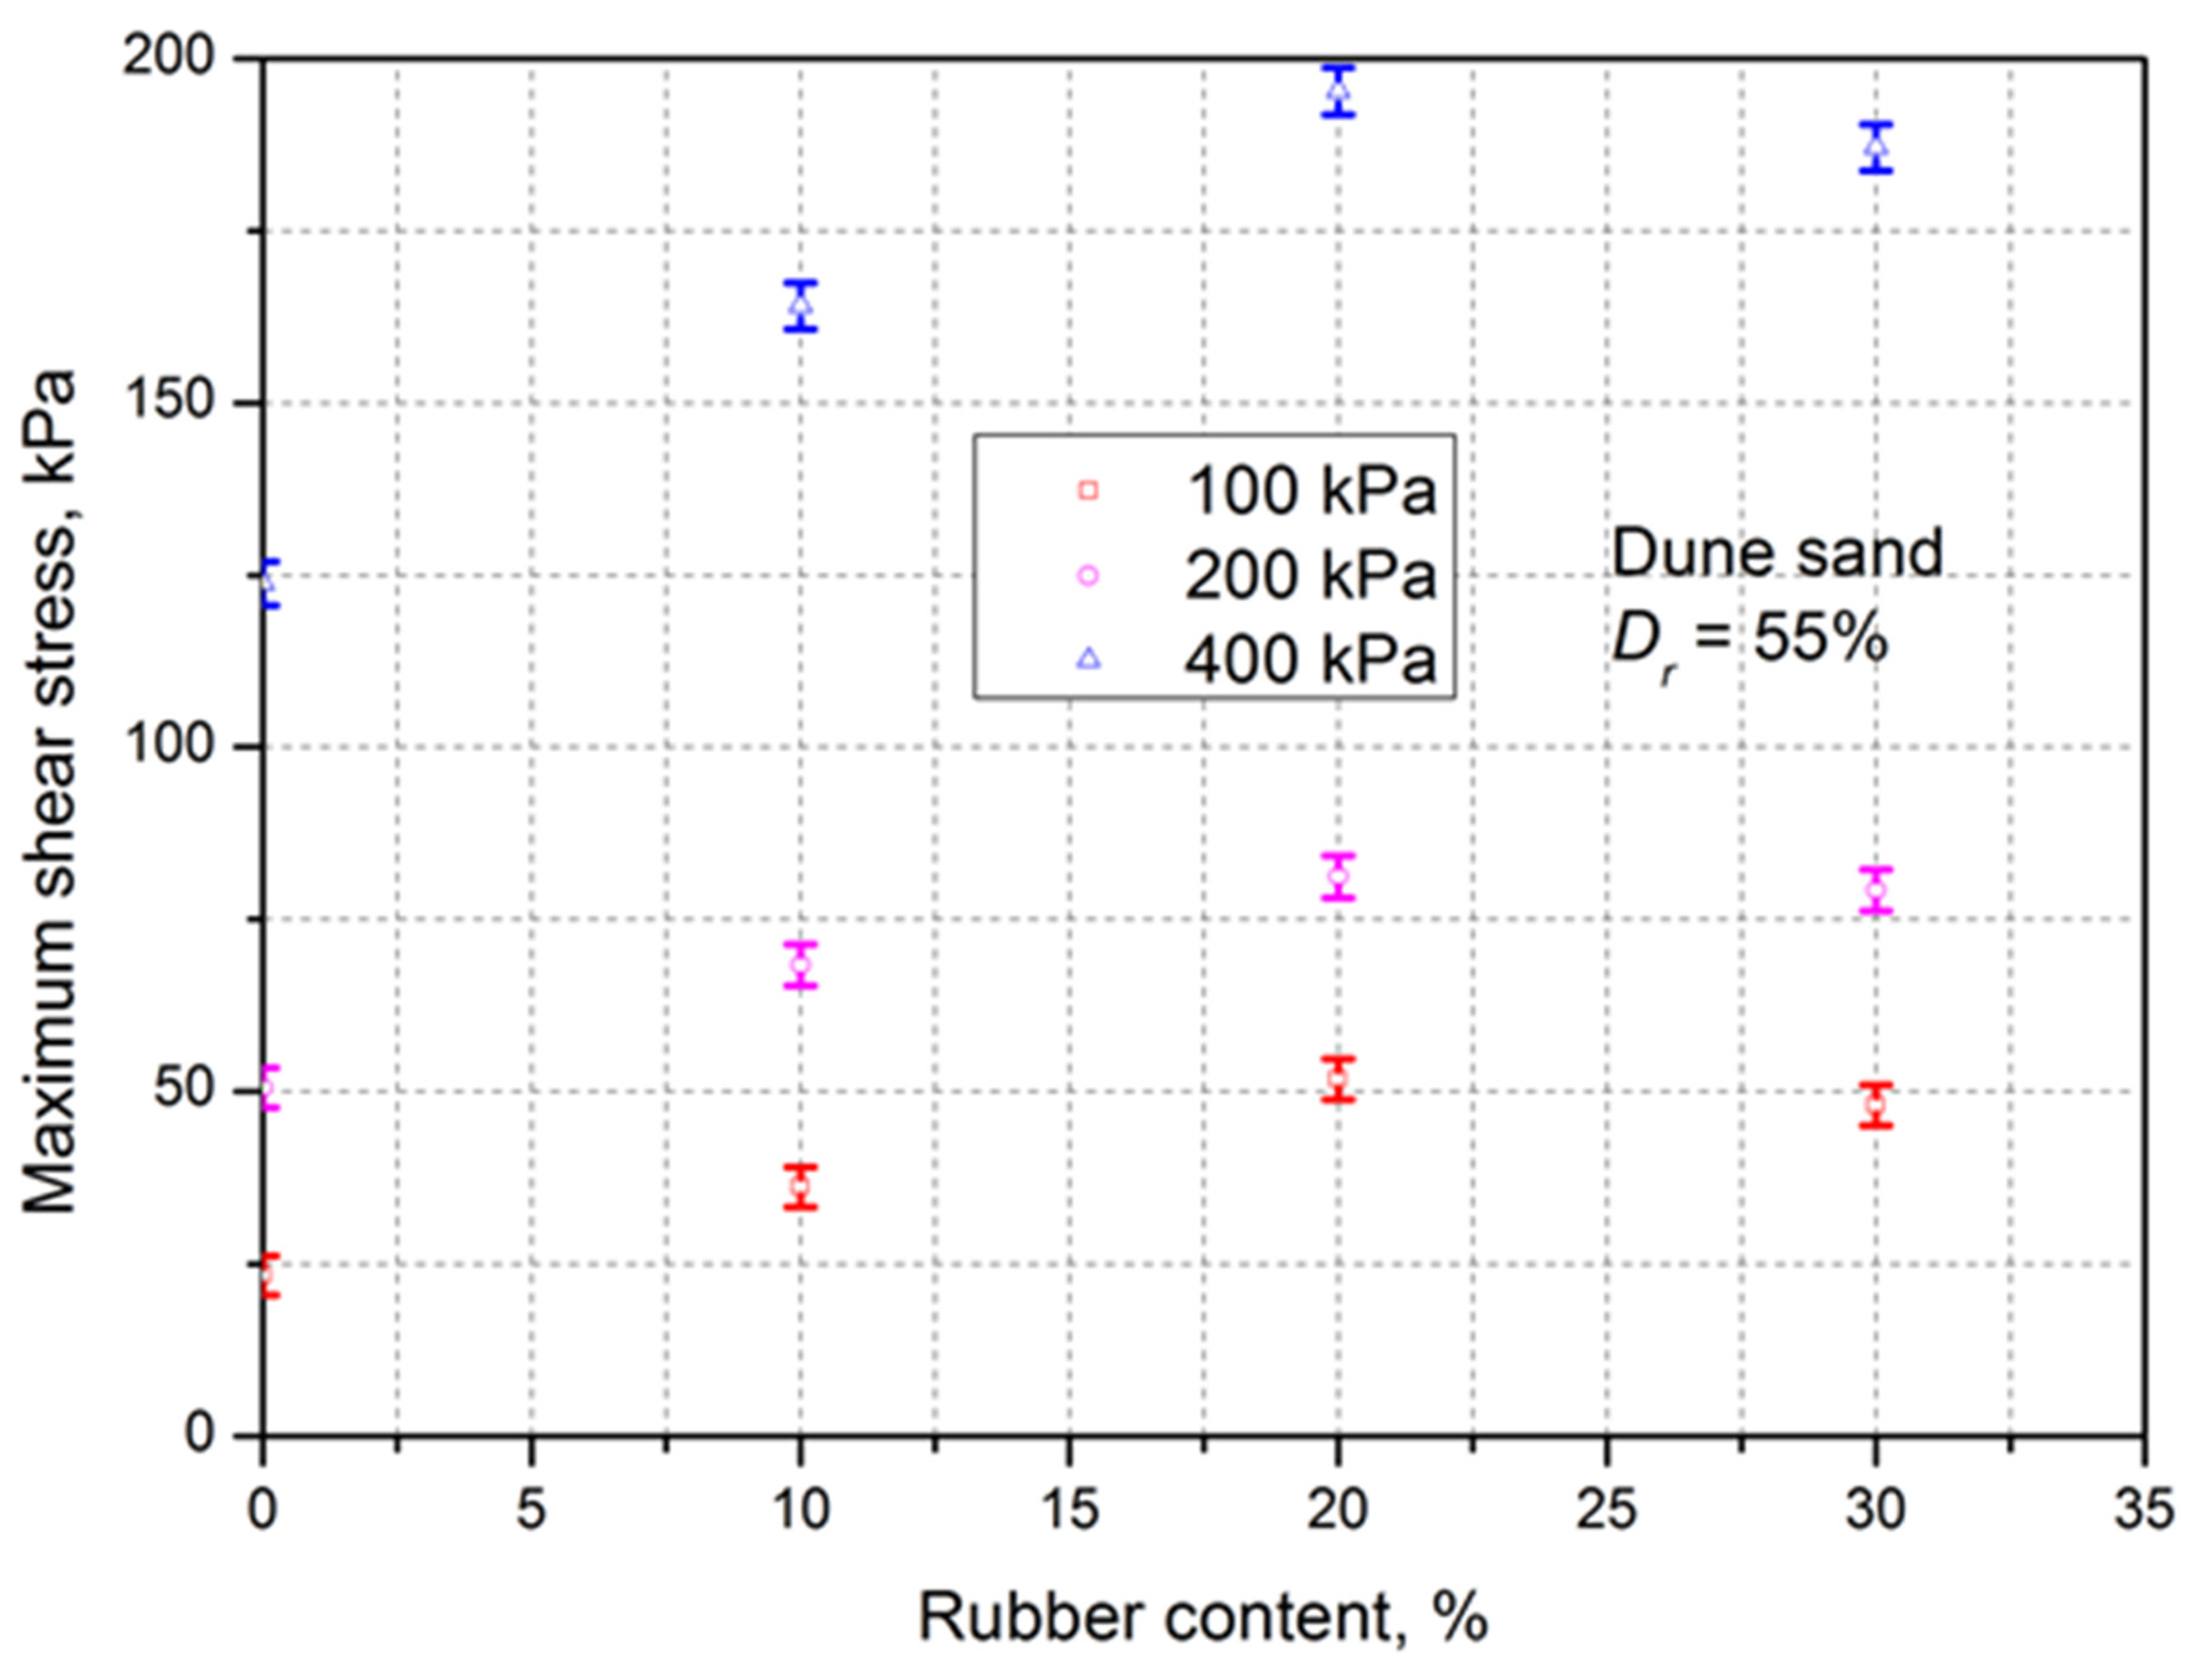
3.3. Effect of Rubber Content on Maximum Shear Strength of Sand
4. Conclusions
- -
- The increase in the aggregate rubber content from 0 to 20% induces an increase in the maximum shear strength of both sands and then it decreases beyond 20% rubber content.
- -
- The shear strength of the mixture increases with increasing normal stress.
- -
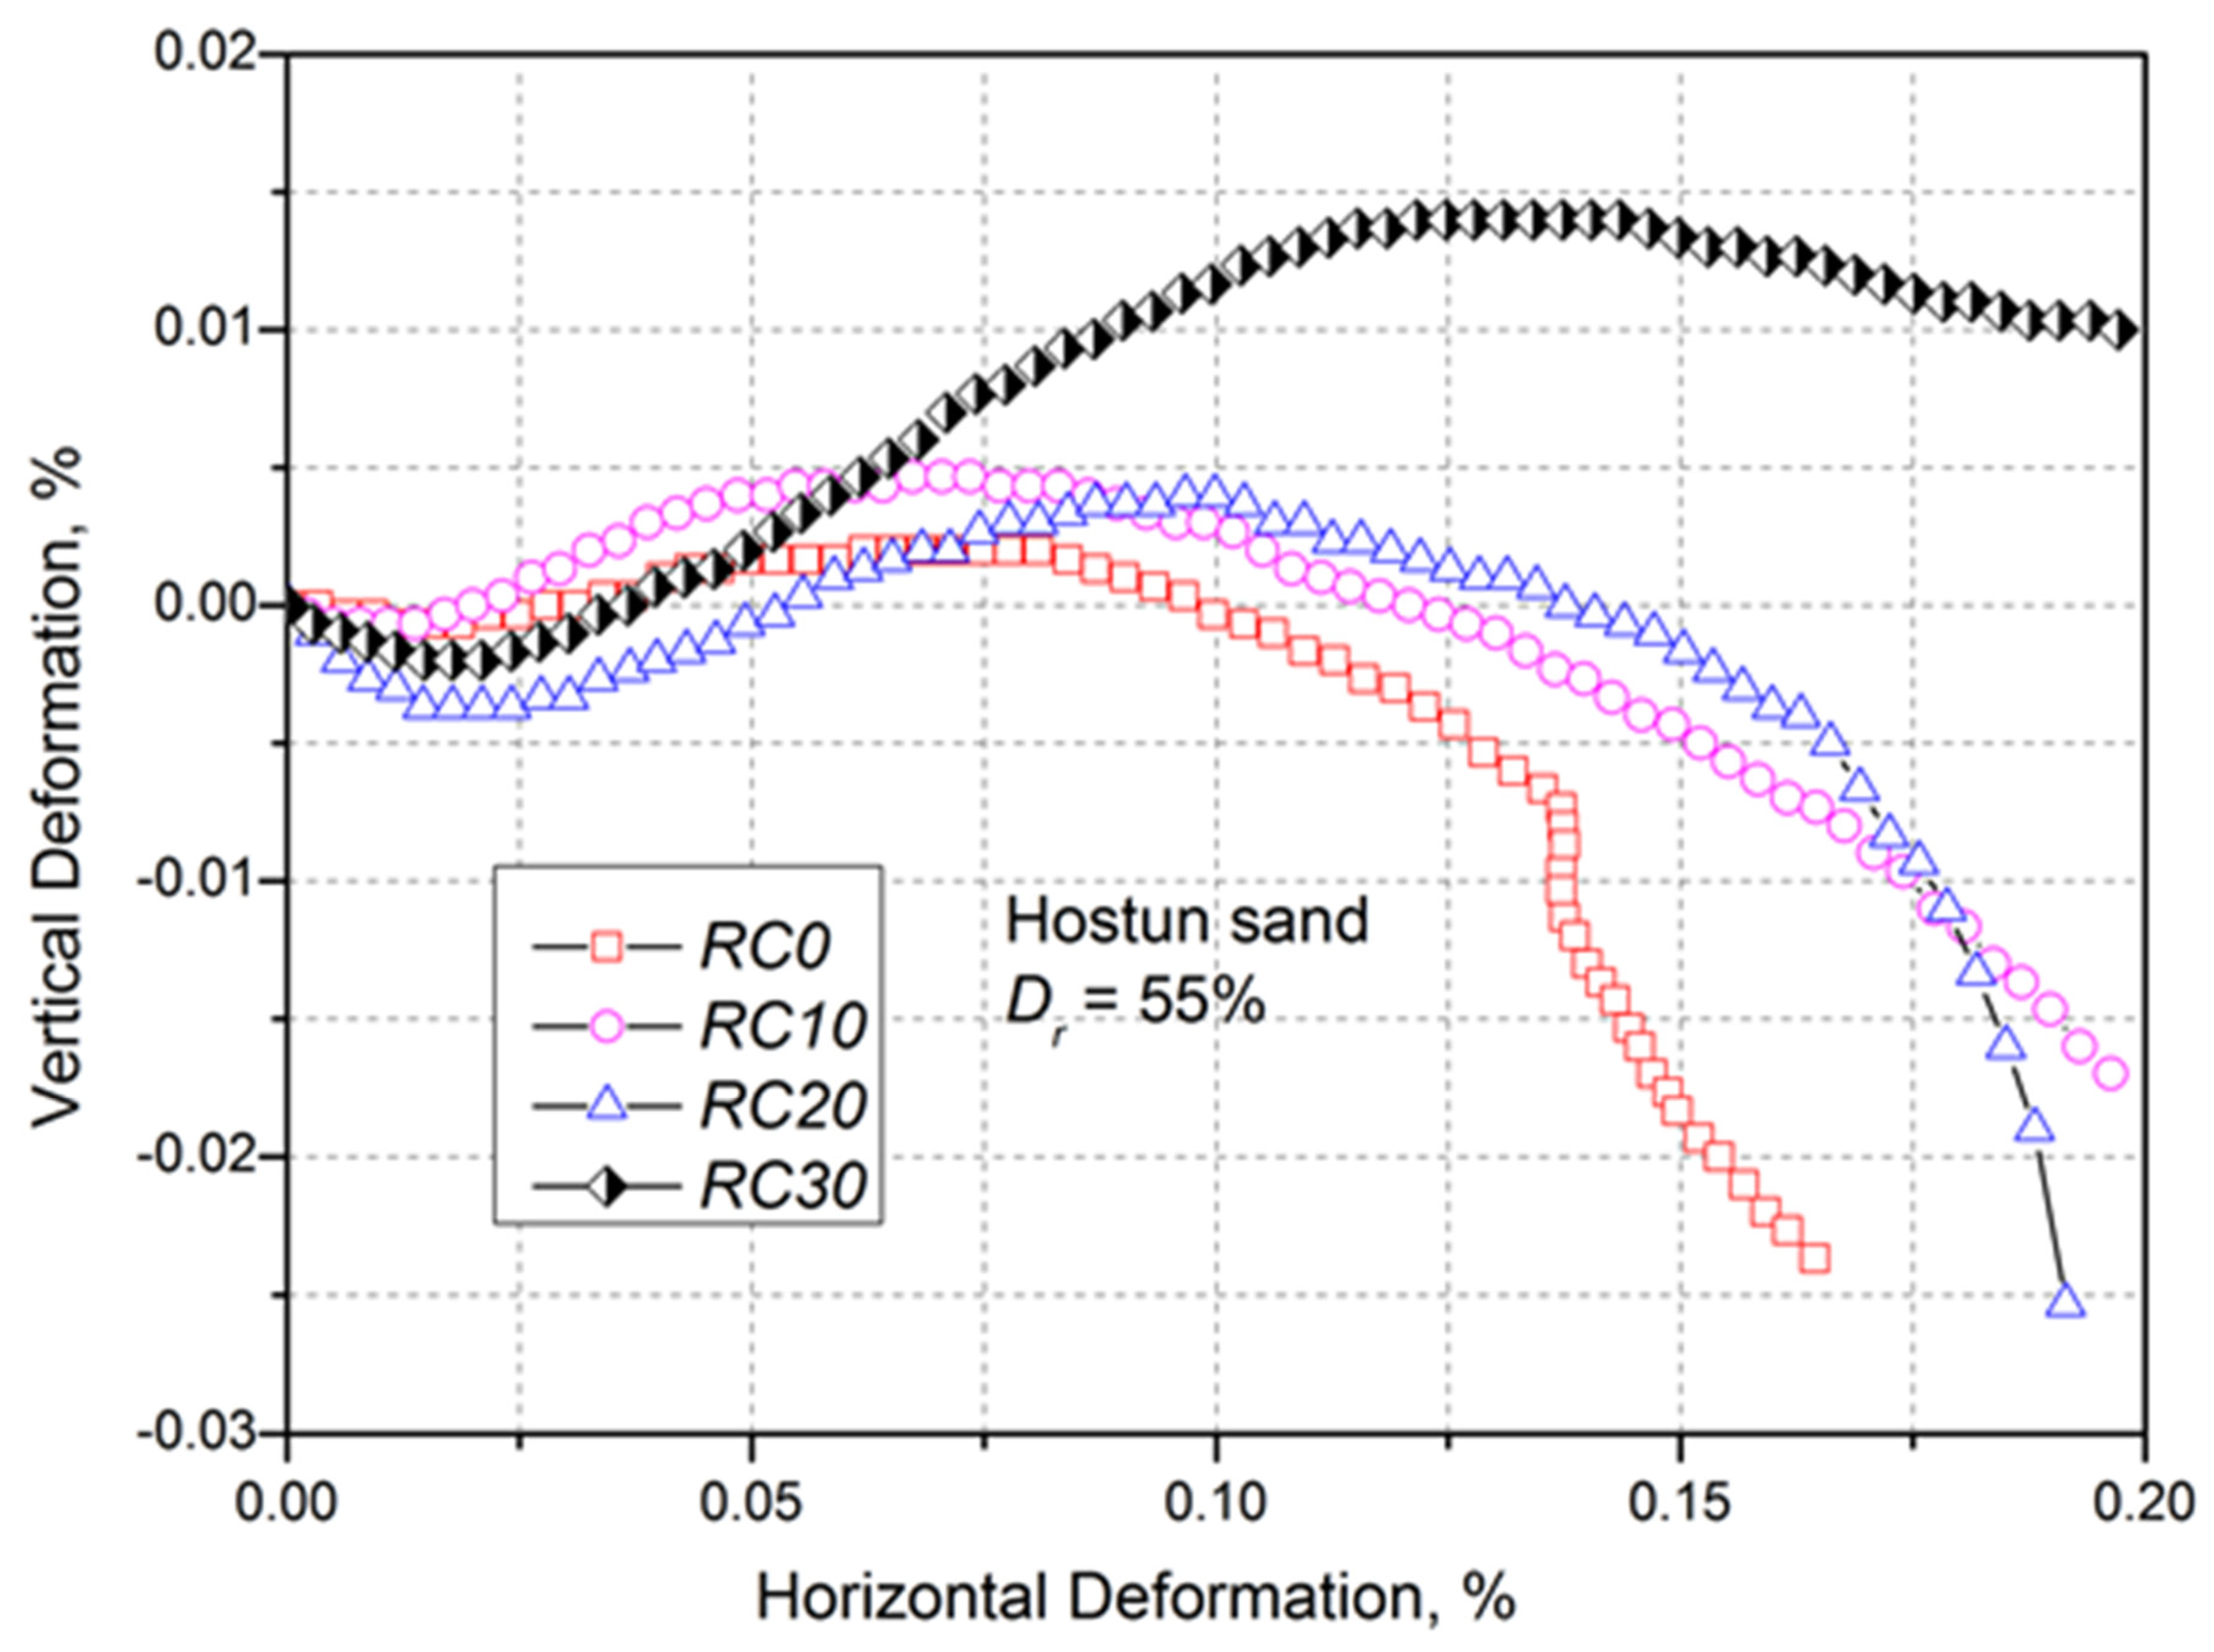
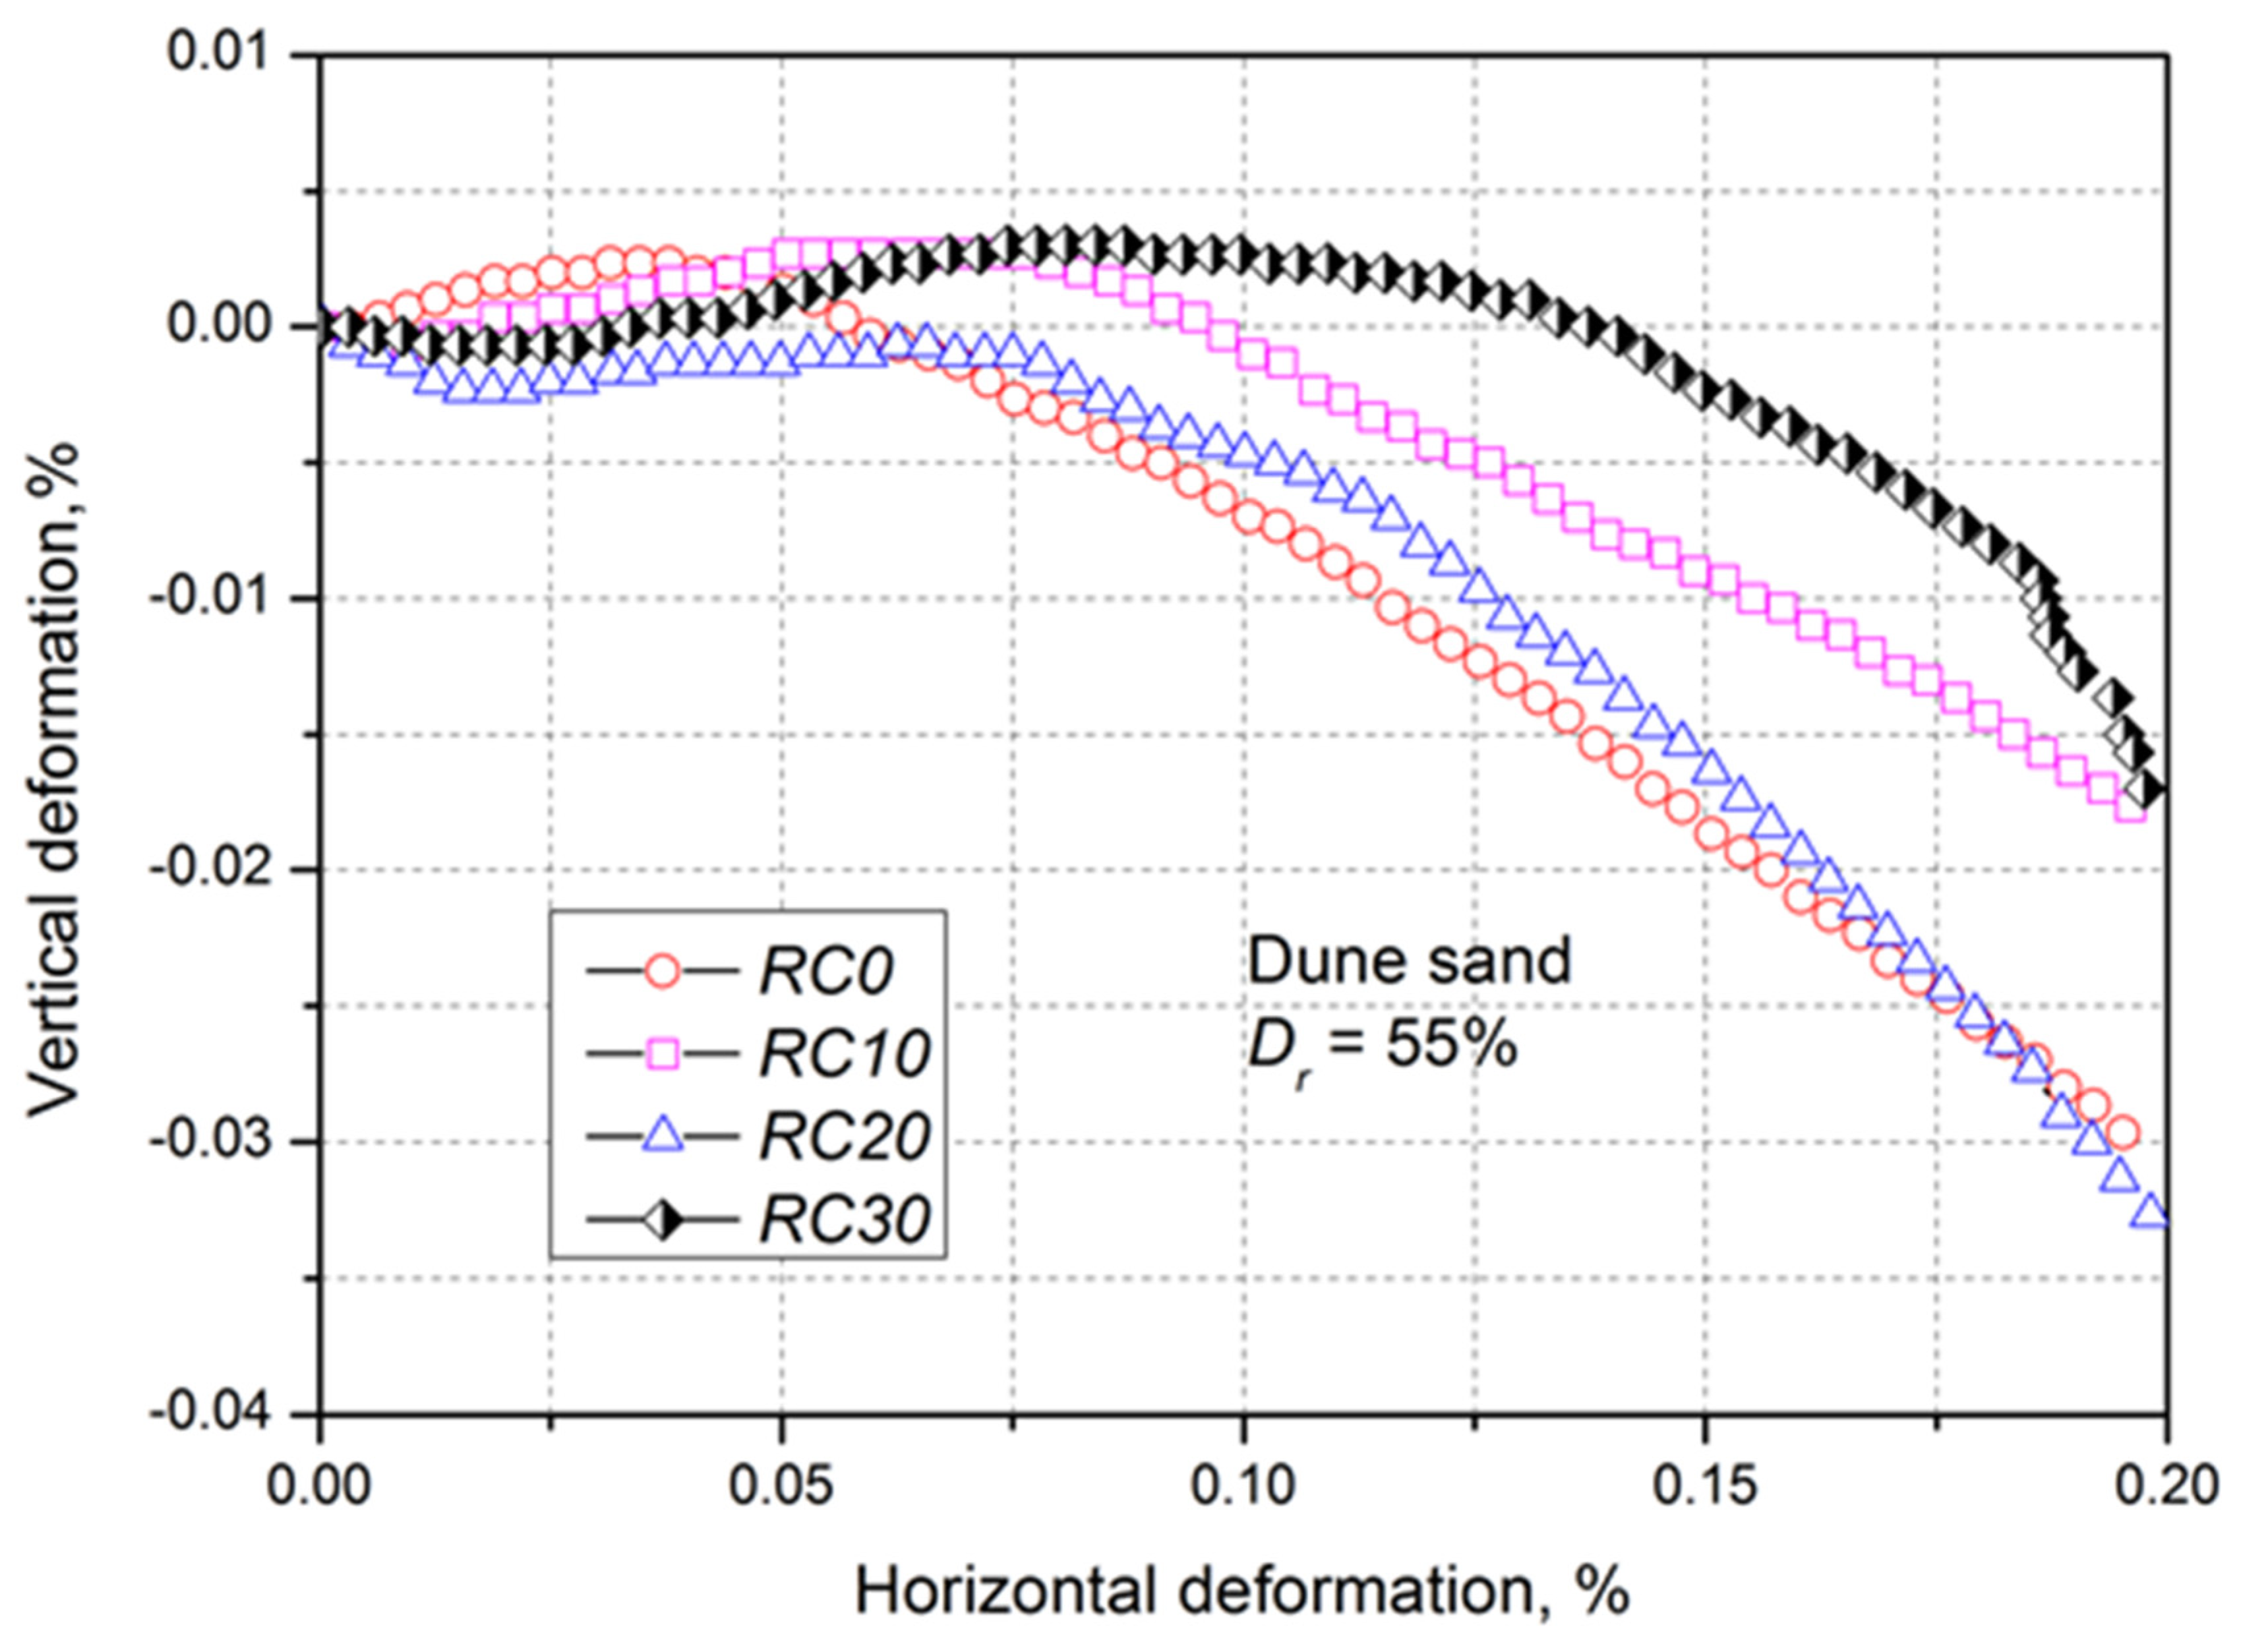
- The presence of rubbers amplifies the dilatant character of the sand-rubber mixture.
- -
- The friction angles obtained by the Hostun sand-rubber mixture are higher than those of the Dune sand-rubber mixture. This is explained on the one hand, by the increase in surface roughness of the grains sand inducing an increase in friction and on the other hand, by the redistribution of grains during shearing and a dilatation whose mobilization requires an additional effort increasing the mobilized friction angle.
Author Contributions
Funding
Institutional Review Board Statement
Informed Consent Statement
Data Availability Statement
Acknowledgments
Conflicts of Interest
References
- Edil, T.B.; Bosscher, P.J. Engineering properties of tire chips and soil mixtures. Geotech. Test J. 1994, 17, 453–464. [Google Scholar] [CrossRef]
- Foose, G.J.; Benson, C.H.; Bosscher, P.J. Sand reinforced with shredded waste tires. J. Geotech. Eng. 1996, 122, 760–767. [Google Scholar] [CrossRef]
- Ghazavi, M.; Sakhi, M.A. Influence of optimized tire shreds on shear strength parameters of sand. Int. J. Geomech. 2005, 5, 58–65. [Google Scholar] [CrossRef]
- ASTM D 6270 Standard practices for use of scrap tires in civil engineering applications. In American Society for Testing and Materials; ASTM International: West Conshohocken, PA, USA, 2008.
- Bali Reddy, S.; Pradeep Kumar, D.; Murali Krishna, A. Evaluation of the optimum mixing ratio of a sand-tire chips mixture for geoengineering applications. J. Mater. Civ. Eng. 2016, 28, 06015007. [Google Scholar] [CrossRef]
- Kim, H.K.; Santamarina, J.C. Sand–rubber mixtures (large rubber chips). Can. Geotech. J. 2008, 45, 1457–1466. [Google Scholar] [CrossRef] [Green Version]
- Zhang, T.; Cai Gand Duan, W. Strength and microstructure characteristics of the recycled rubber tire-sand mixtures as lightweight backfill. Environ. Sci. Pollut. Res. 2018, 25, 3872–3883. [Google Scholar] [CrossRef] [PubMed]
- Madhusudhan, B.R.; Boominathan, A.; Banerjee, S. Factors affecting strength and stiffness of dry sand-rubber tire shred mixtures. Geotech. Geol. Eng. 2019, 37, 2763–2780. [Google Scholar] [CrossRef]
- Cabalar, A.F. Direct shear tests on waste tires–sand mixtures. Geotech. Geol. Eng. 2011, 29, 411–418. [Google Scholar] [CrossRef]
- Marto, A.; Latifi, N.; Moradi, R.; Oghabi, M.; Zolfeghari, S.Y. Shear properties of sand-tire chips mixtures. Electron. J. Geotech. Eng. 2013, 18, 325–334. [Google Scholar]
- Ghazavi, M.; Ghaffari, J.; Farshadfar, A. Experimental determination of waste tire chip-sand-geogrid interface parameters using large direct shear tests. In Proceedings of the 5th Symposium on Advances in Science and Technology, Mashhad, Iran, 12–14 May 2011. [Google Scholar]
- Tiwari, S.K.; Sharma, J.P.; Yadav, J.S. Geotechnical Properties of Dune sand-Waste Tires Composite. Mater. Today Proc. 2017, 4, 9851–9855. [Google Scholar] [CrossRef]
- Anbazhagan, P.; Manohar, D.R.; Rohit, D. Influence of size of granulated rubber and tyre chips on the shear strength characteristics of sand–rubber mix. Geomech. Geoengin. 2017, 12, 266–278. [Google Scholar] [CrossRef]
- Negadi, K.; Arab, A. A Direct Shear Investigation on the Determination of the Shearing Resistance of Reinforced Soil with Waste Rubber. In Proceedings of the 1st Conference of the Arabian Journal of Geosciences, Hammamet, Tunisia, 12–15 November 2018; pp. 295–299. [Google Scholar]
- Balaban, E.; Smejda, A.; Onur, M.I. Influence of tire crumbs on mechanical properties of sand-fine soil mixtures. Geomech. Geoengin. 2019, 1–16. [Google Scholar] [CrossRef]
- Enquan, Z.; Qiong, W. Experimental investigation on shear strength and liquefaction potential of rubber-sand mixtures. Adv. Civ. Eng. 2019, 2019, 5934961. [Google Scholar] [CrossRef] [Green Version]
- Aksoy, H.S.; Taher, N.; Awlla, H.A. Shear strength parameters of sand-tire chips mixtures. Gümüşhane Üniversitesi Fen Bilimleri Enstitüsü Dergisi 2021, 11, 713–720. [Google Scholar] [CrossRef]
- Rouhanifar, S.; Afrazi, M.; Fakhimi, A.; Yazdani, M. Strength and deformation behaviour of sand-rubber mixture. Int. J. Geotech. Eng. 2021, 15, 1078–1092. [Google Scholar] [CrossRef]
- Moo-Young, H.; Ochola, C.; Zeroka, D.; Sellassie, K.; Sabnis, G.; Glass, C.; Thornton, O. Guidance Document for Scrap Tire Utilization in Embankments; Penndot Research: Harrisburg, PA, USA, 2001. [Google Scholar]
- Chittella, H.; Yoon, L.W.; Ramarad, S.; Lai, Z.W. Rubber waste management: A review on methods, mechanism, and prospects. Polym. Degrad. Stab. 2021, 194, 109761. [Google Scholar] [CrossRef]
- Ealding, W. Final Report on Leachable Metals in Scrap Tires; Virginia Department of Transportation: Richmond, VA, USA, 1992. [Google Scholar]
- Edil, T.B.; Bosscher, P.J. Development of engineering criteria for shredded waste tires in highway applications. In Final Report GT-92-9; Wisconsin Department of Transportation: Madison, WI, USA, 1992. [Google Scholar]
- Westerberg, B.; Macsik, J. Geotechnical and environmental properties of tyre shreds in civil engineering applications. In Proceedings of the International Symposium organised by the Concrete Technology Unit, Dundee, UK, 19–20 March 2001; pp. 129–139. [Google Scholar]
- Humphrey, D.N. Investigation of Exothermic Reaction in Tire Shred Fill Located on SR 100 in Ilwaco; DN Humphrey: Washington, DC, USA, 1996. [Google Scholar]
- Yoon, S.; Prezzi, M.; Siddiki, N.Z.; Kim, B. Construction of a test embankment using a sand–tire shred mixture as fill material. Waste Manag. 2006, 26, 1033–1044. [Google Scholar] [CrossRef] [PubMed]
- Crane, G.; Elefritz, R.A.; Kay, E.L.; Laman, J.R. Scrap tire disposal procedures. Rubber Chem. Technol. 1978, 51, 577–599. [Google Scholar] [CrossRef]
- Simm, J.D.; Wallis, M. Sustainable Re-Use of Tyres in Port, Coastal and River Engineering: Guidance for Planning, Implementation and Maintenance; HR Wallingford: Wallingford, UK, 2008. [Google Scholar]
- Collins, K.J.; Jensen, A.C.; Mallinson, J.J.; Roenelle, V.; Smith, I.P. Environmental impact assessment of a scrap tyre artificial reef. ICES J. Mar. Sci. 2002, 59, S243–S249. [Google Scholar] [CrossRef] [Green Version]
- Norme NF P94-054. Sols: Reconnaissance et Essais—Détermination de la Masse Volumique des Particules Solides des Sols—Méthode du Pycnomètre à Eau; Editions AFNOR Boutique: Saint-Denis, France, 1991.
- Norme NF P94-512-3. Reconnaissance et Essais Géotechniques. Essai de Sol au Laboratoire. Partie 3: Détermination de la Masse Volumique des Grains Méthode du Pycnomètre; Editions AFNOR Boutique: Saint-Denis, France, 2005.
- Norme NF P94-056. Sols: Reconnaissances et Essais, Analyse Granulométrique, Méthode de Tamisage à Sec après Lavage; Editions AFNOR Boutique: Saint-Denis, France, 1996.
- Norme NF P94-050. Sols: Reconnaissance et Essais Détermination de la Teneur en Eau Pondérale des Sols—Méthode par Etuvage; Editions AFNOR Boutique: Saint-Denis, France, 1991.
- Norme NF P94-059. Sols: Reconnaissance et Essais Détermination des Masses Volumiques Minimale et Maximale des Sols Non Cohérents; Editions AFNOR Boutique: Saint-Denis, France, 2000.
- Norme NF P94-071-1. Sols: Reconnaissance et Essais—Essai de Cisaillement Rectiligne à la Boîte-Partie 1: Cisaillement Direct; Editions AFNOR Boutique: Saint-Denis, France, 1994.


| Rubber Aggregate Classes | Dimensions |
|---|---|
| Crumbs | Less than 425 µm |
| Aggregates | 425 µm to 12 mm |
| Shavings | 12 mm to 50 mm |
| Derived aggregate | 12 mm to 305 mm |
| Shreds | 50 mm to 305 mm |
| Large particles | Between 50 mm × 50 mm × 50 mm and 762 mm × 50 mm × 100 mm |
| Authors | Physical Characteristics of Sands | Physical Characteristics of Rubber | Test Conditions | Results of Experimental Tests |
|---|---|---|---|---|
| [1] | DGR = 20–80 mm ρs(Rubber) = 1.22 | 4, 8.8, 15 and 25% by weight σn = 20, 40 and 75 kPa | The shear strength increases with increasing rubber content. | |
| [2] | ρs(Sand) = 2.63 | DGR= 5 cm and 15 cm ρs(Rubber) = 1.21 (5 cm) ρs(Rubber) = 1.27 (15 cm) | 10, 20, 30% by volume σn = 2, 6.2, 25.5 and 41 kPa | The shear strength increases with increasing rubber content. Friction angle increases with increasing rubber content. |
| [3] | ρs(Sand) = 2.63 | DGR = 2, 3 and 4 cm ρs(Rubber) = 1.3 | 15, 30 and 50% by volume σn = 9.8, 39.2 and 98.1 kPa | The shear strength increases with increasing rubber content. Friction angle increases with increasing rubber content. |
| [5] | ρs(Sand) = 2.62 | DGR = 20 mm × 10 mm ρs(Rubber) =1.08 | 10 à 70% by weight σn = 25, 75 and 125 kPa | The shear strength increases with the rubber content up to 30% and then it decreases. The friction angle increases with the rubber content up to 30% and then it decreases |
| [7] | ρs(Sand) = 2.67 | ρs(caoutchouc) = 1.15 | 15, 30, 45, 60% by volume σn = 100, 200, 300 and 400 kPa; | The shear strength increases with increasing rubber content. The friction angle increases with increasing rubber content. |
| [8] | ρs(Sand) = 2.68 | DGR(max) = 2 mm ρs(Rubber) = 1.14 | 10, 30, 50 and 100% by weight σn = 50, 100 and 200 kPa | The shear strength decreases with increasing rubber content. The friction angle decreases with increasing rubber content. |
| [9] | ρs(coarse Sand) = 2.68 ρs(fine Sand) = 2.60 | Rubbercrumbs | 5, 10, 20 and 50% by weight σn = 28, 42, 68 kPa | The shear strength decreases with increasing rubber content. The friction angle decreases with increasing rubber content. |
| [10] | ρs(Sand) = 2.74 | DGR = 1–4 mm ρs(Rubber) = 1.16 | 10, 20, 30, 40, 50% by weight σn= 29, 56 and 110 kPa Dr = 70% | The shear strength increases with the rubber content up to 20% and then it decreases. The friction angle increases with the rubber content up to 20% and then it decreases |
| [11] | ρs(Sand) = 2.67 | DGR= 1–10 mm ρs(Rubber) = 1.20 | 15, 25, 30, 35 and 100% by volume σn = 30, 60 and 90 kPa | The shear strength increases with the rubber content up to 30% and then it decreases. The friction angle increases with the rubber content up to 30% and then it decreases |
| [12] | ρs(Sand) = 2.66 | DGR = 0.8–2 mm ρs(Rubber) = 1.13 | 25, 50 and 75% by weight σn= 20, 50 and 100 kPa | The shear strength increases with the rubber content up to 25% and then it decreases. The friction angle increases with the rubber content up to 25% and then it decreases. |
| [13] | Sable A: Dmax = 4.75 mm Sable B: Dmax = 2 mm ρs(Sand A) = 2.65 ρs(Sand B) = 2.64 | Group 1: DGR = 1–2 mm Group 2: DGR = 2–4.75 mm Group 3: DGR = 4.75–5.6 mm Group 4: DGR = 5.6–8 mm Group 5: DGR = 8–9.5 mm Group 6: DGR = 9.5–12.5 mm Group 7: DGR = 12.5–20 mm ρs(Group 1) = 1.11 ρs(Group 2) = 1.13 ρs(Group 3) = 1.14 ρs(Group 4) = 1.14 ρs(Group 5) = 1.16 ρs(Group 6) = 1.17 ρs(Group 7) = 1.16 | 10, 15, 20, 25, 30 and 35% by volume σn = 16, 32 and 80 kPa. | The shear strength increases with the rubber content up to 20% and then it decreases for groups 1, 2, 3 and 4. The shear strength increases with the rubber content up to 30% and then it decreases for groups 5, 6 and 7. |
| [14] | ρs(Sand) = 2.665 | DGR = 1–5 mm ρs(Rubber) = 1.085 | 5, 10, 15, 20 and 30% by weight σn= 100 kPa. | Dr = 55%: The friction angle increases with the rubber content up to 15% and then it decreases. Dr = 95%: The friction angle increases with the rubber content up to 10% and then it decreases. |
| [15] | ρs(Sand) = 2.9 | DGR = 1–6 mm ρs(Rubber) = 1.15 | 10, 20 and 30% by weight σn = 9.81, 19.62, 40.81 and 58.86 kPa | The shear strength increases with the rubber content up to 20% and then it decreases for stresses ranging from 19.62; 40.81 and 58.86 kPa. For a low stress of 9.81 kPa, the optimum is 10%. The friction angle increases with the rubber content of 20% |
| [16] | Dmax = 5 mm ρs(Sand) = 2.68 | DGR = 1–5 mm ρs(Rubber) = 1.21 | 5, 10 and 15% by weight σn = 100, 200, 300 and 400 kPa Dr = 50% | The shear strength increases with the rubber content. The friction angle increases with the rubber content |
| [17] | Dmax = 9.5 mm ρs(Sand) = 2.74 | DGR = 0.075–2.5 mm ρs(Rubber) = 1.153 / 1.198 | 2.5, 5, 7.5 and 10% by weight 0.556, 1.1111 and 1.667 kg/cm2 | The friction angle increases with the rubber content up to 5% and then it decreases |
| [18] | Dmax = 1.25 mm ρs(Sand) = 2.65 | DGR = 0.075–0.3 mm DGR = 0.3–1.25 mm DGR = 1.2–5 mm ρs(Rubber) = 1.04 | 5, 10, 15, 20, 25, 30, 40 and 50% by volume σn = 50, 100 and 150 kPa Dr = 30% | The shear strength increases with the rubber content up to 20% and then it decreases. The friction angle increases with the rubber content up to 20% and then it decreases for DGR/Dsand < 1. The friction angle for DGR/Dsand < 1 is less then when the ratio DGR/Dsand > 1 |
| Materials under Study | Hostun Sand | Dune Sand | Granulated Rubber 2 mm < DGR < 5 mm |
|---|---|---|---|
| D10 (mm) | 0.22 | 0.125 | 2.55 |
| D30 (mm) | 0.28 | 0.22 | 2.95 |
| D50 (mm) | 0.32 | 0.24 | 3.35 |
| D60 (mm) | 0.34 | 0.25 | 3.55 |
| Cu (/) | 1.55 | 2.00 | 1.39 |
| Cc (/) | 1.05 | 1.55 | 0.96 |
| ρs (g/cm3) | 2.625 | 2.982 | 1.129 |
| ρdmax (g/cm3) | 1.498 | 1.97 | 0.59 |
| ρdmin (g/cm3) | 1.309 | 1.76 | 0.53 |
| emax (/) | 1.006 | 0.697 | 1.112 |
| emin(/) | 0.752 | 0.514 | 0.908 |
| Chemical Composition (%) | SiO2 | TiO2 | Al2O3 | Fe2O3 | MnO | MgO | CaO | Na2O | K2O | P2O5 |
|---|---|---|---|---|---|---|---|---|---|---|
| Hostun sand | 73.73 | 0.01 | 0.80 | 0 | 0.01 | 0 | 0.11 | 0.19 | 0.13 | 0.01 |
| Dune sand | 21.71 | 8.54 | 4.09 | 30.97 | 0.25 | 3.45 | 29.33 | 0.63 | 0.56 | 0.50 |
| Designations | Sand-Rubber |
|---|---|
| RC0 | 100% Sand + 0% Rubber |
| RC10 | 90% Sand + 10% Rubber |
| RC20 | 80% Sand + 20% Rubber |
| RC30 | 70% Sand + 30% Rubber |
Publisher’s Note: MDPI stays neutral with regard to jurisdictional claims in published maps and institutional affiliations. |
© 2021 by the authors. Licensee MDPI, Basel, Switzerland. This article is an open access article distributed under the terms and conditions of the Creative Commons Attribution (CC BY) license (https://creativecommons.org/licenses/by/4.0/).
Share and Cite
Benjelloun, M.; Bouferra, R.; Ibouh, H.; Jamin, F.; Benessalah, I.; Arab, A. Mechanical Behavior of Sand Mixed with Rubber Aggregates. Appl. Sci. 2021, 11, 11395. https://doi.org/10.3390/app112311395
Benjelloun M, Bouferra R, Ibouh H, Jamin F, Benessalah I, Arab A. Mechanical Behavior of Sand Mixed with Rubber Aggregates. Applied Sciences. 2021; 11(23):11395. https://doi.org/10.3390/app112311395
Chicago/Turabian StyleBenjelloun, Mohamed, Rachid Bouferra, Hassan Ibouh, Frederic Jamin, Ismail Benessalah, and Ahmed Arab. 2021. "Mechanical Behavior of Sand Mixed with Rubber Aggregates" Applied Sciences 11, no. 23: 11395. https://doi.org/10.3390/app112311395
APA StyleBenjelloun, M., Bouferra, R., Ibouh, H., Jamin, F., Benessalah, I., & Arab, A. (2021). Mechanical Behavior of Sand Mixed with Rubber Aggregates. Applied Sciences, 11(23), 11395. https://doi.org/10.3390/app112311395