Article

Seismic Risk Assessment of Chania, Greece, Using an Integrated Computational Approach

by
Ioannis Koutsoupakis
1,
Yiannis Tsompanakis
1,
Pantelis Soupios
2,*,
Panagiotis Kirmizakis
2,
SanLinn Kaka
2 and
Costas Providakis
3
1
School of Chemical and Environmental Engineering, Technical University of Crete, 73100 Chania, Greece
2
Department of Geosciences, College of Petroleum Engineering and Geosciences, King Fahd University of Petroleum and Minerals, Dhahran 31261, Saudi Arabia
3
School of Architecture, Technical University of Crete, 73100 Chania, Greece
*
Author to whom correspondence should be addressed.
Appl. Sci. 2021, 11(23), 11249; https://doi.org/10.3390/app112311249
Submission received: 30 October 2021 / Revised: 22 November 2021 / Accepted: 23 November 2021 / Published: 26 November 2021

Abstract

:
This study develops a comprehensive seismic risk model for the city of Chania, in Greece, which is located ina highly seismic-prone region due to the occurrenceof moderate to large earthquakes because of the nearby major subduction zone between African and Eurasian tectonic plates. The main aim is to reduce the seismic risk for the study area by incorporating the spatial distribution of the near-surface shear wave velocity model and the soil classification, along with all possible seismic sources, taking into account historical events. The study incorporates and correlates various ground motion scenarios and geological fault zones as well as information on existing buildings to develop a seismic risk model using QuakeIST software, and then the seismic hazard and a realistic prediction of resulting future adverse effects are assessed. The developed model can assist the municipal authorities of Chania to be prepared for potential seismic events, as well as city planners and decisionmakers, who can use the model as an effective decision-making tool to identify the seismic vulnerability of the city buildings and infrastructure. Thus, this study enables the implementation of an appropriate and viable earthquake-related hazards strategy to mitigate damage and losses in future earthquakes.

1. Introduction

Geographical Information Systems(GIS) consist of a powerfuland general-purpose computational tool with many applications in complex and multidisciplinary topics.In recent years, there has beensignificant progressin GIS-based seismic hazard and risk models [1,2,3]. Some models deal with the implementation of emergency support systems [4,5,6,7], and others involve the development of seismic information systems or databases to reduce potential risks [8,9,10,11,12]. Within urban centers, seismic vulnerability analysis focuses primarily on the structural, geotechnical, and spatial information of buildings that can be directly related to potential human and financial losses during an earthquake.
Quite recently, Estêvão [13] presented an overview of available seismic risk assessment (SRA) computational tools developed worldwide. Widely used GIS-based computational platforms, including HAZUS [14,15] and RADIUS [16,17], perform seismic risk assessment through expert judgment and/or local observations and measurements. Such approaches cannot be easily implemented in areas where necessary background information is incomplete. This is true particularly for historic buildings and archaeological sites in the wider Mediterranean region, where there are no detailed inventories and studies regarding structural integrity. Moreover, few detailed geological and engineering studies have been carried out in this specific region, thus making it difficult to implement such tools.
Several researchers have used GIS-based software to study earthquake-related hazards in various urban centers worldwide. Lantada et al. [18] presented a GIS-based application using a mean vulnerability index associated with city building typologies to study earthquake damage and predict disaster scenarios in Barcelona. Petermans et al. [19] estimated the local seismic risk in Brussels urban centerusing geological data and field measurements, together with mathematical modeling in 2D and 3D GIS computational environment. Guéguen et al. [20] developed the VULNERALP methodology, based on a simplified approach, i.e., the seismic inventory of buildings, to assess the vulnerability of a moderate seismic hazard region in Grenoble, France. Anagnostopoulos et al. [21] developed Seismocare, a GIS-based application to evaluate potential seismic damage in Chania, Greece. As part of the RISK-UE project, Pitilakis et al. [22] addressed the seismic hazard in the city of Thessaloniki, taking into account scenarios of identifying potential seismic hazards in conjunction with the vulnerability of structures atrisk.
All the studies mentioned abovehave mainly been based on the spatial distribution and engineering characteristics of buildings and the geological and geomorphological soil conditions. In certain studies, vulnerability curves and seismic spatial delineation were generated based on the analysis of post-seismic data. Meroni et al. [23] developed a methodology to assess the seismic hazard in the Mt. Etna volcanic region (eastern Sicily, Italy) and the level of seismic risk ofthe buildings. They implemented an integrated simulator, QuakeIST [24], which uses the disruption index concept to perform risk calculations regarding potential damage due to earthquakes [25].
To realistically assess the seismic risk at an urban scale, it is crucial to address interdependencies, i.e., the so-called cascade or domino effects. Adverse cascading effects contribute to the loss of function at an urban scale due to damage andthe disruption of services and lifeline networks following a natural disaster. As described by Ferriera et al. [25], this index allows the representation of a complex and multi-dimensional problem, such as earthquakes, concisely and efficiently. By considering correlations and interactions of structural, social, and economic components, it provides decisionmakers a tool to identify and potentially reduce the global earthquake impacts in a wider region for the elements (structures and infrastructure) at risk. In addition, Meroni et al. [23] provided an overview and implementation of the disruption index, illustrating how it can be used to quantify the state of disorder due to the disruption of the urban structure and its functions after a severe earthquake, considering problem dimensions and affected population needs. The first step of the process is the definition of the seismic input based on historical seismicity information and seismogenic uncertainty. The second step is the calculation of the seismic impact on the buildings and infrastructure of the region under investigation. Finally, urban vulnerability information and a GIS computational platform are used to organize data for structures and lifelines.
For this purpose, the aforementioned computational tool that considers such issues (i.e., QuakeIST) is applied in the city of Chania, which is the second-largest city on the island of Crete, Greece. Chania is selected due to its historical significance and status as an increasingly prosperous tourist destination. More importantly, the island is located on the edge of active plate boundaries, where numerous damaging earthquakes have occurred since ancient times. Consequently, this investigation aims to integrate seismic sources, seismotectonic deformation, ground motion attenuation, and local site conditions to accurately assess earthquake hazard, which is combined with structures and their vulnerability to derive a realistic seismic risk assessment at an urban scale.
Herein, the focus is on buildings taking into account all the main parameters involved (including the function/ownership of buildings, i.e., public (schools, etc.) and private), since the city center does not have any major infrastructure (bridges, airport, harbor), while the structural “wealth” (in terms of history, culture, architecture, and tourism) of the city is mainly the buildings in the old Venetian harbor. The seismic vulnerability of the water pipeline network of Chaniawas examined in a previous GIS-based study [26].
A few relevant studies have presented attempts to perform Chania’s seismic risk assessment [21,27]. However, this work deals with this critical and complex problem using a more holistic framework, exploiting the advanced capabilities of QuakeIST software (Instituto Superior Téchnico, University of Lisbon, Portugal). The main aim is to parameterize the seismic hazard problem realistically, determine the spatial variability of earthquake amplification due to geological and other local factors, and accurately predict possible impacts (damage and losses). This study attempts to formulate a practice-oriented methodology that authorities could easily use as an effective decision-making tool in order to implement appropriate techno-economic planning and seismic protection measures to minimize potential damage and losses (primarily human, but financial as well) in future earthquakes.

2. Study Area

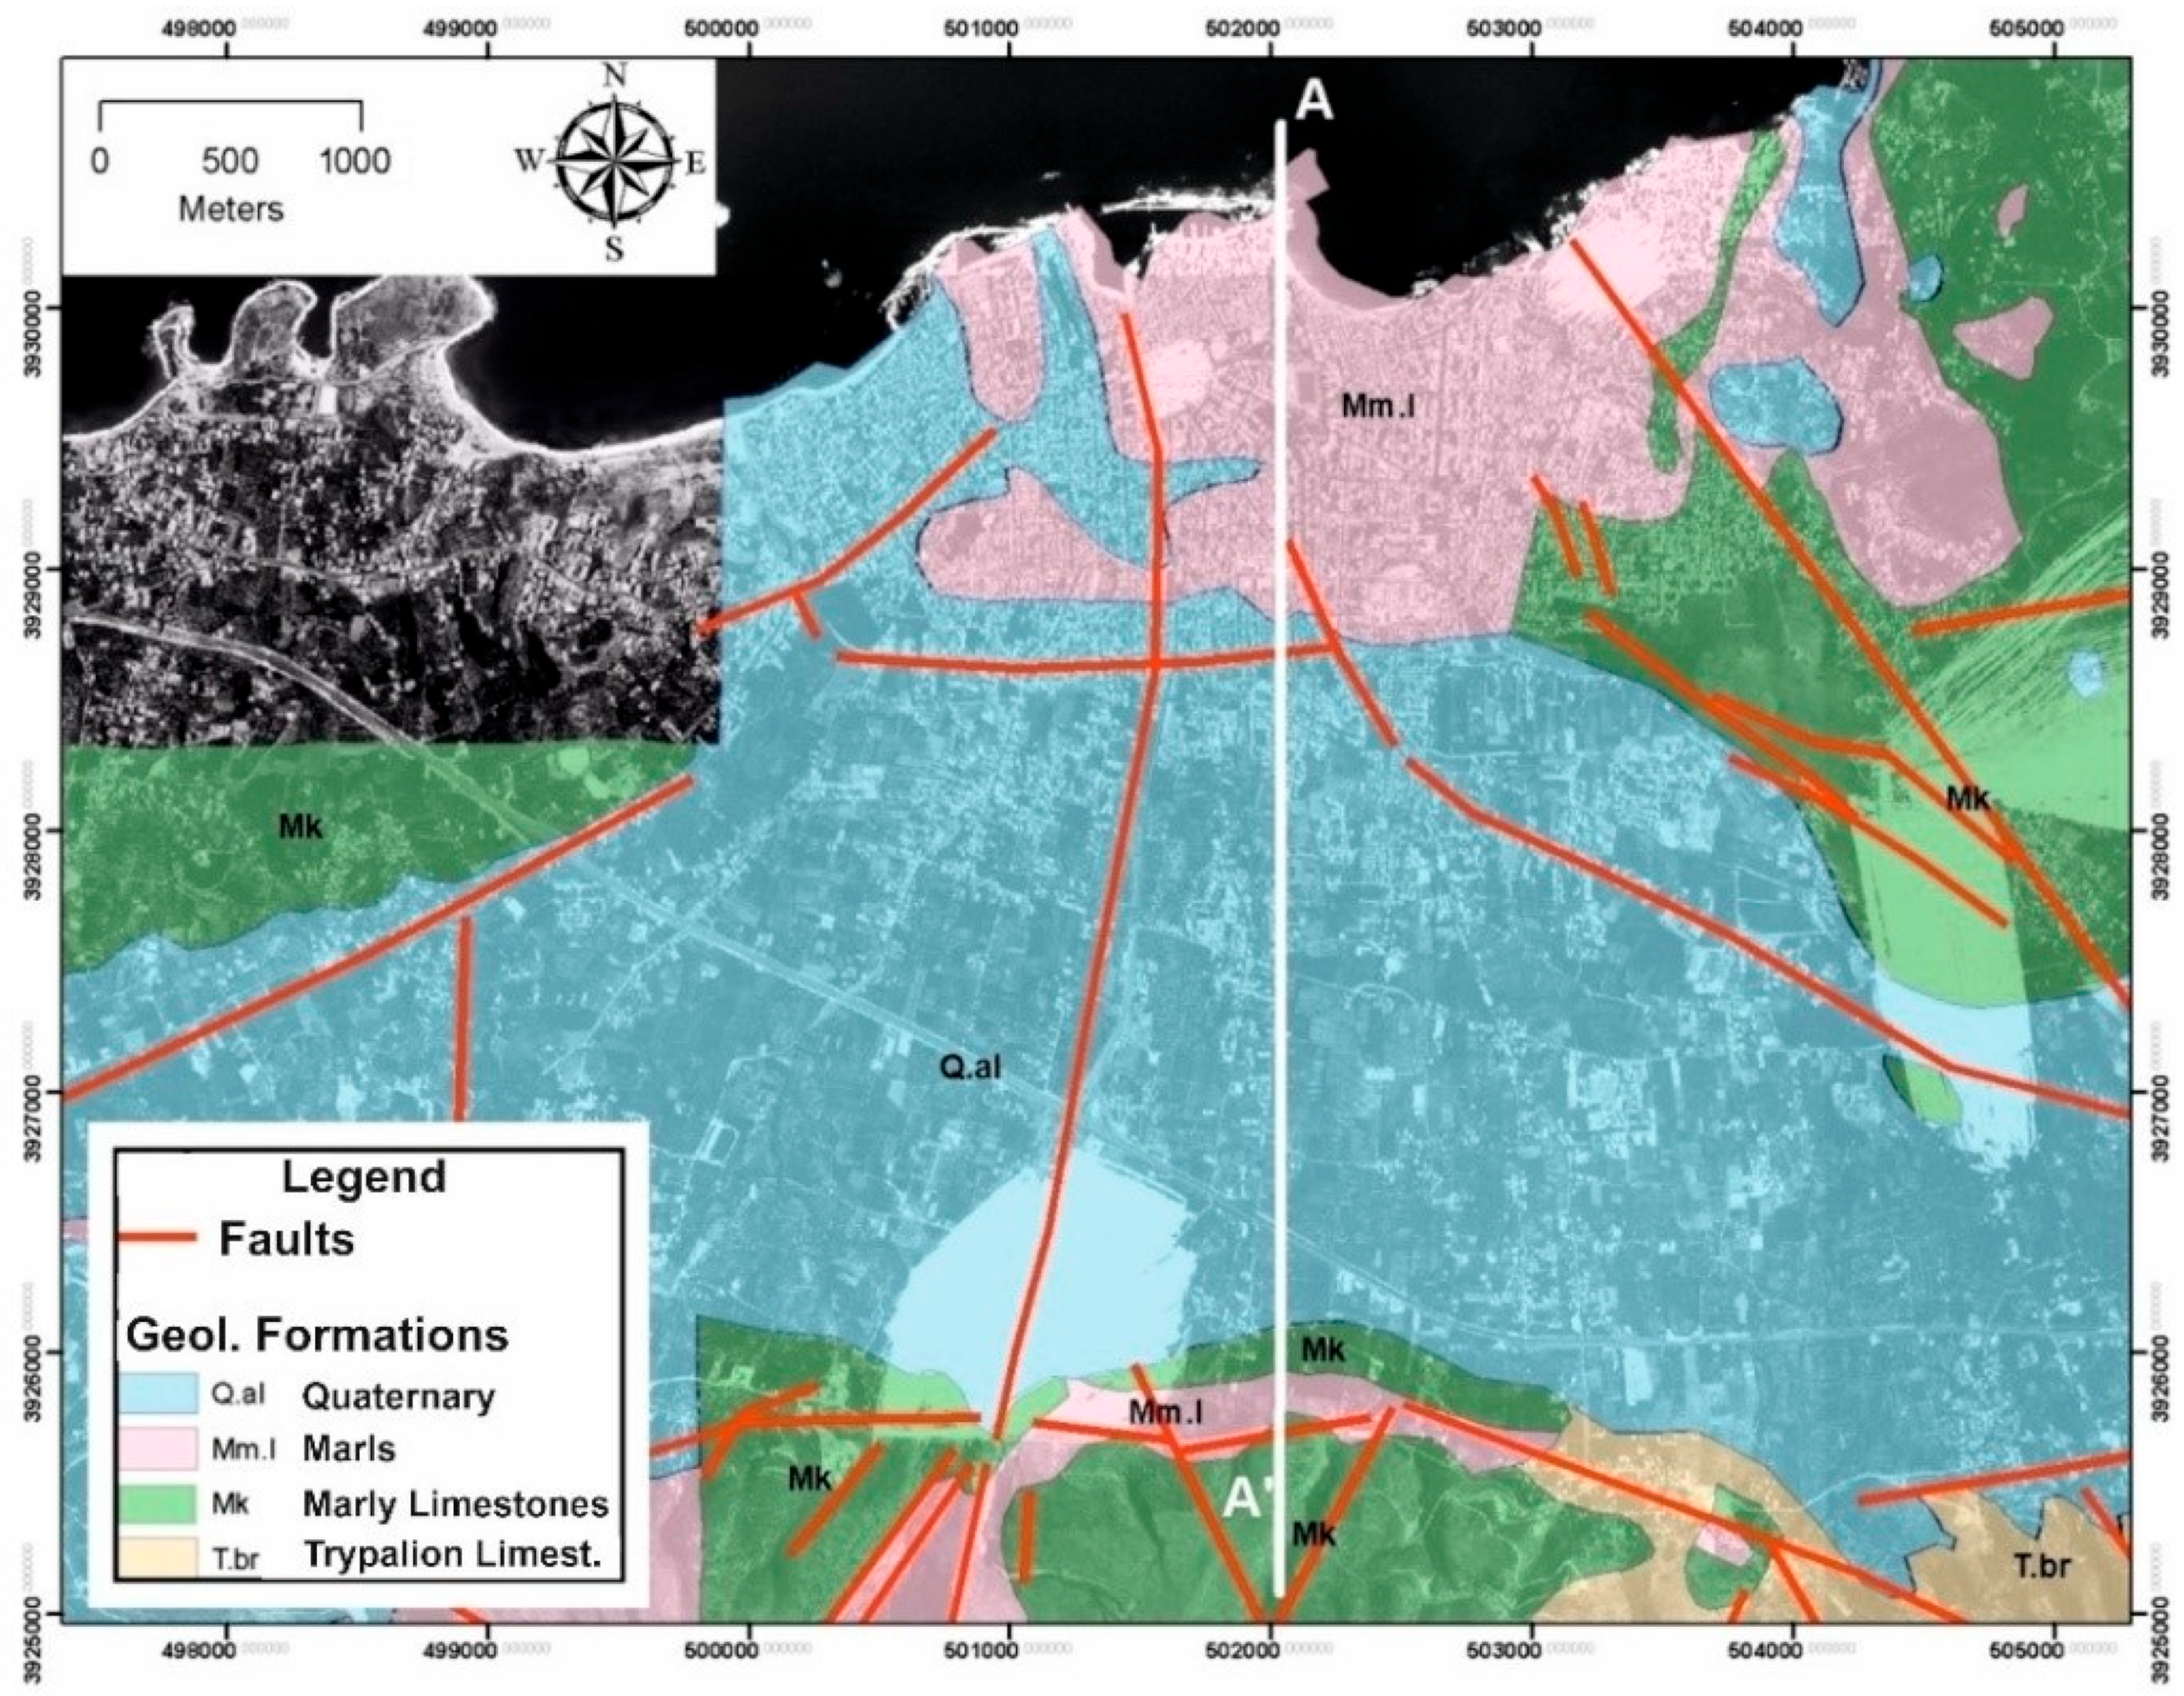
2.1. Geology/Tectonics of the Study Area

The study covered an area of 28 km2 in the main part of Chania city. The city is in the west of Crete, being the second-largest town on the island, with an increasing population, >100,000, in the whole municipality and a population of approximately 60,000 in the urban center. In addition, during the summer season, the population is more than doubled due to tourism. The city has famous and well-preserved historical sites located around the old port as well as many important neoclassical buildings in the old town. Crete is one of the most important European natural geological museums, since its geology, its terrain, and its morphotectonics reflect the changes and developments in the Greek terrestrial during the Alpine orogenesis [28]. Moreover, the geological structure of Crete is complex as Crete is located at the edge of the subduction zone between the African and Eurasian plates, i.e., at the convergence zone of lithospheric plates, Eastern Mediterranean, and Aegean microplates, with a net convergence rate of about 4 cm/year [29,30,31,32,33].
Due to the extensive stress field of the broader area of southern Greece along the subduction zone, the geology of Crete is characterized by intense tectonic actions, where successive tectonic coverages, of different geological origins and evolutions, are located on top of each other, creating thus a complex tectonic structure. The cover tectonic is associated with successive compressive tectonic events, which resulted from successive periods of crustal extension due to the convergence of the lithospheric plates of Africa and Eurasia during continental collisions. Specifically, the geology around Chania city is complex, as shown in Figure 1. The surrounding area of the old city of Chania is partially covered by Quaternary deposits, while further to the south, there are limestones [34,35]. In addition, most of the eastern and southern parts of modern Chania city are covered by limestones with different geomechanical properties (Trypalion and Marlylimestones). The western and central parts of the basin are covered by Quaternary alluvial deposits (Q), while Marls cover the central part of the city. Most of the faults (denoted by red lines in Figure 1) are aligned in the following directions: E–W, N–S, and NW–SE.

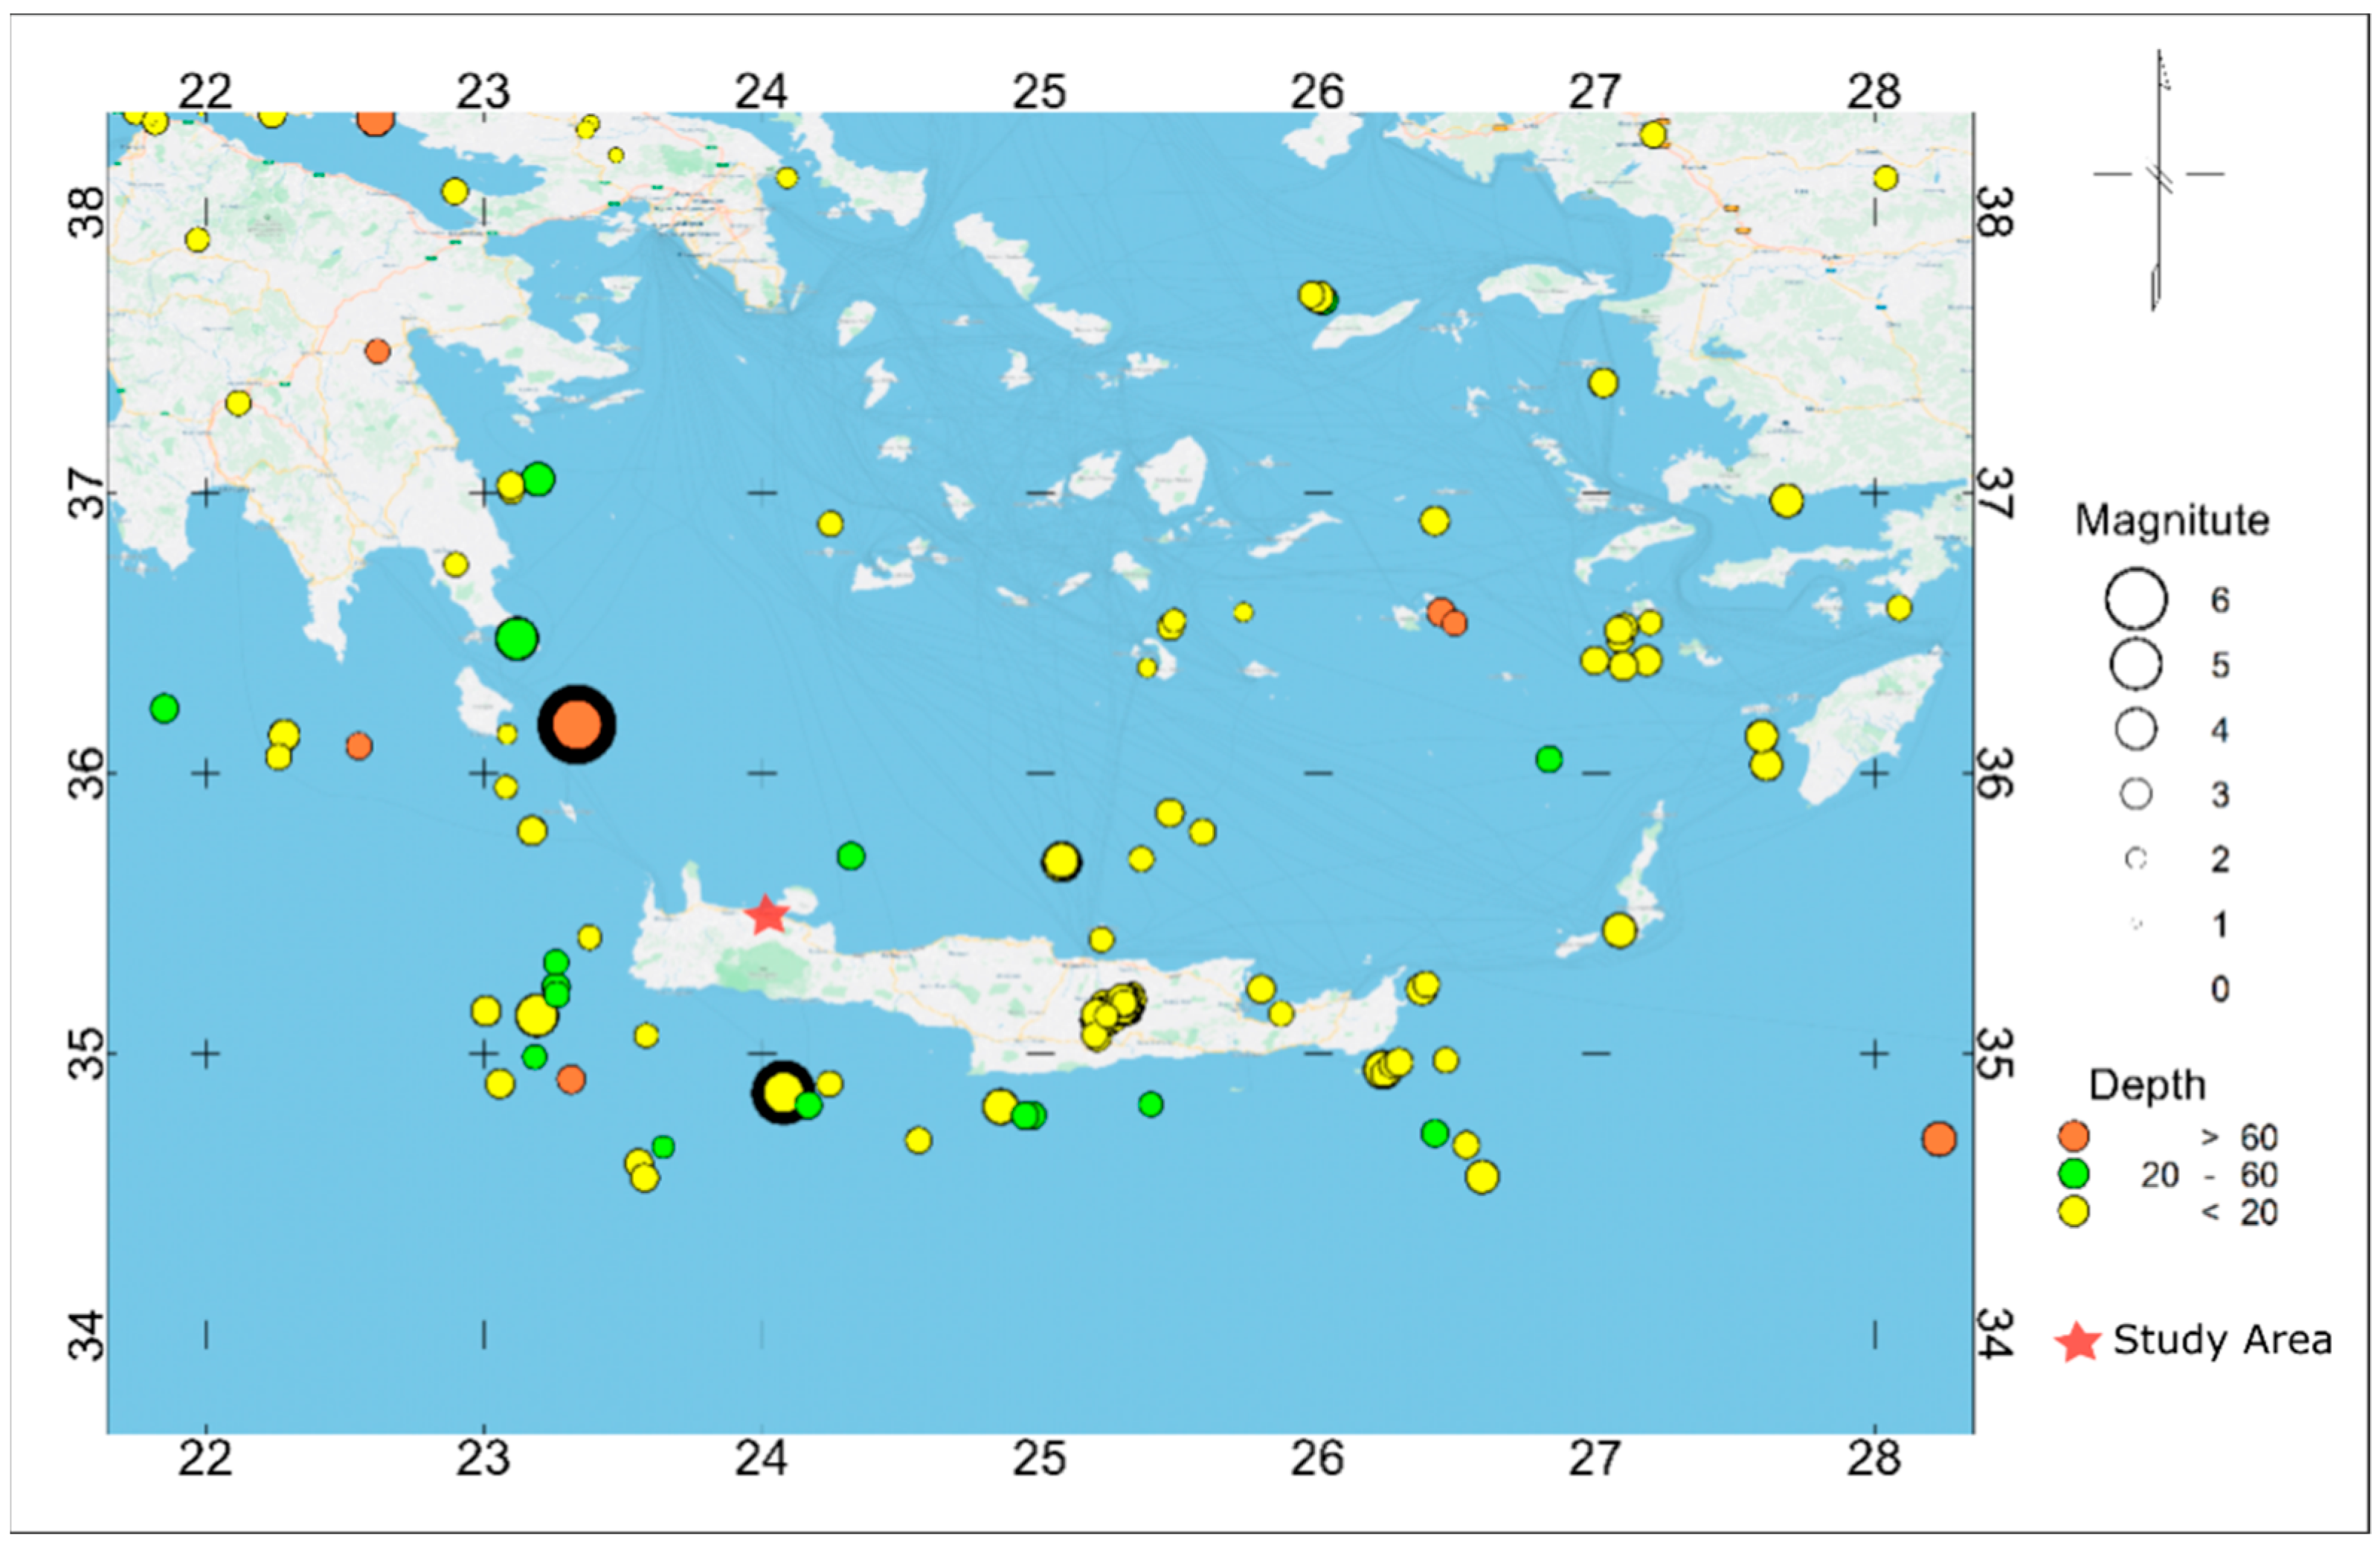
2.2. Regional Seismicity

The seismicity in the area results from the fore-arc of the Hellenic subduction zone and has caused numerous earthquakes. There is also a distinct source of seismicity from the interface of the subduction zone, which is located southwest of Crete over the prefecture of Chania [36]. As displayed in Figure 2, the seismicity of Crete is continuous and intense, e.g., two strong events having low focal depths (~10 km) occurred at the end of September 2021: one in the mainland at the center of the island with a high magnitude Mw = 6.0 and extreme PGA values (>0.6 g and >0.8 g in the horizontal and vertical directions, respectively, close to the epicenter), resulting in structural damage on a large scale and the loss of one human life, and another one with a moment magnitude of 6.3 in the sea close to the southeastern part of the island.
The city of Chania has experienced many earthquakes, one of the most recent ones on 12 September 2012, with a moment magnitude Mw = 5.3, which occurred close to Gavdos island (i.e., the southern border of Europe). The earthquake epicenter was estimated at 34.9 N and 24.11 E, and the focal depth was estimated to be <10 km [37]. This earthquake affected buildings in the Chania urban center, while the assessment report showed significant spatial distribution. Field observations provided useful data for the validation of the seismic vulnerability maps of the city that have been developed in this study. Moreover, the available data of another, more severe, earthquake, again quite close to Chania, were used in the seismic scenarios that will be presented later. This strong seismic event occurred near the island of Kythira, northwest of Crete, on 8 January 2006, having a magnitude of MW = 6.9, with the epicenter at 36.16 N and 23.39 E, while the focal depth was approximately 50 km [38], and caused a lot of damage in the prefecture of Chania.

2.3. Available Geophysical Data

Geophysical data that are used to characterize the dynamic soil response are usually presented in terms of shear-wave velocity (Vs) distribution, mainly nearthe surface, i.e., in the upper 30 m (Vs30). Koutsoupakis et al. [35] used passive-source vibrations/waveforms generated by ambient noise, such as traffic, wind, and engines, to estimate the Vs spatial distribution in Chania. For this purpose, 24 microtremor linear array measurements (MAM), equally spaced every 500 m in the X- and Y- directions, were acquired and analyzed to construct a 3D Vs model of the study area (Figure 3a). Twenty-four low-frequency (4.5 Hz) geophones (with a 2 m/s sampling time, a 10 min record length, linear geometry, and 3 m geophone spacing) were deployed along each measuring line, and data were carefully collected during the night. The total survey length of deployment was about 69 m. Moreover, all the geophones were installed in similar ground conditions, and all the measurements were taken on roads and pavements. The shear-wave velocities with depth were calculated, and the spatial distribution of Vs at the depths of 5 and 36 m below the ground was extracted (Figure 3b,c). The results are in good agreement with those derived via an active-source vibrations/waveforms generation methodology, the so-called spectral analysis of surface waves (SASW) [21].

3. Development of a Hazard Model

3.1. Quakeist Initial Data

The GIS software QGIS in conjunction with QuakeISTwasused to analyze the hazard parametersand create the risk maps. More specifically, QuakeIST was used to configure and ultimately calculate the seismic hazard as well as the possibility of structural partial or total damage (i.e., collapse). QGIS was used for both data collection, display, and creation of the final tables used in QuakeIST. QuakeIST uses various models for calculating direct damage/macroseismic models [39], the capacity spectrum [40], N2 [41], and fragility functions, while users can select vulnerability parameters from the software library or add new ones.
QuakeIST with various seismic scenarios (ground motion values) has been applied in severalcities in Italy, Portugal, Spain, and Iceland [42]. Layers with different types of information can be created for the population as well as structures and infrastructure (buildings, bridges, water, electricity, gas networks, etc.), while different damage maps can be exported for each layer. Data sets used in this study were compiled from various agencies and consist of topographic maps from the Geographic Service of the Hellenic Army, a topographic map being a generalized geological map with the geological formations and tectonic faults of the study area [34]; statistical data related to the buildings from the latest national statistical survey [43]; geophysical data [35]; lifelines; emergency population concentration areas;as well as major infrastructure, e.g., public buildings, archeological sites, monuments and historical buildings, museums, galleries, hospitals, stadiums, bus stations, schools, higher educational and research facilities, harbors, and bridges, in Chania as defined by Sarris et al. [27].
The buildings in the city of Chania are categorized as follows:
  • Construction year: The structures of the city are classified into four categories based on their construction period and their expected response to seismic loads [27]. The first class includes the buildings (one- or two- and rarely three- or four-floor historical, neoclassical, and some residential buildings constructed before and after World War II made of stone masonry, reinforced concrete, etc.) until 1961. The second class includes the simple reinforcedconcrete buildings (i.e., moment-resisting frames) constructed between 1961 and 1985 (following the first national earthquake design code established in 1959). The buildings constructed between 1985 and 1992 can be included in the third class as they were constructed with stiffer reinforced concrete frames including shear walls following an improved seismic norm established in 1984. The last class includes the more recent structures, built after 1995, when the New National Earthquake Design Code (NEAK) of Greece was established (and revised twice, in 2000 and 2003, incorporating Eurocode 8 (EC8) in the sequence). This categorization of the buildings is crucial for the assessment of the seismic vulnerability of the city. However, there are uncertainties in this categorization, as often structures are subjected to various structural interventions without following any seismic norm guidelines.
  • Construction materials (steel, concrete, reinforced concrete, masonry, wood, etc.): To simplify the modeling, two main materials, reinforced concrete (RC) and masonry (M), are considered. Based on the use of the different percentages of RC/M, three categories were formed for each block of buildings in Chania.
  • Number of floors: Two classes, one with fewer than and one with more than three stories, are considered, while for each building block, the average number of stories is used.
  • Roof cover: Two categories are considered: flat, made of reinforced concrete, and inclined tiled roofs.
  • Density of adjacent buildings and other minor parameters.
Geology and geotechnical/geomechanical characterization also play an important role in seismic risk assessment, and for that reason, relevant information regarding the distribution of Vs30 [35], lateral and in-depth changes of geology [34], and stiffness of the formations [44,45,46], the existence of active/inactive faults in the study, area as well as the morphology (digital elevation model-DEM) were used to construct a complete GIS model.

3.2. Existing and External Seismic Models of QuakeIST

QuakeIST has a built-in library with existing seismic and attenuation models that can be used to simulate the response of a seismic event based on local (geological, structural, etc.) conditions [24]. The simulation can be carried out using attenuation models that are typical for Europe. More specifically, the attenuation can becalculated using expressions proposed by Ambraseys et al. [47], Carvalho et al. [48,49], Sabettaand Pugliese [50], among others.
Additionally, the user can use real data of a regional earthquake and create an “external” seismic scenario. In this case, the user should provide data, e.g., accelerations, recorded during an earthquake at various points to represent spatial variability of the examined region, since it is realistic to assess the hazard and the expected damage using data from past seismic eventsof this specific area. Provided that sufficient field data are available, the simulation results obtained via QuakeIST can be compared with the recorded ones to assess the most suitable seismic and attenuation models. The interpretation of the results can be done both qualitatively (identification of the most dangerous zones) and quantitatively (comparison between the average expected degrees of damage).
For comparable results with those of the external scenario, the data (using coordinate system WGS84) of the nearby MW = 6.9 earthquake at Kythira (36.16 N 23.36 E, with a focal depth of 66 and 93.86 km NW of Chania city) in 2006, and MW = 5.3 earthquake at Gavdos (34.90 N 24.112 E, with a focal depth of 6.5 and 68.62 km S–SE of Chania city) in 2012, at different (from NW and SSE of Chania city) azimuths, was used. To further assess the seismic risk of the city of Chania, a parametric study was performed with extreme seismic hazard scenarios using a known seismic source with different magnitudes. For this purpose, the Kythira earthquake data were used [38], but with higher magnitudes (MW = 7.5, MW = 8.0, and MW = 8.5) as it will be presented in the sequence.

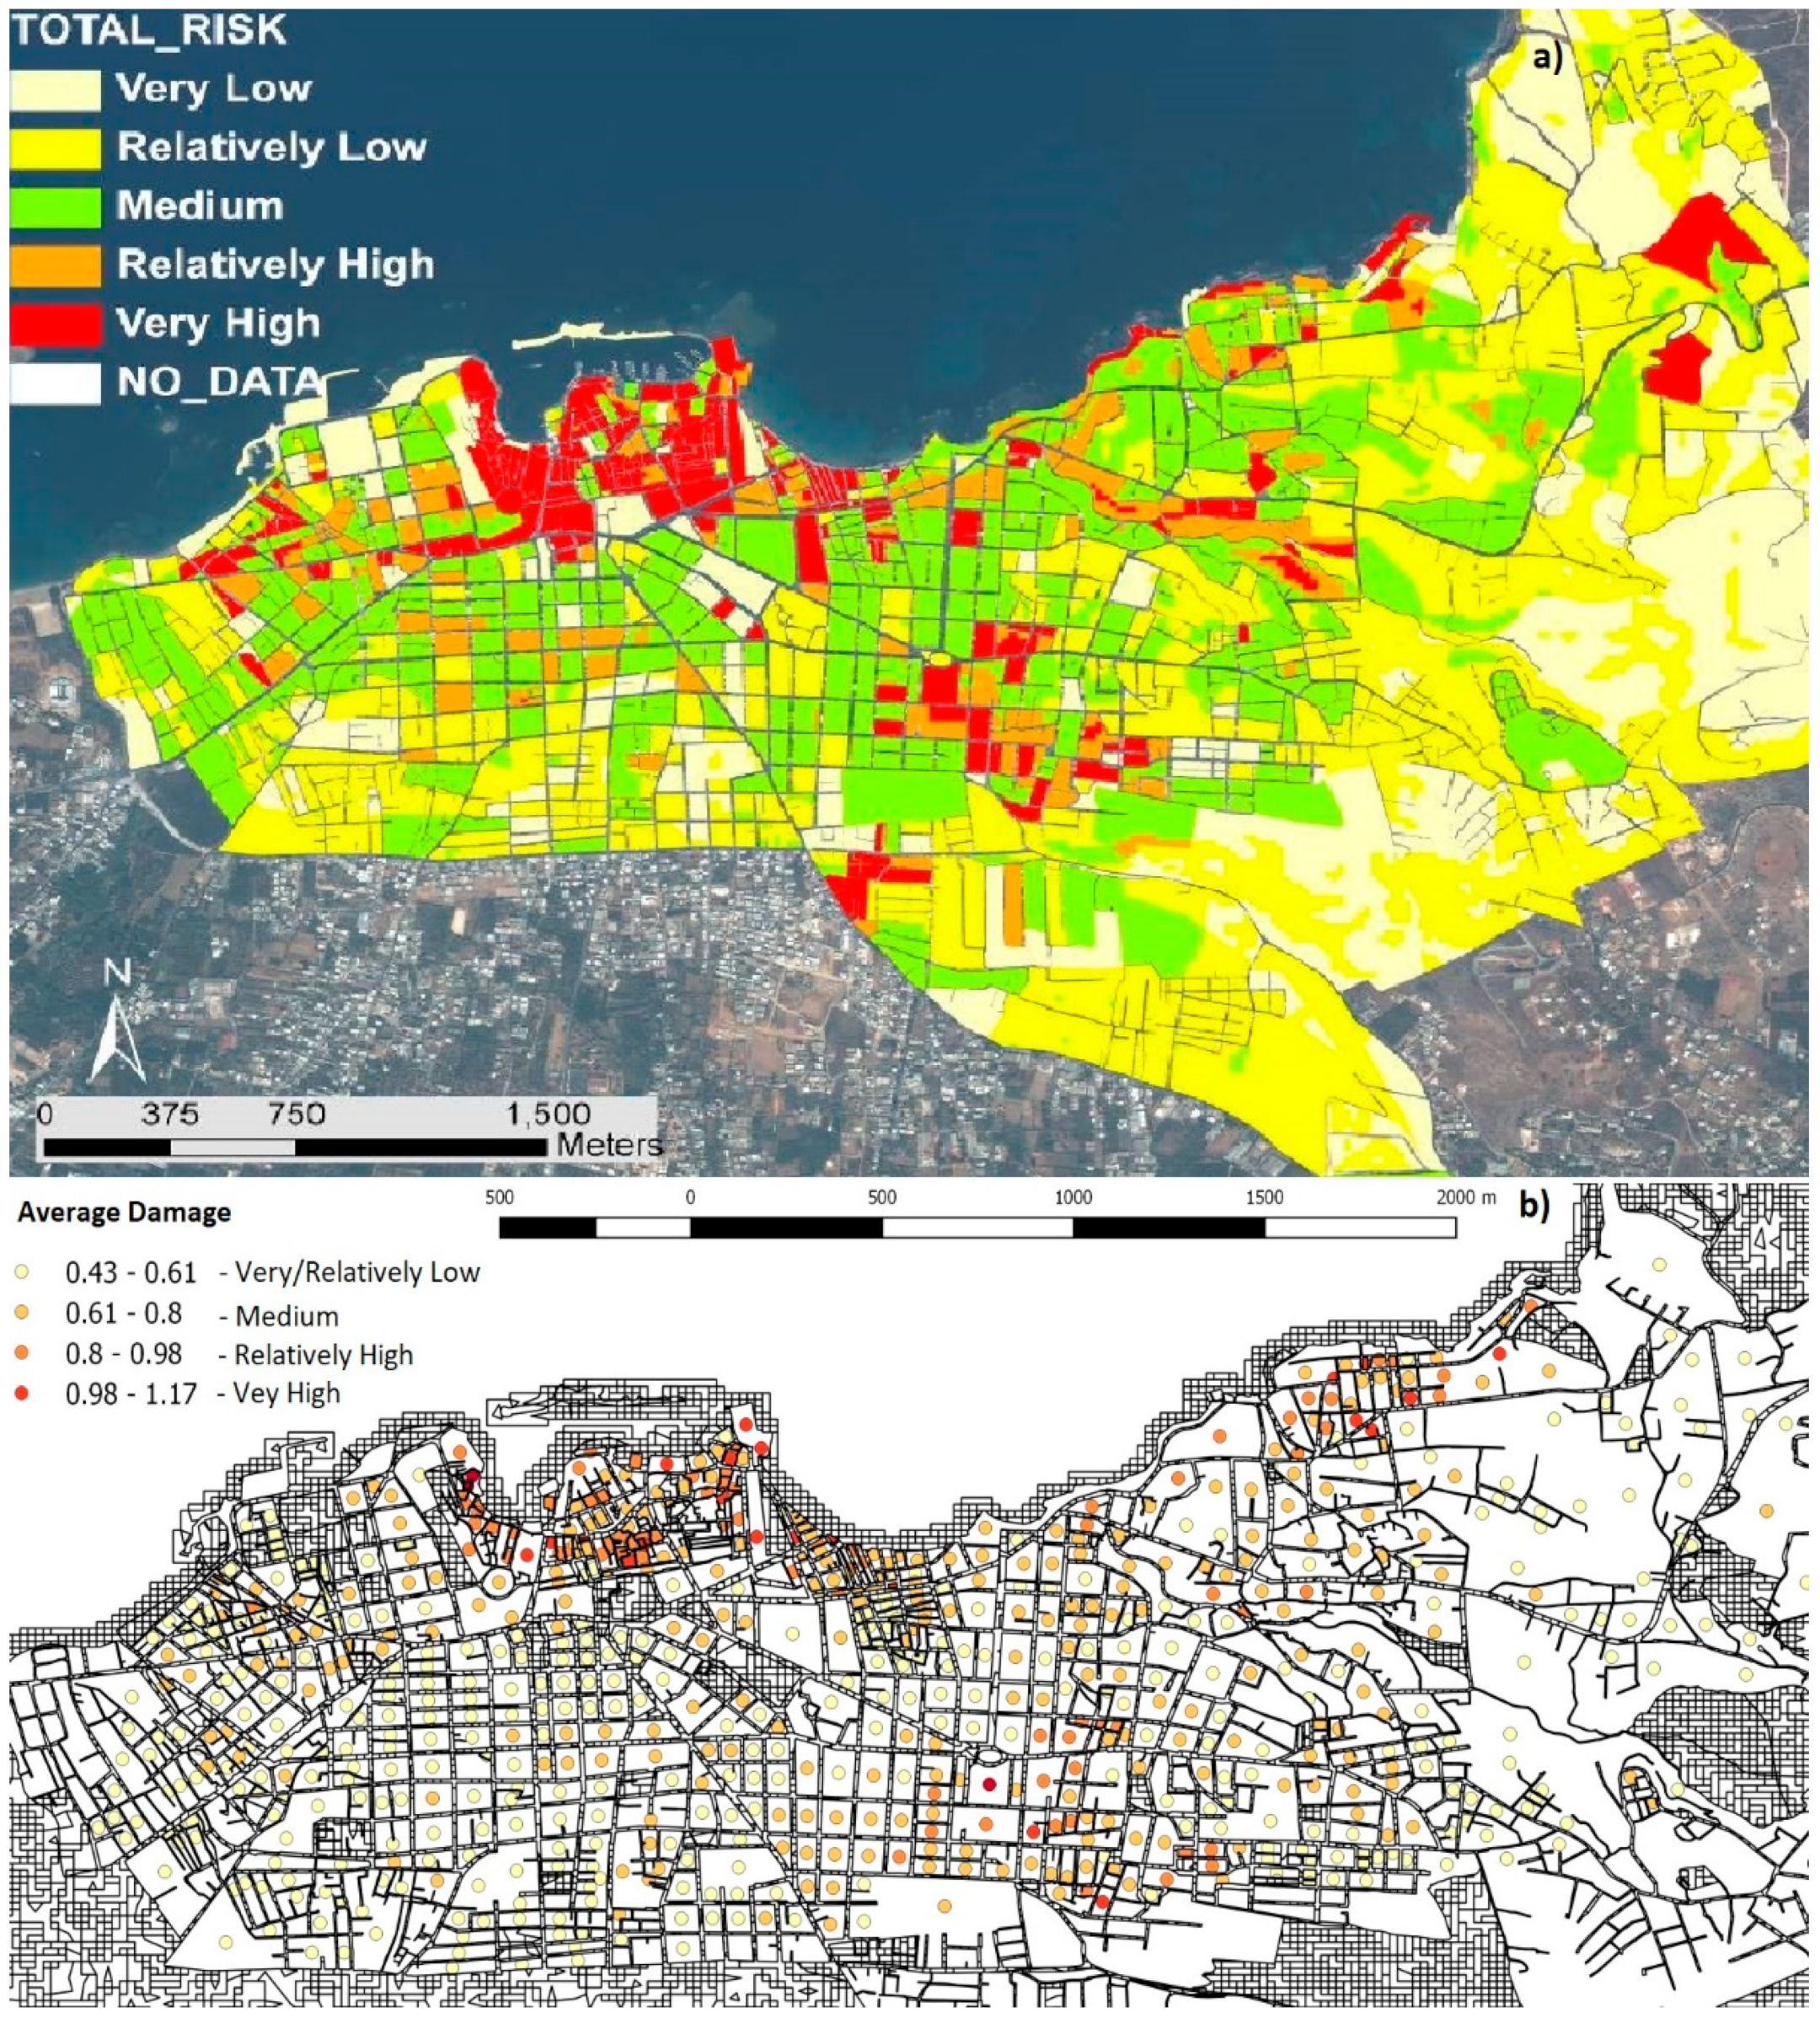
4. Seismic Risk Analysis Results

4.1. Results Based on the Kythira Earthquake Local Seismic Model

In this section, characteristic results of the application of QuakeIST for the seismicrisk assessment of Chania are provided, based on the Kythira earthquake local seismic modelreported by Koutsoupakis [51].The seismological data were taken from the relevant study of Koutsoupakis et al. [52]. The maps with average damage rates presented in the sequence are the outcome of the fragility analysisusing the available models of QuakeIST taking into account the spatial distribution and vulnerability (due to construction type, material, and age) of existing buildings as well as the local site conditions that affect soil dynamic response. In particular, the seismic vulnerability and damage assessment methodologies proposed by Lagomarsino and Giovinazzi [38] in the framework of the RISK-UE project have been adopted for the purposes of the present study. In general, such approaches are suitable for buildings for the countries at the south of Europe, since field surveys from past earthquakes (e.g., as the recent ones in Greece and Italy) have demonstrated that the building typologies, construction materials, practices, norms, etc., as well as the scales of damage are quite similar.
More specifically, the software contains the proper tools to assess all potential impacts in the area of interest when exposed to a certain seismic scenario. Hence, the user can define all parameters involved and derive the structural damage intensity at a localized level, i.e., for each building block. In this manner, average damage rates can be estimated taking into account specific characteristics of all buildings in each building block (age, material, typology, geometry, density, etc.), as shown in the following plots. As earlier mentioned, the vulnerability assessment is based on the study of Lagomarsino and Giovinazzi [38], who provided a well-established probabilistic methodology that leads to reliable estimates of mean average damage rates of buildings, μD (with values 0 < μD < 5) taking into account macroseismic intensity as well as suitable vulnerability and ductility indices.
In other words, the vulnerability in terms of μD is calculated for each building of every block that presents any type of damage. In this manner, the mean damage rate is derived taking into account the status of the whole block. In addition, the user can elaborate more on the results, by extracting the likelihood of the occurrence of damage belonging to the five possible levels according to the classification in Table 1, as it will be presented in the sequence. For instance, most building blocks near the old Venetian harbor are densely built, while most buildings are old, stone-built, and more vulnerable. Consequently, these parts of the city exhibit much higher average damage rates compared to the outskirts of Chania, where the building blocks are less dense and mainly contain newer, earthquake-resistant, reinforced concrete buildings.
As is clearly illustrated in Figure 4, the northwestern part of the city of Chania exhibits the highest seismic risk. This was expected due to the age of the buildings (the majority built before 1960), their construction material (mainly stone-built), and also due to the softer soil layers that exist in this part of the city. In the central part of the urban complex, despite the expected diversity of structural conditions, a rather medium seismic risk can be observed. The differences that are observed are not so pronounced, taking also into account the quite large dimensions of this area. Lastly, the city suburbs at the perimeter of the urban complex present the lowest seismic risk.
QuakeIST has a built-in library with the classification of earthquake-related impact levels (damage, social, economic, etc.) [24]. A brief description of each impact level is provided in Table 1. It should be noted that the classification of impacts is only ordinal, i.e., the impact of level II is more adverse than that of level I, but the differences between the two levels are not quantified in a direct manner. Accordingly, Figure 5 presents the probability of the occurrence of impact levels I, II, and III per building block in Chania. The likelihood of impact level I (Figure 5a) is higher in the most vulnerable northwestern part of the city compared with that of levels II and III (Figure 5b,c). In addition, impact levels IV and Vare not likely to occur. For that reason, they are not included in Figure 5.
After the development of the risk model, the results were compared with a previous similar study by Sarris et al. [27] based on real data from a previous earthquake in the wider area of interest. However, the two studies have major conceptual differences, e.g., Sarris et al. [27] used a local model, and weights of importance were given in specific structural and geomorphological characteristics in the area of Chania. To present a detailed comparison is beyond the scope of this study. However, as shown in Figure 6a,b, observing the results by Sarris et al. [27], it can be easily derived that they are in good agreement with those of the present study, as three main risk zones (high, medium, and low) are identified in both studies. The first zone, of high risk, is located mainly near the coastline; the second zone, of medium risk, occurs at the southern part of the first zone; and most of the southern part of the urban complex is the one that exhibits the lowest risk.

4.2. Comparison of Quakeist Attenuation Models

QuakeIST also has built-in attenuation models suitable for European countries. The results from the application of three of these models have been based on the expressions of (a)Ambraseys et al. [47], (b) CSO 2003 [53], and (c) Sabettaand Pugliese [50], and details can be found in [24]. The results using Ambraseys expression (Figure 7a) seem to relatively underestimate the risk of the city as all values are much lower than those of the external scenario shown in Figure 6b. There are mainly buildings with either quite high or very low risk. It is noted that some areas in the eastern part present a higher risk compared to the western parts, which is not consistent with the field observations. Similarly, the results presented in Figure 7b, obtained using CSO 2003 model, which has been basedon past earthquakes in Portugal, are not realistic, and this model is also not recommended. The risk indicators are particularly high, in contrast to the other QuakeIST models, but also with the external, i.e., local seismic scenario. Nevertheless, the spatial distribution seems to be quite reasonable.
Lastly, the Sabetta and Pugliese [50] model, based on data from earthquakes in Italy, provides results (see Figure 7c) that are close to the results of the external scenario developed herein and in accordance with those obtained by Sarris et al. [27]. The risk levels appear to be slightly lower compared to the ones of the external scenario, while there is agreement on the distribution of risk. The urban complex can be divided into different zones analogously to the external scenario. This attenuation model seems to provide realistic results, and it is therefore recommended to further develop and incorporate the local attenuation model.
Figure 8 displays the results of seismic risk analysis using an average attenuation relationship (i.e., the so-called, generic law), which is a combination of models available in the library of the QuakeIST software. This model is perhaps not so important from a scientific point of view, but these results have practical significance. The aim of the development of a “synthetic” relationship is to examine if the software can deliver reasonable results in any area of interest. It is observed that in the case of the city of Chania, the extracted results of the average model are particularly close to those of the external model and that of Sarris et al. [27]. There is good agreement on both quantitative and qualitative characteristics. Both methods provide the same results, and thus it enhances the generality of the application of QuakeIST software within the study area.
Figure 9 presents the estimates of the average degree of damage that is likely to occur in the city of Chania if the external seismic model is based on the Gavdos earthquake data instead of the Kythira earthquake data. Similar risk distributions are presented as in all previous models that were examined. In the case of the Gavdos earthquake, however, the estimated damage rates were up to 40% less than the ones resulting from the Kythira earthquake, and did not actually affect much of the urban complex. Hence, comparing the two earthquakes and based on the fact that they are among the strongest events in recent years, it can be concluded that the risk is more pronounced due to earthquakes occurring in the north of Chania, as the one in Kythira, 2006, which is further examined in the sequence. Furthermore, it seems that the attenuation of seismic waves is higher for earthquakes occurring inthe south of the Chania Prefecture, similar to the one in Gavdos, 2012 (eventhough Gavdos’s earthquake was closer to Chania than the earthquake of Kythira). This is also verified by seismological (horizontal PGAs) data and available laws (i.e., Ground Motion Prediction Equations (GMPE)), e.g., Skarlatoudis et al. [54] and Boore et al. [55].

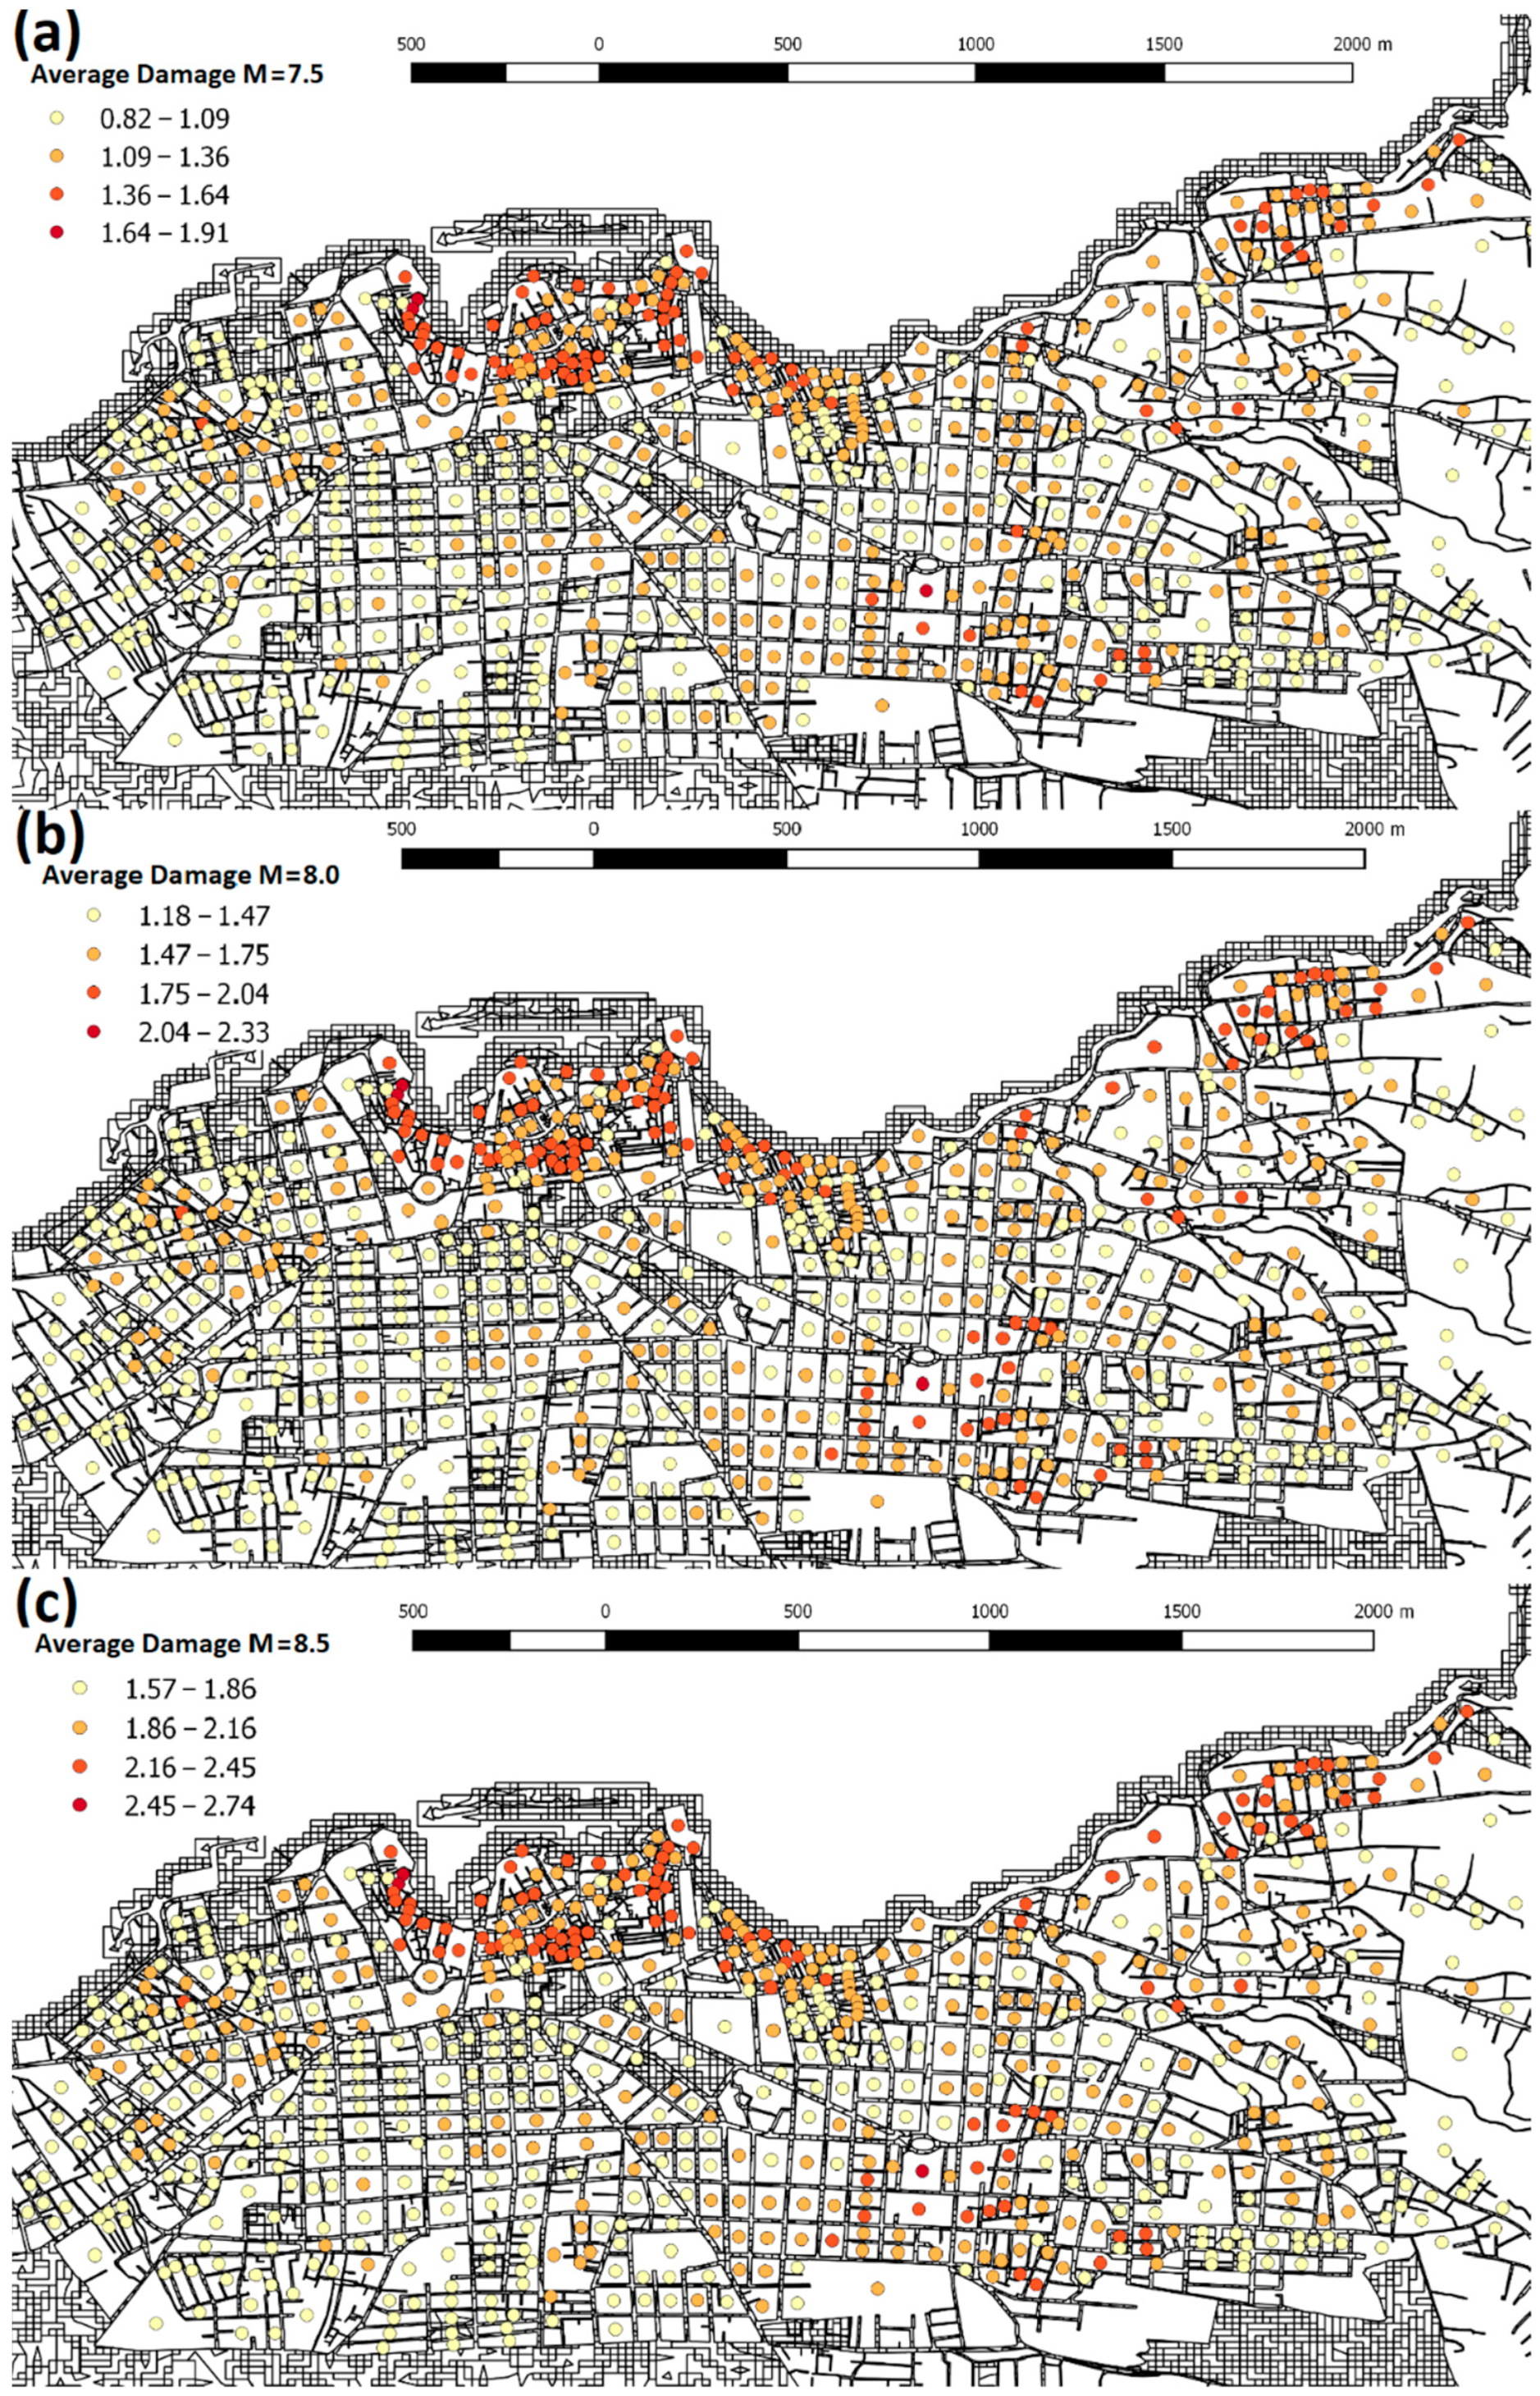
4.3. Seismic Hazard Scenarios Using a Known Seismic Source with Different Magnitudes

As mentioned earlier, the Kythira earthquake external model is used to produce three seismic hazard scenarios with the same seismic source but with different magnitudes, i.e., Mw = 7.5, Mw = 8.0, and Mw = 8.5. It has to be noted that such events are not unrealistic for this region, since a strong subsea earthquake (Mw > 8) magnitude occurred in the west of the island on July 21 in AD 365, causing a huge tsunami. This seismic event is likely to be the strongest in the Mediterranean Sea and affected Greece and all neighboring countries, while many towns of Crete were destroyed. Geological evidence reveals an enormous uplift of western Crete, by up to 9 m. It was considered as a “universal” earthquake, in terms of its both intensity and the extent of devastating consequences [51].
Figure 10 illustrates the average degree of damage that is expected for these extremely high-magnitude events to predict the risk of Chania for more adverse scenarios. Certainly, it is expected that the levels of damage and losses will be higher than the ones estimated previously. More specifically, for an earthquake with a magnitude Mw = 7.5, it is obvious from Figure 10a that the high-risk zones exhibit damage levels on the order of 1.50, while the medium risk zones show damage rates approaching a value of approximately 1.20. Therefore, relatively mild damage levels are expected thatare not likely to affect much the functioning of the city. For the Mw = 8.0 event, the damage rates approach a value of 1.80 in a high-risk zone, while it is 1.50 in the medium-risk zone. As expected, the Mw = 8.5 earthquake has an even more detrimental impact; the high-risk areas would experience damage rates close to 2.50, the average-risk areas would experience damage rates above 2.00, while there may be buildings with damage up to the third impact level (see Table 1). Conclusively, by interpreting the above results qualitatively, it can be concluded that damage rates due to future earthquakes up to Mw = 7.0 are not likely to have devastating consequences in Chania. However, more severe events, with Mw = 8.0 or Mw = 8.5, would result in widespread, severe damage and losses.

5. Conclusions

This study presented an overview of the seismic hazard and risk assessment of the urban complex of the city of Chania. The investigation was performed using the advanced capabilities of QuakeIST software, which operates in a Geographical Information Systems (GIS) environment. The main aim was to realistically define the problem of the seismic hazard and to predict the possible impacts (damage and losses) as well as their probability of occurrence in a future seismic event. Another objective was to formulate a methodology that could potentially be used by the authorities as an effective decision-making tool for the implementation of appropriate techno-economic plans and seismic protection measures to prevent or reduce future losses (primarily human, but also financial).
For this purpose, various earthquake scenarios were examined to successfully assess the seismic risk for the city of Chania. In addition, realistic data representing local site conditions and structural vulnerability of the existing buildings were used in conjunction with seismic data from recent earthquakes relatively close to Chania. The presented methodology provides the seismic risk at various scales, i.e., each building block, section, and neighborhood; thus, it can be used not only for the protection and development of structures and infrastructure but also for emergency plans (e.g., population emergency concentration areas) for the protection of the residents and visitorsin future medium-to-severe earthquakes. The authors aim to further exploit the capabilities of QuakeIST by investigating the crucial domino effects of combined seismic damage to buildings and lifelines in the continuation of this research. Moreover, additional seismological data and GMPE laws for this region will be examined in order to simulate seismic hazard more accurately as much as possible.

Author Contributions

Conceptualization, I.K., Y.T. and P.S.; methodology, I.K., Y.T., C.P. and P.S.; software, I.K.; validation, I.K., Y.T., P.K. and P.S.; formal analysis, I.K.; investigation, I.K., Y.T. and P.S.; resources, I.K. and P.S.; data curation, I.K.; writing—original draft preparation, I.K., P.S. and P.K.; writing—review and editing, P.S., P.K., S.K., Y.T. and C.P.; visualization, P.K.; supervision, P.S.; project administration, Y.T.; funding acquisition, P.S. All authors have read and agreed to the published version of the manuscript.

Funding

This research was funded by King Fahd University of Petroleum and Minerals (KFUPM) and the Deputyship for Research & Innovation, Ministry of Education in Saudi Arabia, grant number DRI 238 (CIPR 2338).

Institutional Review Board Statement

Not applicable.

Informed Consent Statement

Not applicable.

Data Availability Statement

Not applicable.

Acknowledgments

The authors wish to thank Mónica Amaral Ferreira and João C. Bonacho (Technical University of Lisbon) for their support with QuakeIST software. The authors would like to thank Athanasio Argyriou for his assistance and advice with QGIS.

Conflicts of Interest

The authors declare no conflict of interest. The funders had no role in the design of the study; in the collection, analyses, or interpretation of data; in the writing of the manuscript; or in the decision to publish the results.

References

  1. Zhai, Y.; Chen, S.; Ouyang, Q. GIS-Based Seismic Hazard Prediction System for Urban Earthquake Disaster Prevention Planning. Sustainability 2019, 11, 2620. [Google Scholar] [CrossRef] [Green Version]
  2. Madhu Mohan, V.; Suresh, E.S.M. Chapter 6—Probabilistic seismic hazard assessment model for GIS-based seismic risk study of Thiruvananthapuram City. In Disaster Resilience and Sustainability; Adaptation for Sustainable Development; Pal, I., Shaw, R., Djalante, R., Shrestha, S., Eds.; Elsevier: Amsterdam, The Netherlands, 2021; pp. 117–149. ISBN 978-0-323-85195-4. [Google Scholar]
  3. Sauti, N.S.; Daud, M.E.; Kaamin, M.; Sahat, S. GIS spatial modelling for seismic risk assessment based on exposure, resilience, and capacity indicators to seismic hazard: A case study of Pahang, Malaysia. Geomat. Nat. Hazards Risk 2021, 12, 1948–1972. [Google Scholar] [CrossRef]
  4. Voulgaris, N.; Vassilakis, E.; Parcharidis, I.; Soukis, K.; Alexopoulos, J. A GIS based application for seismic risk operational response support. In Proceedings of the EGS-AGU-EUG Joint Assembly, Nice, France, 6–11 April 2003; p. 10195. [Google Scholar]
  5. Ren, A.Z.; Xie, X.Y. The simulation of post-earthquake fire-prone area based on GIS. J. Fire Sci. 2004, 22, 421–439. [Google Scholar] [CrossRef]
  6. Xu, F.; Chen, X.; Ren, A.; Lu, X. Earthquake Disaster Simulation for an Urban Area, with GIS, CAD, FEA, and VR Integration. Tsinghua Sci. Technol. 2008, 13, 311–316. [Google Scholar] [CrossRef]
  7. Youhai, G.; Qimin, F.; Jing, J. A GIS-based earthquake and tsunami emergency command system for seaside cities. J. Ocean Univ. China 2006, 5, 181–186. [Google Scholar] [CrossRef]
  8. Giammarinaro, M.S.; Alletti, M.; Azzara, R.M.; Canzoneri, V.; Maiorana, S.; Rovelli, A.; Tertulliani, A.; Vallone, P. Natural hazard assessment through an oriented GIS. In Proceedings of the EGS-AGU-EUG Joint Assembly, Nice, France, 6–11 April 2003; p. 12961. [Google Scholar]
  9. Martelli, L.; Filippini, M.; Bagli, S.; Severi, R.; Tomasetti, F. Seismic risk reduction: A local effects map for territorial and urban planning. The example of the Rimini Territorial Plan. Boll. Di Geofis. Teor. Ed. Appl. 2007, 48, 151–162. [Google Scholar]
  10. Bartolomei, A.; Corigliano, M.; Lai, C.G. Seismic Risk Assessment of Italian Seaports Using GIS. AIP Conf. Proc. 2008, 1020, 1591–1598. [Google Scholar] [CrossRef]
  11. Hampton, S.D.; Lee, J.S.; Tolbert, N.L.; McLaren, T.M.; Navarro, C.M.; Myers, J.D.; Spencer, B.F.; Elnashai, A.S. MAEviz: Bridging the time-from-discovery gap between seismic research and decision making. In Proceedings of the Fourth International Conference on eScience, Indianapolis, IN, USA, 7–12 December 2008; pp. 414–415. [Google Scholar] [CrossRef]
  12. Inel, M.; Senel, S.M.; Toprak, S.; Manav, Y. Seismic risk assessment of buildings in urban areas: A case study for Denizli, Turkey. Nat. Hazards 2008, 46, 265–285. [Google Scholar] [CrossRef]
  13. Estêvão, J.M.C. An integrated computational approach for seismic risk assessment of individual buildings. Appl. Sci. 2019, 9, 5088. [Google Scholar] [CrossRef] [Green Version]
  14. Nastev, M.; Todorov, N. Hazus: A standardized methodology for flood risk assessment in Canada. Can. Water Resour. J. 2013, 38, 223–231. [Google Scholar] [CrossRef]
  15. Schneider, P.J.; Schauer, B.A. HAZUS—Its Development and Its Future. Nat. Hazards Rev. 2006, 7, 40–44. [Google Scholar] [CrossRef]
  16. Okazaki, K. Radius Initiative for IDNDR a Practical Approach to Reduce Urban Seismic Risk BT—Earthquake Hazard and Seismic Risk Reduction. In Earthquake Hazard and Seismic Risk Reduction; Balassanian, S., Cisternas, A., Melkumyan, M., Eds.; Springer: Dordrecht, The Netherlands, 2000; pp. 41–48. ISBN 978-94-015-9544-5. [Google Scholar]
  17. Mazumder, R.K.; Salman, A.M. Seismic damage assessment using RADIUS and GIS: A case study of Sylhet City, Bangladesh. Int. J. Disaster Risk Reduct. 2019, 34, 243–254. [Google Scholar] [CrossRef]
  18. Lantada, N.; Pujades, L.G.; Barbat, A. Vulnerability and seismic damage scenarios for Barcelona (Spain) by using GIS. In Proceedings of the EGS-AGU-EUG Joint Assembly, Nice, France, 6–11 April 2003. [Google Scholar]
  19. Petermans, T.; Devleeschouwer, X.; Pouriel, F. Mapping the local seismic hazard in the urban area of Brussels, Belgium. In Proceedings of the 10th IAEG congress, Nottingham, UK, 6–10 September 2006; pp. 1–11. [Google Scholar]
  20. Guéguen, P.; Michel, C.; Lecorre, L. A simplified approach for vulnerability assessment in moderate-to-low seismic hazard regions: Application to Grenoble (France). Bull. Earthq. Eng. 2007, 5, 467–490. [Google Scholar] [CrossRef]
  21. Anagnostopoulos, S.; Providakis, C.; Salvaneschi, P.; Athanasopoulos, G.; Bonacina, G. SEISMOCARE: An efficient GIS tool for scenario-type investigations of seismic risk of existing cities. Soil Dyn. Earthq. Eng. 2008, 28, 73–84. [Google Scholar] [CrossRef]
  22. Pitilakis, K.; Alexoudi, M.; Argyroudis, S.; Anastasiadis, A. Seismic risk scenarios for an efficient seismic risk management: The case of Thessaloniki (Greece). In Advances in Earthquake Engineering for Urban Risk Reduction; Kluwer Academic Publishers: Dordrecht, The Netherlands, 2006; pp. 229–244. [Google Scholar]
  23. Meroni, F.; Zonno, G.; Azzaro, R.; D’Amico, S.; Tuvè, T.; Oliveira, C.S.; Ferreira, M.A.; Mota de Sá, F.; Brambilla, C.; Rotondi, R.; et al. The role of the urban system dysfunction in the assessment of seismic risk in the Mt. Etna area (Italy). Bull. Earthq. Eng. 2016, 14, 1979–2008. [Google Scholar] [CrossRef]
  24. Mota de Sá, F.; Ferreira, M.A.; Oliveira, C.S. QuakeIST® earthquake scenario simulator using interdependencies. Bull. Earthq. Eng. 2016, 14, 2047–2067. [Google Scholar] [CrossRef]
  25. Ferreira, M.A.; Mota de Sá, F.; Oliveira, C.S. The Disruption Index (DI) as a tool to measure disaster mitigation strategies. Bull. Earthq. Eng. 2016, 14, 1957–1977. [Google Scholar] [CrossRef]
  26. Karabatsos, I. Contribution to the earthquake protection of the city of Chania with the use of GIS, Application in the water pipelines network. BSc thesis, Technical University of Crete, Chania, Greece, 2003. [Google Scholar]
  27. Sarris, A.; Loupasakis, C.; Soupios, P.; Trigkas, V.; Vallianatos, F. Earthquake vulnerability and seismic risk assessment of urban areas in high seismic regions: Application to Chania City, Crete Island, Greece. Nat. Hazards 2010, 54, 395–412. [Google Scholar] [CrossRef]
  28. Mountrakis, D.; Kilias, A.; Pavlaki, A.; Fassoulas, C.; Thomaidou, E.; Papazachos, C.; Papaioannou, C.; Roumelioti, Z.; Benetatos, C.; Vamvakaris, D. Neotectonic study of the Western Crete and implications for seismic hazard assessment. J. Virtual Explor. 2012, 42, 10-3809. [Google Scholar] [CrossRef]
  29. Cocard, M.; Kahle, H.-G.; Peter, Y.; Geiger, A.; Veis, G.; Felekis, S.; Paradissis, D.; Billiris, H. New constraints on the rapid crustal motion of the Aegean region: Recent results inferred from GPS measurements (1993–1998) across the West Hellenic Arc, Greece. Earth Planet. Sci. Lett. 1999, 172, 39–47. [Google Scholar] [CrossRef]
  30. Papazachos, B.; Papaioannou, C.; Papazachos, C.; Savvaidis, A. Rupture zones in the Aegean region. Tectonophysics 1999, 308, 205–221. [Google Scholar] [CrossRef]
  31. Papazachos, C. An Alternative Method for a Reliable Estimation of Seismicity with an Application in Greece and the Surrounding Area. Bull. Seismol. Soc. Am. 1999, 89, 111–119. [Google Scholar] [CrossRef]
  32. Le Pichon, X.; Chamot-Rooke, N.; Lallemant, S.; Noomen, R.; Veis, G. Geodetic determination of the kinematics of central Greece with respect to Europe: Implications for eastern Mediterranean tectonics. J. Geophys. Res. 1995, 100, 12675–12690. [Google Scholar] [CrossRef]
  33. Taymaz, T.; Jackson, J.; Westaway, R. Earthquake mechanisms in the Hellenic Trench near Crete. Geophys. J. Int. 1990, 102, 695–731. [Google Scholar] [CrossRef]
  34. Papadopoulos, H. Experimental and Theoretical Study of Local Territorial Amplification with the Use of Low Noise Data and Geophysical Field Measurements. Ph.D. thesis, Aristotle University of Thessaloniki, Thessaloniki, Greece, 2013. [Google Scholar]
  35. Koutsoupakis, I.; Raptakis, D.; Soupios, P.; Vafidis, A. Preliminary Vs spatial distribution of Chania city, Greece based on MAM measurements. In Proceedings of the 20th International Geophysical Congress & Exhibition of Turkey, Antalya, Turkey, 25–27 November 2013; pp. 357–360. [Google Scholar]
  36. Engdah, E.R.; Van der Hilst, R.; Buland, R. Global teleseismic earthquake relocation with improved travel times and procedures for depth determination. Bull. Seismol. Soc. Am. 1998, 88, 722–743. [Google Scholar]
  37. The Gavdos (Greece) Earthquake of 12 September 2012: Preliminary Report on Strong Motion Data, Geotechnical and Structural Damage; Institute of Engineering Seismology and Earhquake Engineering (ITSAK): Thessaloniki, Greece, 2012.
  38. The Kythira (Greece) Earthquake of 8 January 2006: Preliminary Report on Strong Motion Data, Geotechnical and Structural Damage; Institute of Engineering Seismology and Earhquake Engineering (ITSAK): Thessaloniki, Greece, 2006.
  39. Lagomarsino, S.; Giovinazzi, S. Macroseismic and mechanical models for the vulnerability and damage assessment of current buildings. Bull. Earthq. Eng. 2006, 4, 415–443. [Google Scholar] [CrossRef]
  40. Freeman, S.A. Review of the Development of the Capacity Spectrum Method. ISET J. Earthq. Technol. 2004, 41, 113. [Google Scholar]
  41. Fajfar, P. Capacity spectrum method based on inelastic demand spectra. Earthq. Eng. Struct. Dyn. 1999, 28, 979–993. [Google Scholar] [CrossRef]
  42. UPStrat-MAFA. Urban Disaster Prevention Strategies Using Macroseismic Fields and Fault Sources (UPStrat-MAFA-EU Project Num. 230301/2011/613486/SUB/A5), DG ECHO Unit A5. 2012. Available online: http://hdl.handle.net/2122/8126 (accessed on 11 November 2021).
  43. NSS Buildings Inventory. Natl. Stat. Serv. Available online: https//www.statistics.gr/el/census-buildings-2011 (accessed on 11 December 2019).
  44. Loupasakis, C.; Tsangaratos, P.; Rozos, D.; Rondoyianni, T.; Vafidis, A.; Kritikakis, G.; Steiakakis, M.; Agioutantis, Z.; Savvaidis, A.; Soupios, P.; et al. Cross validation of geotechnical and geophysical site characterization methods: Near surface data from selected accelerometric stations in Crete (Greece). In Proceedings of the Third International Conference on Remote Sensing and Geoinformation of the Environment (RSCy2015), Chloraka, Cyprus, 16–19 March 2015; Volume 9535. [Google Scholar] [CrossRef]
  45. Savvaidis, A.; Margaris, B.; Theodoulidis, N.; Lekidis, V.; Karakostas, C.; Mangriotis, M.-D.; Kalogeras, I.; Koutrakis, S.; Vafidis, A.; Steiakakis, M.; et al. Geo-characterization according to recent advances of Eurocode (EC8). In Proceedings of the First International Conference on Remote Sensing and Geoinformation of the Environment (RSCy2013), Peyia, Cyprus, 8–10 April 2013; Hadjimitsis, D.G., Themistocleous, K., Michaelides, S., Papadavid, G., Eds.; SPIE: Bellingham, WA, USA, 2013; Volume 8795, p. 879513. [Google Scholar]
  46. Tsangaratos, P.; Loupasakis, C.; Rozos, D.; Rondoyianni, T.; Vafidis, A.; Savvaidis, A.; Soupios, P.; Papadopoulos, N.; Sarris, A. The importance of geological data and derived information in seismic response assessment for urban sites. An example from the Island of Crete, Greece. In Proceedings of the EGU General Assembly Conference Abstracts, Vienna, Austria, 12–17 April 2015; p. 13047. [Google Scholar]
  47. Ambraseys, N.N.; Simpson, K.A.; Bommer, J.J. Prediction of horizontal response spectra in Europe. Earthq. Eng. Struct. Dyn. 1996, 25, 371–400. [Google Scholar] [CrossRef]
  48. Carvalho, A.; Zonno, G.; Franceschina, G.; Bilé Serra, J.; Campos Costa, A. Earthquake shaking scenarios for the metropolitan area of Lisbon. Soil Dyn. Earthq. Eng. 2008, 28, 347–364. [Google Scholar] [CrossRef]
  49. Carvalho, A.; Campos Costa, A.; Oliveira, C.S. A Finite-Fault Modeling of the 1775 Lisbon Earthquake Sources; 250th Anniv. 1775 Lisbon Earthq; Springer: Dordrecht, The Netherlands, 2009. [Google Scholar]
  50. Sabetta, F.; Pugliese, A. Estimation of response spectra and simulation of nonstationary earthquake ground motions. Bull. Seismol. Soc. Am. 1996, 86, 337–352. [Google Scholar]
  51. Koutsoupakis, I. Seismic hazard assessment of the city of Chania. Master’s Thesis, Technical University of Crete, Chania, Greece, 2017. [Google Scholar]
  52. Konstantinou, K.I.; Kalogeras, I.S.; Melis, N.S.; Kourouzidis, M.C.; Stavrakakis, G.N. The 8 January 2006 Earthquake (Mw 6.7) Offshore Kythora Island, Southern Greece: Seismological, Strong-motion, and Macroseismic Observations of an Intermediate-depth Event. Seismol. Res. Lett. 2006, 77, 544–553. [Google Scholar] [CrossRef]
  53. Oliveira, C.S.; Ferreira, M.A.; Oliveira, M.; Mota de Sá, F. Planning in Seismic Risk Areas—The Case of Faro—Algarve. A First approach. In Proceedings of the XI Congresso Nazionale ‘Congr. Naz. “L’ingegneria Sismica in Italia, Genova, Italy, 25–29 January 2004; p. 12. [Google Scholar]
  54. Skarlatoudis, A.A.; Papazachos, C.B.; Margaris, B.N.; Ventouzi, C.; Kalogeras, I. Ground-motion prediction equations of intermediate-depth earthquakes in the Hellenic arc, southern Aegean subduction area. Bull. Seismol. Soc. Am. 2013, 103, 1952–1968. [Google Scholar] [CrossRef] [Green Version]
  55. Boore, D.M.; Stewart, J.P.; Skarlatoudis, A.A.; Seyhan, E.; Margaris, B.; Theodoulidis, N.; Scordilis, E.; Kalogeras, I.; Klimis, N.; Melis, N.S. A ground-motion prediction model for shallow crustal earthquakes in greece. Bull. Seismol. Soc. Am. 2021, 111, 857–874. [Google Scholar] [CrossRef]
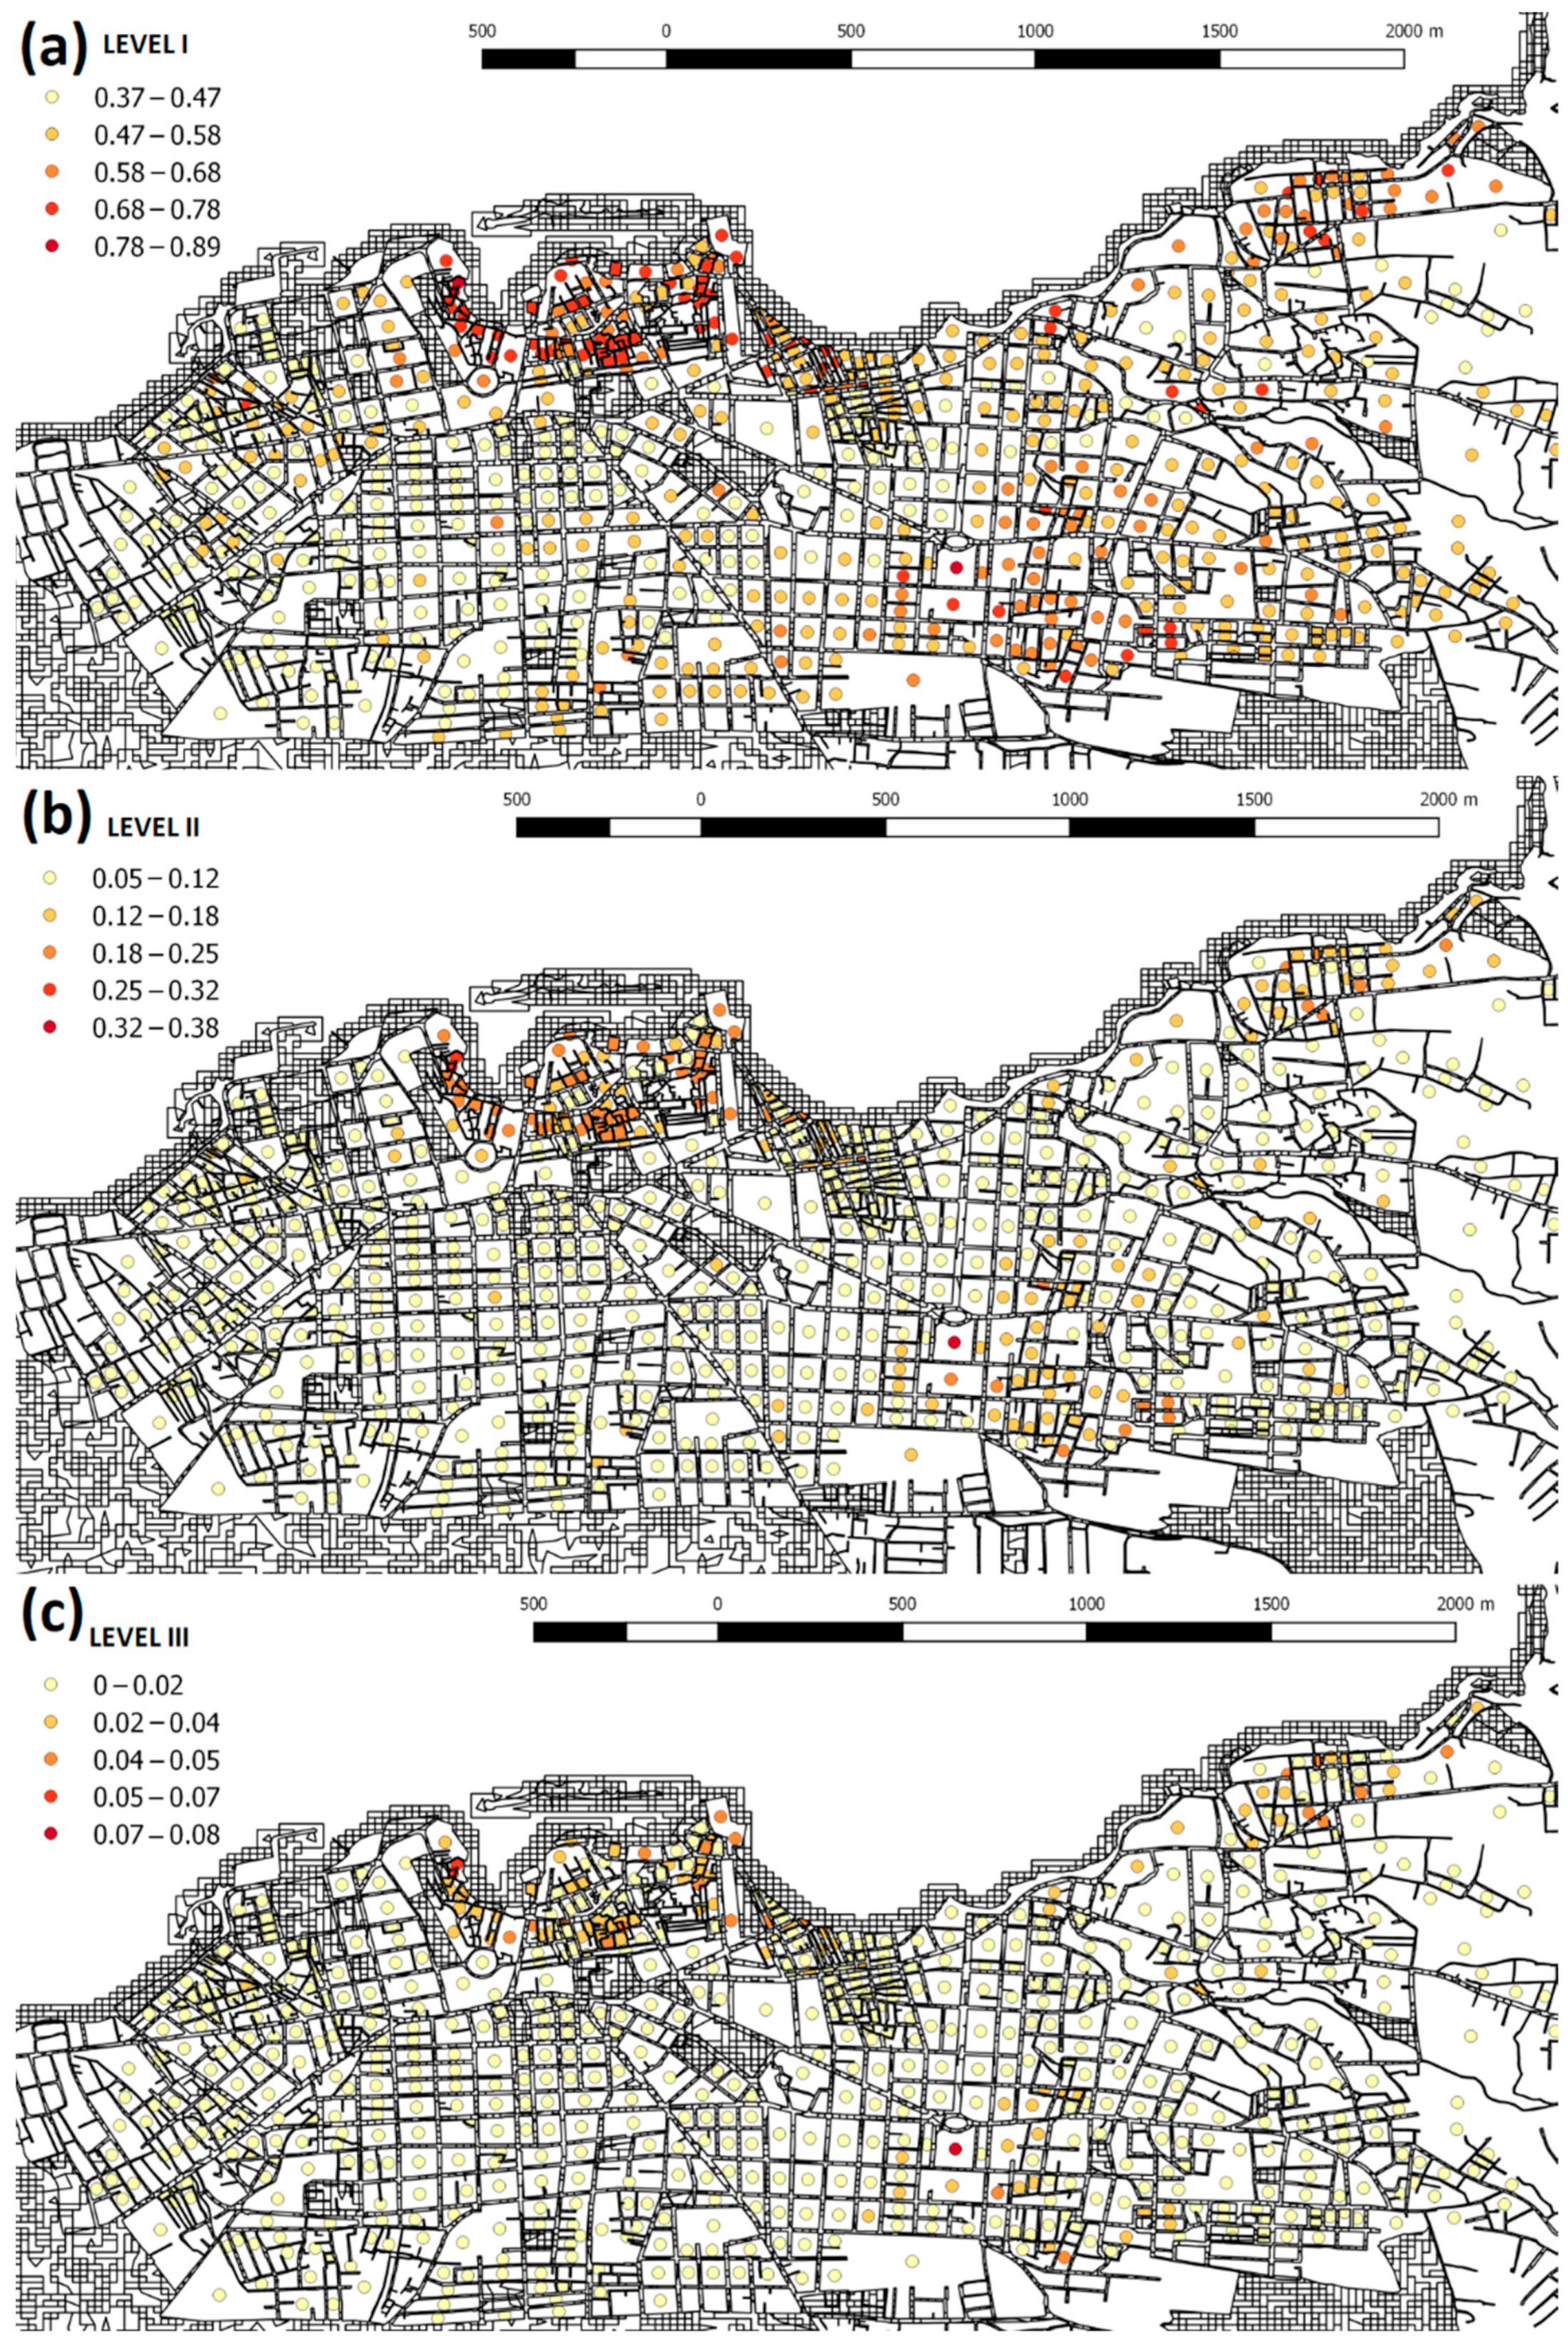
Figure 1. Geology and main faults close to Chania (adopted from [33]).
Applsci 11 11249 g001
Figure 2. Spatial distribution of the shallow seismicity for Mw > 1 in the broader area of the island of Crete for the period of 1 November 2021–18 November 2021 (18 days), as derived from the A.U.Th. Seismological Network (http://geophysics.geo.auth.gr/ss/, accessed on 19 November 2021). The locations of the Kythira (NW of Chania) and Gavdos (SSE of Chania) earthquakes are also shown (orange and yellow circles, respectively, with thick black borders).
Applsci 11 11249 g002
Figure 3. (a) Wider Chania region with MAM measurement locations (black dots) and shear-wave velocities (m/s) model for (b) 5 m and (c) 36 m depths (adopted from [35]).
Applsci 11 11249 g003
Figure 4. Estimated average degree of damage per building block.
Applsci 11 11249 g004
Figure 5. Likelihood of earthquake-related impact per building block in the city of Chania for (a) level I, (b) level II, and (c) level III.
Applsci 11 11249 g005
Figure 6. Comparison of Chania risk maps produced by (a) Sarris et al. [26] and (b) the QuakeIST model of the current study.
Applsci 11 11249 g006
Figure 7. Estimated average damage rates per building block according to the attenuation formulas of (a) Ambraseys et al., (b) CSO 2003, and (c) Sabettaand Pugliese.
Applsci 11 11249 g007
Figure 8. Estimated average damage per building block according to the average values of the available QuakeIST library average attenuation relationship (generic law).
Applsci 11 11249 g008
Figure 9. Average degree of damage for the external seismic model based on the Gavdos earthquake, 2012.
Applsci 11 11249 g009
Figure 10. Estimated average degree of damage per building block under extreme seismic events: (a) Mw = 7.5, (b) Mw = 8.0, and (c) Mw = 8.5.
Applsci 11 11249 g010
Table 1. Earthquake-related impact level description, modified by Mota de Sá et al. [24].
Impact LevelDescription
IMinor damage, which does not seriously affect the buildings, does not affect their normal operation, and does not cause injuries. Some minor damage may occur, which can be repaired quickly.
IIModerate levels of damage and inability to use small parts of the buildings (i.e., <5%), affecting the habitability of a given part with problems in water supply, electricity, etc.
IIIDestruction of significant parts of buildings, inability to use them properly, disruption of water supply, electricity, etc., due to extended levels of damage; part of the population may need to be permanently relocated.
IV and VSevere damage that causesthe inability of the urban system to function properly up to complete disruption both at physical and functional levels.
Publisher’s Note: MDPI stays neutral with regard to jurisdictional claims in published maps and institutional affiliations.

