Article

Reconstruction of Rice Drying Model and Analysis of Tempering Characteristics Based on Drying Accumulated Temperature

1
National Engineering Laboratory for Grain Storage and Transportation, Academy of National Food and Strategic Reserves Administration, Beijing 100037, China
2
Jiangsu Key Laboratory of Advanced Food Manufacturing Equipment and Technology, College of Mechanical Engineering, Jiangnan University, Wuxi 214122, China
*
Author to whom correspondence should be addressed.
Appl. Sci. 2021, 11(23), 11113; https://doi.org/10.3390/app112311113
Submission received: 22 October 2021 / Revised: 22 November 2021 / Accepted: 22 November 2021 / Published: 23 November 2021
(This article belongs to the Section Agricultural Science and Technology)

Abstract

:
Previous research has shown that the accumulated temperature can describe drying processes as well as crop growth. To describe the mass and heat transfer processes in the rice drying process more accurately, a mathematical model of rice drying was proposed based on the drying accumulated temperature, and the optimal tempering ratio for conventional hot air drying was obtained through data comparison and analysis. First, it was proven that there was an exponential relationship between the moisture ratio and the drying accumulated temperature of rice. Second, by comparing and analyzing the fitting results of seven different drying mathematical models, the model with the highest fitting degree was selected and reconstructed to obtain the drying accumulated temperature–moisture ratio model. Finally, the new model was used to fit the results of two drying experiments without and with tempering, and the tempering characteristics of rice drying were proved by comparing and analyzing the coefficient difference between the two models. The results showed that the optimal tempering ratio was 3. This study thus provides a reference for rice drying process parameters.

1. Introduction

Drying is a heat and mass transfer process that involves moisture migration, moisture diffusion, a large evaporation lag time, strong coupling of the drying parameters, and non-linear effects. Drying is not only affected by the physical structures and the chemical properties of the materials; it also is related to the climatic conditions and the drying process [1]. Mathematical modeling can be used to explore the relationships between the parameters in a system, and these relationships can be quantified and finally described in the form of mathematical language. In addition, the model can be used to calculate and analyze the relationships between various parameters or trends of the whole data set [2]. During the drying of grains, the appearance, nutrient composition, and chemical composition of the grains varies, and many of these variations can be modeled as functions of temperature, moisture, and time [3]. Therefore, if the dependence of the temperature and moisture content distribution in the grain on the drying time can be established accurately, adverse effects can be better predicted and controlled [4,5]. To establish a mathematical model of grain drying that is more practical and can be used in dryers, it is necessary to consider the complicated heat and mass transfer processes. This process is related to many factors, such as the temperature, humidity, and wind speed, and it is often affected by many at the same time [6]. Most of these factors have non-linear characteristics and large lags in terms their effects on the drying process. Furthermore, some factors are difficult to measure, such as the density of a grain pile in the dryer and its effect on the drying process. Therefore, many current mathematical models are more scientific than practical. To improve the above situation, many new and more accurate sensors and gauges have been introduced in recent years to record more comprehensive data or enhance control systems, which makes building new models more challenging [7]. The Page model [8], proposed by Page in 1949, has had a profound influence on field of drying. The Lewis model [9] is an exponential model that is also widely used in the field of drying, which uses Newton’s law of cooling to describe moisture motion. The Midilli model [10] is another exponential model, which has a better fitting effect than the Page model in some cases. Prakash [11] proposed two single-parameter equations to quantify the thin-layer drying characteristics of contemporary long-grain rice cultivars grown in the Mid-South U.S. The results showed that the two equations have a high degree of fitting, with the shortcoming that only two drying parameters, hot air temperature and relative humidity, were taken as the influencing factors. Chen, et al. [12] carried out an orthogonal experiment involving hot air drying with variable temperature and humidity and established a comprehensive target model; the drying process was optimized by a genetic algorithm. Alves Pereira, et al. [13] used empirical and diffusion models to describe rice drying kinetics, and considered only effective time of operation to compare and evaluate continuous and intermittent drying of rough rice. This study proved that a one-dimensional diffusion model could describe the drying process of rice properly, and found that the effective mass diffusivity was higher in intermittent drying as compared to continuous drying at the same temperature. The models established in the above studies can describe the grain drying process to a certain extent; however, there is still room for improvement in the model accuracy.
Rice is a kind of heat sensitive material which requires a high drying process [6,14]. Intermittent drying is used in conventional rice drying around the world; it is considered one of the solutions to improve the energy efficiency and post-drying quality of rice without increasing drying cost, and has good research and promotional prospects. This technique reduces possible damage in the form of cracks, minimizes energy costs, and provides better final product quality [15]. The most common form of intermittent drying is alternating drying and tempering. Tempering refers to placing rice in a relatively confined space for a period of time without human intervention in order to balance the moisture gradient and reduce thermal stress between grains and within grains [16,17]. After tempering, moisture is redistributed so that surface moisture can be removed more easily, thus increasing the drying rate. In addition, moisture and heat gradients are reduced, which greatly reduces heat and moisture stress and physical damage to the rice so as not to destroy its structure [18]. Golmohammadi, et al. [19] developed a two-part mathematical model to describe the moisture distribution of rice during drying and tempering, and proposed an analytical solution model based on Fick’s second diffusion law. In his conclusion, he also stated that the tempering process greatly reduced drying energy consumption. Cihan, et al. [20] studied a variety of mathematical models for describing the intermittent drying properties of rough rice and found that the coefficient a and b, drying coefficient k and exponent n in the Midilli model can be expressed as a polynomial function of tempering time. In the research of Dong, et al. [21], it was shown that the tempering time and temperature in the drying process had significant effects on the rice moisture gradient and the crack rate. Zhou, et al. [16] respectively provided the optimal tempering ratio of infrared radiation and heat pump drying on long-grain rice, which was 2 for infrared radiation drying and 3 for heat pump drying.
In this paper, it is proposed that the accuracy of these models can be improved by the introduction of a new parameter, the effective accumulated drying temperature. Many studies have proven that the concept of an accumulated temperature in agronomy can be used to describe the grain drying process [22]. In our previous studies [23], we found that under certain drying conditions, the accumulated temperature required for grain moisture to reach the safe level is a relatively stable quantity. Therefore, based on the concept of the effective drying accumulated temperature, a mathematical model of grain drying was constructed in order to describe the grain drying process from a new perspective and to improve the grain drying model accuracy. On this basis, by comparing the mathematical model obtained in the previous experiment with the one established in this experiment, the difference between the two coefficients was analyzed and the physical significance of the data was revealed; finally, the optimal tempering ratio of rice drying was obtained. This method can also be used in drying research on other varieties of grain.

2. Theory and Model Derivation

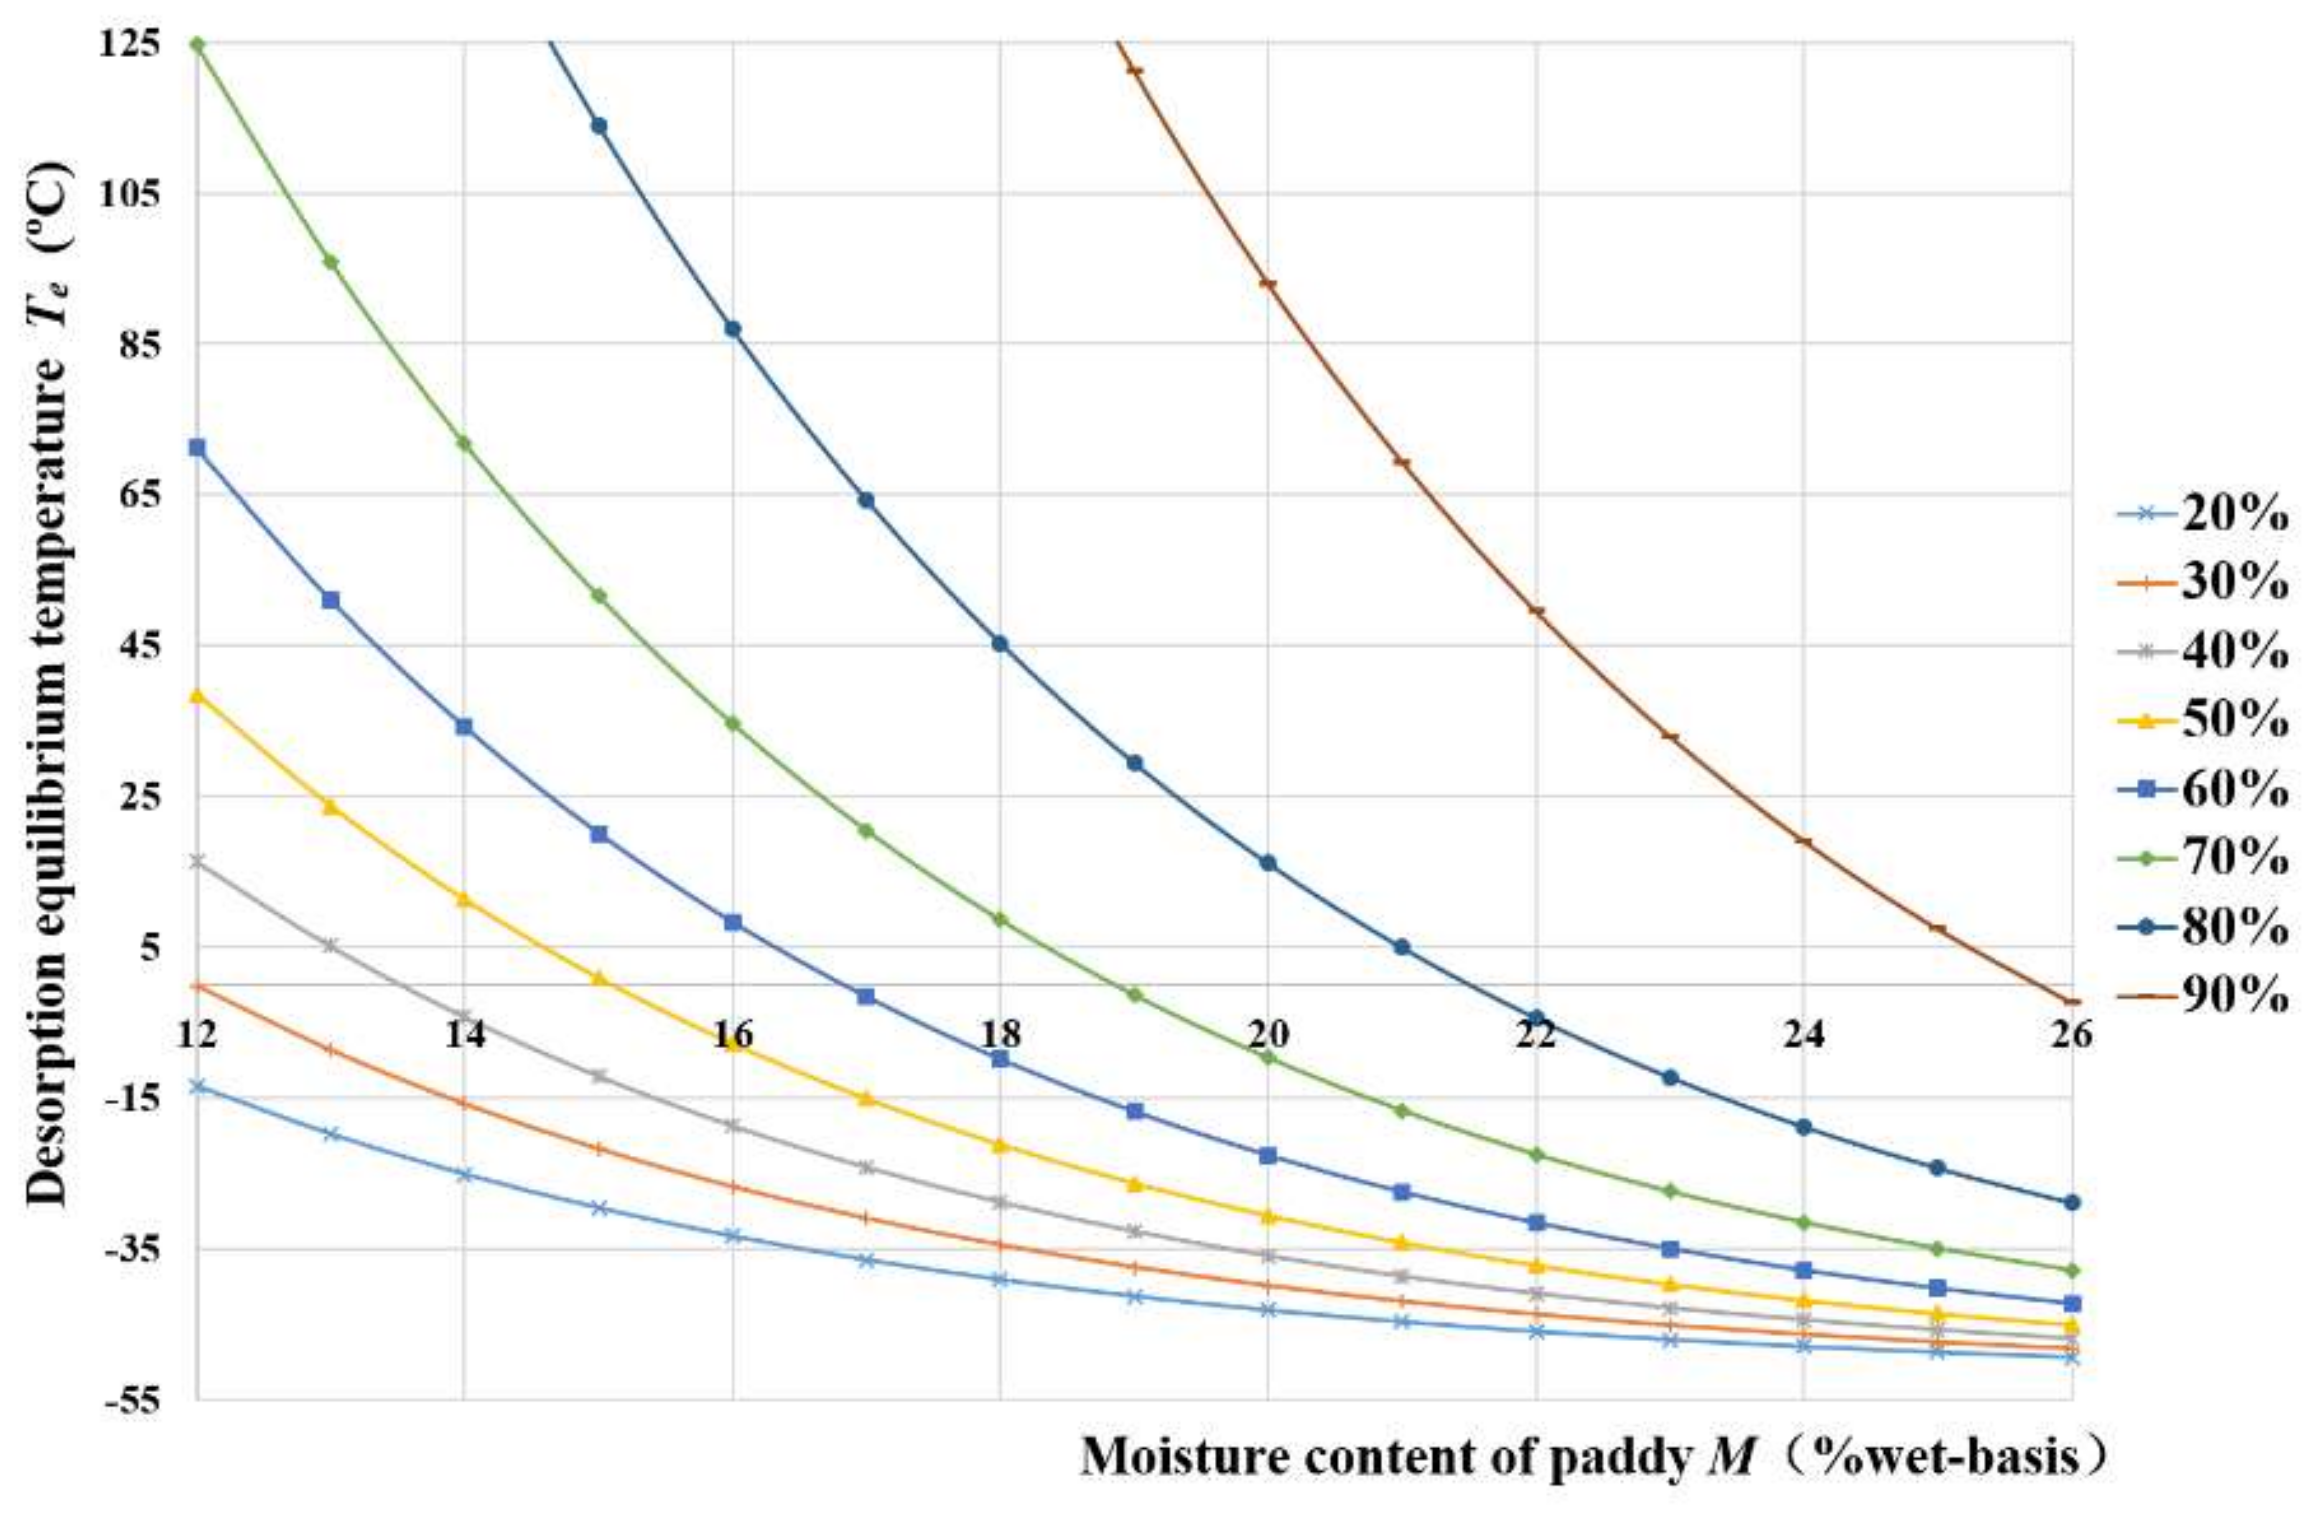
2.1. Effective Drying Accumulated Temperature Theory

Previous studies have fully proven that the temperature, especially the accumulated temperature, plays a vital role in ensuring seed germination [24,25,26], ensuring vegetation growth and distribution [27], increasing crop yield [28], and reducing insect pests [29]. Agronomists and meteorologists began to use an integral method to calculate the accumulated temperature in the 1950s. The temperature changes with time were plotted, and the following formulae were respectively proposed to calculate the active accumulated temperature and effective accumulated temperature [30]:
A n = t 0 t n T t d t     T t T 0 ;   if   T t < T 0 , T t = 0 ,
A e = t 0 t n T t - T 0 d t     T t T 0 ;   if   T t < T 0 , T t T 0 = 0 ,
where An is the active accumulated temperature (°C·d), Ae is the effective accumulated temperature (°C·d), t0 is the initial time, tn is the final time, and T0 is the biological zero degree (°C).
The biological zero degree is defined as the lower temperature limit for plant growth and development under suitable conditions. Correspondingly, there is an equilibrium temperature in the grain drying process; that is, drying will begin only when the temperature is higher than the equilibrium temperature without considering other environmental factors. In this paper, the effective drying accumulated temperature of the grain (hereinafter referred to as drying accumulated temperature) is defined as the sum of the temperatures higher than the equilibrium temperature of the grain in the drying process, expressed as follows:
A T = 0 t n T T e d t ,
where AT is the accumulated effective drying temperature of the grain (°C·h), T is the temperature of the grain at time t (°C), Te is the desorption equilibrium temperature of grain at time t (°C), and tn is the drying time (h). Te can be derived from the modified Chung–Pfost equation (MCPE) [31,32]:
R H = exp C 1 T e + C 2 exp C 3 × M e .
The equilibrium temperature is expressed as follows:
T e = C 1 ln R H exp C 3 × M e C 2 .
In these equations, RH is the relative humidity (decimal), Me is the equilibrium moisture content (%, dry basis), and C1, C2, and C3 are constants that depend on the crop variety. The research object of this paper was rice, and the corresponding constants are as follows: C1 = 529.276, C2 = 52.725, and C3 = 0.177 [32].
The formula of the equilibrium moisture content of the grain is as follows:
M e = 1 N 3 × ln T r + N 2 × ln R H N 1 ,
where Tr is the relative temperature (°C), and N1, N2, and N3 are constants that depend on the crop variety. The constants for rice are as follows: N1 = 588.376, N2 = 59.026, and N3 = 0.18 [32].
The equilibrium temperature as a function of the moisture content and environmental relative humidity can obtained using Equation (5), and the obtained equilibrium temperatures are plotted in Figure 1. The higher the moisture content of the rice is, the lower the desorption equilibrium temperature of the rice is. The higher the environmental relative humidity is, the higher the desorption equilibrium temperature of the rice is. For a fixed moisture content of the rice, the desorption temperature increases significantly with the increase in the relative humidity of the environment. For a fixed environmental relative humidity, the moisture content of rice is negatively correlated with the desorption equilibrium temperature. When the relative humidity is lower than 40% and the moisture content of rice is higher than 13.5%, the desorption equilibrium temperature of the rice is lower than 0 °C.

2.2. Derivation of Effective Drying Accumulated Temperature Model for Rice

In the previous orthogonal test, the temperature of the rice sample was roughly equal to the temperature of the hot air. This is because the test equipment used was in the form of hot air internal circulation, so the grain temperature was approximately regarded as hot air temperature to reduce unnecessary calculation. Therefore, Equation (3) was simplified to obtain the following formula for the drying accumulated temperature of rice:
A T n = i = 1 n T T e i × t i ,
where ti is the time of the ith weighing cycle (ti = 0.25 h in this experiment), and Tei is the desorption equilibrium temperature of rice in the ith weighing cycle (°C). The formula for Tei is as follows:
T e = C 1 ln R H exp C 3 × M i C 2 ,
where Mi is the initial moisture content of the rice in the ith weighing cycle (%, dry basis).
To establish a mathematical model of the relationship between the moisture ratio and drying accumulated temperature, the moisture ratio and accumulated temperature during different drying stages were compared, as shown in Table 1.
The instantaneous wet-basis moisture content at each time node of each test group was extracted from the original test data, then was converted to dry-basis moisture content, Md, as follows:
M d = M t 100 M t × 100 .
The moisture ratio of the rice sample at any time (MRn) can be determined by combining Equations (6) and (9).
The desorption equilibrium temperature Te during rice drying at each time node was different, because Te was related to its instantaneous dry-basis moisture content. The drying accumulated temperature can be obtained by combining Equations (5), (7) and (9). Equation (8) is combined with the simultaneous equations to obtain the total drying accumulated temperature (ATn) at any time node.

3. Model Reconstruction

3.1. Test Review

In the previous studies [23], a multiple quadratic regression orthogonal rotation combined experiment was carried out to explore the relationship between rice drying parameters and drying accumulated temperature. In the previous experiment, the hot air temperature (X1), the relative humidity of the hot air (X2), the initial moisture content of the rice (X3), and the velocity of the hot air (X4) were selected as the inputs, and the drying accumulated temperature was selected as the output. The level coding table of each factor in this experiment is shown in Table 2.
The test data were processed after the test. The moisture ratio and drying accumulated temperature were determined for each set of experimental conditions according to the method described in Section 2.2. The 18th group (X1 = 27 °C, X2 = 55%, X3 = 21%, X4 = 0.6 m s−1) was randomly selected, and the results are shown in Table 3. Test data were chosen randomly, as shown in Figure 2. There was an exponential relationship between the moisture ratio and the drying accumulated temperature during rice drying. Therefore, this relationship can be described by exponential equations.
Multivariate quadratic regression analysis of the test results was carried out with Design-Expert V12.0 software. The following regression model relating the various factors to the drying accumulated temperature [23] was established:
A T = 428.23 26.33 X 1 + 3.44 X 2 + 89.56 X 3 0.20 X 2 X 4 + 0.25 X 1 2 1.82 X 3 2 ,
the F value of this model was 38.361. The p values for the significant terms were less than 0.0001, and the R2 value was 0.9553, indicating that the model was extremely significant.

3.2. Model Selection Method

Based on the concept of effective accumulated temperature and the existing mathematical drying models, a model relating the accumulated temperature and the moisture ratio of rice was constructed. MATLAB was used to carry out the fitting calculations on the test data and evaluate the fitting degree of the various models. The model with the best fitting degree was selected as the mathematical model of effective drying accumulated temperature.
Several exponential equations (Table 4) were selected as the drying accumulated temperature models in order to analyze the experimental drying data. The fitting accuracies of the experimental data to the thin-layer models were evaluated using the coefficient of determination (R2), chi squared (χ2), and root mean square error (RMSE). R2 is defined as follows:
R 2 = 1 i = 1 n M R i , pre M R i , exp 2 i = 1 n M R i , exp M R exp ¯ 2 ,
where MRi,exp is the moisture ratio calculated based on the experimental data, MRi,pre is predicted by the thin layer model, and M R exp ¯ is the mean of the actual moisture ratio of the experiment; χ2 and RMSE are defined as follows:
χ 2 = i = 1 n M R i , exp M R i , pre 2 N Z ,
R M S E = i = 1 n M R i , pre M R i , exp 2 N .

3.3. Drying Accumulated Temperature–Moisture Ratio Model

In the previous study, 36 groups of experimental data were substituted into the seven mathematical models shown in Table 4, and the three indices described above were used to evaluate the models, as shown in Table 5. The Midilli model yielded an extremely significant fit to the test data, with an R2 ranging from 0.998632 to 0.999964. Hence, the Midilli model was selected to describe the relationship between the moisture ratio and drying accumulated temperature.
Table 6 list the coefficients of the Midilli model for each group. The range of the constant a was between 0.995622289 and 1.004246143, which was very close to 1. The ranges of k and b were from 0.002245885 to 0.048506864 and from −0.003868304 to −0.000344992, respectively, which were very close to 0. These values of k and b are not beneficial for further analysis of the regression models; k and b are too small because AT is too large. Therefore, the Midilli model was redefined. The constant a was set to 1, and the value of AT was scaled, yielding the following model:
M R = exp k A T / 100 n + b A T / 100 .
The reconstructed model was used to fit the test data in order to obtain new evaluation parameter values for each experimental model. The ranges of these parameters were as follows: R2 = 0.998615–0.999964, χ2 = 0.0280372–1.408121, and RMSE = 0.0227802–1.106381. Thus, the new model had high accuracy and achieved good predictive performance. Finally, this model was selected as the mathematical model of the relationship between the moisture ratio and drying accumulated temperature of rice. We have named this model the accumulative temperature–moisture ratio model, or AT-MR Model.

3.4. Regression Equations of AT-MR Model Parameters

The values of k, n, and b in the AT-MR model for each group are listed in Table 7. Based on the values of the control factors for each experimental group and corresponding coefficients of AT-MR model, a multivariate quadratic analysis was conducted using the Design-Expert V12.0 software in order to determine the dependence of the coefficients on the control factors.
After regression analysis and eliminating terms that had no significant influence, the regression models for k, n, and b were given, respectively, as follows:
k = 0.39569 0.073959 X 1 + 0.035775 X 2 + 0.051727 X 3 2.26567 X 4 + 0.00276245 X 1 X 3 + 0.033933 X 1 X 4 + 0.027286 X 2 X 4 0.016476 X 3 X 4 0.0005177 X 2 2 0.00258296 X 3 2 ,
n = 8.29598 0.035018 X 1 + 0.14793 X 2 + 0.51264 X 3 + 2.88286 X 4 0.00107225 X 1 X 2 + 0.002423 X 1 X 3 + 0.058408 X 1 X 4 + 0.037446 X 2 X 4 0.15552 X 3 X 4 0.00134958 X 2 2 0.012104 X 3 2 2.89574 X 4 2 ,
b = 2.3146 0.070883 X 1 + 0.048904 X 2 + 0.20896 X 3 + 0.011486 X 4 + 0.00294823 X 1 X 3 0.000517492 X 2 2 0.00676184 X 3 2 .
and the corresponding R2 values were 0.9225, 0.9553, and 0.9131.

4. Materials and Methods

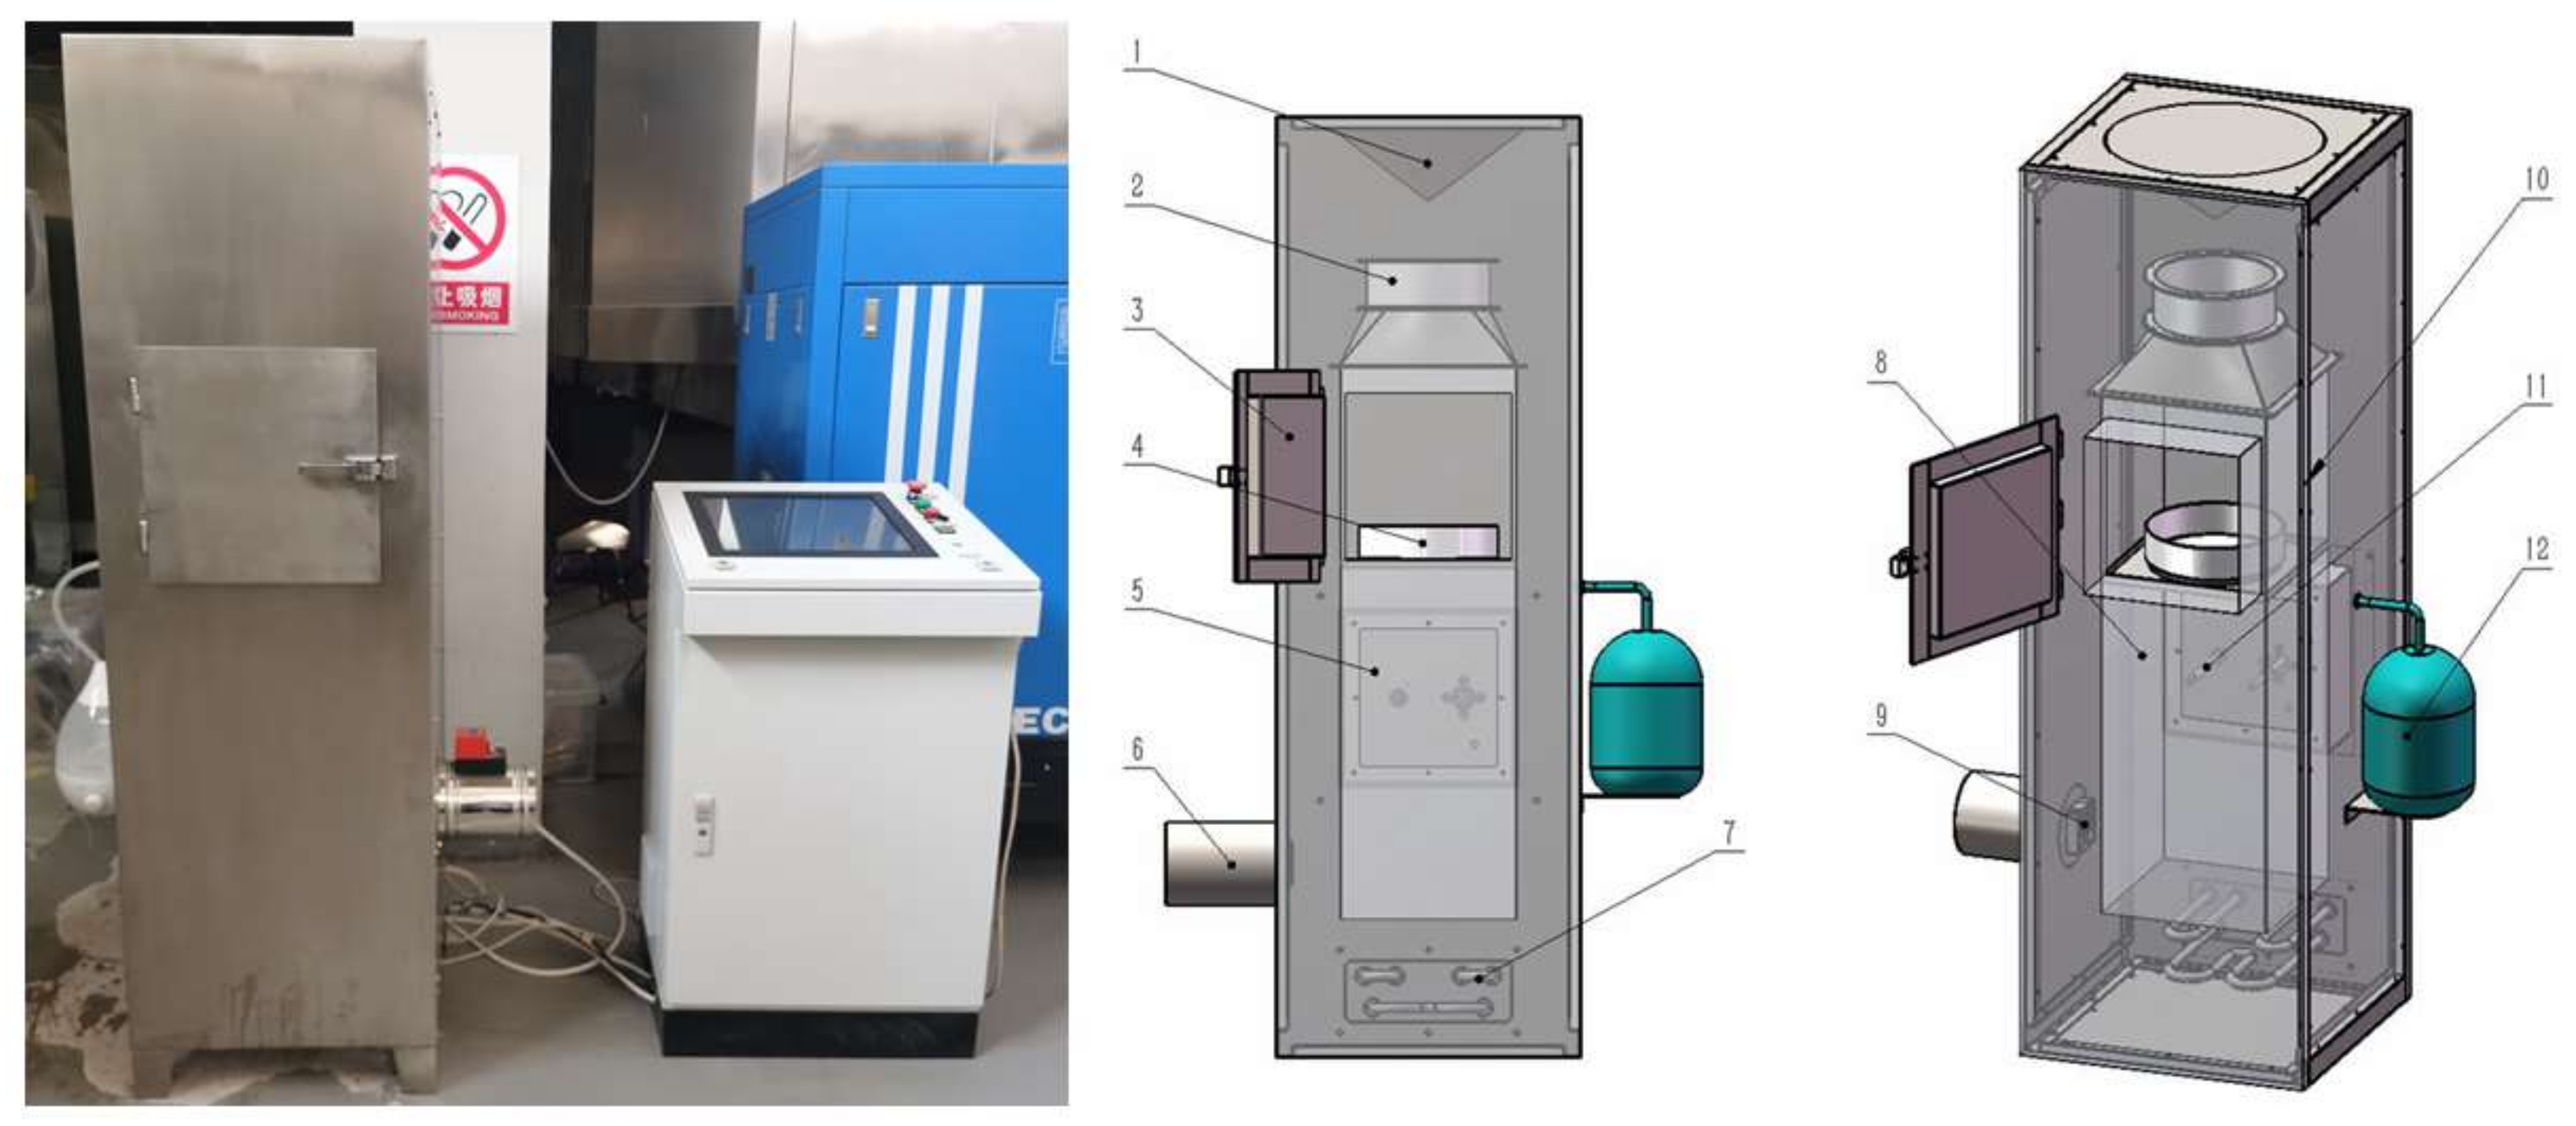
4.1. Equipment and Method

In this study, a new experimental scheme was designed which included the tempering ratio in the control factor based on the previous experiment, and appropriately expanded the level range. The level coding table of each factor in this experiment is shown in Table 8. The calculation formula of the tempering ratio is as follows:
T R = t T t D ,
where TR is the tempering ratio, tT is the tempering time (h), tD is the drying time (h).
The experiment was started in October 2020, with a total of 59 groups of experiments lasting 30 days. To avoid any influence on the test results from rice variety, only “Huang Hua Zhan” (a particular type of high-quality, late indica rice from China) was selected for this experiment. A multi-parameter controllable drying apparatus was used for the tests, as shown in Figure 3. The main function of this equipment was to accurately control the drying environment of the materials. The control accuracies were as follows: hot air temperature ±0.5 °C, hot air relative humidity ±1%, and velocity of hot air ±0.1 m s−1. Samples with different initial moisture contents were prepared prior to the start of the test. First, 1000 g of a test sample was inserted into a material sieve. The stainless-steel material sieve with a 12-mesh screen at the bottom was used to hold the rice grains while allowing hot air to pass through the grain layer. The samples were then inserted into the test chamber, the chamber door was closed, the time was recorded, and the test was started.
In this experiment, the real-time moisture content in the drying process was determined by a weighing method. After the start of the test, the material sieve was removed and weighed every 15 min, and the time and weight were recorded and input into the computer. The formula for calculating the moisture (Mt) for the weighing method was as follows:
M t = m s t m t = M 0 m o m 0 m t m t = 1 m 0 m t 1 M 0 ,
where mst is the moisture mass of the rice sample at time t (g), mt is the net weight of the rice sample at time t (g), m0 is the initial mass of the rice sample (g), and M0 is the initial moisture content (wet basis) of the rice sample (%). The drying test ended when the moisture content of the rice sample decreased to about 13.5% (wet basis).

4.2. The Test Results

The test results were as shown in Table 9.
According to the method in 3.2, the MATLAB program was used to process the test data, and the seven models in Table 4 along with the AT-MR model were used to fit the data.
From the comparison of model accuracy (Table 10), the best two fitting effects were the imitation Midilli equation (model 7) and AT-MR model (model 8), both of which models were extremely significant. The simplified modified Page II equation (model 5) had the worst fitting effect, with an R2 range of only 0.164896–0.378380. Therefore, the AT-MR model was selected as the rice drying accumulated temperature model with tempering process.

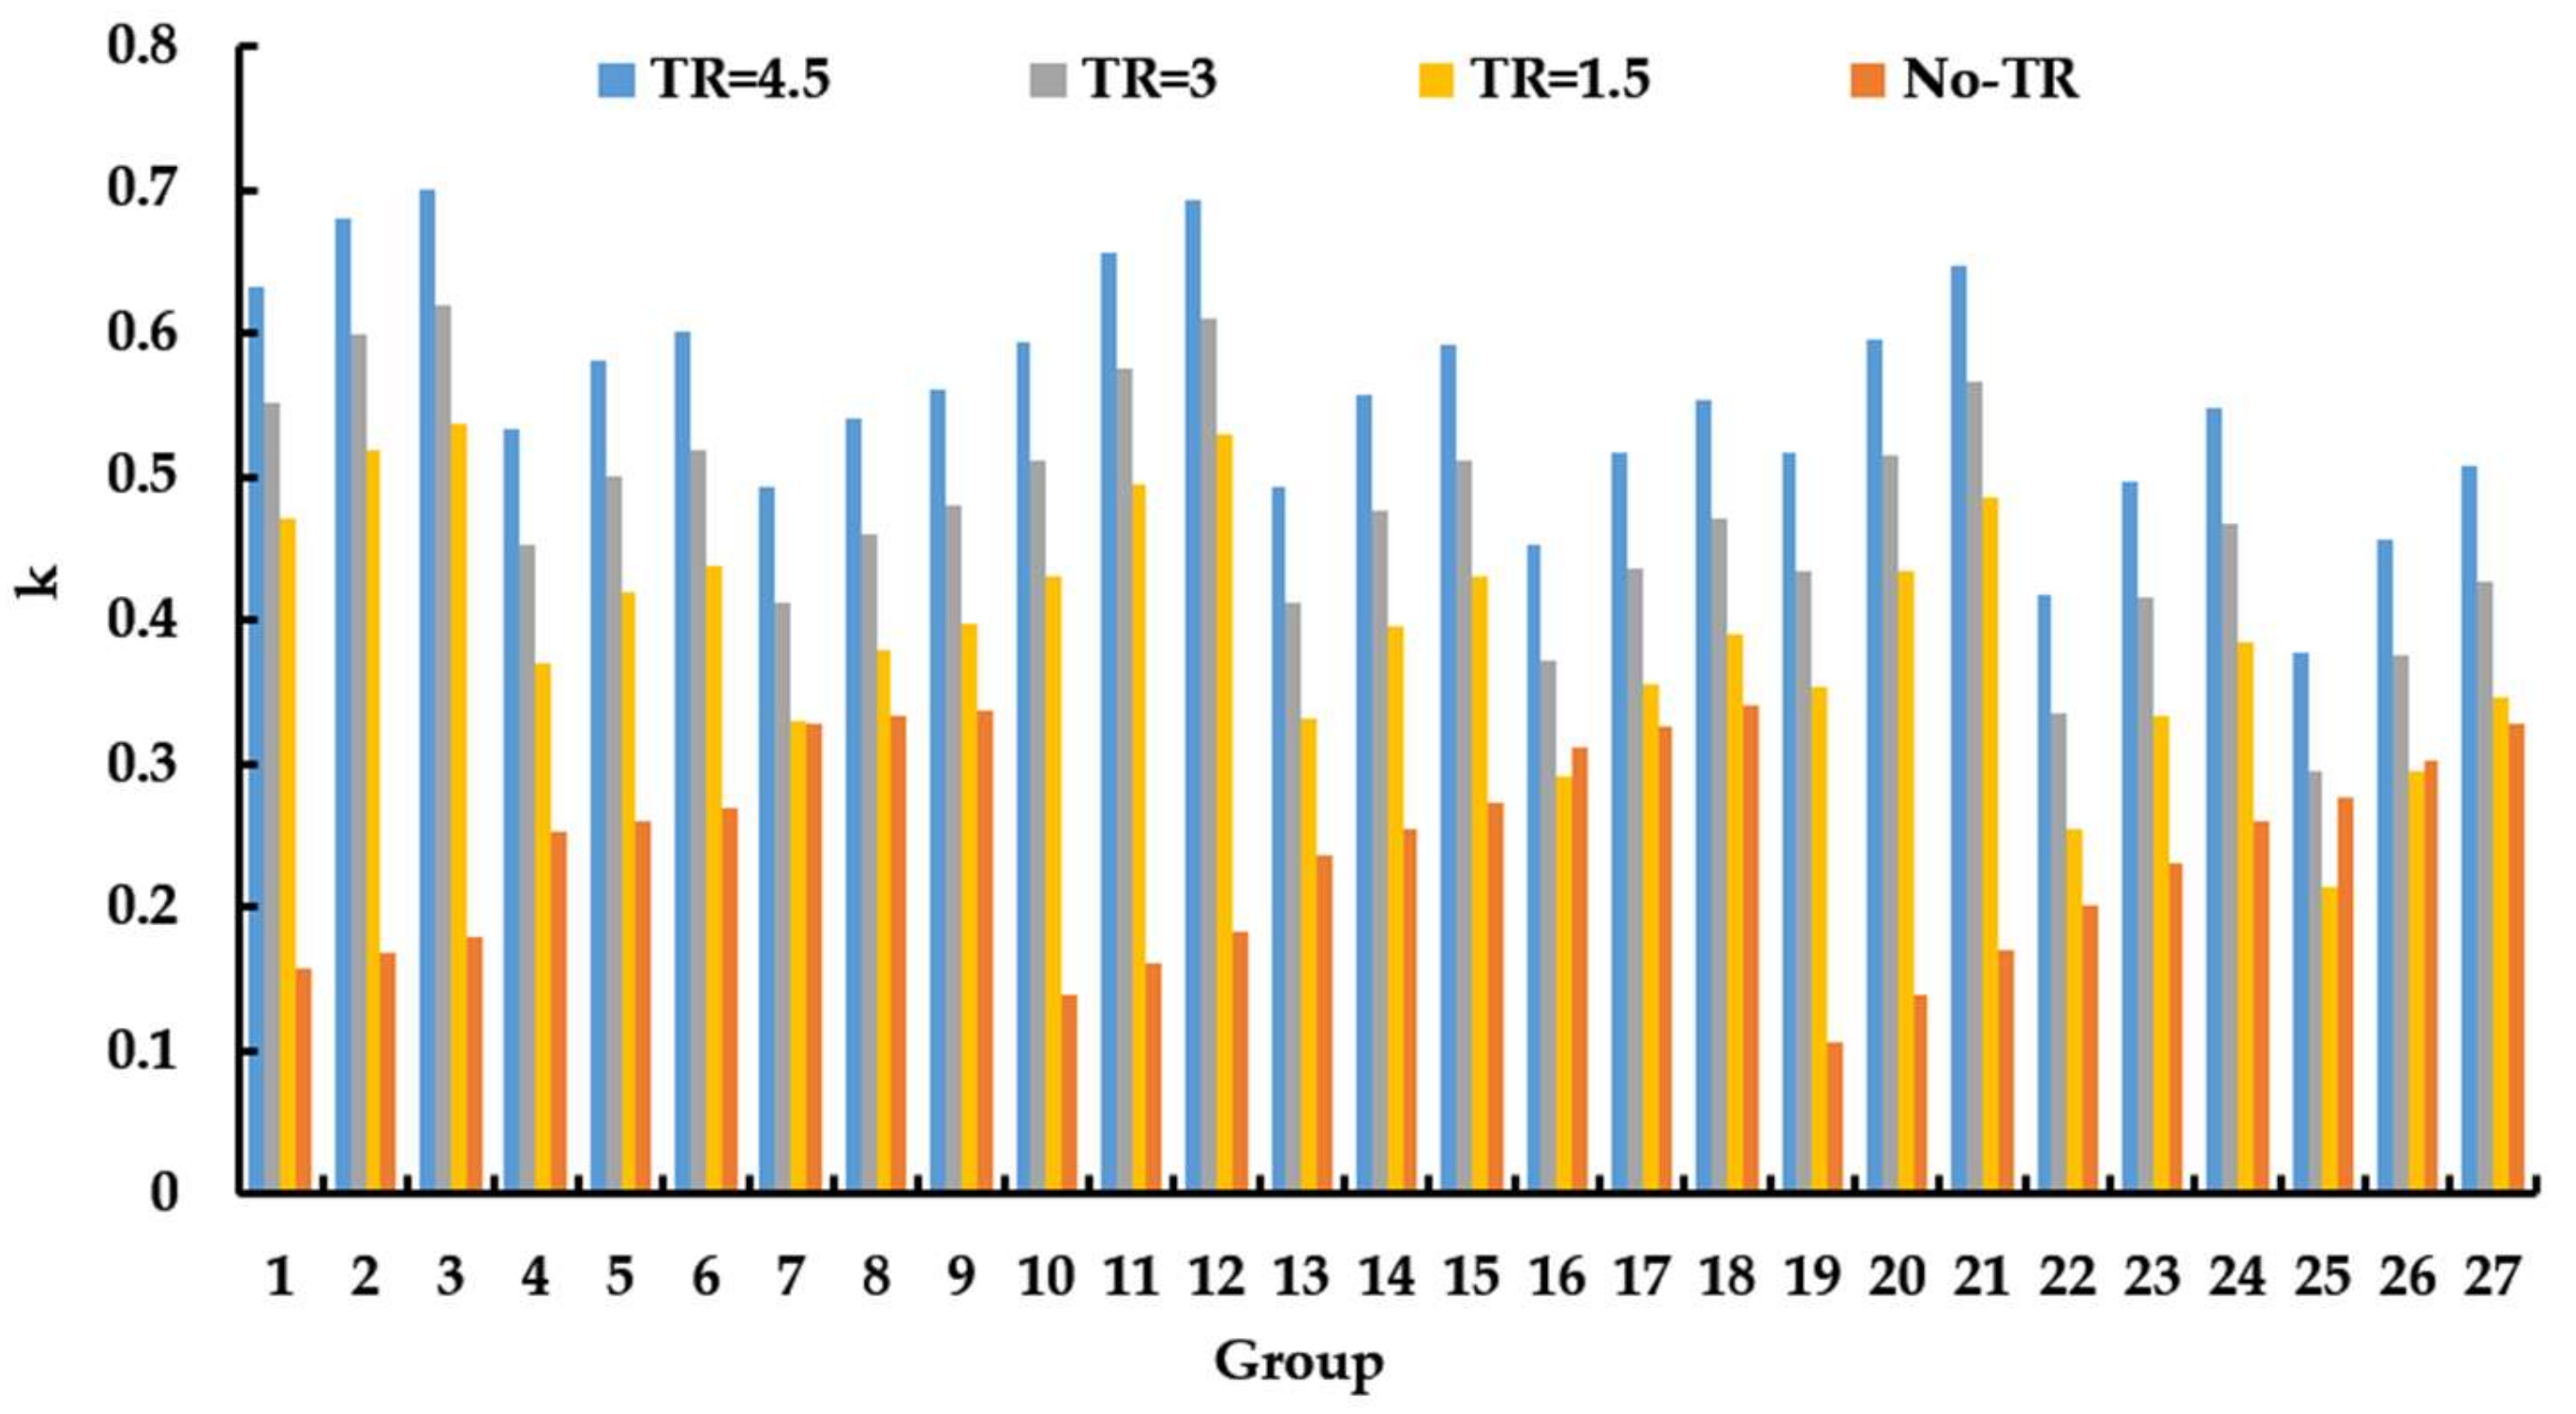
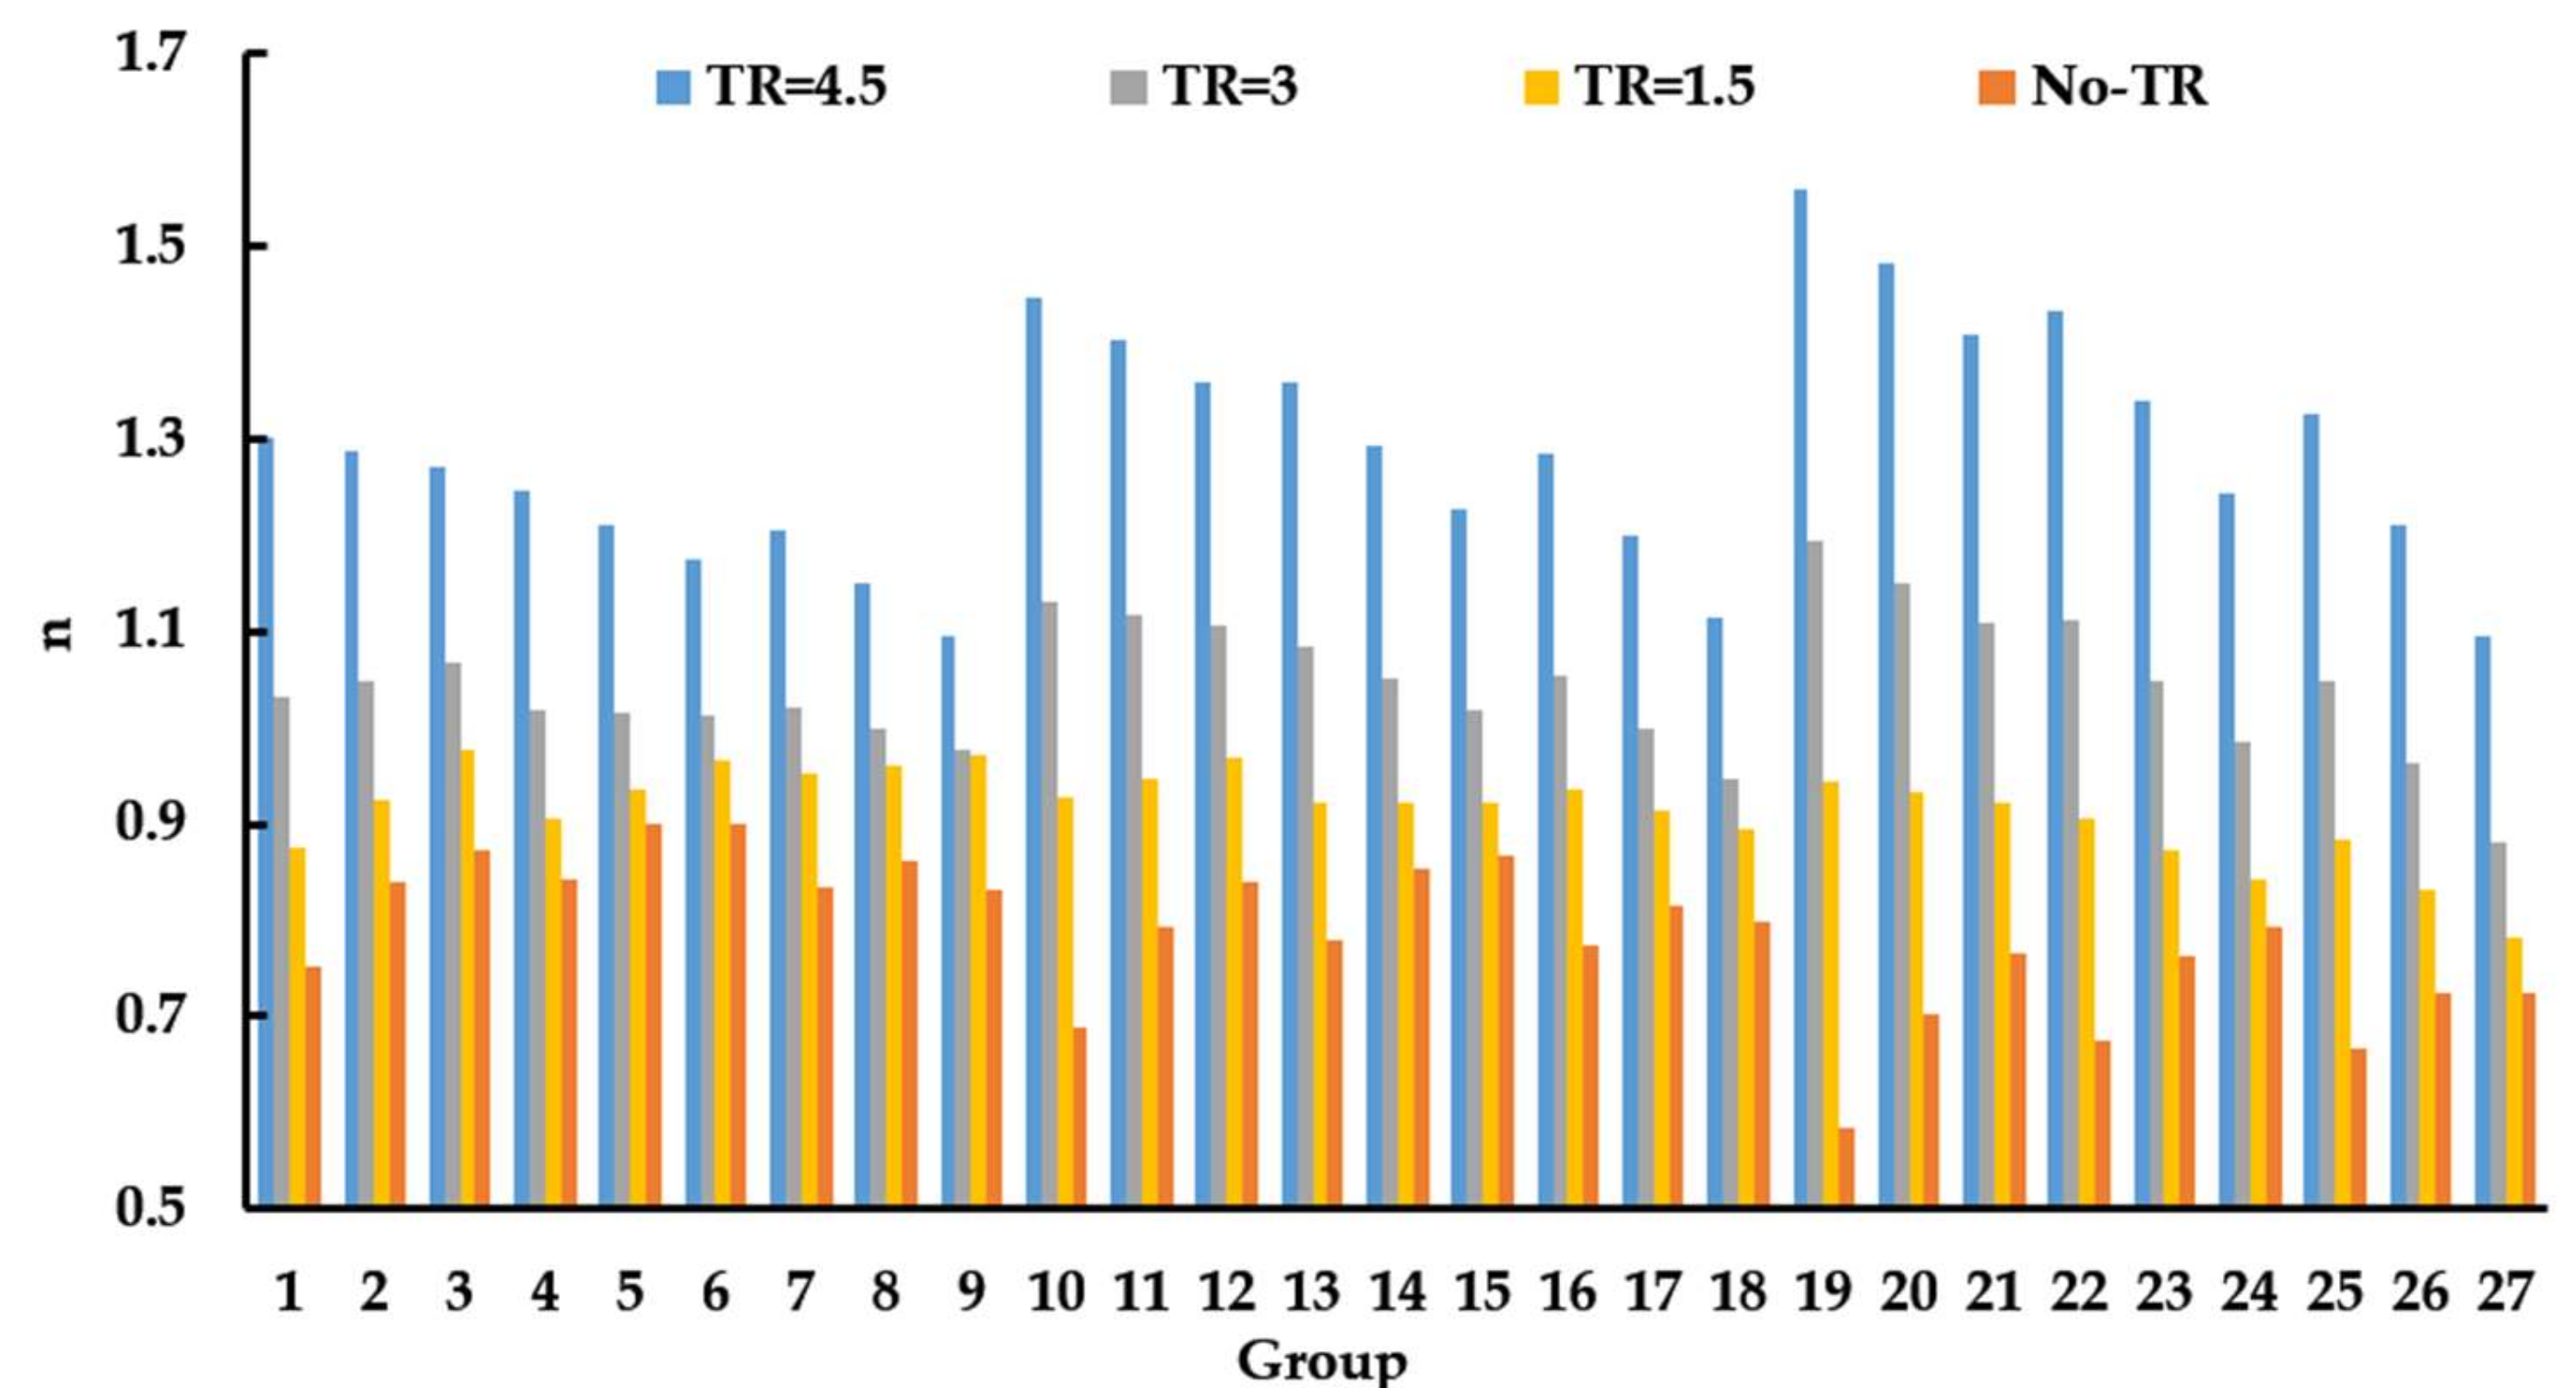
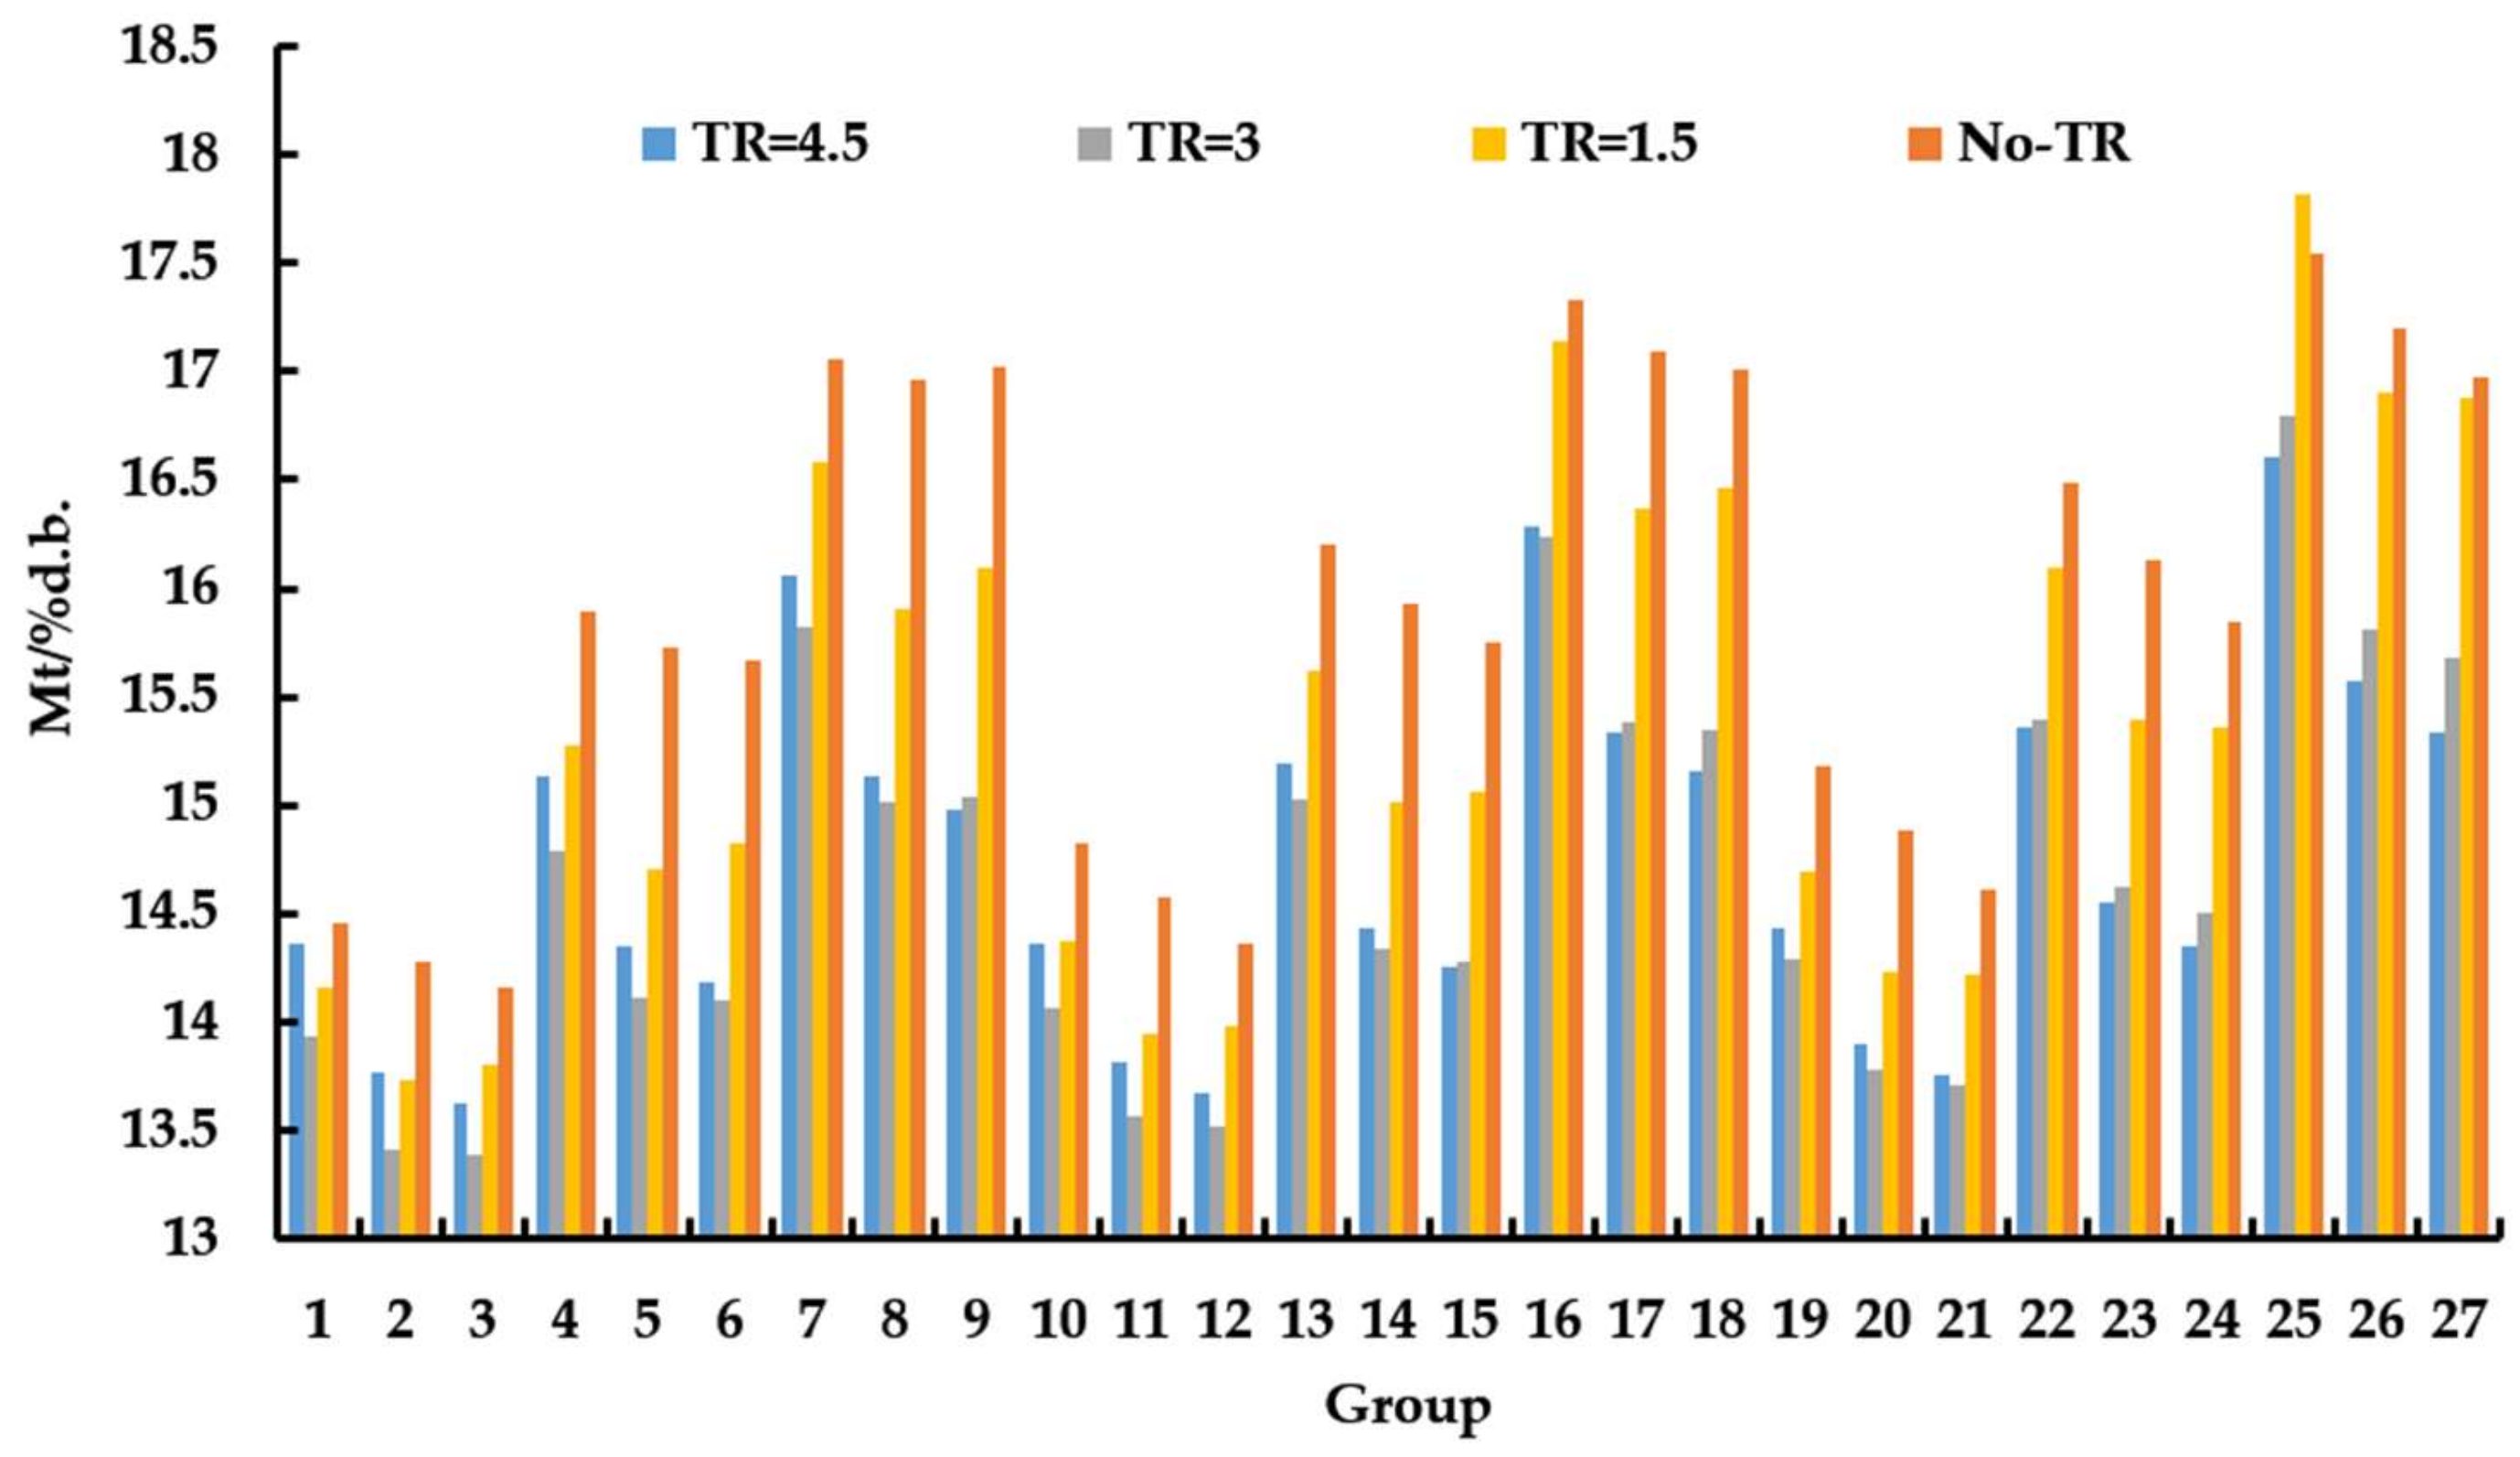
4.3. Analysis of the Effect of the Tempering Process on Rice Drying

In order to explore the influence of the tempering process on rice drying, the tempering time was ignored in the analysis of experimental data in this section, while the influence of tempering on the drying results was retained. When the time of the two models only includes the pure drying time, the influence of the tempering process on the whole drying operation can be directly reflected by comparing the coefficients and the moisture content of the two models. The essence of this approach is to explain the physical phenomena in the process of rice drying from a mathematical perspective. The specific approach was as follows: the tempering time in this test was removed; thus, only the drying time was left. Then, the AT-MR model was used to fit the data, and the new model was named “control group model”. The three coefficients, k, n and b, of the control group model were extracted (Table 11), and the regression model of the three coefficients was established.
After regression analysis and eliminating terms that had no significant influence, the regression models for k, n, and b of the control group model were given, respectively, as follows:
k = ( 1326.42 + 17.022 X 1 + 90.219 X 2 345.65 X 3 + 63.734 X 4 + 54.171 X 5 + 39.794 X 2 X 4 1.15413 X 2 2 + 7.39963 X 3 2 1430.72 X 4 2 ) × 10 3 ,
n = ( 14569.6 + 177.54 X 1 + 239.71 X 2 + 314.46 X 3 + 6536.31 X 4 + 229.01 X 5 2.53375 X 1 X 3 6.58083 X 1 X 5 4.26485 X 2 X 3 75.752 X 2 X 4 + 7.89437 X 2 X 5 101.26 X 3 X 4 14.194 X 3 X 5 215.72 X 4 X 5 1.21559 X 1 2 1.15002 X 2 2 + 2.10684 X 3 2 + 25.335 X 5 2 ) × 10 3 ,
b = ( 2156.4 + 382.09 X 1 + 438.35 X 2 1339.4 X 3 13037.1 X 4 + 1588.5 X 5 5.71409 X 1 X 3 21.4225 X 1 X 5 + 8.35782 X 2 X 3 34.1126 X 3 X 5 869.64 X 4 X 5 2.72111 X 1 2 6.41402 X 2 2 + 28.5646 X 3 2 + 12454.8 X 4 2 + 121.98 X 5 2 ) × 10 4 ,
and the corresponding R2 values were 0.9113, 0.9415, and 0.9314.
In order to create a comparable condition, the intersection of the two tests was taken to determine the level of each factor, as shown in Table 12, and a factor combination scheme table was established, as shown in Table 13. Among these, the hot air temperature was fixed at 39 °C, which was set for three reasons: first, in actual drying operations, 39 °C is the most common grain temperature in the rice drying process; second, the fluctuation range of grain temperature is not large in actual drying operations; and third, in the intersection set of the two tests, 39 °C was the midpoint of the intersection, and the error of the calculation results was minimal, which meant that the comparison results had the highest reliability. In Table 13, X5 represents the tempering ratio. In this experiment, the three tempering ratios were set to be 1.5, 3 and 4.5. The tempering ratio of conventional rice dryers is usually fixed. Therefore, the tempering ratios were not involved in the permutation and combination of groups, but were substituted into each group of equations for calculation.

5. Results

First, the influencing factors in Table 13 were substituted into the model coefficient regression Equations (15)–(17) of the effective drying temperature without tempering as well as the model coefficient regression Equations (19)–(21) of the control group. Then, the coefficients of the two models were substituted into the effective drying accumulated temperature model, and the moisture ratio of the two models was calculated when the drying accumulated temperature was 200 °C·h. Finally, the corresponding dry basis moisture was calculated by moisture ratio; some calculation results are shown in Table 14.
To make the comparison more intuitive, comparison diagrams were drawn, as shown in Figure 4, Figure 5, Figure 6 and Figure 7. As can be seen from Table 13, when every three groups are taken as a unit, only the velocity of the hot air is different. When taking every nine groups as a unit, the difference is the initial moisture. When all 27 groups are compared as units, the difference is relative humidity. Therefore, every three data points were taken as a comparison group to obtain the influence of the velocity of the hot air on each coefficient; every nine data points were taken as a comparison group to obtain the influence of the initial moisture of the rice on each coefficient; and all 27 data points were taken as a comparison group to obtain the influence of the relative humidity of hot air on each coefficient.
It can be seen from Figure 4 that the k value affected by tempering was more sensitive to the velocity of the hot air through the comparison of every three data points. According to the comparison of every nine data points, with the increase in the initial moisture content of the rice, the k value affected by tempering decreased by about 0.05–0.1, while the k value without the influence of tempering increased by about 0.05, indicating that the increase in the initial moisture content of the rice weakened the effect of the k value on the drying process. The effect of tempering on high moisture content rice was weaker than that on low moisture content rice. Through the comparison of all 27 data points, it was found that with the increase in the relative humidity of the hot air, the k values with and without the influence of tempering decreased slightly, indicating that the increase of the relative humidity of the hot air tends to weaken the effect of the tempering process.
Figure 5 shows that through the comparison of every three data points, it was found that the characteristics of the influence of the velocity of the hot air on the n value change. When the tempering ratio was 1.5 and the relative humidity of the hot air was relatively low (50%), the n value increases with the increase of the velocity of the hot air. When the initial moisture of the rice and the relative humidity of the hot air increased, the n value showed a negative correlation with the velocity of the hot air, because the desorption equilibrium temperature decreased with the increase of the initial moisture of the rice. When the tempering ratio was 3 or 4.5, the velocity of the hot air and the n value showed a negative correlation, indicating that a higher tempering ratio would hinder the drying process because too long a tempering time would lead to the occurrence of rice adsorption. Through the comparison of every nine data points, it was found that the n value decreased with an increase in the initial moisture content of the rice, and that the phenomenon was more obvious with an increased tempering ratio; the reason was the same as that mentioned before. Through the comparison of all 27 data points, it was found that an increase in the relative humidity of the hot air led to an increase in the n value. The main reason was that with the increase in the relative humidity of the hot air, the desorption equilibrium temperature of the rice kept increasing, which led to the slow increase of the AT value and the increase of the n value.
According to the AT-MR model, the b value is the slope of the linear component of the AT-MR curve. Figure 6 shows that through the comparison of every three data points, it was found that the influence of the velocity of the hot air on the b value was not obvious without the influence of tempering. In the case of the influence of tempering, the larger the tempering ratio, the more obvious the negative correlation between the velocity of the hot air and the b value, indicating that the existence of the tempering process enhanced the influence of the velocity of the hot air on the b value. Through the comparison of every nine data points, it was found that the b value had a step change with the increase in the initial moisture content of rice without the influence of tempering. When the tempering ratio was 1.5 or 3, the change in the b value was not obvious. When the tempering ratio was 4.5, the b value decreased slightly, indicating that the existence of the tempering process weakened the linearity and made the AT-MR curve closer to the exponential relationship. Through the comparison of all 27 data points, it was found that when the tempering ratio did not exceed 3, the b value was relatively stable.
As can be seen from Figure 7, the dry basis moisture of rice without the influence of tempering was the highest, followed by the tempering ratio of 1.5. The dry basis moisture of rice was very close when the tempering ratio was 3 or 4.5, indicating that when the tempering ratio reached 3, it was close to the optimal tempering ratio. If the tempering ratio was increased further, drying efficiency would not be improved. Through the comparison of every three data points, it was found that in the case of no tempering effect, the increase of the velocity of the hot air would accelerate the decrease in the moisture content of the rice. In the case of the tempering effect, when the velocity of the hot air changed from 0.5 m s−1 to 0.6 m s−1, the dry basis moisture content of the rice decreased rapidly, while when the velocity of the hot air changed from 0.6 m s−1 to 0.7 m s−1, the dry basis moisture content of the rice decreased slowly. This indicates that the tempering process reduces the velocity of hot air necessary for rice drying. In practical application, too high of a tempering ratio will prolong the drying time and the rice will re-absorb moisture, resulting in wasted energy. Therefore, in the rice drying operations, the tempering ratio should not exceed three.

6. Conclusions

In this study, the mathematical model of the relationship between drying accumulated temperature and moisture ratio of rice was established, and the results of two experiments with and without the tempering process were fitted. The results of the two kinds of fitting were compared and analyzed, and the optimal tempering ratio suitable for the drying operation of high-quality indica rice was obtained. During the research process, it was found that:
  • The relationship between the drying accumulated temperature and the moisture ratio of rice was exponential, which made it possible to establish a mathematical model. Seven existing mathematical drying models were used to fit the non-tempering test results. After selecting the model with the best fitting degree, the model was reconstructed. The reconstructed model was named the AT-MR model.
  • The AT-MR model was used to fit the test data both with tempering and without tempering, and the new evaluation parameters of the two model coefficients were obtained, as follows; Non-tempering test: R2 = 0.998615–0.999964, χ2(10−4) = 0.0280372–1.408121, and RMSE(10−4) = 0.0227802–1.106381; Tempering test: R2 = 0.997548–0.999979, χ2(10−4) = 0.016273–2.0163, and RMSE(10−4) = 0.014239–1.6979. Thus, the AT-MR model had high accuracy and achieved good predictive performance.
  • The influence of the tempering process on the rice drying process was analyzed by comparing the AT-MR model fitting results of the non-tempering test (our previous experiment) and the tempering test (the experiment in this study). The results showed that the optimal tempering ratio was effectively three under the conditions of regular hot air intermittent drying.
  • In our future research, we plan to model the batch drying process of rice in order to explore the changes in various indexes of rice during actual drying operations.

Author Contributions

Conceptualization, Y.J. and Z.Z.; methodology, Y.J.; software, J.Y.; validation, Y.J., J.Y.; formal analysis, H.X.; investigation, Y.J.; resources, Y.J.; data curation, H.X.; writing—original draft preparation, Y.J.; writing—review and editing, Z.Z.; supervision, Z.Z.; project administration, Y.J.; funding acquisition, Y.J. All authors have read and agreed to the published version of the manuscript.

Funding

This research was funded by Academy of National Food and Strategic Reserves Administration, grant number JY2005. The APC was funded by JY2005.

Institutional Review Board Statement

Not applicable.

Informed Consent Statement

Not applicable.

Data Availability Statement

Not applicable.

Acknowledgments

We thank the reviewers for their valuable suggestions that helped improve the quality of the manuscript.

Conflicts of Interest

The authors declare no conflict of interest.

References

  1. Lamidi, R.O.; Jiang, L.; Pathare, P.B.; Wang, Y.D.; Roskilly, A.P. Recent advances in sustainable drying of agricultural produce: A review. Appl. Energy 2019, 233–234, 367–385. [Google Scholar] [CrossRef] [Green Version]
  2. Tanaka, F.; Tanaka, F.; Tanaka, A.; Uchino, T. Mathematical modelling of thin-layer drying according to particle size distribution in crushed feed rice. Biosyst. Eng. 2015, 136, 87–91. [Google Scholar] [CrossRef]
  3. Jin, Y.; Wong, K.W.; Yang, D.; Zhang, Z.; Wu, W.; Yin, J. A neural network model used in continuous grain dryer control system. Dry. Technol. 2021, 8, 1–22. [Google Scholar] [CrossRef]
  4. Wang, N.; Brennan, J.G. A mathematical model of simultaneous heat and moisture transfer during drying of potato. J. Food Eng. 1995, 24, 47–60. [Google Scholar] [CrossRef]
  5. Franco, C.M.R.; de Lima, A.G.B.; Farias, V.S.O.; da Silva, W.P. Modeling and experimentation of continuous and intermittent drying of rough rice grains. Heat Mass Transf. 2019, 56, 1003–1014. [Google Scholar] [CrossRef]
  6. Rufino Franco, C.M.; Barbosa de Lima, A.G.; de Oliveira Farias, V.S.; Machado, E.A. Intermittent Drying of Rice Grains with Husk: Modelling and Experimentation. Diffus. Found. 2020, 25, 9–36. [Google Scholar] [CrossRef]
  7. Ertekin, C.; Firat, M.Z. A comprehensive review of thin-layer drying models used in agricultural products. Crit. Rev. Food Sci. Nutr. 2017, 57, 701–717. [Google Scholar] [CrossRef]
  8. PAGE, G.E. Factors Influencing the Maximum Rates of Air Drying Shelled Corn in Thin Layers. Ph.D. Thesis, Purdue University, Ann Arbor, MI, USA, 1949. [Google Scholar]
  9. Lewis, W.K. The Rate of Drying of Solid Materials. Indian Chem. Eng. 1921, 13, 427–432. [Google Scholar] [CrossRef]
  10. Midilli, A.; Kucuk, H.; Yapar, Z. A New Model for Single-layer Drying. Dry. Technol. 2002, 20, 1503–1513. [Google Scholar] [CrossRef]
  11. Prakash, B.; Siebenmorgen, T.J. Single-parameter Thin-layer Drying Equations for Long-grain Rice. Trans. ASABE 2018, 61, 733–742. [Google Scholar] [CrossRef]
  12. Chen, J.; Wu, W.; Cheng, R.; Jin, Y.; Liu, Z. Optimization of hot air drying process of corn using genetic algorithm and response surface methodology. Int. J. Food Prop. 2020, 23, 753–764. [Google Scholar] [CrossRef]
  13. Alves Pereira, J.C.; da Silva, W.P.; Gomes, J.P.; Queiroz, A.J.M.; de Figueirêdo, R.M.F.; de Melo, B.A.; Santiago, Â.M.; de Lima, A.G.B.; de Macedo, A.D.B. Continuous and Intermittent Drying of Rough Rice: Effects on Process Effective Time and Effective Mass Diffusivity. Agriculture 2020, 10, 282. [Google Scholar] [CrossRef]
  14. Kucuk, H.; Midilli, A.; Kilic, A.; Dincer, I. A Review on Thin-Layer Drying-Curve Equations. Dry. Technol. 2014, 32, 757–773. [Google Scholar] [CrossRef]
  15. Ghasemi, A.; Sadeghi, M.; Mireei, S.A. Multi-stage intermittent drying of rough rice in terms of tempering and stress cracking indices and moisture gradients interpretation. Dry. Technol. 2017, 36, 109–117. [Google Scholar] [CrossRef]
  16. Zhou, X.; Liu, L.; Fu, P.; Lyu, F.; Zhang, J.; Gu, S.; Ding, Y. Effects of infrared radiation drying and heat pump drying combined with tempering on the quality of long-grain paddy rice. Int. J. Food Sci. Technol. 2018, 53, 2448–2456. [Google Scholar] [CrossRef]
  17. Aquerreta, J.; Iguaz, A.; Arroqui, C.; Vírseda, P. Effect of high temperature intermittent drying and tempering on rough rice quality. J. Food Eng. 2007, 80, 611–618. [Google Scholar] [CrossRef]
  18. Tohidi, M.; Sadeghi, M.; Torki-Harchegani, M. Energy and quality aspects for fixed deep bed drying of paddy. Renew. Sustain. Energy Rev. 2017, 70, 519–528. [Google Scholar] [CrossRef]
  19. Golmohammadi, M.; Assar, M.; Rajabi-Hamaneh, M.; Hashemi, S.J. Energy efficiency investigation of intermittent paddy rice dryer: Modeling and experimental study. Food Bioprod. Process. 2015, 94, 275–283. [Google Scholar] [CrossRef]
  20. Cihan, A.; Kahveci, K.; Hacıhafızoğlu, O. Modelling of intermittent drying of thin layer rough rice. J. Food Eng. 2007, 79, 293–298. [Google Scholar] [CrossRef]
  21. Dong, R.; Lu, Z.; Liu, Z.; Koide, S.; Cao, W. Effect of drying and tempering on rice fissuring analysed by integrating intra-kernel moisture distribution. J. Food Eng. 2010, 97, 161–167. [Google Scholar] [CrossRef]
  22. Wu, Y.; Wu, W.; Han, F.; Zhang, Y.; Xu, Y. Intelligent Monitoring and Control of Grain Continuous Drying Process Based on Multi-parameter Corn Accumulated Temperature Model. In Proceedings of the 2017 International Conference on Smart Grid and Electrical Automation, Changsha, China, 27–28 May 2017; pp. 77–80. [Google Scholar] [CrossRef]
  23. Jin, Y.; Wong, K.W.; Wu, Z.; Qi, D.; Wang, R.; Han, F.; Wu, W. Relationship between accumulated temperature and quality of paddy. Int. J. Food Prop. 2019, 22, 19–33. [Google Scholar] [CrossRef] [Green Version]
  24. Hu, X.W.; Fan, Y.; Baskin, C.C.; Baskin, J.M.; Wang, Y.R. Comparison of the effects of temperature and water potential on seed germination of Fabaceae species from desert and subalpine grassland. Am. J. Bot. 2015, 102, 649–660. [Google Scholar] [CrossRef] [Green Version]
  25. Liu, D.; Xin, L.I.; Zheng, H.; Wang, Z.H.; University, N.A. Analysis on Changes of Earth Temperature and Spring Maize Sowing Time in Second Accumulated Temperature of Heilongjiang Province. J. Maize Sci. 2016, 24, 103–106. [Google Scholar] [CrossRef]
  26. Sun, L.L.; Li-Li, X.U.; Yuan-Peng, D.U.; Zhai, H. The relationship of effective accumulated temperature and bud burst in grapevine. Plant Physiol. J. 2016, 52, 1263–1270. [Google Scholar] [CrossRef]
  27. Zhao, D.; Wu, S. Spatial and temporal variability of key bio-temperature indicators on the Qinghai-Tibetan Plateau for the period 1961–2013. Int. J. Climatol. 2016, 36, 2083–2092. [Google Scholar] [CrossRef]
  28. Liu, Y.; Hou, P.; Xie, R.; Hao, W.; Li, S.; Mei, X. Spatial Variation and Improving Measures of the Utilization Efficiency of Accumulated Temperature. Crop Sci. 2015, 55, 1806–1807. [Google Scholar] [CrossRef]
  29. Ni, X.; Gunawan, G.; Brown, S.L.; Sumner, P.E.; Ruberson, J.R.; Buntin, G.D.; Holbrook, C.C.; Lee, R.D.; Streett, D.A.; Throne, J.E. Insect-Attracting and Antimicrobial Properties of Antifreeze for Monitoring Insect Pests and Natural Enemies in Stored Corn. J. Econ. Entomol. 2008, 101, 631. [Google Scholar] [CrossRef] [PubMed]
  30. Cинельшков, B.B. General Agricultural Meteorology; Higher Education Press: Beijing, China, 1959. [Google Scholar]
  31. Agrawal, K.K.; Clary, B.L.; Nelson, G.L. Investigation into the Theories of Desorption Isotherms for Rough Rice and Peanuts; Blackwell Publishing Ltd.: Hoboken, NJ, USA, 1971; Volume 36, pp. 919–924. [Google Scholar] [CrossRef]
  32. Li, X. Fiting Parameters of EMC/ERH Model for Chinese Rough Rice. J. Chin. Cereals Oils Assoc. 2010, 25, 1–8. [Google Scholar]
Figure 1. Relationship between the moisture content of rice and the desorption equilibrium temperature under different relative humidities.
Applsci 11 11113 g001
Figure 2. Drying accumulated temperature versus moisture ratio.
Applsci 11 11113 g002
Figure 3. Multi-parameter-controllable drying test device: 1. wind shunt, 2. axial flow fan, 3. material bin door, 4. material sieve, 5. sensor bin, 6. electric sealing valve, 7. heating pipe, 8. inner tank, 9. wet exhaust fan, 10. test-bed shell, 11. sensor group, and 12. humidifier.
Applsci 11 11113 g003
Figure 4. Comparison of the coefficient k of the two models.
Applsci 11 11113 g004
Figure 5. Comparison of the coefficient n of the two models.
Applsci 11 11113 g005
Figure 6. Comparison of the coefficient b of the two models.
Applsci 11 11113 g006
Figure 7. Comparison of moisture calculated by the two models.
Applsci 11 11113 g007
Table 1. Calculation method of moisture ratio and drying accumulated temperature.
M R Calculation Method A T Calculation Method
M R 0 1 A T 0 0
M R 1 M d 1 M e M 0 M e A T 1 T 1 T e 1 t 1 1
M R 2 M d 2 M e M 0 M e A T 2 T 1 T e 1 t 1 + T 2 T e 2 t 2
M R 3 M d 3 M e M 0 M e A T 3 T 1 T e 1 t 1 + T 2 T e 2 t 2 + T 3 T e 3 t 3
……
M R n M d n M e M 0 M e A T n T 1 T e 1 t 1 + T 2 T e 2 t 2 + T n T e n t n
1T1, T2, , T3 are all hot air temperatures T during thin layer drying (°C), and t1, t2, , tn are the weighing cycles of the rice, which were each 0.25 h in this study.
Table 2. Experimental factors and their levels.
FactorLevel
−2−1012
Hot air temperature X1/°C2731353943
Relative humidity of hot air X2/%4550556065
Initial moisture content of rice X3/%1719212325
Velocity of hot air X4/m s−10.40.50.60.70.8
Table 3. Calculation results of moisture ratio and drying accumulated temperature.
Drying Time
(h)
Wet-Basis
Moisture
Content (%)
Dry-Basis
Moisture
Content (%)
Desorption
Equilibrium
Temperature (°C)
Real-Time
Drying
Temperature Accumulation (°C·h)
Moisture
Ratio of Rice
Total Drying Accumulated Temperature (°C·h)
021.0026.58−51.3148010
0.2520.8026.27−50.32559.05550.97479.0555
0.520.4525.71−49.402219.10050.931828.156
0.7520.0925.14−48.373218.84330.888546.9993
119.4824.20−46.395336.69760.816183.697
1.2518.9223.34−44.278235.63910.7502119.3361
1.518.3922.54−42.004434.50220.6892153.8383
1.7517.9021.80−39.578733.28930.6325187.1276
217.4221.09−36.938131.9690.5784219.0967
2.2517.0020.49−34.396930.69840.532249.7951
2.516.6419.96−31.949829.47490.4917279.27
2.7516.2419.39−28.998427.99920.4477307.2692
315.9518.97−26.678826.83940.4161334.1086
3.2515.6518.55−24.105925.55290.3835359.6615
3.515.3318.11−21.230224.11510.3499383.7766
3.7515.0517.72−18.483322.74170.32406.5183
414.8017.37−15.843921.4220.2932427.9403
4.2514.5417.02−13.010920.00550.2662447.9458
4.514.3416.75−10.727818.86390.2456466.8097
4.7514.1616.49−8.486917.74340.2263484.5531
513.9516.22−5.878916.43950.2049500.9926
5.2513.7715.97−3.51815.2590.1864516.2515
5.513.6115.75−1.257214.12860.1694530.3801
5.7513.4015.481.652112.67390.1485543.0541
Table 4. Several commonly used mathematical models.
Model No.NameModel EquationModified Equation
1Linear equation M R = a t + b M R = a A T + b
2Polynomial equation M R = a t 2 b t + c M R = a A T 2 b A T + c
3Page M R = exp k t n M R = exp k A T n
4Modified Page II M R = a exp k t n M R = a exp k A T n
5Simplified modified Page II M R = a exp t n M R = a exp A T n
6Weibull II M R = exp [ t / α β ] M R = exp A T / a b
7Midilli M R = a exp k t n + b t M R = a exp k A T n + b A T
Table 5. Comparison of evaluation indicators.
Model No.Range
R2χ2 (10−4)RMSE (10−4)
10.973769–0.9991610.5720432–19.537010.0444922–17.26623
20.99196–0.9996970.0273277–7.4226660.218622–5.832094
30.984013–0.9983211.061333–14.115930.928666–12.50415
40.986226–0.9984381.034447–12.900390.840489–10.42148
50.17752–0.330753588.84853–879.66005510.48454–787.06426
60.984013–0.9983211.061333–14.115930.928666–12.50415
70.998632–0.9999640.0301823–1.5150540.0226367–1.082181
Table 6. Coefficients of the Midilli drying accumulated temperature model.
Groupaknb
11.001010.0352690.715627−0.00205125
21.001390.009264420.692957−0.00102529
30.9990120.004274390.783375−0.00196273
41.00090.005373340.530844−0.0038683
50.9994960.006503520.847199−0.000580394
61.00010.005529160.835148−0.000493744
71.000390.004565890.751331−0.00242506
81.001390.006423310.68537−0.00204891
91.001640.006453020.762578−0.000657588
101.000570.005530060.788037−0.00074992
111.001090.003162410.780761−0.00237464
120.9982020.004686920.766306−0.00130538
131.002570.006072720.72201−0.000390238
140.9986870.006768580.83013−0.000344992
151.001640.005179810.754991−0.000539943
161.001530.01293260.757631−0.000539744
170.9998830.004419830.916641−0.000969152
181.000050.004378590.854193−0.000567743
191.003430.009210750.742537−0.00208353
201.00170.005319230.688852−0.000702075
210.997930.01200820.640903−0.000764778
220.9993110.006738040.704464−0.00312659
231.00170.0063080.732581−0.000777213
241.002440.009262040.750457−0.00132015
251.001680.005428290.842068−0.000875988
261.000780.005755570.835284−0.000762651
271.001420.005632260.835448−0.0018802
281.000330.009442240.731882−0.00109802
291.0010.005330850.849266−0.000780637
301.002490.005593460.831682−0.00102325
311.001580.005302310.843352−0.00199305
321.001990.01001750.700704−0.00158544
331.000020.005245870.864654−0.000709403
341.000750.005740930.847738−0.00067994
351.000240.005859910.831015−0.000714326
361.000810.01478620.673304−0.00126142
Table 7. Coefficients of AT-MR model.
Groupknb
10.03061370.722394−0.00205125
20.005732710.707736−0.00102529
30.002522740.775986−0.00196273
40.004851070.538049−0.0038683
50.005274440.83999−0.000580394
60.005908170.838778−0.000493744
70.005961930.754152−0.00242506
80.009771030.700251−0.00204891
90.003406850.778977−0.000657588
100.003857120.790293−0.00074992
110.00232950.790945−0.00237464
120.006000940.758982−0.00130538
130.00573220.729039−0.000390238
140.008752640.822986−0.000344992
150.007445170.771492−0.000539943
160.01730730.764295−0.000539744
170.002818390.913017−0.000969152
180.006082540.849176−0.000567743
190.005366110.760183−0.00208353
200.007623520.704859−0.000702075
210.009376480.641548−0.000764778
220.01024410.70608−0.00312659
230.004634160.741747−0.000777213
240.009824860.761552−0.00132015
250.005223650.851915−0.000875988
260.005603640.84138−0.000762651
270.005443270.843705−0.0018802
280.009287360.736501−0.00109802
290.005177180.855992−0.000780637
300.005341530.843632−0.00102325
310.005107170.853163−0.00199305
320.009503350.711821−0.00158544
330.005142960.868341−0.000709403
340.00559550.85349−0.00067994
350.005742050.83538−0.000714326
360.0145160.678433−0.00126142
Table 8. Experimental factors and their levels.
FactorLevel
−2−1012
Hot air temperature X1/°C32.9938.542.546.552.01
Relative humidity of hot air X2/%41.1148535864.89
Initial moisture content of rice X3/%16.0319.221.523.826.97
Velocity of hot air X4/m s−10.360.50.60.70.84
Tempering ratio X501.452.53.555
Table 9. The test results.
GroupX1
(°C)
X2
(%)
X3
(%w.b.)
X4
(m/s)
X5Drying Accumulated Temperature
(°C·h)
138.54819.20.51.45412.53
246.54819.20.51.45345.73
338.55819.20.51.45525.72
446.55819.20.51.45369.68
538.54823.80.51.45659.89
646.54823.80.51.45466.16
738.55823.80.51.45825.44
846.55823.80.51.45592.29
938.54819.20.71.45368.45
1046.54819.20.71.45377.58
1138.55819.20.71.45493.96
1246.55819.20.71.45354.42
1338.54823.80.71.45522.83
1446.54823.80.71.45385.02
1538.55823.80.71.45698.01
1646.55823.80.71.45446.63
1738.54819.20.53.55600.22
1846.54819.20.53.55435.47
1938.55819.20.53.55892.62
2046.55819.20.53.55628.91
2138.54823.80.53.55919.96
2246.54823.80.53.55674.48
2338.55823.80.53.551388.81
2446.55823.80.53.55956.27
2538.54819.20.73.55544.39
2646.54819.20.73.55383.39
2738.55819.20.73.55775.43
2846.55819.20.73.55485.93
2938.54823.80.73.55812.97
3046.54823.80.73.55475.65
3138.55823.80.73.551051.05
3246.55823.80.73.55694.71
3332.995321.50.62.5806.94
3452.015321.50.62.5396.84
3542.541.1121.50.62.5442.64
3642.564.8921.50.62.5845.54
3742.55316.030.62.5216.11
3842.55326.970.62.5726.54
3942.55321.50.362.51133.86
4042.55321.50.842.5680.00
4142.55321.50.62.5272.64
4242.55321.50.65788.59
4342.55321.50.62.5595.00
4442.55321.50.62.5529.55
4542.55321.50.62.5488.75
4642.55321.50.62.5546.98
4742.55321.50.62.5603.50
4842.55321.50.62.5567.38
4942.55321.50.62.5573.75
5042.55321.50.62.5579.70
5142.55321.50.62.5529.55
5242.55321.50.62.5494.91
5342.55321.50.62.5546.98
5442.55321.50.62.5480.25
5542.55321.50.62.5567.38
5642.55321.50.62.5573.75
5742.55321.50.62.5529.55
5842.55321.50.62.5494.91
5942.55321.50.62.5546.98
Table 10. Comparison of evaluation indicators.
Model No.Range
R2χ2 (10−4)RMSE (10−4)
10.924177–0.9975692.3567–53.0882.0425–51.157
20.996039–0.9999120.061578–2.98690.049262–2.7069
30.982072–0.9995260.32871–17.4090.29740–16.017
40.985405–0.9995760.26662–14.1720.22853–12.472
50.164896–0.378380474.41–985.24435.69–821.04
60.982072–0.9995260.32871–17.4090.29740–16.017
70.997647–0.9999790.016892–2.02950.014076–1.6023
80.997548–0.9999790.016273–2.01630.014239–1.6979
Table 11. Coefficients of the control group model.
Groupknb
10.3413890.834138−0.0489694
20.4687290.978014−0.0377525
30.2788030.907038−0.114835
40.3966361.03552−0.107336
50.2706430.952394−0.0309789
60.3464020.983138−0.0416091
70.2353250.901302−0.0569887
80.298010.938925−0.0709415
90.3847820.96074−0.0261712
100.5197351.07809−0.0129317
110.3295090.92236−0.0956808
120.456811.0106−0.0969446
130.3057110.973768−0.0319343
140.4344211.03235−0.0327374
150.3420040.781038−0.060188
160.4458940.788397−0.0730112
170.436051.00398−0.0145096
180.6661641.07885−0.00814848
190.327391.3173−0.0545716
200.4015721.3462−0.0950719
210.3523231.02753−0.0207138
220.4301710.986659−0.0531129
230.2559641.1299−0.0270968
240.3196651.03021−0.0801716
250.45651.07825−0.0225678
260.573831.03232−0.0551755
270.4043161.21928−0.0633263
280.5504271.22649−0.082667
290.3384391.02329−0.0380423
300.5683010.926364−0.0633409
310.3537450.903214−0.0706163
320.4785140.803443−0.111609
330.3190310.842192−0.0744975
340.4697490.938362−0.120622
350.3680430.885021−0.077033
360.1740890.790303−0.223813
370.7095761.19667−0.000305122
380.4179630.930018−0.0186425
390.2211231.02904−0.0177394
400.4450990.964506−0.0252461
410.2622611.01861−0.0255577
420.5382691.298−0.00843418
430.4546731.00279−0.0629393
440.3539970.95054−0.0830329
450.4394890.961908−0.0700671
460.4236630.986718−0.0666787
470.4122750.998257−0.0691629
480.3937990.983384−0.0698121
490.3851221.05931−0.0523508
500.383721.05168−0.0651892
510.4083080.985089−0.0797404
520.3703610.981359−0.0730344
530.3913680.952122−0.0632013
540.4391841.03834−0.0760649
550.4270711.02673−0.0601507
560.3851430.967961−0.0673409
570.4140750.987404−0.059813
580.4519240.967198−0.0665639
590.4133571.03205−0.0790877
Table 12. Factors and their levels.
LevelX1
(°C)
X2
(%)
X3
(%w.b.)
X4
(m/s)
X5
−13950190.51.5
054210.63
158230.74.5
Table 13. Factor combination scheme.
GroupX1
(°C)
X2
(%)
X3
(%w.b.)
X4
(m/s)
X5
13950190.51.5/3/4.5
23950190.61.5/3/4.5
33950190.71.5/3/4.5
43950210.51.5/3/4.5
53950210.61.5/3/4.5
63950210.71.5/3/4.5
73950230.51.5/3/4.5
83950230.61.5/3/4.5
93950230.71.5/3/4.5
103954190.51.5/3/4.5
113954190.61.5/3/4.5
123954190.71.5/3/4.5
133954210.51.5/3/4.5
143954210.61.5/3/4.5
153954210.71.5/3/4.5
163954230.51.5/3/4.5
173954230.61.5/3/4.5
183954230.71.5/3/4.5
193958190.51.5/3/4.5
203958190.61.5/3/4.5
213958190.71.5/3/4.5
223958210.51.5/3/4.5
233958210.61.5/3/4.5
243958210.71.5/3/4.5
253958230.51.5/3/4.5
263958230.61.5/3/4.5
273958230.71.5/3/4.5
Table 14. Coefficient and moisture calculation results of the model.
GroupTempering Ratio = 3Non-Tempering
knbM (%)knbM (%)
10.551371.03118−0.023913.9280.157510.75148−0.207914.453
20.599331.04894−0.043313.4130.168400.84077−0.206814.277
30.618681.06670−0.037913.3790.179300.87214−0.205614.157
40.452041.01811−0.044714.7930.253320.84195−0.101015.892
50.500001.01562−0.064114.1140.260920.90013−0.099815.728
60.519351.01312−0.058714.0920.268520.90040−0.098715.670
70.411911.02189−0.042715.8220.328470.83558−0.048217.057
80.459870.99914−0.062115.0140.332770.86266−0.047016.967
90.479220.97640−0.056715.0320.337080.83182−0.045917.023
100.511721.13071−0.051814.0590.139800.68940−0.227614.825
110.575601.11817−0.071313.5610.161610.79366−0.226414.570
120.610861.10563−0.065813.5160.183420.84002−0.225314.358
130.412391.08352−0.066015.0300.235610.77986−0.120716.204
140.476271.05073−0.085414.3330.254120.85302−0.119515.928
150.511531.01794−0.080014.2740.272640.86827−0.118415.747
160.372251.05318−0.057216.2420.310760.77349−0.067817.328
170.436131.00014−0.076715.3850.325980.81555−0.066717.099
180.471400.94709−0.071315.3420.341200.79969−0.065517.006
190.435131.19344−0.100314.2890.105520.58413−0.263815.179
200.514931.15060−0.119813.7800.138240.70337−0.262714.879
210.566111.10776−0.114313.7080.170970.76470−0.261514.605
220.335801.11213−0.107815.3890.201330.67459−0.156916.486
230.415601.04904−0.127214.6250.230760.76273−0.155716.126
240.466780.98595−0.121814.5050.260190.79296−0.154615.846
250.295671.04767−0.092416.7910.276480.66822−0.104017.550
260.375470.96433−0.111815.8150.302620.72526−0.102917.204
270.426650.88099−0.106415.6800.328750.72438−0.101716.980
Publisher’s Note: MDPI stays neutral with regard to jurisdictional claims in published maps and institutional affiliations.

