Article

Estimation of Live Load Distribution Factor for a PSC I Girder Bridge in an Ambient Vibration Test

1
Seismic Research and Test Center, Pusan National University, 49 Busandaehak-ro, Yangsan 50612, Gyeongnam, Korea
2
Management Office, Korea Authority of Land & Infrastructure Safety, 24 Ena-ro, 128 Beon-gil, Jinju 52856, Gyeongnam, Korea
*
Author to whom correspondence should be addressed.
Appl. Sci. 2021, 11(22), 11010; https://doi.org/10.3390/app112211010
Submission received: 15 October 2021 / Revised: 14 November 2021 / Accepted: 17 November 2021 / Published: 20 November 2021
(This article belongs to the Section Civil Engineering)

Abstract

:
Maintenance of bridges in use is essential and measuring the live load distribution factor (LLDF) of a bridge to examine bridge integrity and safety is important. A vehicle loading test has been used to measure the LLDF of a bridge. To carry this out on a bridge in use, traffic control is required because loading must be performed at designated positions using vehicles whose details are known. This makes it difficult to measure LLDF. This study proposed a method of estimating the LLDF of a bridge using the vertical displacement response caused by traveling vehicles under ambient vibration conditions in the absence of vehicle control. Since the displacement response measured from a bridge included both static and dynamic components, the static component required for the estimation of LLDF was extracted using empirical mode decomposition (EMD). The vehicle loading and ambient vibration tests were conducted to verify the validity of the proposed method. It was confirmed that the proposed method can effectively estimate the LLDF of a bridge if the vehicle type and driving lane on the bridge are identified in the ambient vibration test.

1. Introduction

Bridges are major facilities on roads that constitute the core of social infrastructures. They are built to secure stability and usability during their service lives. A bridge with excellent construction quality and materials can safely perform its functions during its design lifetime and service life when the external environment does not change significantly. Over time, however, bridges are damaged by various factors, such as changes in the traffic environment and deterioration of materials. Thus, it is necessary to extend their lifetime and secure safety and usability through proper maintenance [1,2,3,4]. Consequently, evaluating the integrity of bridges is an important maintenance task for securing safety [5,6,7,8,9,10,11].
At present, inspections and safety diagnoses are regularly performed for the maintenance of bridges, and the load-carrying capacity of bridges is evaluated to identify their performance degradation and level of deterioration [12,13,14]. In general, the vehicle loading test is conducted to evaluate the load-carrying capacity of a bridge [15,16,17]. The overlap and symmetric behavior of a bridge can be identified by measuring the live load distribution factor (LLDF) using the vehicle loading test. When there is no connecting structure between the girders of a bridge, bending occurs only in the girders under the loads. In bridges, however, load transfer structures are installed in a direction perpendicular to the bridge axis to connect the girders. Therefore, even if a load is applied to a girder, the load is shared by the neighboring girders due to the load transfer structure connected in the lateral direction. In this instance, the degree of load transfer depends on the stiffness of the load transfer structure and the spacing between girders. This makes LLDF an important element in bridge maintenance [18,19,20].
The procedure for updating the finite element model mostly involves finding the most suitable structural parameter that can minimize the error between the measurement and analysis results by solving the optimization problem. Various types of responses, such as displacement, natural frequency, and mode shape, can be considered as references in matching the actual structure and the finite element model [21,22,23,24,25]. Dynamic characteristics for the natural frequency and mode shape can be measured using the ambient vibration test. The finite element model updated only with dynamic characteristics, however, is not sufficient to reproduce the static displacement of the target bridge. Static displacement is a good indicator in correcting the stiffness characteristics of a finite element model, but it cannot perform mass correction [26,27,28]. In this sense, the reliability of the finite element model of the target structure for structural performance evaluation can be improved if static displacement is supplemented by dynamic characteristics [29,30,31,32]. To measure static displacement, however, traffic control is required on bridges in use because loading must be performed at designated positions using vehicles whose details are known. For girder bridges, LLDF can be used instead of static displacement because LLDF represents the load-sharing behavior of girders for vehicle loads. Therefore, LLDF can be used in updating the finite element model that represents the stiffness characteristics of the target bridge.
Many studies have been conducted on the LLDF of bridges and results have consequently been published. LLDF was expressed as a function of the spacing between girders and the bridge span using the finite element analysis of a plate girder bridge [33]. A vehicle loading test was conducted on a post-tensioned box girder bridge, and the finite element model was updated using the results obtained. A study was conducted to evaluate the influence of various parameters, such as the span length, girder spacing, railing, slope, and deck thickness of a bridge, on LLDF using the updated finite element model [34]. In a study, the LLDF of a prestressed concrete (PSC) I-girder bridge was measured using a vision-based system in the static loading test, and the finite element model was updated using the measured response [35]. In another study, the finite element model of a reinforced concrete I-girder bridge was updated using the results of the vehicle loading test. LLDF was calculated and the load-carrying capacity was evaluated using boundary conditions as variables [36]. The vehicle loading test was conducted on a hollow slab bridge, and the model was updated using the test results. The influence of various parameters, such as span length, skew, and bridge deck thickness, on the distribution factor for the cross section was examined [37]. The vehicle loading test was conducted on bridges in use and the measured LLDF was compared with the criterion of ASSHTO Load and Resistance Factor Design (LRFD) in studies [38,39,40,41,42].
In general, a vehicle loading test is conducted to measure the LLDF of a bridge. It is impossible to control vehicles on bridges in use since it interferes with traffic flow. Therefore, this study proposed a method of measuring the LLDF of a bridge under ambient vibration conditions without vehicle control. This method measures LLDF by extracting the displacement of the static component from the vertical displacement response caused by vehicles traveling on the bridge. Since the measured vertical displacement response includes both static and dynamic components, the displacement response of the static component is extracted using empirical mode decomposition (EMD). In this study, a static loading test and dynamic loading test were conducted to verify the validity of the method capable of measuring the LLDF of a PSC I girder bridge under ambient vibration conditions using EMD. The results were compared with those of the ambient vibration test.

2. Estimation of Live Load Distribution Factor Using Empirical Mode Decomposition

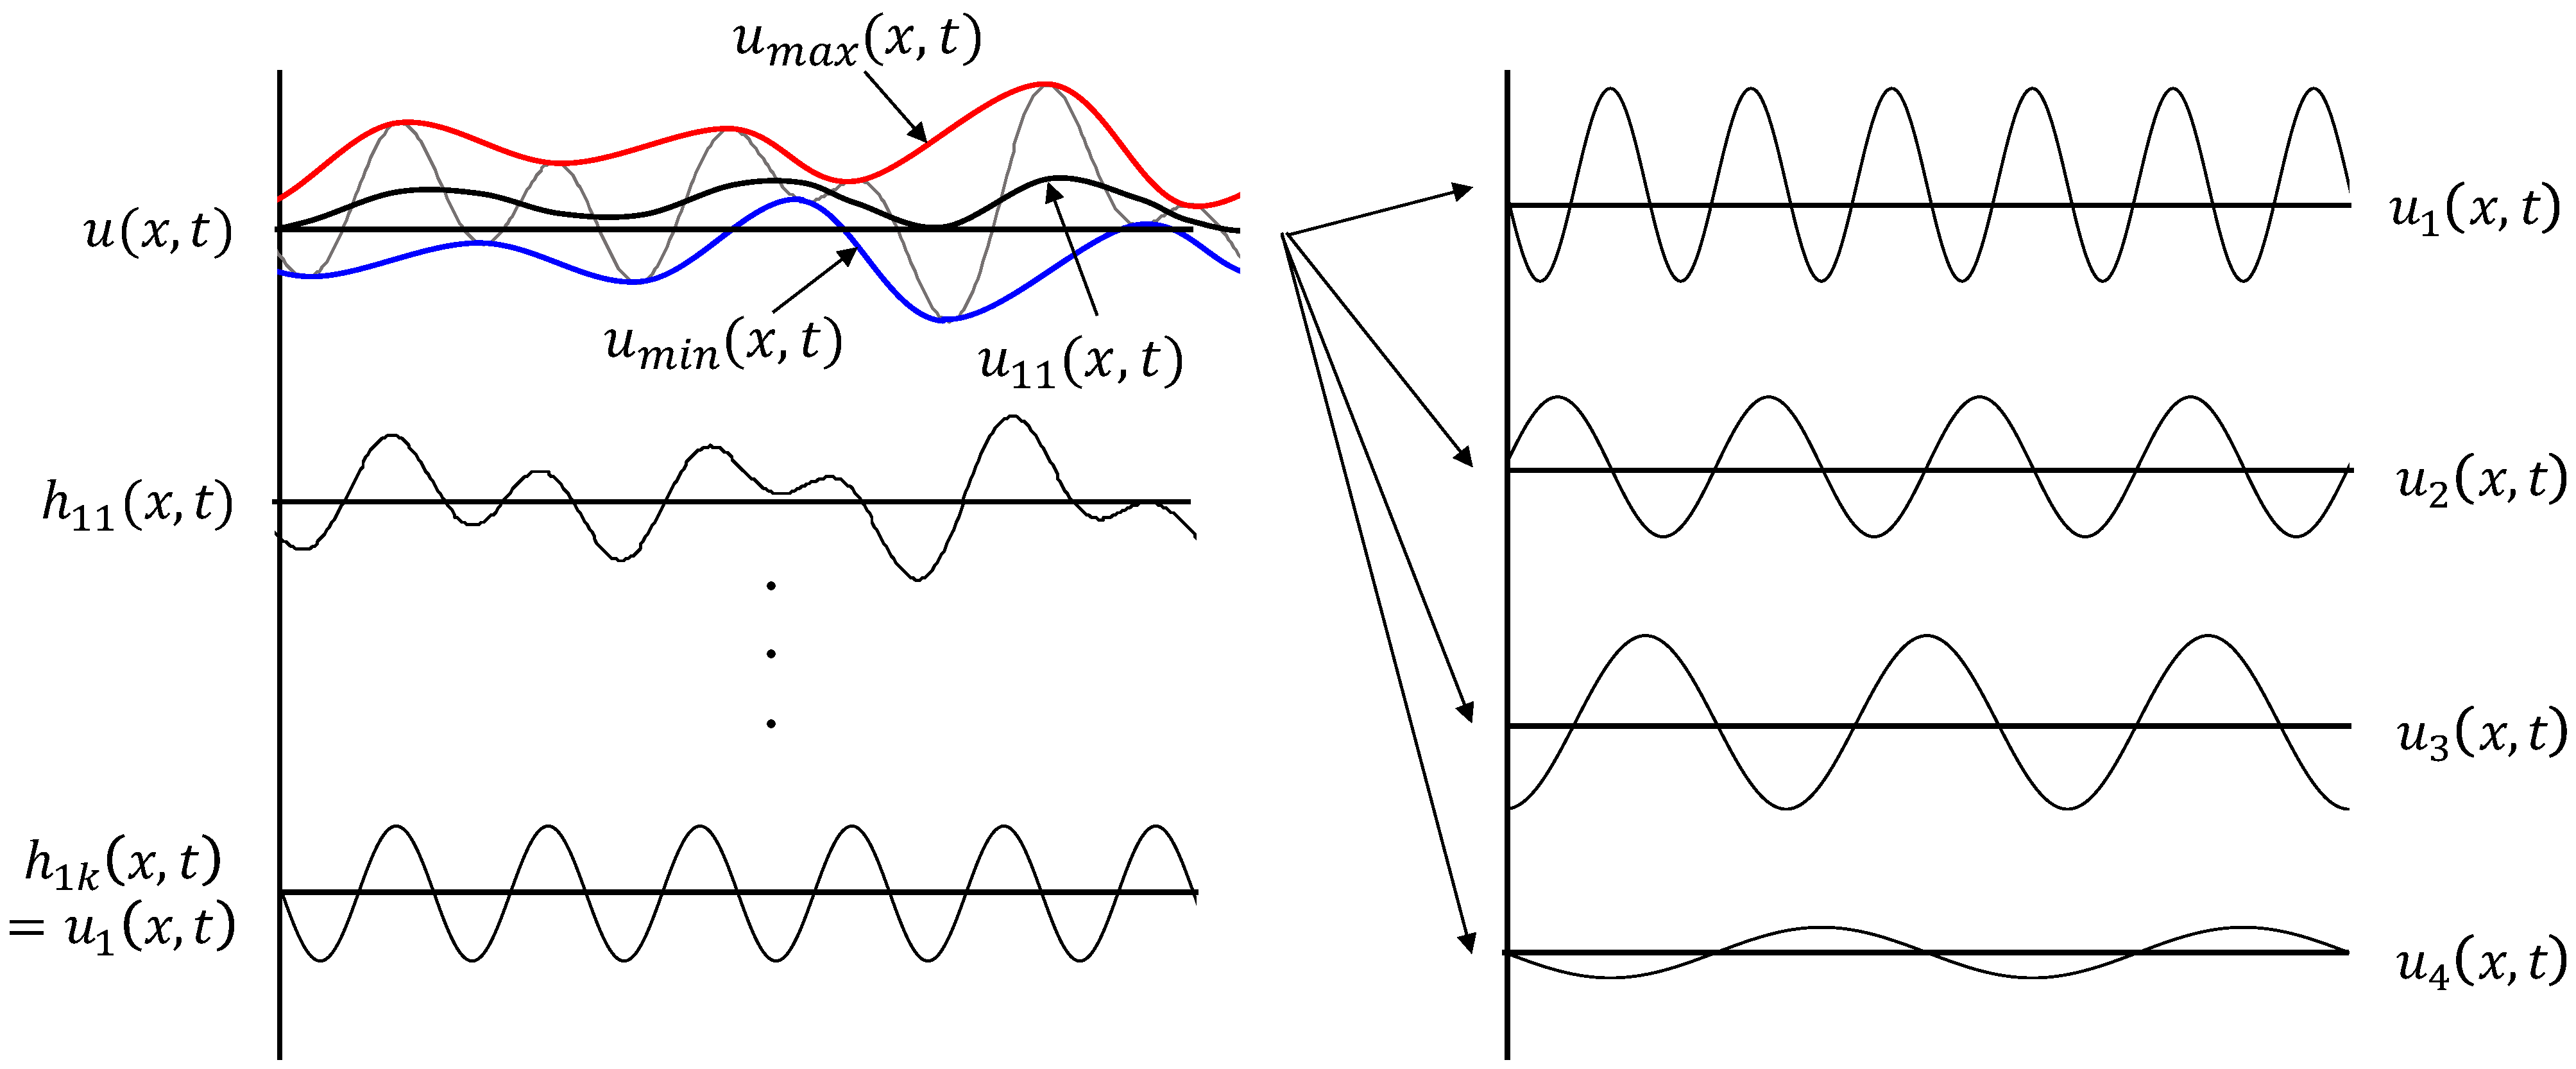
2.1. Empirical Mode Decomposition

For the displacement response of a bridge attributed to vehicle loads, the low-frequency response is overlapped with the high-frequency component. The low-frequency response is the static component that represents the displacement caused by vehicle loads. The displacement response of the dynamic component mostly corresponds to the high-frequency response that occurs due to the interaction between the bridge and vehicles. Consequently, the response of the static component must be extracted from the measured response to estimate the LLDF of the bridge.
EMD is a mode decomposition method for the dynamic response, and gradually decomposes the high-frequency component initially through the procedure shown in Figure 1 [43]. If an average curve is acquired from the envelope curves obtained using the maximum and minimum values of the displacement response as shown in Equation (1) and the average curve is removed from the measured displacement response, the displacement response of the high-frequency component with the low-frequency component reduced can be obtained as shown in Equation (2). Here, u ( x , t ) is the displacement response measured at measurement position x and time t, i is the number of the displacement response subjected to mode decomposition, and k is the number of repetitions.
u i 1 ( x , t ) = u m a x ( x , t ) + u m i n ( x , t ) 2
u ( x , t ) u i 1 ( x , t ) = h i 1 ( x , t )
The average curve was removed from the measured data to reduce the low-frequency component. Repeating Equations (1) and (2) leaves only the high-frequency component with the low-frequency component reduced. The energy difference tracking method (EDTM) was used for these repetitions [44,45]. EDTM assumes that the sum of the energy of the decomposed displacement response and the remaining energy is equal to the total energy, E t . The displacement response is decomposed by repeating the processes of Equations (1) and (2) until the difference between Equation (3) and the total energy converges to the minimum value.
E t = u i 2 ( x , t ) d t + [ u ( x , t ) u i ( x , t ) ] 2 d t
u i = h i k
Data obtained by performing the processes of Equations (1)–(3) are defined as the intrinsic mode function (IMF), which can be expressed as Equation (4). The second IMF is obtained by removing IMF from the measured displacement response and repeating the processes of Equations (1)–(3). If this process is repeated, Equation (5) can be obtained. Here, u i ( x , t ) is the i-th IMF of the decomposed signal and r n ( x , t ) corresponds to the residual response after removing IMF.
u ( x , t ) = u i ( x , t ) + r n ( x , t )

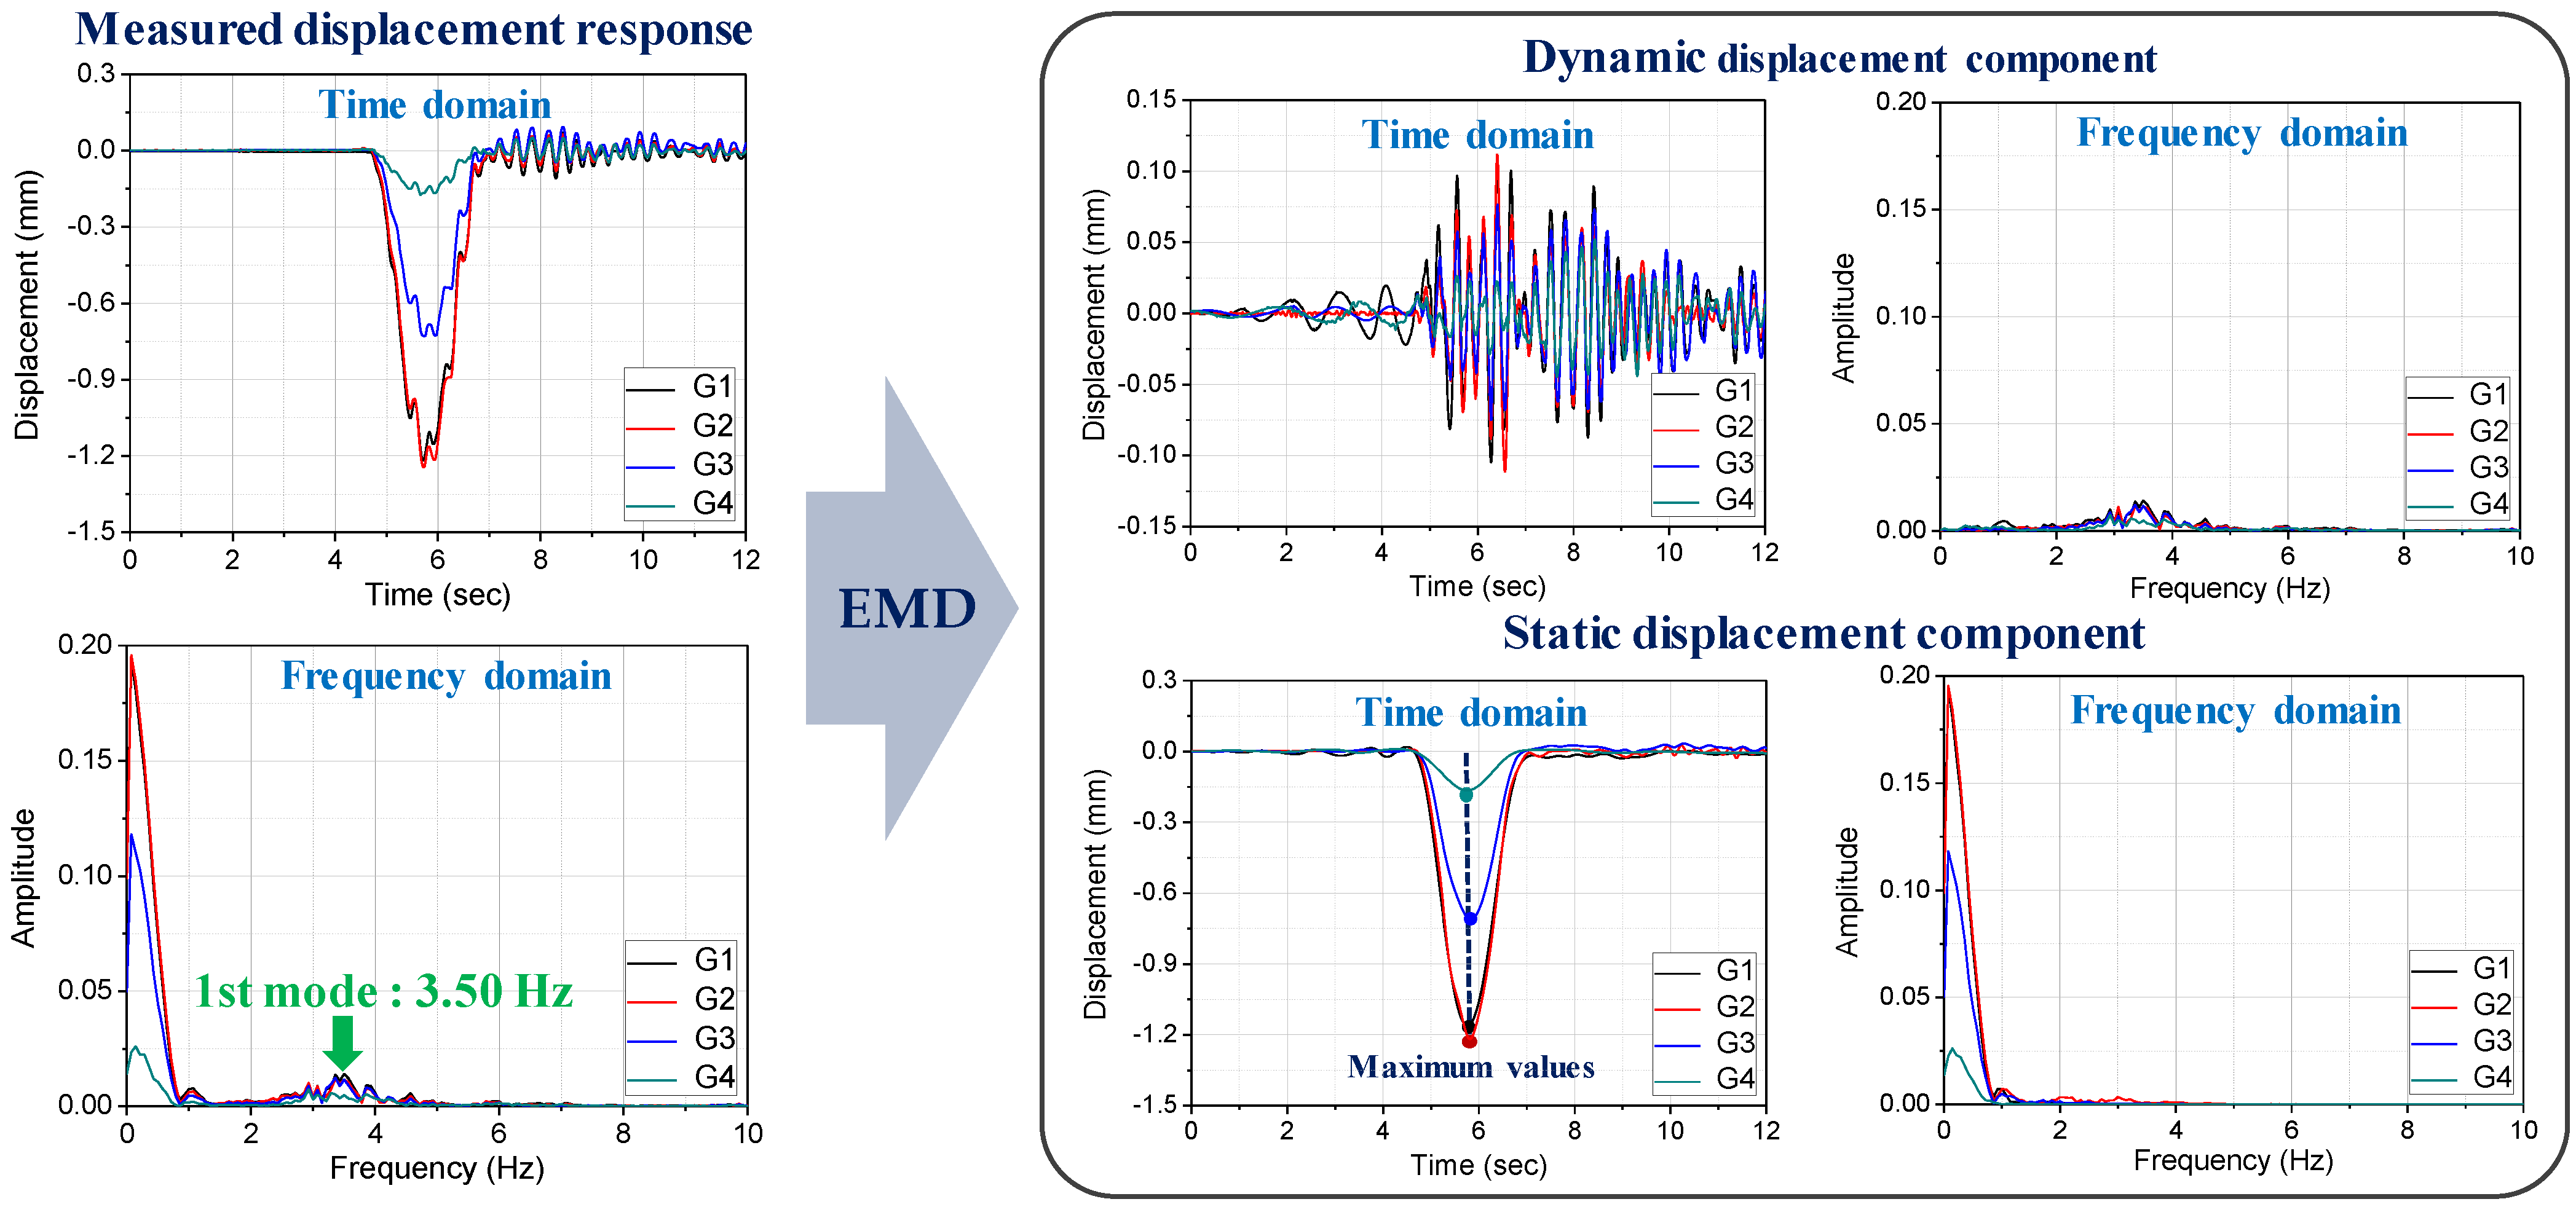
2.2. Estimation of Live Load Distribution Factor

Composite girder bridges under live loads exhibit the complex behavioral characteristics of main girders, cross beams, and slabs. The load distribution indicates a process in which a load directly applied to a girder is transferred to nearby girders. A load acting on a bridge is distributed to each girder due to the flexural and torsional stiffness of girders and cross beams. LLDF simply represents the magnitude of the horizontally distributed load as a proportion and can be expressed as Equation (6). Here, LLDFi is the value of the LLDF if the i-th girder, R m a x , i is the maximum response measured at the i-th girder, and n is the number of girders.
LLDF i = R m a x , i i n R m a x , i
Figure 2 shows the process of decomposing the displacement response measured from each girder (G1 to G4) using EDTM and extracting the displacement response of the static component from the decomposed displacement response. The extracted displacement response of the static component represents the weight of vehicles, while that of the dynamic component indicates the response caused by the interaction between the vehicles and the bridge. The maximum value of the displacement response of the static component can be used to estimate LLDF.
When IMFs that include the frequency of the first mode are superimposed, the result is identical to the displacement response of the static component in Figure 2. When mode decomposition is performed using EMD, each mode is inaccurately decomposed and one frequency component is included in several IMFs. Thus, several IMFs are required for one mode. In the process of superimposing IMFs, the response of the dynamic component is slightly included in the response of the static component as shown in Figure 2.
Figure 2 shows the process of decomposing the displacement response measured from each girder (G1 to G4) using EDTM and extracting the displacement response of the static component from the decomposed displacement response. The extracted displacement response of the static component is the response caused by the weight of the vehicles, while the extracted displacement response of the dynamic component represents the response induced by the interaction between the vehicles and the bridge. Here, the maximum displacement response of the static component can be used to estimate LLDF.
The superposition of IMFs with a frequency smaller than the first mode becomes equal to the displacement response of the static component shown in Figure 2. If mode decomposition is performed using EMD, accurate decomposition for each mode is not achieved and one frequency component is included in several IMFs. Thus, several IMFs are required for one mode. In this instance, we can see that in the process of superimposing IMFs, some of the response of the dynamic component is included in the response of the static component in the frequency domain that used fast Fourier transform (FFT) in Figure 2.

3. Estimation of Live Load Distribution Factor Using the Vehicle Loading Test

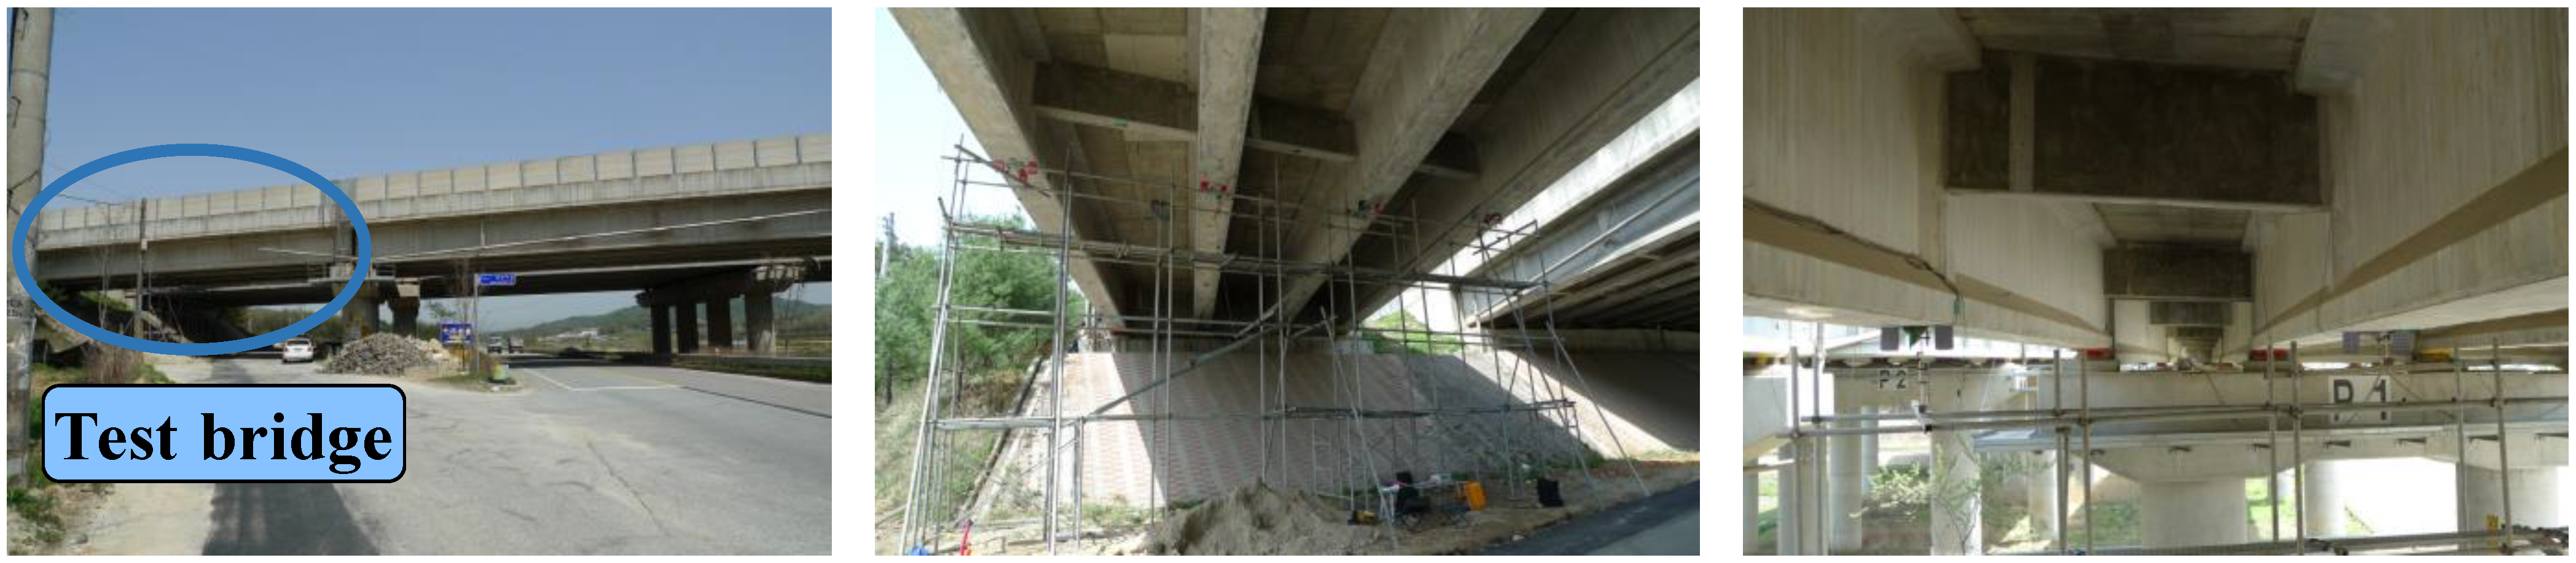
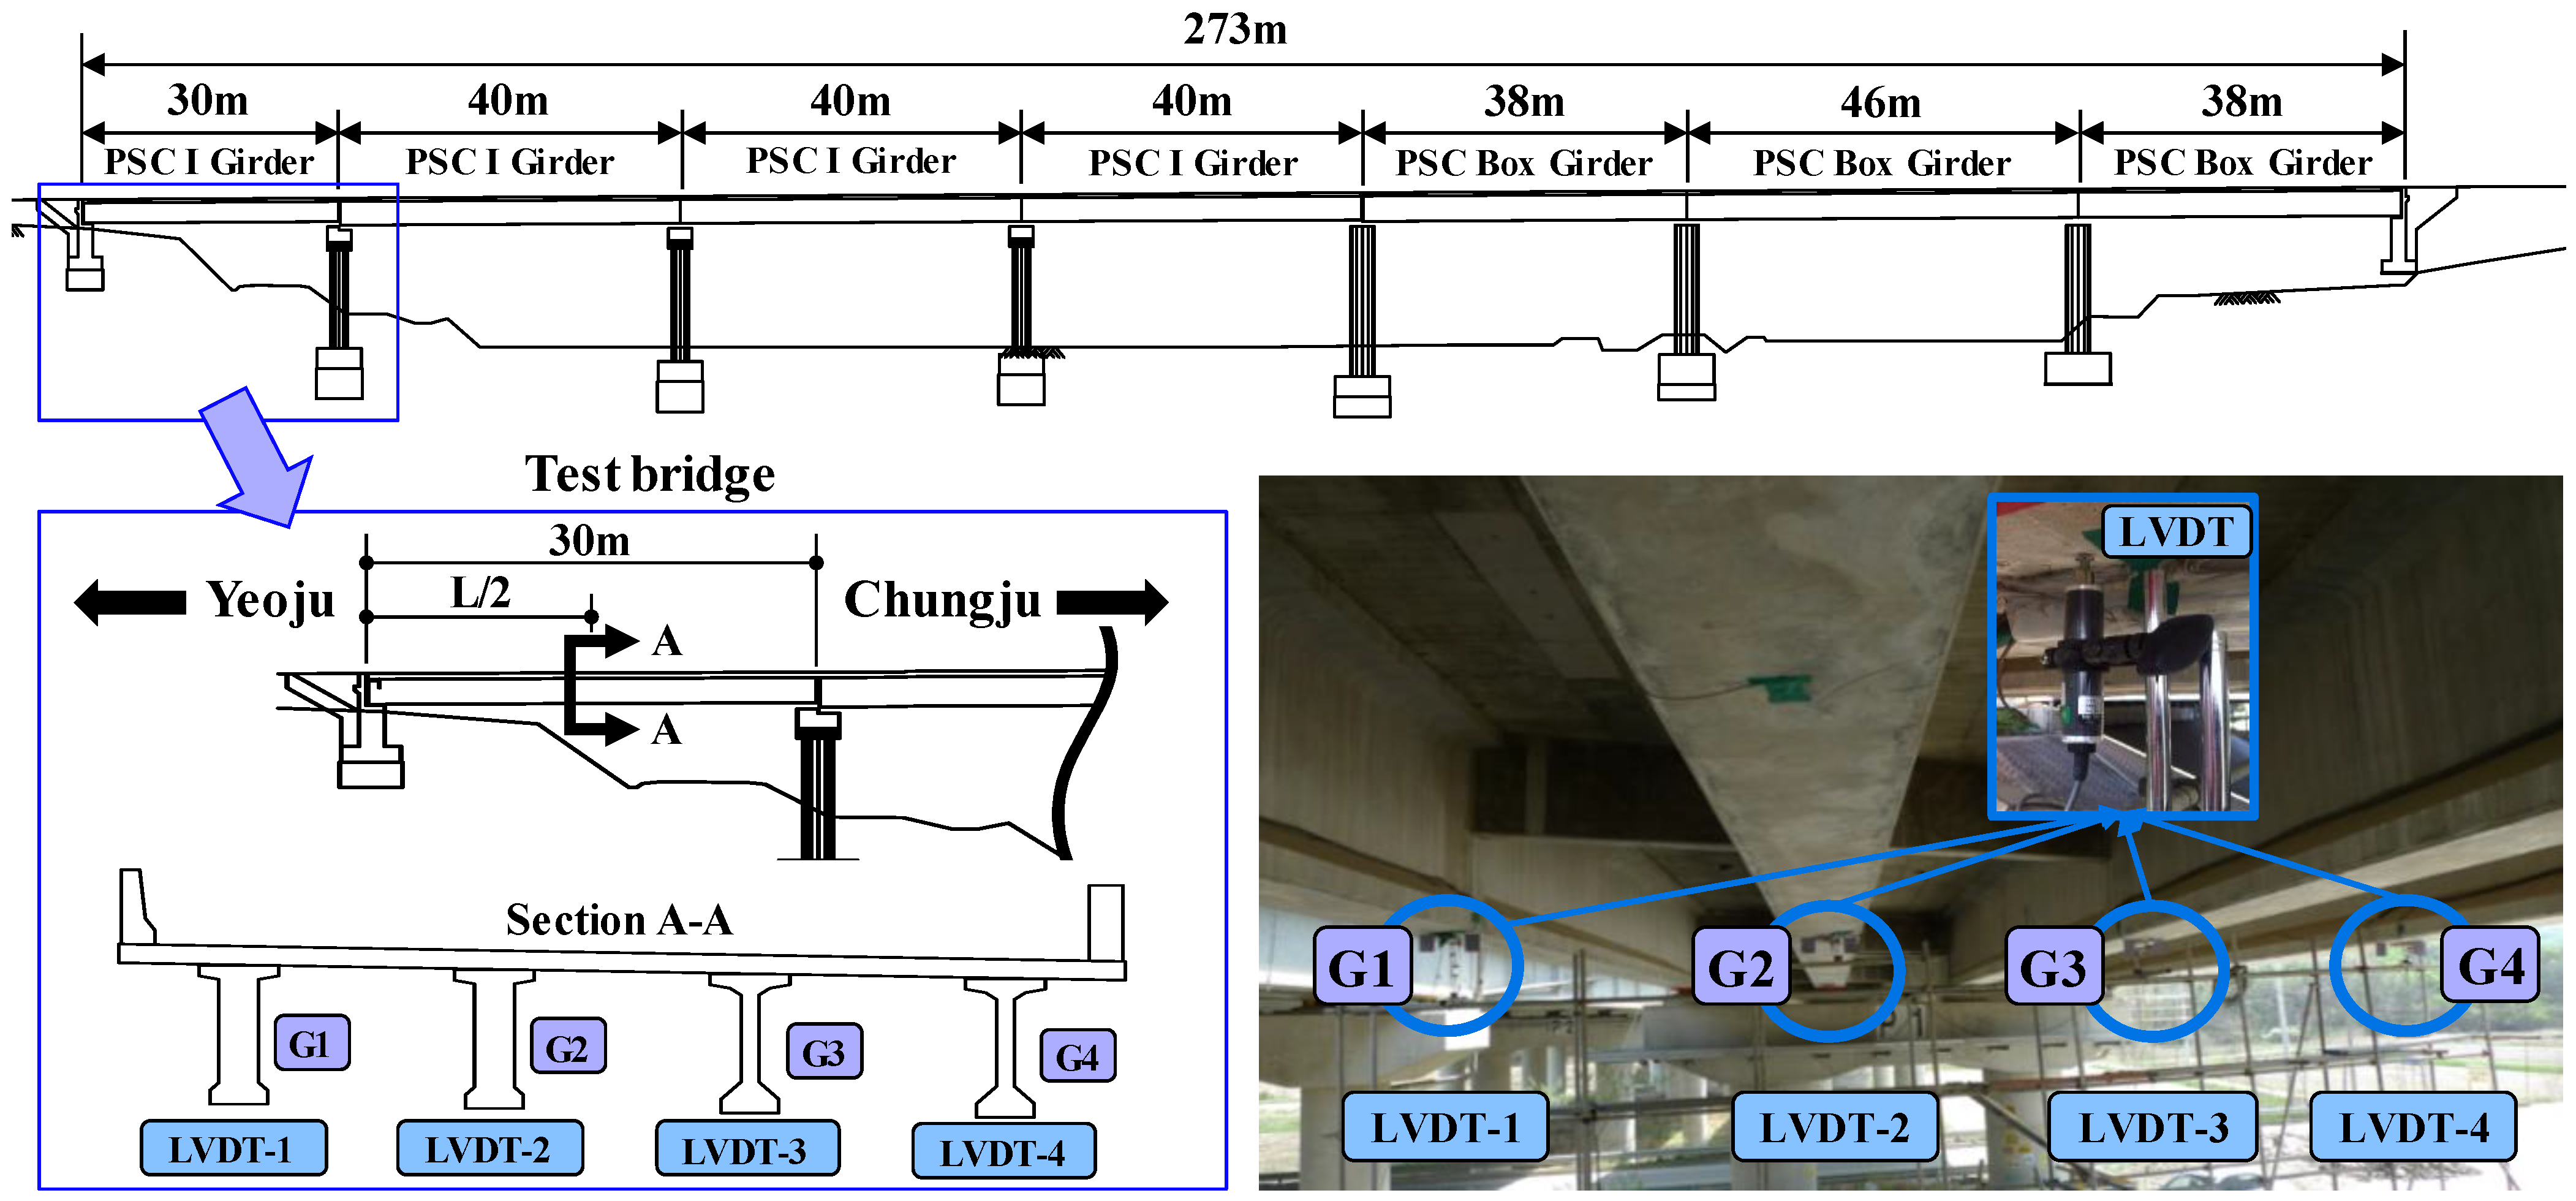
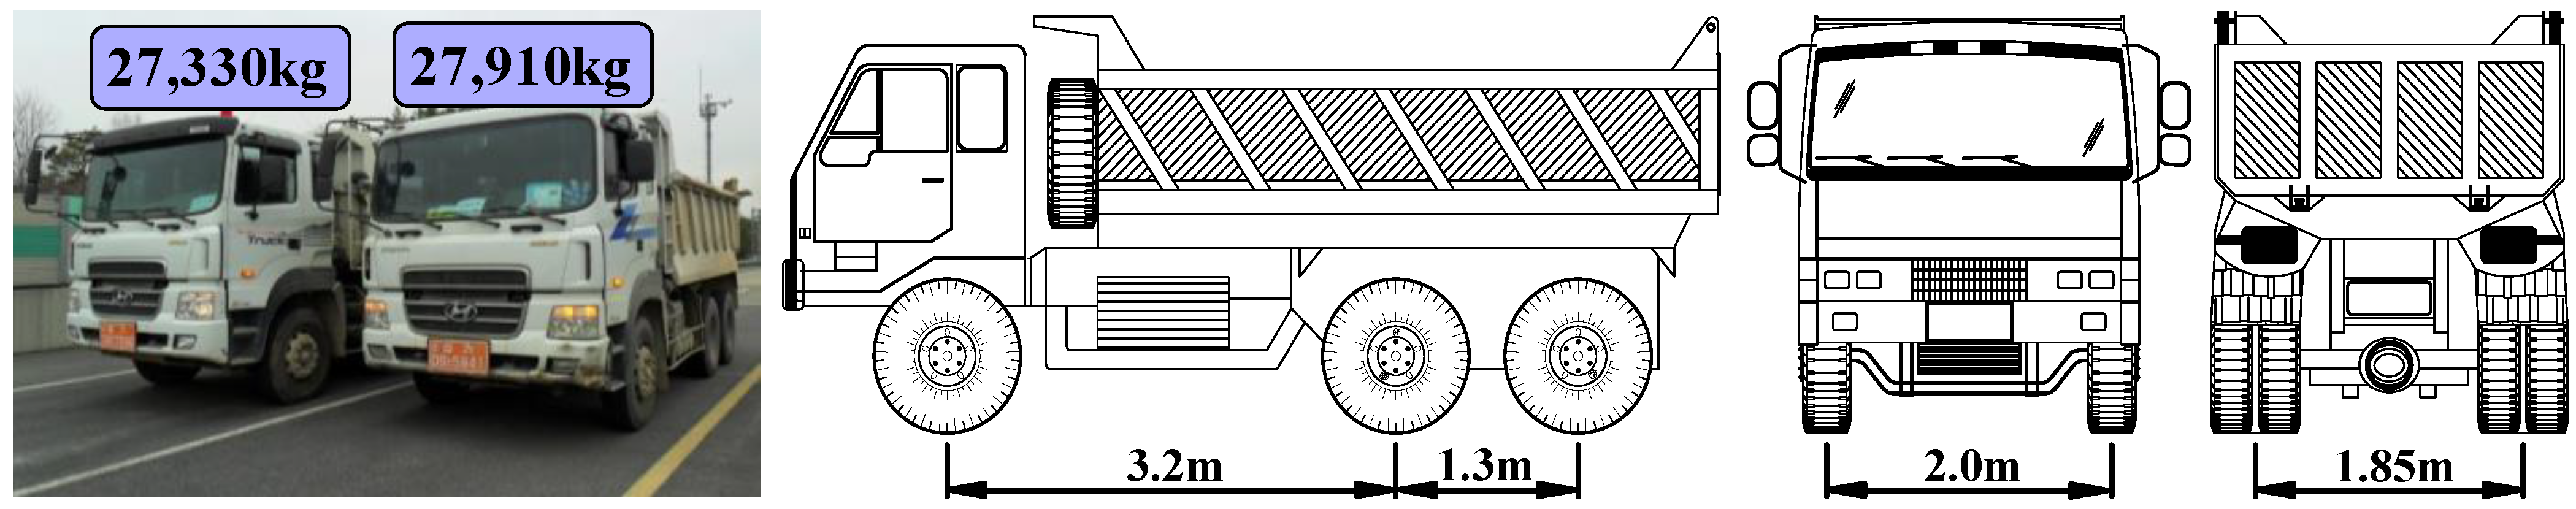
3.1. Experimental Setup

In this study, the vehicle loading test was conducted at Geumdang Bridge as shown in Figure 3. The bridge is in Yeoju, Gyeonggi-do, South Korea, and the test sought to verify the method of estimating the LLDF of a bridge using traveling vehicles. The bridge is specifically located on the Jungbunaeryuk Expressway and consists of 7-span PSC I girder and box girder bridges with a width of 12.6 m, a skew of 15 degrees, and a total length of 273 m. The vehicle loading test was conducted in the single-span 30 m section with two lanes composed of four PSC I girders as shown in Figure 3. The concrete of the PSC I girder had a strength of 70 MPa, while the slab had a strength of 35 MPa.
In the vehicle loading test, the displacement response was measured using linear variable differential transformers (LVDTs) that were installed on four girders (G1 to G4) at the center of the L/2 point as shown in Figure 4. Since the first natural frequency of Geumdang Bridge was 3.50 Hz, the data acquisition speed of the LVDTs was set at 100 Hz to collect more than 20 units of data in one period.
Figure 5 shows the specifications of the vehicles used in the vehicle loading test. Two 15-ton dump trucks loaded with stones were used. Table 1 shows the weight of the vehicles. Vehicle 1 weighed 27.33 tons, while vehicle 2 weighed 27.91 tons.

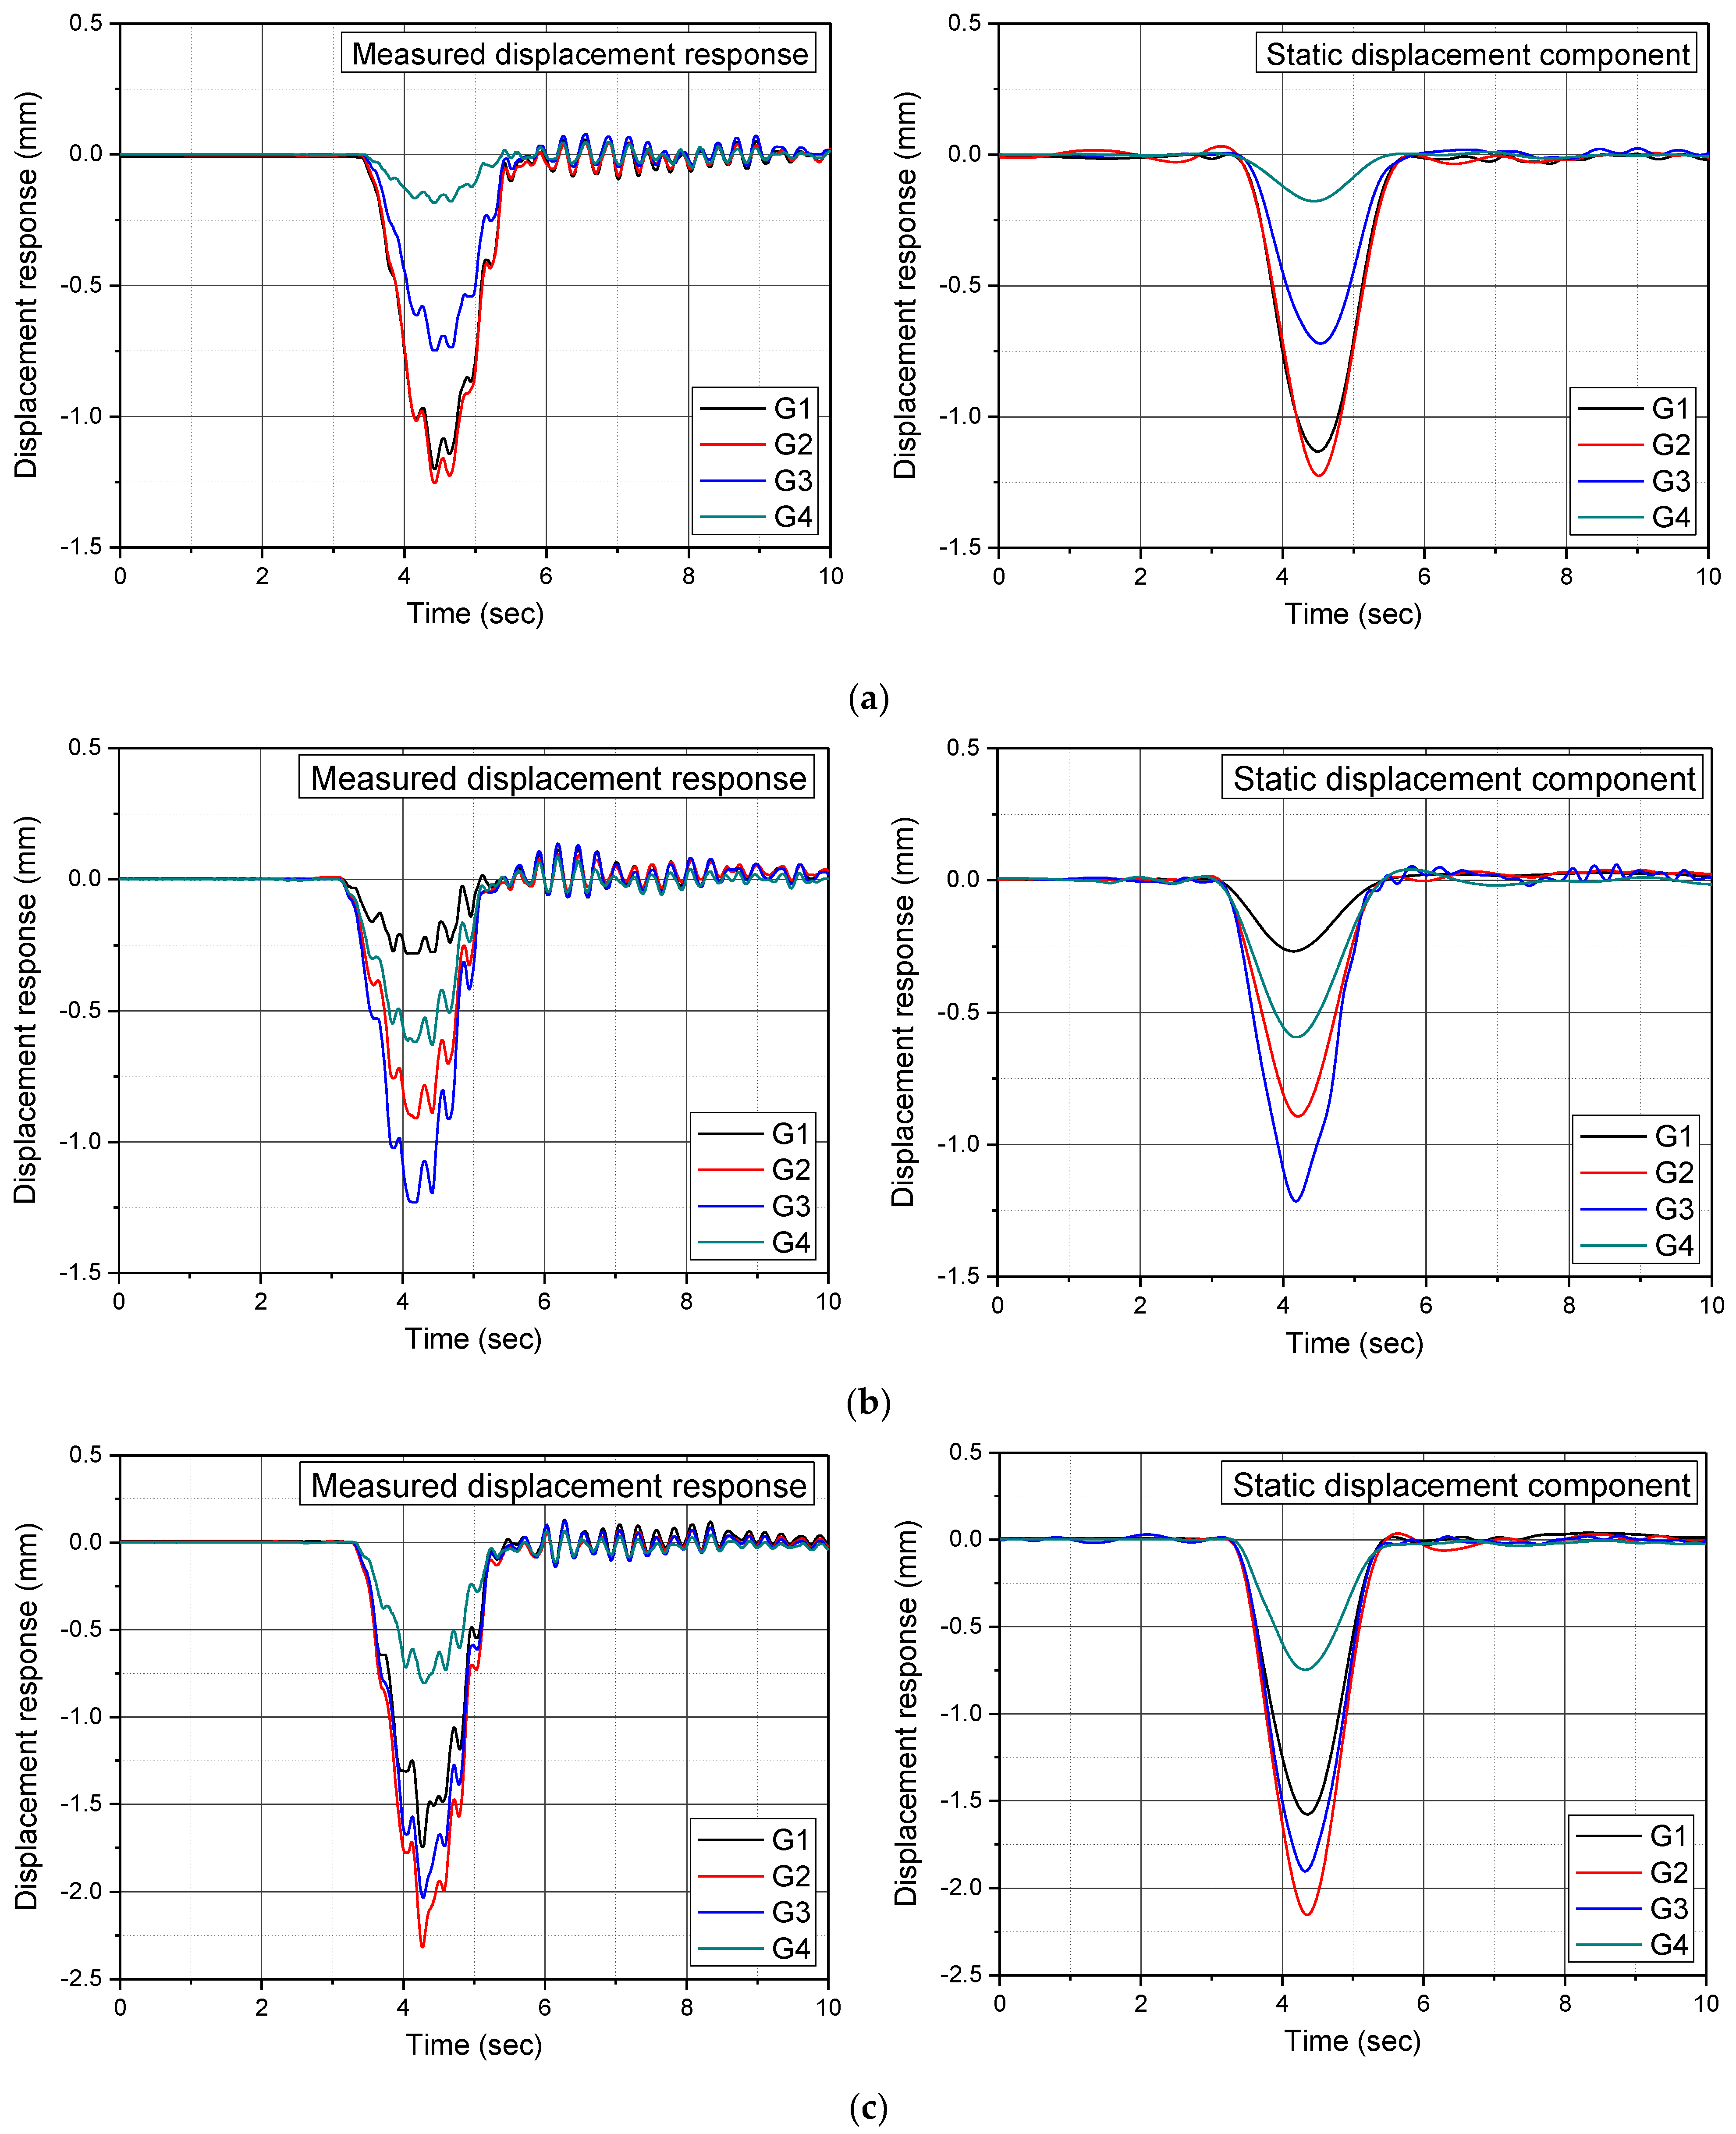
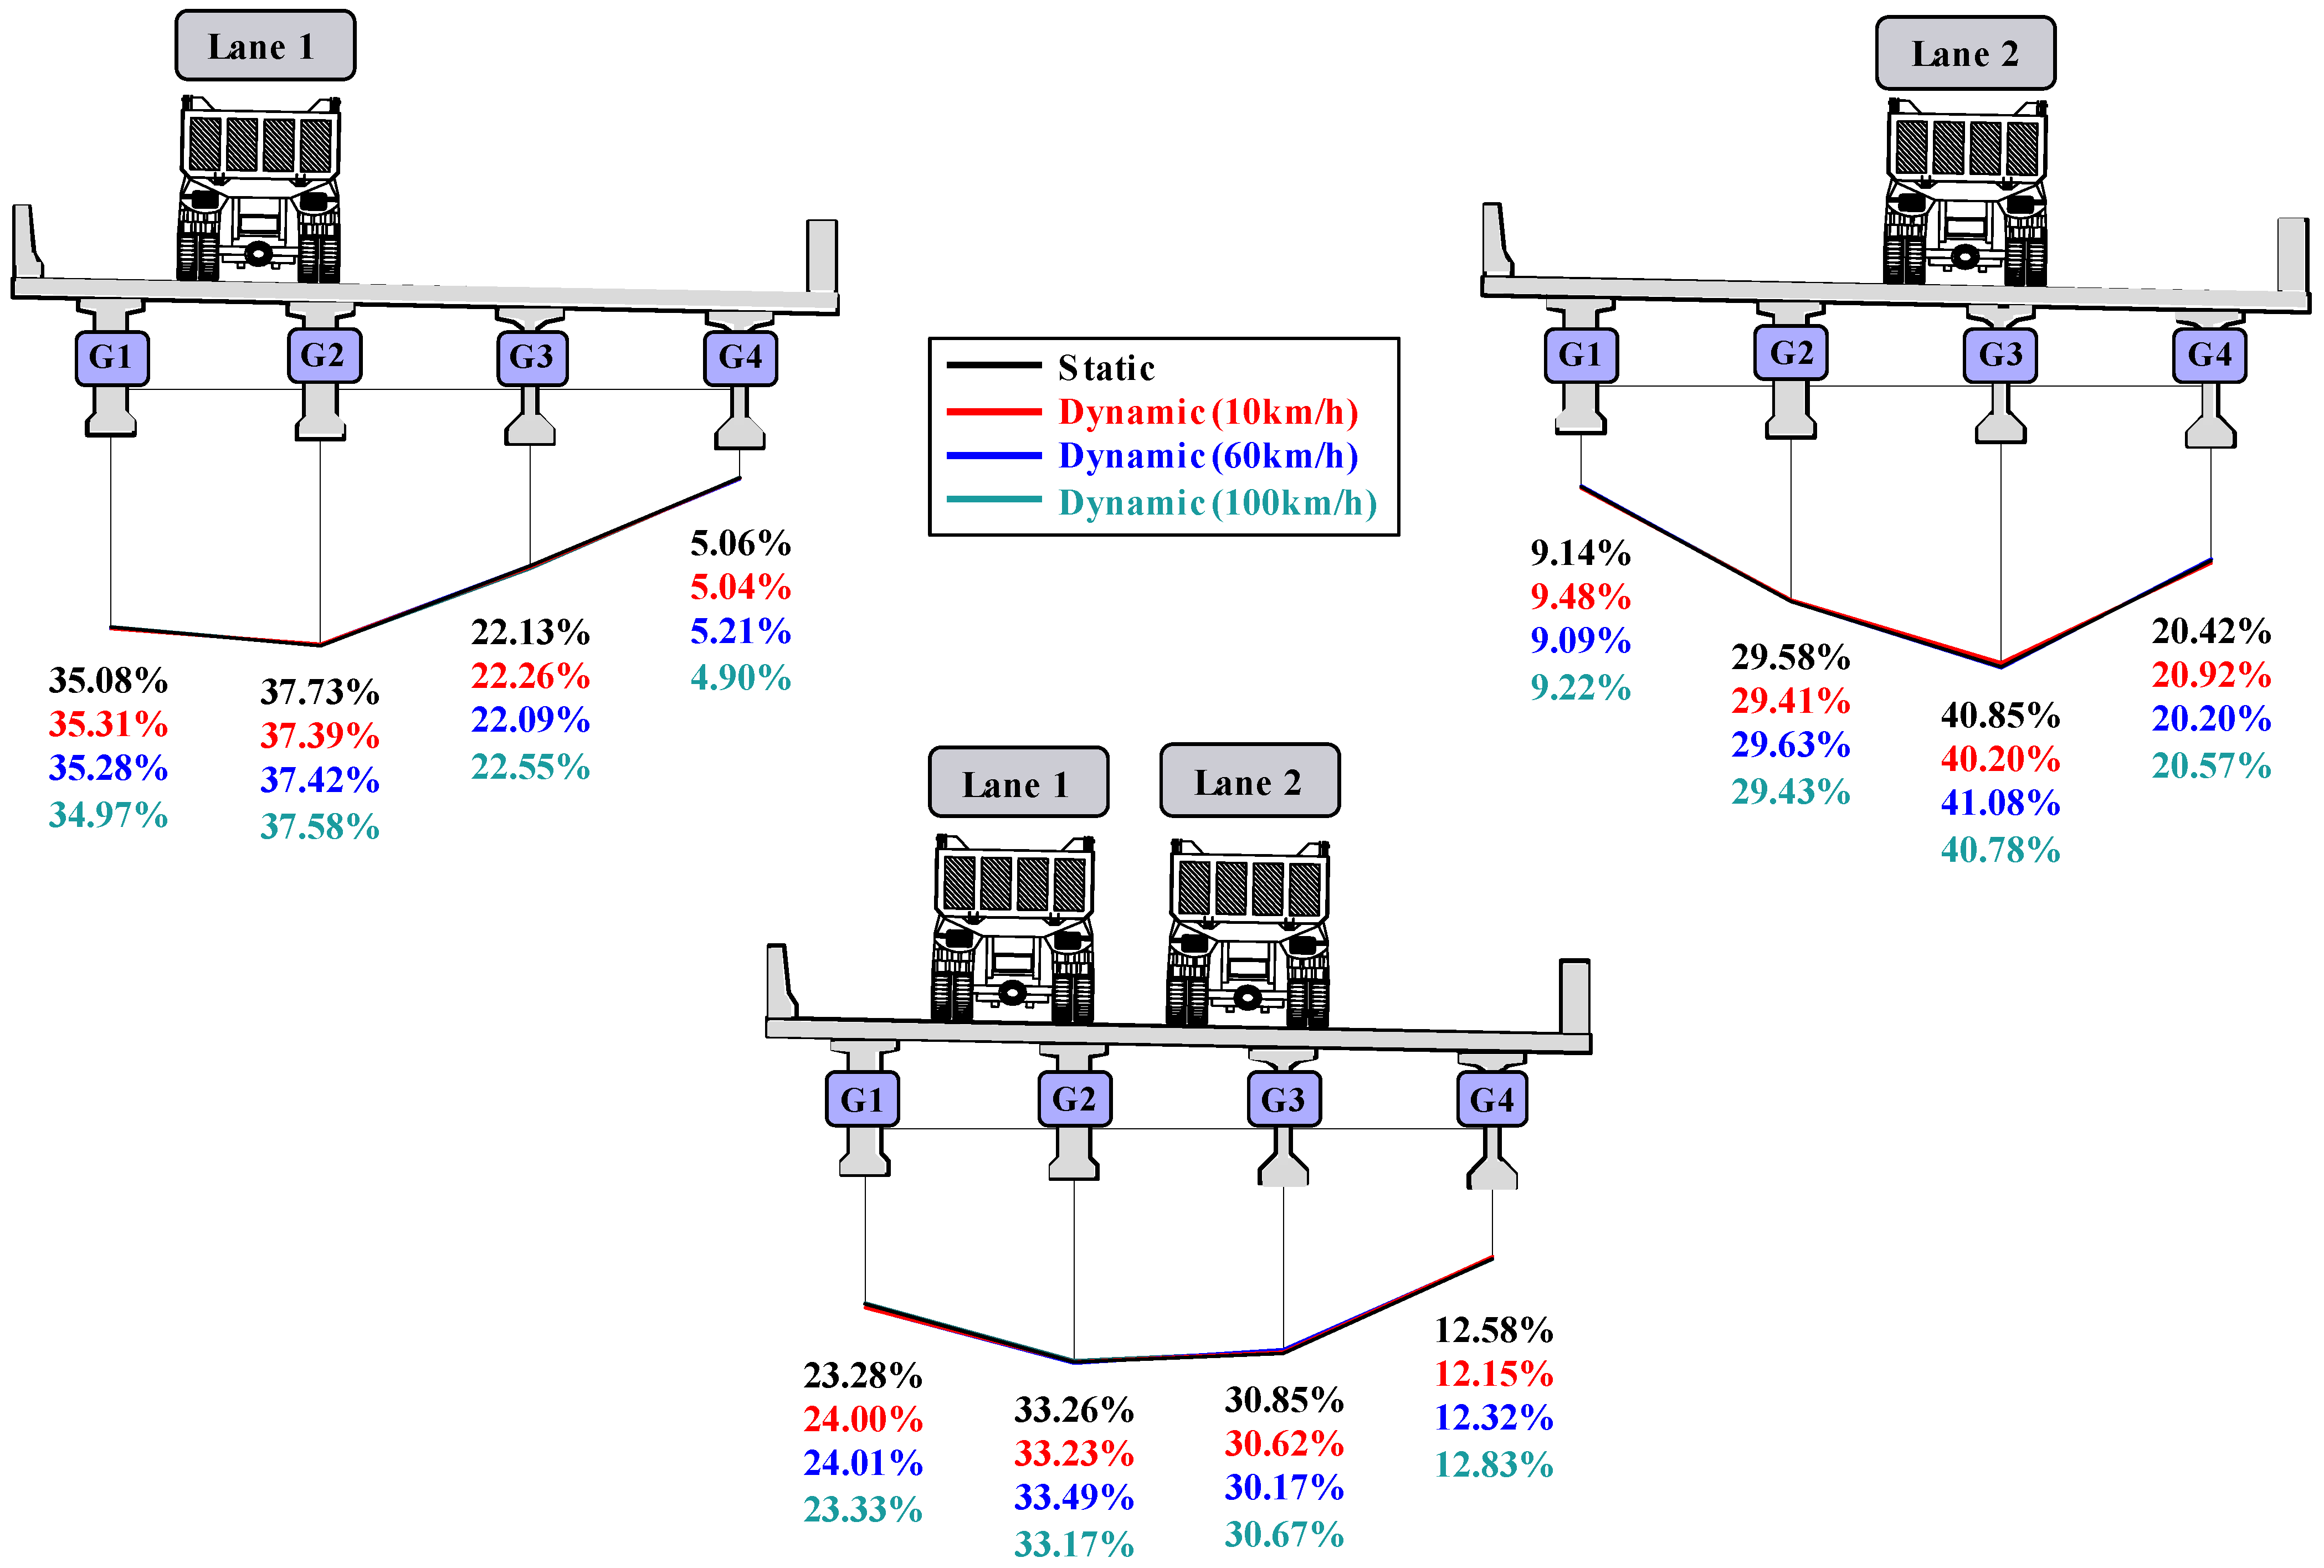
3.2. Vehicle Loading Test

The static loading test is currently used in measuring LLDF. In this study, the dynamic loading test was conducted to examine the possibility of estimating LLDF using the displacement response of traveling vehicles. In addition, the vehicles traveled at 10, 60, and 100 km/h to identify the difference in LLDF depending on the vehicle velocity in the dynamic loading test, and the results were compared with the LLDF measured in the static loading test. Each load case (LC) of the vehicle loading test is shown in Table 2. The static loading test was conducted in LC1, LC5, and LC9 and the dynamic loading test in the remaining LCs. Figure 6 shows the positions of the vehicles in the static and dynamic loading tests. Loading was applied on lane 1, lane 2, and both lanes 1 and 2. In the dynamic loading test, the vehicles passed the same positions as in the static loading test.
To reduce the error in the LLDF measured in the vehicle loading test, the test was repeated three times in each LC and the average was used as a representative value. Figure 7 shows the displacement response measured using the LVDTs from the dynamic loading test when the vehicle velocity was 60 km/h. The displacement response of the static component was extracted using EMD.
Table 3 shows the maximum displacement of the static component extracted using EMD. Maximum displacement occurred at G2 for loading on lane 1, at G3 for loading on lane 2, and at G3 for loading on lanes 1 and 2. In the dynamic loading test results shown in Table 3, displacement of the static component that represents the stiffness of the bridge decreased as the vehicle velocity increased, confirming the increase in displacement of the high-frequency component caused by the interaction between the bridge and the vehicles. Figure 8 compares the LLDFsta measured in the static loading test with the LLDFdyn measured in each LC in the dynamic loading test according to the vehicle velocity.
e r r o r = LLDF d y n LLDF s t a LLDF s t a
Figure 9 shows the error between the LLDFdyn measured in the dynamic loading test and the LLDFsta measured in the static loading test obtained using Equation (7). LLDFsta can be regarded as an accurate value that represents a bridge’s structural stiffness characteristics. As shown in Figure 9, an error between 0.12% and 4.40% based on the static loading test can be seen in each LC. LLDFdyn was found to have excellent reliability because the error was less than 5%. The results of the dynamic loading test showed no significant difference in LLDF depending on the vehicle velocity. It was also confirmed that it is possible to estimate LLDF using the static component of the displacement response of traveling vehicles.

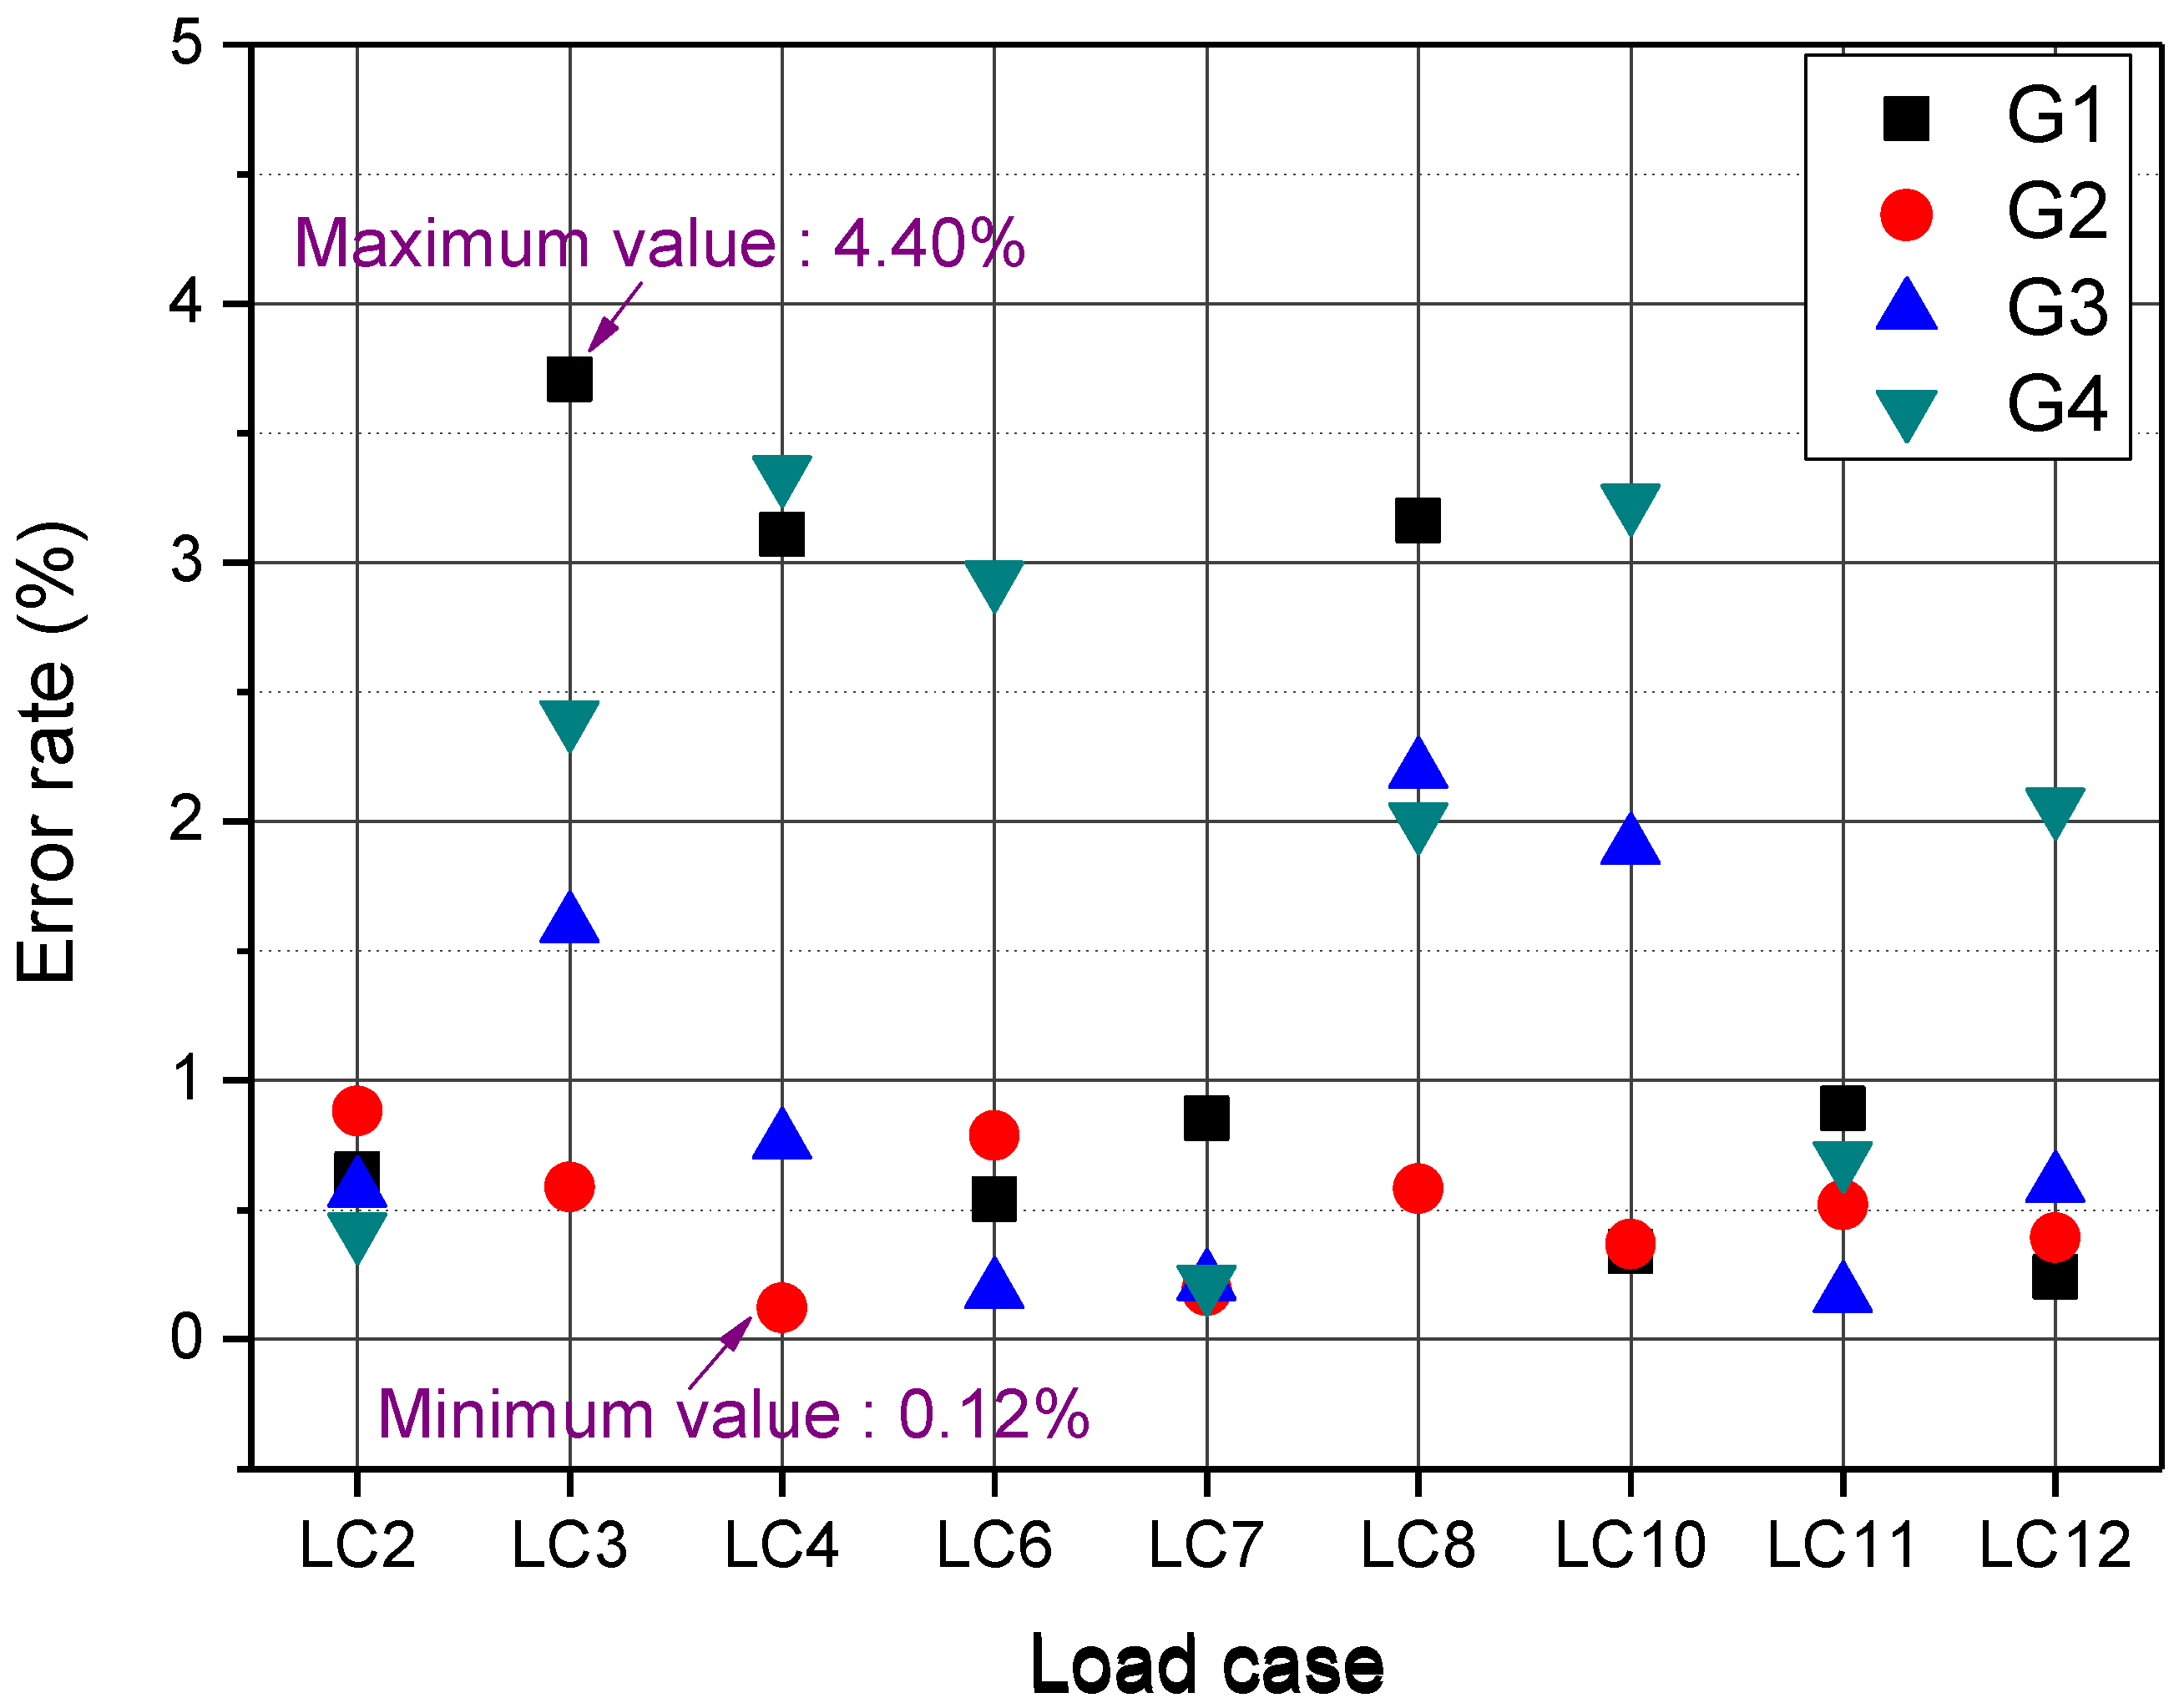
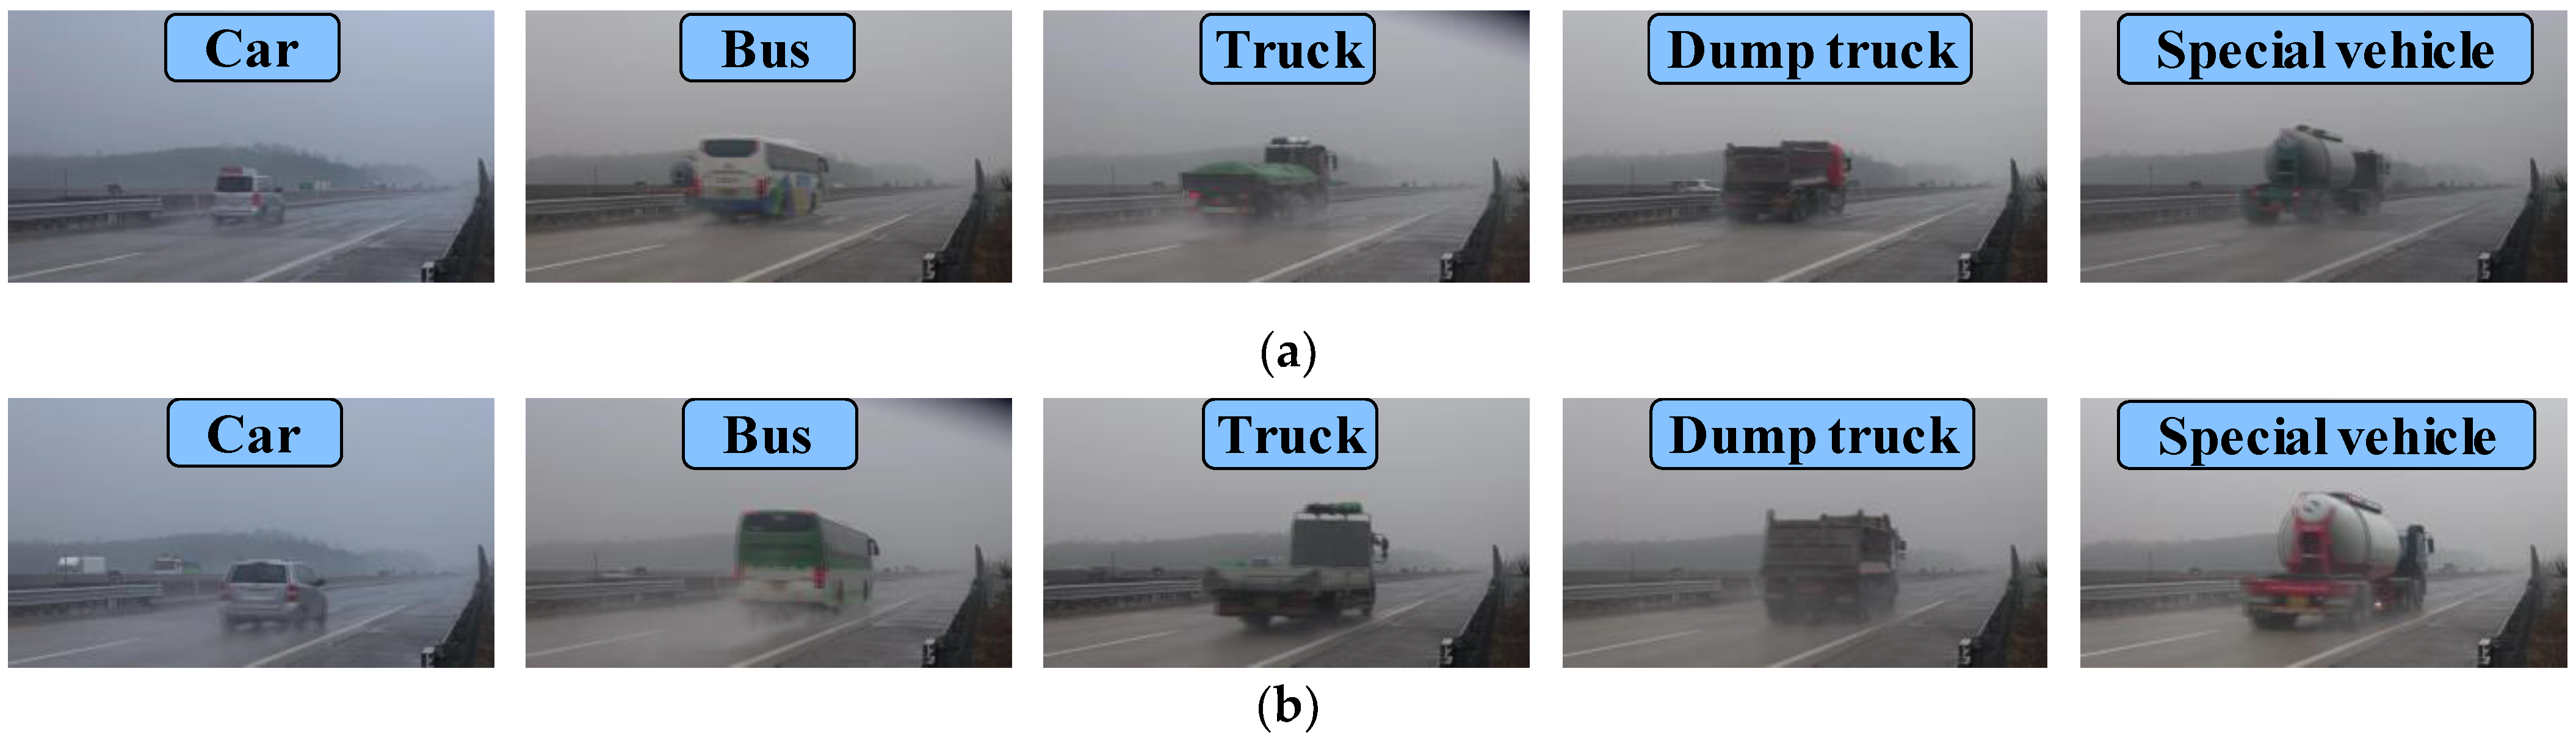
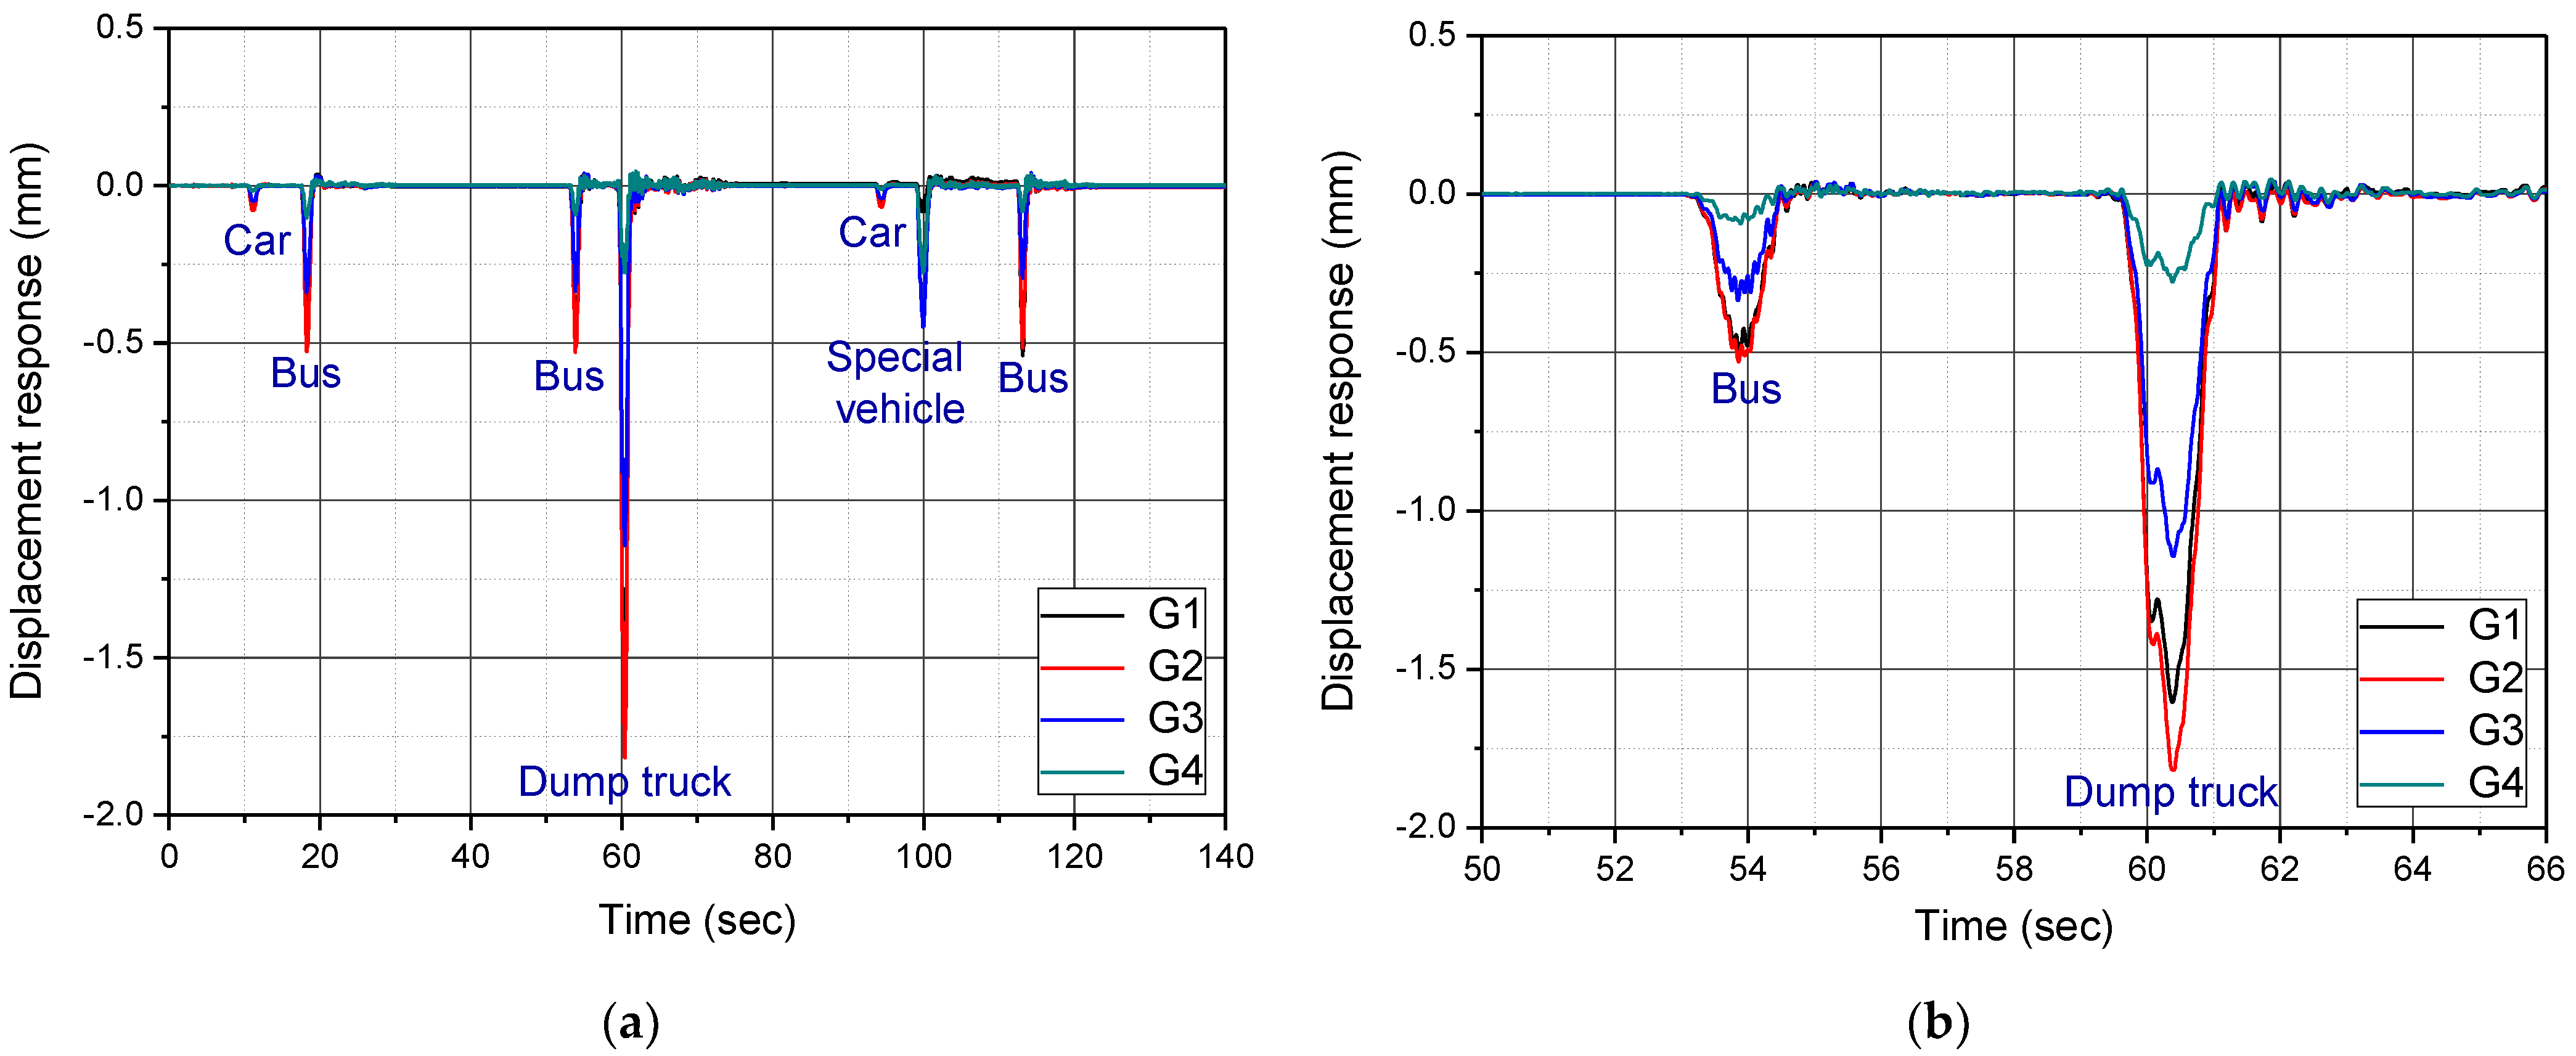
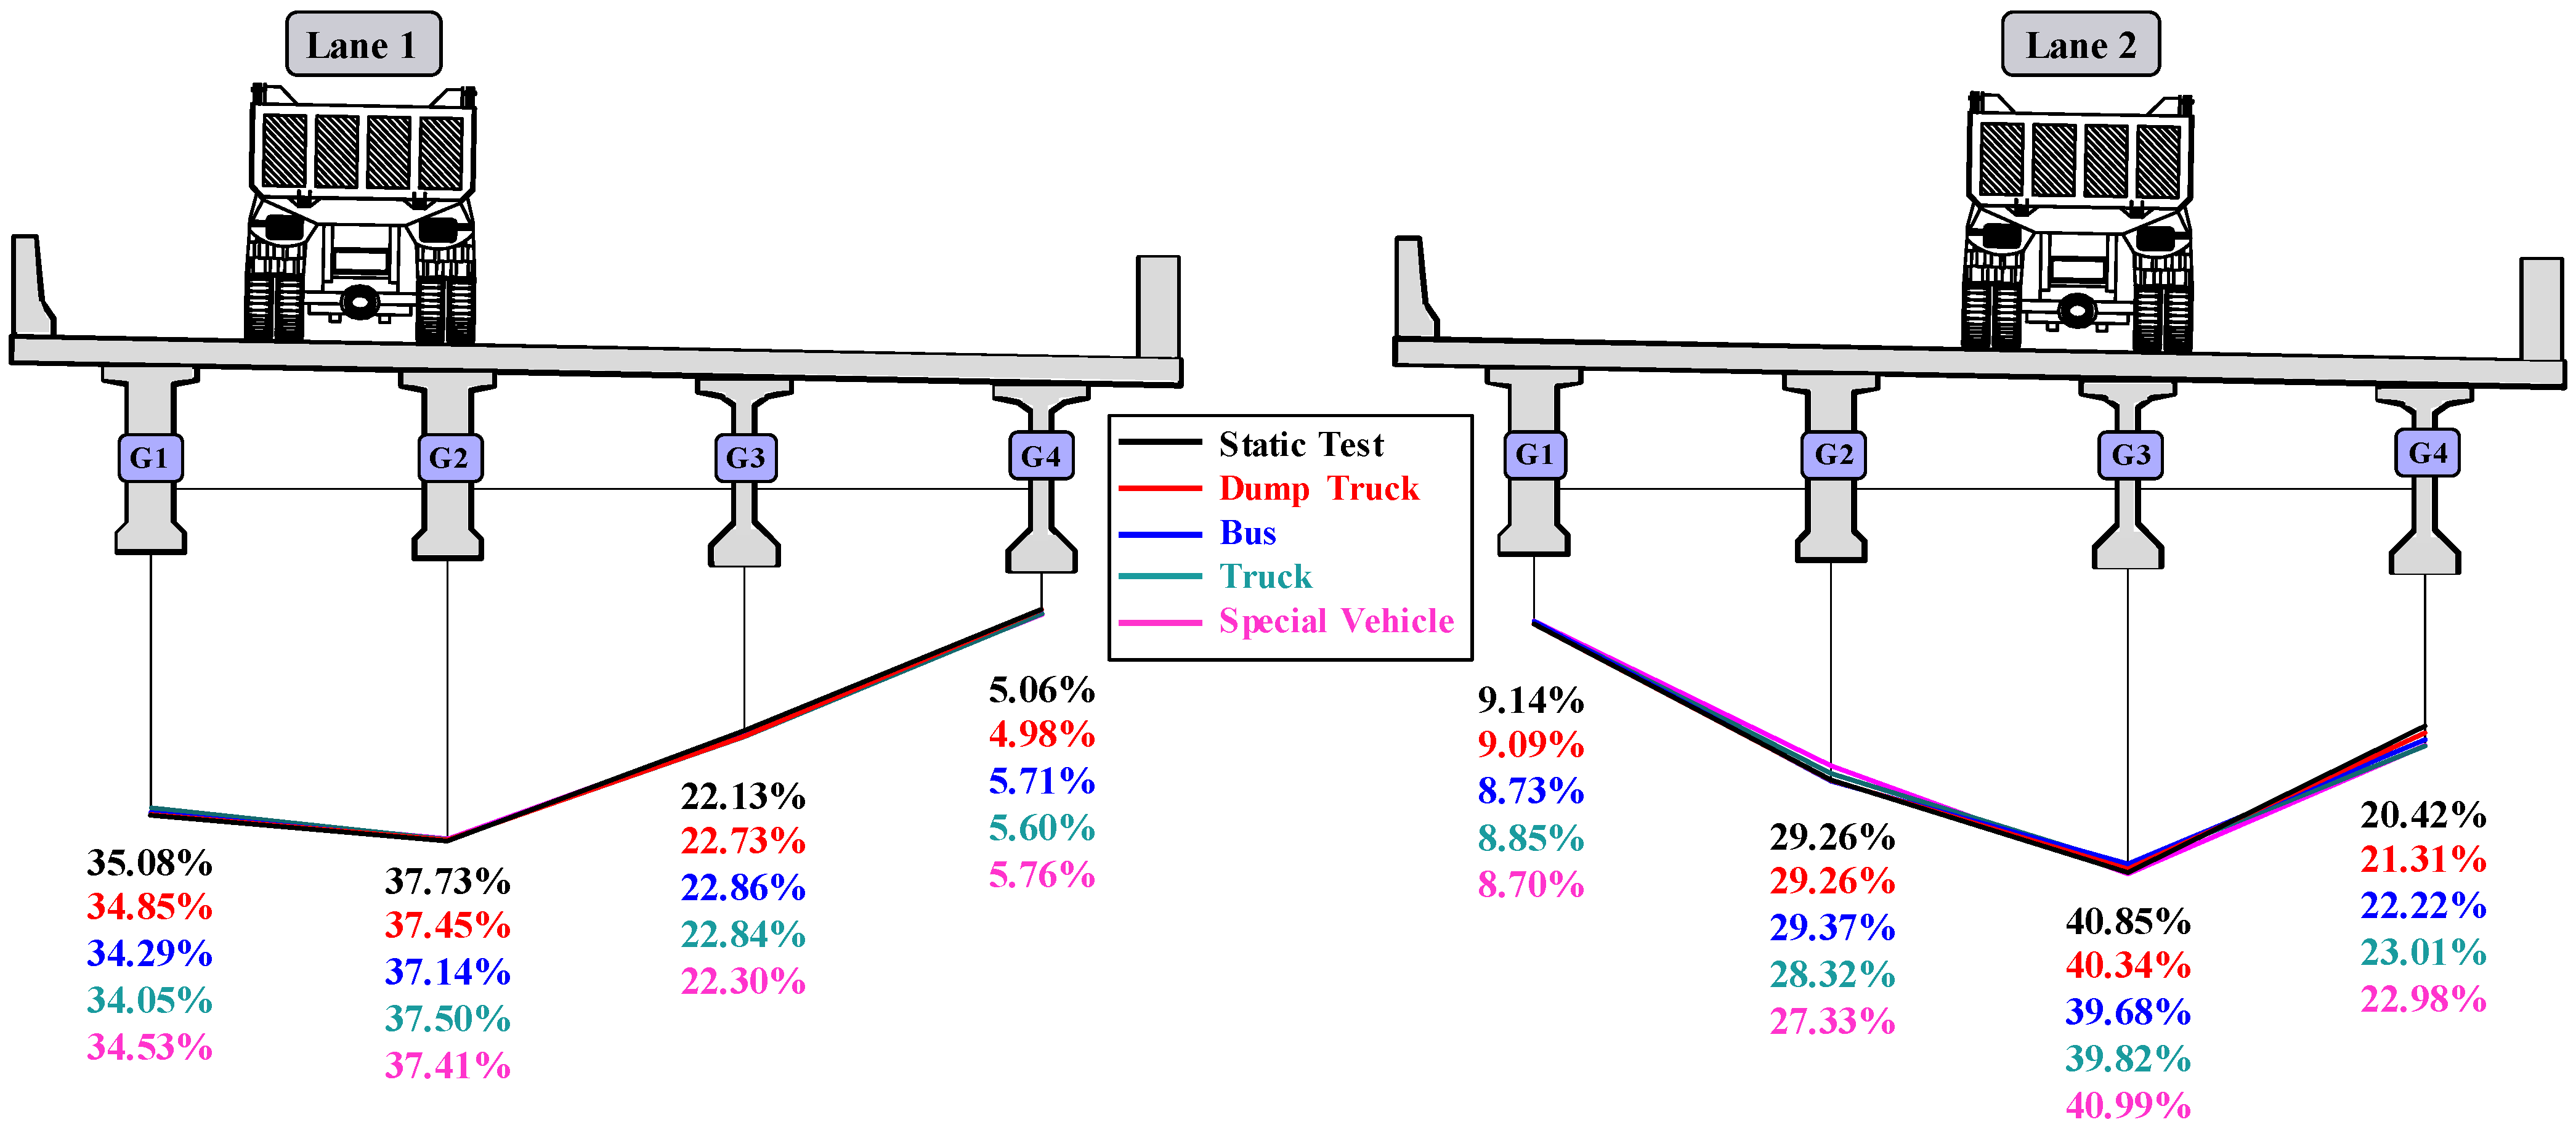
4. Estimation of LLDF in the Ambient Vibration Test

In general, a vehicle loading test is conducted to measure the LLDF of a bridge. It is difficult, however, to conduct the test on bridges where there is heavy traffic because traffic control is required. Therefore, if LLDF estimation is possible under ambient vibration conditions, it will be efficient and economical because LLDF can be estimated at bridges where traffic control is impossible.
The ambient vibration test was conducted to examine the possibility of estimating the LLDF of a bridge where vehicles with unknown weight are traveling. In the test, LVDTs were attached in the same manner as in the vehicle loading test. A camcorder was installed on the roadside to identify vehicle types and driving lanes in the ambient vibration test. The measured responses were also classified according to the vehicle type and lane by measuring the camcorder and LVDTs at the same time. The ambient vibration test was conducted for three hours. Table 4 shows the vehicle types that passed the bridge and their driving lanes in the test.
Figure 10 shows the images of the representative vehicles captured using the camcorder installed on the roadside in the ambient vibration test. The vehicles were classified as cars, buses, trucks, dump trucks, and special vehicles. Figure 11 shows the displacement response measured in a certain section. When small vehicles, such as cars, passed the bridge in the ambient vibration test, they were excluded from the estimation of LLDF because a deflection of less than 0.2 mm occurred. The LLDF of the bridge was estimated using heavy vehicles that caused significant vertical displacement. To prevent errors in the LLDF estimation, two or more vehicles travelling on the bridge almost at the same time were excluded. LLDF was estimated when a heavy vehicle passed the bridge in one lane, and four vehicle types (bus, truck, dump truck, and special vehicle) were considered. Table 5 shows the number of the vehicles used to estimate LLDF.
Table 6 shows the average maximum displacement of the static component extracted from the displacement response measured for each vehicle type and lane in the ambient vibration test. When vehicles travelled in lane 1, the maximum displacement occurred at G2 and ranged from −0.52 to −1.73 mm. In lane 2, the maximum displacement occurred at G3 and ranged from −0.50 to −1.42 mm. Dump trucks exhibited the largest displacement, while buses yielded the smallest displacement.
Figure 12 shows the average LLDF estimated for each vehicle type and lane, and the result was compared with the LLDF measured in the static loading test. To verify the accuracy of the LLDF measured in the ambient vibration test, the error based on the LLDFsta measured in the static loading test is shown in Figure 13. As can be seen in the figure, when a dump truck passed the bridge, the average error was less than 3% in lane 1 and less than 5% in lane 2. Vehicles other than dump trucks mostly produced LLDF with a large error. In this case, accurate estimation was found to be difficult because the displacement of the bridge was relatively small. The LLDF of a large vehicle, such as a dump truck, however, was found to be similar to the LLDF measured in the static loading test regardless of the loading position and specifications of the vehicle. This indicated that the response of dump trucks, which are large vehicles, must be utilized to increase the accuracy of LLDF from the data measured in the ambient vibration test. Therefore, the LLDF of a bridge in use can be estimated under ambient vibration conditions without traffic control, if the vehicle type and driving lane are identified and the vertical displacement response can be measured.

5. Conclusions

With an increasing number of old bridges in use, more bridges require maintenance and the process of measuring the live load distribution factor (LLDF) to examine bridge integrity has become even more important. A static loading test has been conducted to measure LLDF. This test, however, interferes with traffic flow as it requires traffic control. When traffic control is impossible, measuring LLDF becomes very difficult. To address these problems, a method of estimating LLDF using an ambient vibration test was proposed in this study.
The displacement response measured in the ambient vibration test includes signals of different frequencies. The static component that represents the displacement under vehicle loads is the low-frequency component, while the dynamic component is mostly the high-frequency vibration caused by the interaction between the bridge and vehicles. The displacement response of the static component required to measure LLDF was consequently extracted using empirical mode decomposition (EMD).
To verify the validity of the proposed method, static and dynamic loading tests were conducted and their results compared. Vehicle velocity was also varied to examine the difference in LLDF depending on the vehicle velocity in the dynamic loading test. The LLDFdyn measured in the dynamic loading test exhibited excellent reliability as it showed a low error rate from the LLDFsta measured in the static loading test. There was no significant difference in LLDF depending on vehicle velocity, and the dynamic loading test results verified the validity of the proposed method.
In the ambient vibration test, vehicles other than dump trucks exhibited LLDF with a somewhat large error. In this case, accurate estimation was difficult because of the small displacement response of the bridge caused by traveling vehicles. The LLDF of a dump truck, however, was similar to the LLDFsta measured in the static loading test regardless of the vehicle specifications. Therefore, utilizing the response of dump trucks was considered reasonable in estimating LLDF with high accuracy from the data measured in the ambient vibration test.
The proposed method can be used when it is necessary to estimate the LLDF of a bridge where traffic control is difficult since it can economically estimate LLDF without requiring traffic control under ambient vibration.

Author Contributions

Conceptualization, S.-W.K., D.-U.P. and S.-J.C.; Experimental test, S.-W.K., D.-U.P. and S.-J.C., Methodology, S.-W.K., S.-J.C. and J.-B.P.; Software, S.-W.K., S.-J.C. and J.-B.P.; Validation, S.-W.K., S.-J.C. and J.-B.P.; Visualization, S.-W.K., D.-W.Y. and S.-J.C.; Investigation, S.-W.K., D.-W.Y., D.-U.P., S.-J.C. and J.-B.P.; Writing-original draft, S.-W.K. and S.-J.C.; Writing—review and editing, S.-W.K. and S.-J.C.; Funding acquisition, S.-W.K. All authors have read and agreed to the published version of the manuscript.

Funding

This work was supported by the National Research Foundation of Korea (NRF) grant funded by the Korea government (MSIT) (No. 2021R1A2C1012093). Moreover, the authors would like to thank the KOCED Seismic Research and Test Center for their assistance.

Institutional Review Board Statement

Not applicable.

Informed Consent Statement

Not applicable.

Data Availability Statement

Not applicable.

Conflicts of Interest

The authors declare no conflict of interest.

References

  1. Srinivas, V.; Sasmal, S.; Banjara, N.K.; Ramanjaneyulu, K.; Iyer, N.R. Health assessment of a plate girder railway bridge under increased axle loads. J. Bridge Eng. 2013, 18, 969–979. [Google Scholar] [CrossRef]
  2. Jang, S.; Li, J.; Spencer, B.F. Corrosion estimation of a historic truss bridge using model updating. J. Bridge Eng. 2013, 18, 678–689. [Google Scholar] [CrossRef]
  3. Bayaraktar, A.; Altunişik, A.C.; Türker, T. Structural health assessment and restoration procedure of an old riveted steel arch bridge. Soil Dyn. Earthq. Eng. 2016, 83, 148–161. [Google Scholar] [CrossRef]
  4. Furinghetti, M.; Pavese, A.; Lunghi, F.; Silvestri, D. Strategies of Structural Health Monitoring for Bridges based on Cloud Computing. J. Civ. Struct. Health Monit. 2019, 9, 607–616. [Google Scholar] [CrossRef]
  5. Mehrani, E.; Ayoub, A.; Ayoub, A. Evaluation of fiber optic sensors for remote health monitoring of bridge structures. Mater. Struct./Mater. Constr. 2009, 42, 183–199. [Google Scholar] [CrossRef]
  6. Liu, M.; Frangopol, D.M.; Kim, S. Bridge safety evaluation based on monitored live load effects. J. Bridge Eng. 2009, 14, 257–269. [Google Scholar] [CrossRef]
  7. Sanayei, M.; Phelps, J.E.; Sipple, J.D.; Bell, E.S.; Brenner, B.R. Instrumentation, nondestructive testing, and finite-element model updating for bridge evaluation using strain measurements. J. Bridge Eng. 2012, 17, 130–138. [Google Scholar] [CrossRef] [Green Version]
  8. Kim, S.W.; Jeon, B.G.; Kim, N.S.; Park, J.C. Vision-based monitoring system for evaluating cable tensile forces on a cable-stayed bridge. Struct. Health Monit. 2013, 12, 440–456. [Google Scholar] [CrossRef]
  9. Kim, S.W.; Jeon, B.G.; Cheung, J.H.; Kim, S.D.; Park, J.B. Stay cable tension estimation using a vision-based monitoring system under various weather conditions. J. Civ. Struct. Health Monit. 2017, 7, 343–357. [Google Scholar] [CrossRef]
  10. Clemente, P.; Bongiovanni, G.; Buffarini, G.; Saitta, F. Structural health status assessment of a cable-stayed bridge by means of experimental vibration analysis. J. Civ. Struct. Health Monit. 2019, 9, 655–669. [Google Scholar] [CrossRef]
  11. Vazquez, B.G.E.; Gaxiola-Camacho, J.R.; Bennett, R.; Guzman-Acevedo, G.M.; Gaxiola-Camacho, I.E. Structural evaluation of dynamic and semi-static displacements of the Juarez Bridge using GPS technology. Meas. J. Int. Meas. Confed. 2017, 110, 146–153. [Google Scholar] [CrossRef]
  12. Atesi, S.; Miri, A.; Jahangiri, M. Assessment of load carrying capacity enhancement of an open spandrel masonry arch bridge by dynamic load testing. Int. J. Archit. Herit. 2017, 11, 1086–1100. [Google Scholar]
  13. Gocál, J.; Odrobiňák, J. On the influence of corrosion on the load-carrying capacity of old riveted bridges. Materials 2020, 13, 717. [Google Scholar] [CrossRef] [Green Version]
  14. Wang, X.; Mao, X.; Frangopol, D.M.; Dong, Y.; Wang, H.; Tao, P.; Qi, Z.; Tang, S. Full-scale experimental and numerical investigation on the ductility, plastic redistribution, and redundancy of deteriorated concrete bridges. Eng. Struct. 2021, 234, 111930. [Google Scholar] [CrossRef]
  15. Olaszek, P.; Łagoda, M.; Casas, J.R. Diagnostic load testing and assessment of existing bridges: Examples of application. Struct. Infrastruct. Eng. 2014, 10, 834–842. [Google Scholar] [CrossRef]
  16. Dong, C.; Bas, S.; Debees, M.; Alver, N.; Catbas, F.N. Bridge load testing for identifying live load distribution, load rating, serviceability and dynamic response. Front. Built Environ. 2020, 6, 46. [Google Scholar] [CrossRef]
  17. Sun, Z.; Siringoringo, D.M.; Fujino, Y. Load-carrying capacity evaluation of girder bridge using moving vehicle. Eng. Struct. 2021, 229, 111645. [Google Scholar] [CrossRef]
  18. Harris, D.K. Assessment of flexural lateral load distribution methodologies for stringer bridges. Eng. Struct. 2010, 32, 3443–3451. [Google Scholar] [CrossRef]
  19. Seo, J.; Phares, B.; Wipf, T.J. Lateral live-load distribution characteristics of simply supported steel girder bridges loaded with implements of husbandry. J. Bridge Eng. 2014, 19, 04013021. [Google Scholar] [CrossRef]
  20. Ravazdezh, F.; Seok, S.; Haikal, G.; Ramirez, J.A. Effect of nonstructural elements on lateral load distribution and rating of slab and T-beam bridges. J. Bridge Eng. 2021, 26, 04021063. [Google Scholar] [CrossRef]
  21. Malveiro, J.; Ribeiro, D.; Sousa, C.; Calçada, R. Model updating of a dynamic model of a composite steel-concrete railway viaduct based on experimental tests. Eng. Struct. 2018, 164, 40–52. [Google Scholar] [CrossRef]
  22. Ferrari, R.; Froio, D.; Rizzi, E.; Gentile, C.; Chatzi, E.N. Model updating of a historic concrete bridge by sensitivity- and global optimization-based Latin Hypercube Sampling. Eng. Struct. 2019, 179, 139–160. [Google Scholar] [CrossRef]
  23. Kim, S.W.; Cheung, J.H.; Park, J.B.; Na, S.O. Image-based back analysis for tension estimation of suspension bridge hanger cables. Struct. Control. Health Monit. 2020, 27, e25083. [Google Scholar] [CrossRef]
  24. Xia, Z.; Li, A.; Li, J.; Shi, H.; Duan, M.; Zhou, G. Model updating of an existing bridge with high-dimensional variables using modified particle swarm optimization and ambient excitation data. Meas. J. Int. Meas. Confed. 2020, 159, 107754. [Google Scholar] [CrossRef]
  25. Svendsen, B.T.; Petersen, Ø.W.; Frøseth, G.T.; Rønnquist, A. Improved finite element model updating of a full-scale steel bridge using sensitivity analysis. Struct. Infrastruct. Eng. 2021, 1–17, ahead-of-print. [Google Scholar] [CrossRef]
  26. Jung, D.S.; Kim, C.Y. Finite element model updating on small-scale bridge model using the hybrid genetic algorithm. Struct. Infrastruct. Eng. 2013, 9, 481–495. [Google Scholar] [CrossRef]
  27. Jung, D.S.; Kim, C.Y. Finite element model updating of a simply supported skewed PSC I-girder bridge using Hybrid Genetic Algorithm. KSCE J. Civ. Eng. 2013, 17, 518–529. [Google Scholar] [CrossRef]
  28. Aloisio, A.; Alaggio, R.; Fragiacomo, M. Dynamic identification and model updating of full-scale concrete box girders based on the experimental torsional response. Constr. Build. Mater. 2020, 264, 120146. [Google Scholar] [CrossRef]
  29. Hasançebi, O.; Dumlupinar, T. Linear and nonlinear model updating of reinforced concrete T-beam bridges using artificial neural networks. Comput. Struct. 2013, 119, 1–11. [Google Scholar] [CrossRef]
  30. Kim, H.J.; Park, W.; Koh, H.M.; Choo, J.F. Identification of structural performance of a steel-box girder bridge using machine learning technique. In Proceedings of the IABSE Workshop on Assessment, Upgrading and Refurbishment of Infrastructures, Rotterdam, The Netherlands, 6–8 May 2013. [Google Scholar]
  31. Sanayei, M.; Khaloo, A.; Gul, M.; Necati Catbas, F. Automated finite element model updating of a scale bridge model using measured static and modal test data. Eng. Struct. 2015, 102, 66–79. [Google Scholar] [CrossRef]
  32. Hester, D.; Koo, K.; Xu, Y.; Brownjohn, J.; Bocian, M. Boundary condition focused finite element model updating for bridges. Eng. Struct. 2019, 198, 109514. [Google Scholar] [CrossRef]
  33. Tarhini, K.M.; Frederick, G.R. Wheel load distribution in I-girder highway bridges. J. Struct. Eng. (US) 1992, 118, 1285–1294. [Google Scholar] [CrossRef]
  34. Hodson, D.J.; Barr, P.J.; Halling, M.W. Live-load analysis of posttensioned box-girder bridges. J. Bridge Eng. 2012, 17, 644–651. [Google Scholar] [CrossRef]
  35. Kim, S.W.; Lee, S.S.; Kim, N.S.; Kim, D.J. Numerical model validation for a prestressed concrete girder bridge by using image signals. KSCE J. Civ. Eng. 2013, 17, 509–517. [Google Scholar] [CrossRef]
  36. Huseynov, F.; Brownjohn, J.M.W.; O’Brien, E.J.; Hester, D. Analysis of load test on composite I-girder bridge. J. Civ. Struct. Health Monit. 2017, 7, 163–173. [Google Scholar] [CrossRef] [Green Version]
  37. Zhao, Y.; Cao, X.; Zhou, Y.; Wang, G.; Tian, R. Lateral load distribution for hollow slab bridge: Field test investigation. Int. J. Concr. Struct. Mater. 2020, 14, 22. [Google Scholar] [CrossRef]
  38. Hughs, E.; Idriss, R. Live-load distribution factors for prestressed concrete, spread box-girder bridge. J. Bridge Eng. 2006, 11, 573–581. [Google Scholar] [CrossRef]
  39. Eom, J.S. Verification of lateral live load distribution factors for continuous steel girder bridges based on diagnostic testing results. Korea Inst. Struct. Maint. Insp. 2009, 13, 180–187. [Google Scholar]
  40. Harris, D.K.; Gheitasi, A. Implementation of an energy-based stiffened plate formulation for lateral load distribution characteristics of girder-type bridges. Eng. Struct. 2013, 54, 168–179. [Google Scholar] [CrossRef]
  41. Hernandez, E.S.; Myers, J.J. Load distribution of a prestressed self-consolidating concrete bridge. Front. Built Environ. 2019, 5, 96. [Google Scholar] [CrossRef]
  42. Choi, W.; Mohseni, I.; Park, J.; Kang, J. Development of live load distribution factor equation for concrete multicell box-girder bridges under vehicle loading. Int. J. Concr. Struct. Mater. 2019, 13, 22. [Google Scholar] [CrossRef]
  43. Huang, N.E.; Shen, Z.; Long, S.R.; Wu, M.C.; Shih, H.H.; Zheng, Q.; Yen, N.C.; Tung, C.C.; Liu, H.H. The empirical mode decomposition and the Hilbert spectrum for nonlinear and non-stationary time series analysis. Proc. R. Soc. A Math. Phys. Eng. Sci. 1998, 454, 903–995. [Google Scholar] [CrossRef]
  44. Junsheng, C.; Dejie, Y.; Yu, Y. Research on the intrinsic mode function (IMF) criterion in EMD method. Mech. Syst. Signal Process. 2006, 20, 817–824. [Google Scholar] [CrossRef]
  45. Chang, S.J.; Kim, N.S. Estimation of displacement response from FBG strain sensors using empirical mode decomposition technique. Exp. Mech. 2012, 52, 573–589. [Google Scholar] [CrossRef]
Figure 1. Procedure for extracting IMF using EMD.
Applsci 11 11010 g001
Figure 2. Procedure for extracting the static displacement component from the measured displacement response.
Applsci 11 11010 g002
Figure 3. PSC I girder bridge.
Applsci 11 11010 g003
Figure 4. LVDT installation positions.
Applsci 11 11010 g004
Figure 5. Specifications of the vehicles used in the vehicle loading test.
Applsci 11 11010 g005
Figure 6. Vehicle loading positions in the vehicle loading test: (a) Static loading test; (b) Dynamic loading test.
Applsci 11 11010 g006
Figure 7. Measured displacement response and static displacement component in LCs with a vehicle velocity of 60 km/h: (a) LC 3; (b) LC 7; (c) LC 11.
Applsci 11 11010 g007
Figure 8. Comparison of LLDF according to the loading position in the vehicle loading test.
Applsci 11 11010 g008
Figure 9. Error rates in each LC.
Applsci 11 11010 g009
Figure 10. Representative vehicles in driving lanes in the ambient vibration test: (a) Representative vehicles that travelled in lane 1; (b) Representative vehicles that travelled in lane 2.
Applsci 11 11010 g010
Figure 11. Displacement response measured at each girder in the ambient vibration test: (a) displacement response in a specific section; (b) displacement response measured between 50 and 66 s.
Applsci 11 11010 g011
Figure 12. Average LLDF of the bridge according to the vehicle type and lane.
Applsci 11 11010 g012
Figure 13. Error rate of LLDF according to the vehicle type and lane: (a) Lane 1; (b) Lane 2.
Applsci 11 11010 g013
Table 1. Weight of the vehicles used in the vehicle loading test.
VehicleAxial Load [ton]Total [ton]
FrontMiddleRear
17.0210.3010.0127.33
27.959.999.9427.91
Table 2. LC of the vehicle loading test.
LCLaneVehicleVelocity [km/h]
111stop
210
360
4100
522stop
610
760
8100
91, 21, 2stop
1010
1160
12100
Table 3. Maximum displacement measured in each LC.
TestLaneMaximum Displacement [mm]
G1G2G3G4
static1−1.15−1.24−0.73−0.17
2−0.27−0.89−1.22−0.61
1 + 2−1.51−2.16−2.01−0.82
dynamic
(10 km/h)
1−1.19−1.26−0.75−0.17
2−0.29−0.90−1.23−0.64
1 + 2−1.56−2.16−1.99−0.79
dynamic
(60 km/h)
1−1.15−1.22−0.72−0.17
2−0.27−0.88−1.22−0.61
1 + 2−1.52−2.12−1.92−0.78
dynamic
(100 km/h)
1−1.07−1.15−0.69−0.15
2−0.26−0.83−1.15−0.58
1 + 2−1.40−1.99−1.84−0.77
Table 4. Vehicle types that passed the bridge and their driving lanes in the ambient vibration test.
Vehicle TypeRemarks1st Lane2nd LaneTotal
carsmall, medium, and large vans, etc.701787
buslarge buses, etc.212344
truck1-, 5-, and 10-ton trucks, etc.212950
dump trucklarge dump trucks, etc.181129
special vehicletanker trucks and trailers, etc.101424
Table 5. Vehicle types and lanes used to estimate LLDF in the ambient vibration test.
LaneDump TruckBusTruckSpecial VehicleTotal
16118732
24912631
total1020201363
Table 6. Average maximum displacement of the static component extracted for each vehicle type and lane.
Load CaseAverage Maximum Displacement [mm]
LaneVehicle TypeG1G2G3G4
1dump truck−1.61−1.73−1.05−0.23
bus−0.48−0.52−0.32−0.08
truck−0.79−0.87−0.53−0.13
special vehicle−0.48−0.52−0.31−0.09
2dump truck−0.32−1.03−1.42−0.77
bus−0.11−0.37−0.50−0.28
truck−0.20−0.64−0.90−0.52
special vehicle−0.14−0.44−0.66−0.37
Publisher’s Note: MDPI stays neutral with regard to jurisdictional claims in published maps and institutional affiliations.

