Article

Interdisciplinary Urban Tunnel Control within Smart Cities

Faculty of Transportation Sciences, Czech Technical University in Prague, Konviktská 20, 110 00 Praha 1, Czech Republic
*
Author to whom correspondence should be addressed.
Appl. Sci. 2021, 11(22), 10950; https://doi.org/10.3390/app112210950
Submission received: 29 October 2021 / Revised: 11 November 2021 / Accepted: 17 November 2021 / Published: 19 November 2021
(This article belongs to the Special Issue Intelligent Mobility in Smart Cities)

Abstract

:
Nowadays, urban road tunnels are considered to be independent entities within a city. Their interactions with the rest of the city and vice versa are usually not considered and, if they are, are only considered in a limited way (for example, through the nearest traffic controller). Typically, only the traffic parameters and not the environmental impacts are considered. This paper has two major objectives. First, we provide a systemic view on a road urban tunnel. The major focus is on the interfaces between the tunnel and the rest of the city and the way they will be managed. We are providing a tool to take into consideration a sustainable development of a tunnel (i.e., not only traffic flow parameters such as average speed, but also environmental and societal characteristics). This model expresses the actual traffic situation in a monetary form (i.e., cost of congestions). The second objective is to provide a new road urban tunnel control approach that follows the original methodology and systemic view described in the paper. If the tunnel is controlled autonomously, which corresponds to the current state-of-the-art in many cities, the algorithm decides to close it based on only local parameters. However, the proposed new algorithm takes into consideration not only the traffic situation in the tunnel (expressed by the parameter traffic density), but also the actual traffic situation within the city (expressed by its level of service (LOS)). This allows more environmentally, socially and economically sustainable oriented road urban tunnel management. The described algorithm is demonstrated on a specific example of the tunnel complex Blanka in Prague.

1. Introduction

A road tunnel is often denoted a complex system, since the documentation contains hundreds of pages and consists of several large sub-systems. To describe it, it is necessary to get together experts with various backgrounds including civil engineers, electrical engineers, and also environmentalists or traffic engineers. At the same time, the design of an urban road tunnel is based not only on the national or international standards and regulations, but also on mathematical and physical models and designers’ experience. There is not a mandatory prescription on how to further split the tunnel into subsystems or how many and which processes must be implemented. For example, the tunnel’s safety system involves at least the followings subsystems: SOS boxes, identification of dangerous goods through ADR (hazard identification number) code recognition, powered PA speakers, video-detection of pedestrians, accident or smoke detection, section speed control, and others. Each of them is composed by diverse facilities.
All of the above mentioned indicates that a tunnel is a dedicated and separated system. In this paper we highlight the importance of recognizing an urban tunnel as part of a city. There are many processes that are interconnected. As will be demonstrated, a tunnel control strategy influences traffic in the rest of the city.
The main problems of integration an urban tunnel into a (smart) city is the large number of processes, their specific features, and the complicated relationship between them which all lead to the increase complexity and create a high dimensionality problem making it difficult to share.
The main contribution of this paper is in two aspects. First, the role of an urban road tunnel within a city is discussed. The topic of smart cities looks at quality of life and sustainability usually through better integration of their components [1]. A tunnel is, however, nowadays considered an independent entity. For this reason, we discuss the different dimensions of the interface between a tunnel and a city. We provide a target function as well as a mechanism to express the traffic situation in monetary terms. This allows better integration.
The second contribution of this paper is a new tunnel control algorithm based on the systemic approach described above. This algorithm takes into consideration the future state of traffic flow in the tunnel. It is based on the measured parameter traffic density in the tunnel but also as on the level of service (LOS) of traffic in the rest of the city. Thus, the control is adopted based not only on the tunnel performance itself but also on the rest of the city. A parameter cost of congestions is explained and shall be used directly to evaluate the control strategies. This parameter also demonstrates the monetary influence of current tunnel control strategies (namely closing the tunnel for road traffic) on the city.
This paper has the following structure. First, we address an urban road tunnel from the system theory perspective. The target function of any control or management strategy is discussed. Also, the topic of complexity and interface to the adjacent (smart) city components and processes is addressed. The influence of tunnel control on the adjacent traffic is supported by results from a project GLOMODO (global model of traffic) on a case study from Prague. The theory of expressing the deterioration of traffic performance indicators is expressed through monetary terms (i.e., cost of congestions). In Section 3, we discuss a new urban tunnel control algorithm. This algorithm is based on the traffic flow theory and aims on keeping the flow stable (fluid) while taking into consideration the outside traffic of the tunnel. The impact is demonstrated on a case study showing the effect of closing a tunnel complex Blanka in Prague. This is followed by a discussion and conclusions.

2. Systemic Approach to Urban Road Tunnel

2.1. Tunnel and Its Neighborhood

In the literature, a tunnel is often described as a complex system. Even the World Road Association (PIARC) in its PIARC Road Tunnels Manual [2] from 2019 dedicated an entire chapter to the topics of complexity. It is called “TUNNEL: A COMPLEX SYSTEM”. The authors claim that “A tunnel constitutes a complex system which is the result of the interaction of very many parameters. These parameters can be gathered by subsets.” This is certainly correct. A tunnel consists of many different subsystems and components that interact with each other. Can we, however, claim that it truly is a complex system?
Let us look at classification based on complexity theory. Rzevsky and Skobelev [3] provide seven criteria a system shall fulfil in order to be considered a complex system. In the following paragraphs, we will provide these criteria together with a discussion addressing the road tunnels in particular:
1. Connectivity—A complex system consists of a large number of diverse components, known as Agents, which are richly interconnected.
Tunnels consist of different components and subsystems. We can perceive all of the different sensors and actuators as agents. It cannot be, however, claimed that they are “richly interconnected.” They have interfaces and interact with each other. These interfaces and the reaction to changes of the shared variables are however clearly predefined.
2. Autonomy—Agents are not centrally controlled; they have a degree of autonomy but their behavior is always subject to certain laws, rules or norms.
This criterion is not fulfilled. All subsystems have a predefined behavior that is centrally controlled. There is a typically a central control system (SCADA—supervisory control and data acquisition) which access all the inputs from all subsystems, provides control decision and affects the actuators/outputs.
3. Emergence—Global behavior of a complex system emerges from the interaction of agents and, in turn, constrains agent behavior. Emergent behavior is unpredictable but not random.
The emergence in behavior of a complex system is its crucial characteristic. Based on the behavior of partial agents, one cannot determine the overall behavior of the system. This is clearly not true for existing road tunnels. Here, the administration expects clear and predictable behavior. Without that, a road tunnel would not be put into operation.
4. Nonequilibrium—Complex systems generate unpredictable disruptive events.
Similarly to the previous criterion, the purpose of tunnel control system is to avoid disruptive events. Even in case of a traffic accident, there are predefined rules that are addressing such situation. The objective is to minimize any disruptiveness.
5. Nonlinearity—Relations between agents are nonlinear
This criterion is fulfilled as for example interaction between traffic parameters and environmental characteristics are nonlinear. This is true for most of the partial subsystems.
6. Self-Organization—Complex systems self-organize, i.e., autonomously change their behavior or modify their structure, to eliminate or reduce impact of disruptive events (adaptability) or to repel attacks (resilience).
Tunnel systems do not self-organize. In order to ensure predictability (again, this is a characteristic expected by the road administrators), the behavior even in case of for example traffic accident is predefined.
7. Co-Evolution—If we define the system environment as the set of all systems with which the system interacts, then we can postulate that complex systems are open, they adapt to their environments and, in turn, change their environments.
As by self-organization, the existing control systems do not adapt to their environment. They can (and should) be adapted to the changes in environment by the system designers, but it is not a default property of the system.
The arguments above showed that we cannot address road tunnel system as a “complex system” according to the system theory. But is it possible? Nobody can claim that a road tunnel is a simple system. It covers other aspects, such as environment, traffic management, energy management, or even emergency management. So how come it is not complex? It is important to understand that the opposite “complex” isn’t “simple”, but “independent”; the opposite of “simple” is “complicated” [4]. And road tunnel system is certainly a complicated system, with many subsystems.
Another aspect that contributed to the confusion in terms is the linguistics. We talk often about a “tunnel complex” or as in case of the above-mentioned Road Tunnels Manual [2]: “Complex underground road networks”. That is correct. It is not just a hole in a hill. It covers all the different subsystems discussed above; often there are successive connected tunnels (see examples in Prague, The Hague or Oslo; the tunnels are often multimodal (e.g., shared usage between buses, pedestrians, bicycles and trams); tunnels can have a dual function (as transit and access to underground car parks—e.g., Annecy, Brussels and Tromsø); and others). Without a doubt, we are talking about “tunnel complex”. Again, it is not the same as a tunnel being a “complex system”.
In this paper, however, we will not assume that the urban tunnel is the element itself, but on the contrary part of the smart city concept. In this connection, it becomes a complex system with its neighborhood according to the described principles, since the tunnel must communicate with other subsystems of the smart city. Within this communication, the tunnel becomes an autonomous agent which negotiates with other systems (also represented by software agents) the best possible method for its management.

2.2. Sustainable Target Functions of an Urban Tunnel System

Tunnels are a specific part of the road network. Often, they are considered a closed system. We will demonstrate the need for their better integration not only into the road traffic network, but also to other fields such as energy management and environmental impacts.
It is more expensive to reach the same safety level in tunnels than on open roads. In case of an accident, the emergency response is far more difficult and human lives are in danger more often [5].
The primarily objective of road tunnels is to enhance the urban road network and thus help to realize transport performance between two points (origin-destination) expressed in vehicle kilometers travelled (VKT).
The transport performance however cannot be the only measure of quality. The tunnel (actually similarly to the rest of the road network), must follow the principles of sustainable development [6] as depicted in Figure 1.
Our target function of the tunnel system Ψ seeks a minimum of the qualitative index PI
Ψ = m i n P I
The performance Index (PI) has three parts
P I = ( C e   + C p + C n )
where C p is the operating costs. The decisive item is usually the price for energy for ventilation and lighting, but it also includes service costs and costs for replacement of equipment after the end of its life, labor costs of staff, and others. C e is the cost for environmental impacts, including the cost for protection from the air pollution and others. This has also clear link to traffic performance, as congestions have clear negative impact on the produced emissions (for example CO2 emissions [7]). C n is the cost of traffic accidents (in general the safety impact), which consists of the material damage, cost of the emergency response, but also the cost for personal injury or death.

2.3. Urban Tunnel Integration into Smart City Concept

In terms of syntax interface between any two systems, we must focus on all seven layers of the reference ISO/OSI model [8], with the physical layer physically transmitting signals across a communication medium; the data link layer transforming a stream of bits from the physical layer into an error-free data frame for the network layer; the network layer which controls the operation of a packet transmitted from one network to another, such as how to route a packet and others. Apart from that, we must, however, also ensure that the subsystems understand each other and not only that they can exchange packages. For this we must talk about a semantic interface [9].
A semantic interface assures that the knowledge contained in each subsystem will have an unambiguous meaning for the second subsystem and form knowledge will be close to the human cognitive thinking. Ontologies [10] are suggested as a tool to assure understanding among particular subsystems.
The semantics is of a great importance, while it is often neglected. There are many different stakeholders and actors that plays a role when designing a city subsystem. Each of them has a certain perspective on the given problem. Transport engineers are interested in the traffic flow, traffic occupancy, and a number of accidents. An architect understands the city tunnel from the urbanist point of view and looks at the urbanist details. A sociologist observes many details about drivers’ behavior. A business specialist looks at the operational cost, energy consumption, etc. Environmental experts study the effects of city tunnel operation on various pollution indicators.
These are often conflicting strategies of the heterogeneous fields, although we are looking at a single object (i.e., the urban tunnel). Each of these fields has a historically developed control concept according to its criteria functions, such as tunnel ventilation in relation to safety parameters, traffic flow control using variable signs, electricity control in relation to tunnel lighting, etc.
In our view, the “system of systems control” means the maximum use of the control strategies of each system (i.e., transport, energy, environment, etc.) and the creation of the best possible combination of them so that these strategies support each other and are not in conflict. This is supported for example by the work of Luin and Peteling [11]. The authors use the existing Supervisory Control and Data Acquisition (SCADA) system in connection to traffic simulation model, simulation of environmental characteristics and ventilation system. This resulting model connecting all above mentioned subsystems is used as a training base for simulating the impact of traffic accidents jointly on all subsystems and allows testing various human-machine interfaces.

2.4. Urban Tunnel Integrated Control

Let us observe M parallel information variables (O1, O2, …, OM) of a real system (city tunnel plus its surroundings). With respect to the system complexity, it is possible to identify j-th specialization that represents typically one of following areas: transportation, energy, environment, business, etc. Within j-th specialization (in our case one of the systems) the experts can find the set of L different scenarios ( S j , 1 , S j , 2 ,   , S j , L ) . Scenarios ( S j , 1 , S j , 2 ,   ,   S j , L )   must be prepared beforehand. With the help of selected scenario S j , i , the control signals for each scenario are used to optimize the real system behavior.
We suppose that there exists an inner N- knowledge vector (K1, K2,…, KN) common for all specializations that best characterizes strong features of the real system of systems. All scenarios Sj,i(K1, K2,…, KN) are supposed to be dependent on this knowledge vector. At the same time the quality assessment function   Q i , j { S i , j ( K 1 ,   K 2 , ,   K N ) }   s assigned to each scenario Sj,i(K1, K2,…, KN) is also dependent on this vector.
The methodology of scenarios co-ordination can include the following 5 steps:
  • Identification of knowledge base vector (K1, K2,…, KN) from available data (O1, O2,… OM). In transportation we can use strategic traffic detectors, in environmental areas selected climatic sensors, etc. The knowledge vector must be a low-dimensional one and all available data must be aggregated into it.
  • Selection of scenario Sj,i(K1, K2,…, KN) in accordance with knowledge base (K1, K2,…, KN). In transportation, for example, the best suited scenario is selected based on e.g., set of strategic detectors.
  • System control according to the selected scenario using real data. In transportation, for example, the selected scenario provides the traffic control of city tunnel based on measured traffic data. Appropriate control signals are distributed to variable signs. The scenarios are typically evaluated through micro/macro traffic simulations.
  • Quality assessment function depending on the selected i-th scenario in j-th specialization Sj,i (K1, K2,…, KN). In transportation, for example, the normalized average travel time or the congestion length, etc. can be used as the control assessment function.
  • Cross-disciplinary i-th scenario selection for each j-th specialization to achieve the most appropriate (weighted) sum of quality assessment functions j , i   Q i , j { S i , j ( K 1 ,   K 2 , ,   K N ) } .   The transportation scenario is selected, for example, to be as environmentally friendly as possible to take care of both transport and environment specializations.
The above methodology describes the most general example parametrized by vector (K1, K2, …, KN). In the real praxis we are not concerned about (j, i)-th scenario definition, the design of scenario’s selection, data collection, transmission and processing (control system). The long term knowledge of each specialization has solved this problem and we can only register how many scenarios Sj,i exist in different areas such as transportation, energy supply, environmental protection and others [12].
Further, we suppose that it is possible to determine the (normalized) assessment function Q j , i { S j , i } where (j, i)-th pair means the selected i-scenario for j-th specialization j { 1 , 2 , } . If the problem has been linear we would have selected such (j, i)-th combination that simply maximizes the sum j   Q i , j { S j , i } .

2.5. Urban Tunnel Management as a Smart City Component

This section presents an illustrative example of how the intelligent tunnel can be integrated into smart urban area. Let us assume that the tunnel communicates with whole district and negotiate its control strategy not only locally but also with respect to criterial functions of whole district.
For simplicity, let us build as a criterion function Q j   of j-sectors their financial impacts on the whole area. For example, transportation area around the tunnel can be represented by Q 1 that includes all the financial implications of the loss of drivers’ time. On other side Q 2 captures the financial impacts of transport on the environment, e.g., pollution CO2, NOX, PMx. Q 3 describes energy losses in the whole area expressed in financial parameters, including fuel consumed by all vehicles in congestion or energy consumption of own intelligent tunnel operation (ventilation, lighting).
For simplicity, consider only two possible tunnel control scenarios—either the tunnel is open S 1 or closed S 2 . The main advantage of the intelligent tunnel as a smart city component is that the decision on the control strategy ( S 1 or S 2 ) is not made locally, but with regard to the financial impact of the whole district area. Described mathematically, control is carried out using two criterion functions:
Q ( S 1 ) = Q 1 ( S 1 ) + Q 2 ( S 1 ) + Q 3 ( S 1 )
Q ( S 2 ) = Q 1 ( S 2 ) + Q 2 ( S 2 ) + Q 3 ( S 2 )
Determining the financial impacts on the whole district area is a difficult task. It is important to use all available information and prepare a traffic simulation model to allow the expression of these criterial parameters Q ( S 1 ) , Q ( S 2 ) depending on the control strategies S 1 , S 2 .
It is obvious that the described approach can be further extended to several different control strategies, including e.g., speed limitation in the tunnel (50 or 70 km/h), ramp metering with different options of vehicles entry into the tunnel, different tunnel ventilation scenarios, etc. All these variants represent an extended set of possible control strategies S 1 , S 2 , S 3 , …. For each control strategy it is necessary to estimate financial impacts to the whole area to be able to provide right decision-making.

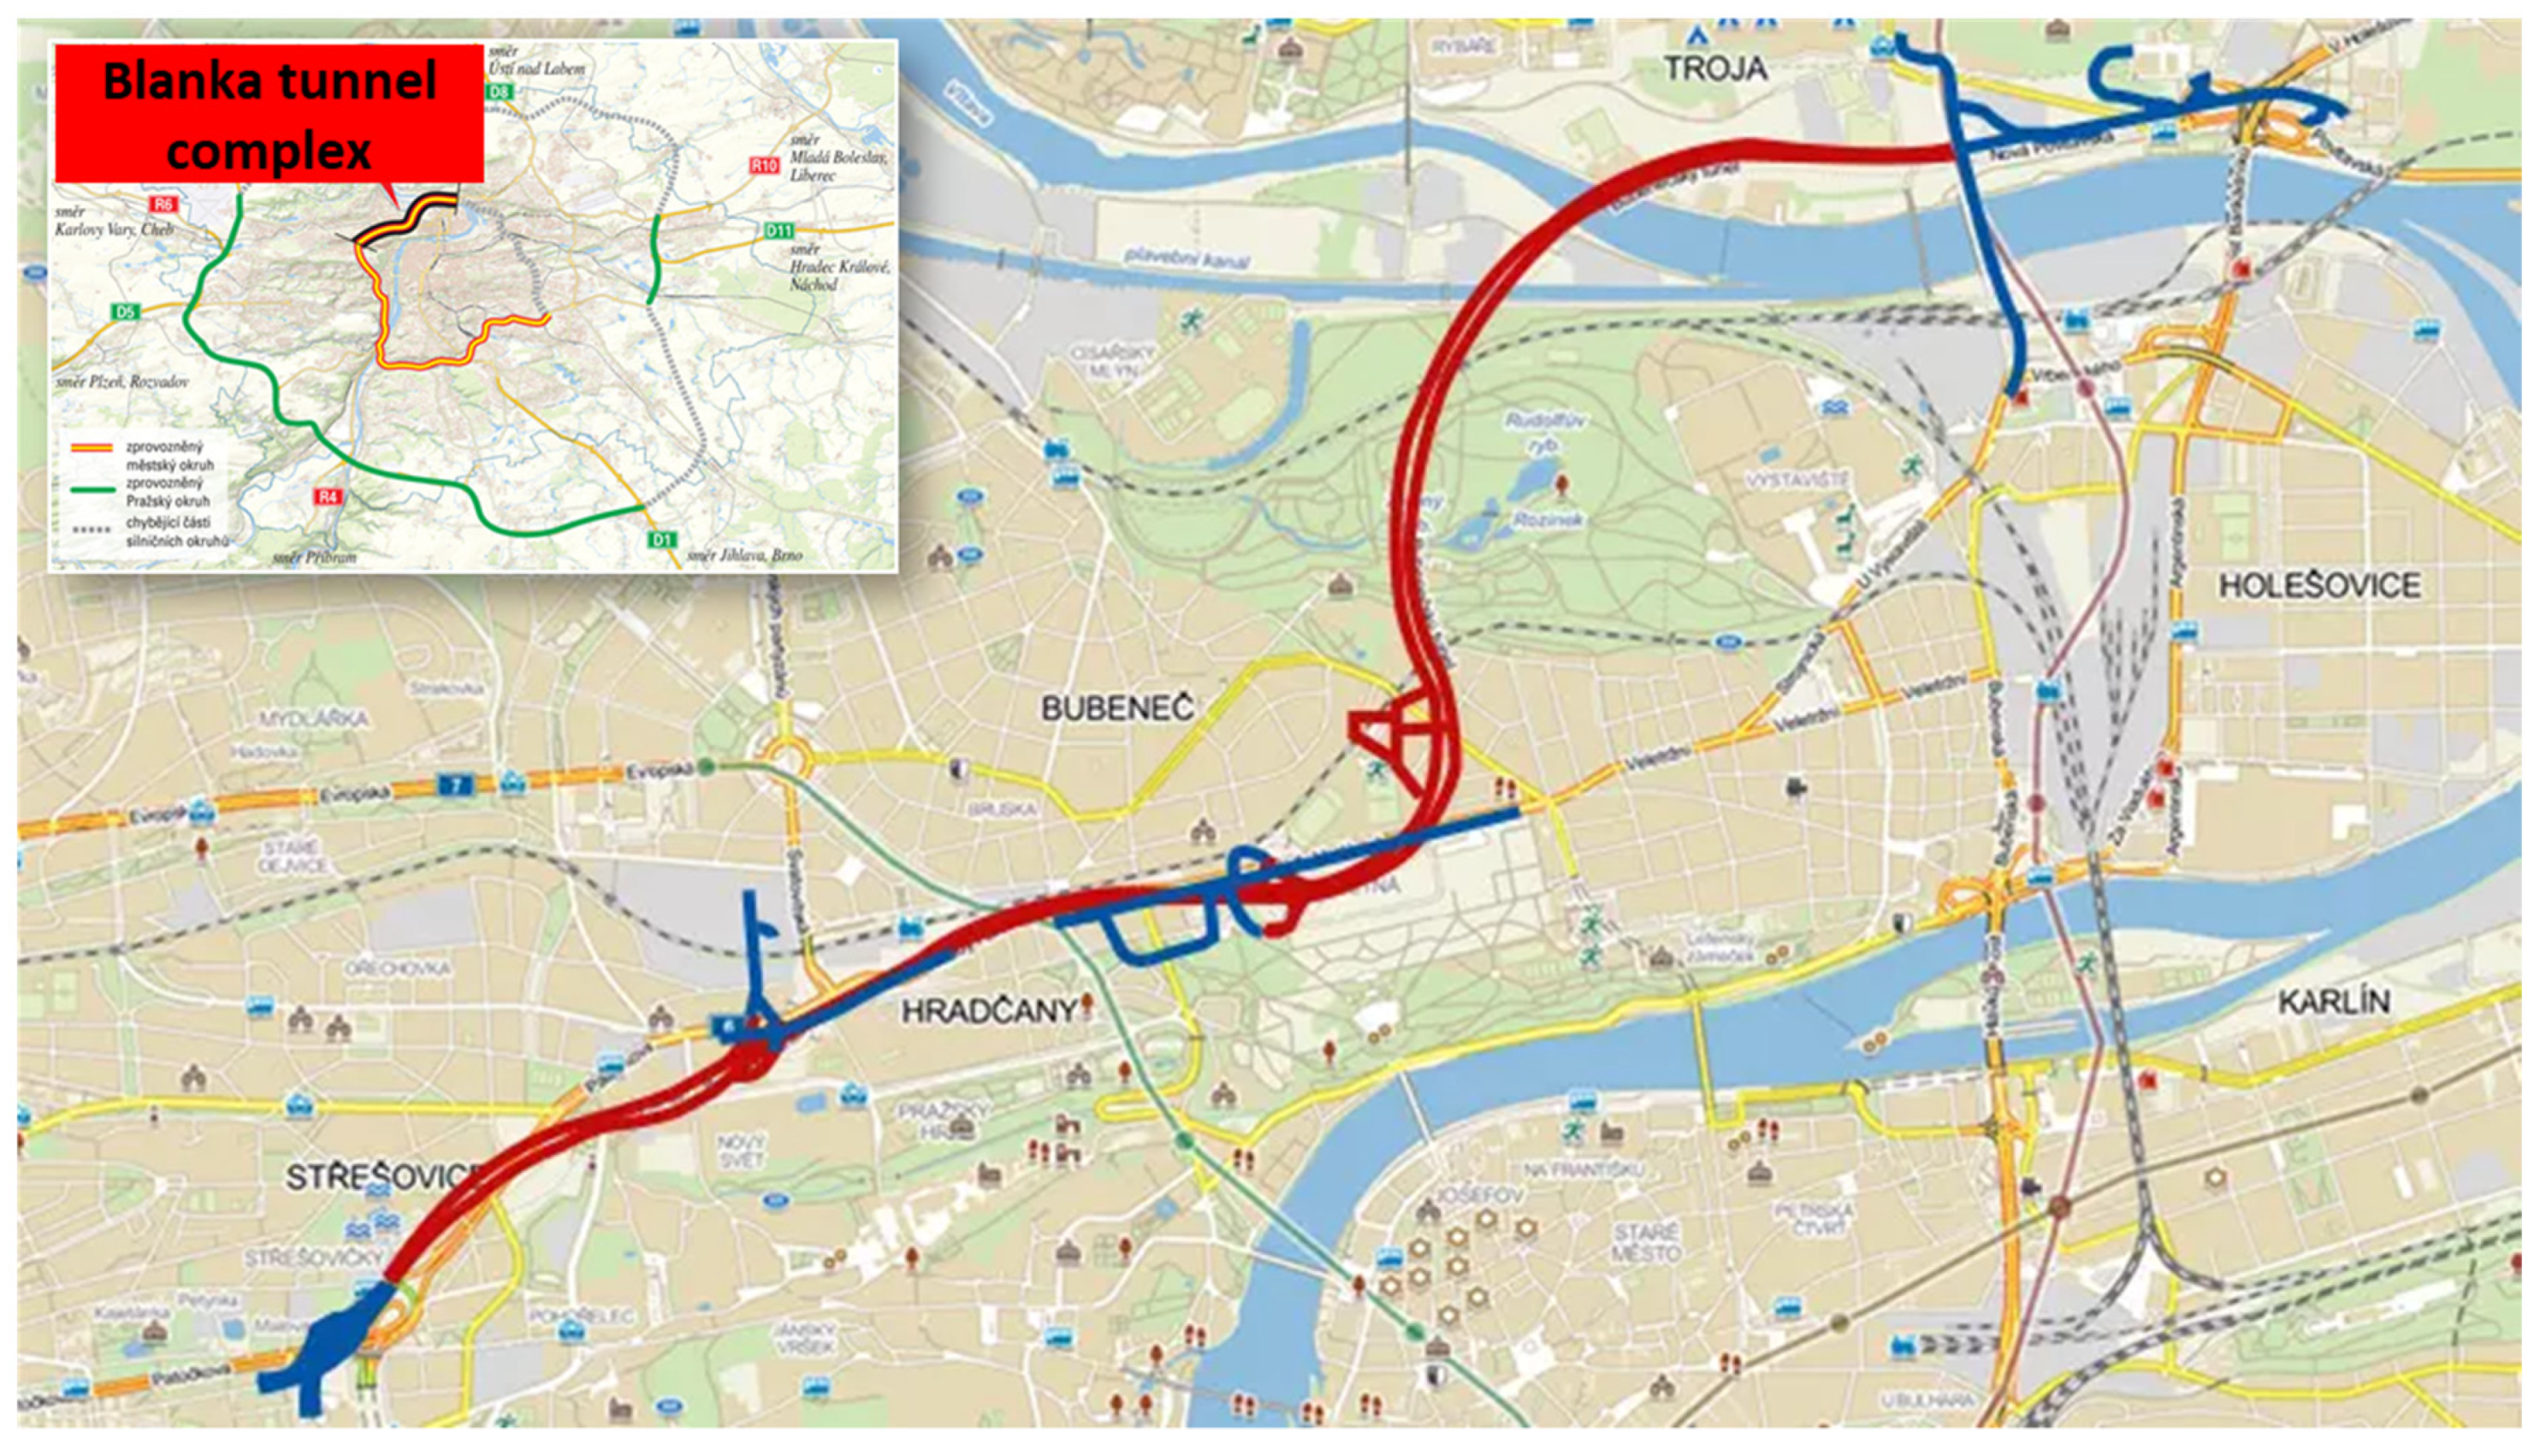
2.6. Case Study—Management of Urban Tunnel Blanka in Prague

For the purpose of city tunnel control, these three functions Q 1 , Q 2 , Q 3 can be expressed as monetary values. It is rather straightforward for energy management (there is a given price of energy). It is more complicated for environmental parameters and transportation, but it was addressed for example by a project GLOMODO (global model of traffic) (https://starfos.tacr.cz/cs/project/UH0370, accessed on 1 November 2021). This project aims to add values (meaning) to the data from all strategic detectors and all section speed control systems in Prague. An illustrative overview of the sensors used in the project is provided in Figure 2.
Project GLOMODO consists of several modules whose aim is to give a road operator or a city manager better understanding of the traffic situation. As depicted in Figure 3, apart from data preprocessing aiming mainly on identification and correction of missing data and outliers, there are three modules: Module FIS computing the cost of congestions; Module LOS providing a level of service indication based on so-called speed index [13]; and Module MEN aiming on identification normal behavior of traffic flow and warning the operators in case of any non-standard traffic patterns.
For the purpose of this paper, we shall focus on the module FIS only as it assigns monetary value based on the level of congestions. The overall cost of congestion in all district Q is computed when the vehicle is forced to travel with a limited speed due to congestions and is based on the following formula with parameters adjusted for the conditions of the city district—it is expressed by symbol (.):
Q ( . ) = Q 1 ( . ) + Q 2 ( . ) + Q 3 ( . )
where Q 1 ( . ) computes the value of lost time, Q 2 ( . ) determines the cost of environmental impact (related to increased pollutions) of congestions and Q 3 ( . ) denotes the increased fuel consumption. Q 1 ( . ) is computed as:
Q 1 ( . ) = N a c t . t a c t . C T . v e h o c c
where N a c t denotes the 5-minute value of traffic flow, t a c t denotes the time delay due to the congested traffic, C T the time spent in traffic and v e h o c c the average occupancy of a vehicle. Q 2 ( . ) is computed as:
Q 2 ( . ) = ( S G a s . C G a s + ( S D i e s e l + S H D V ) .   C D i e s e l ) . P C O 2
where S G a s is the computed fuel consumption for petrol vehicles in the given time interval; S D i e s e l denotes the computed fuel consumption for diesel vehicles; S H D V similarly denotes the consumption of trucks and lorries; C G a s denotes CO2 emissions for 1 litre of petrol; C D i e s e l denotes emissions CO2 for 1 litre of diesel; and, finally, P C O 2 is the price associated with the production of 1 ton CO2 emissions.
Q 3 ( . ) is building upon the generally accepted models of fuel consumption for different speeds. Different tools use slightly different models, as depicted in Figure 4. For this reason, GLOMODO uses an adopted model that is based on experimental evaluations [14].
All parameters in the equations are set based on national as well as international guidelines and experiments. This approach is rather general and can be easily adopted for example to changes in vehicle fleets.
Examples of the results of the above-mentioned model are provided in Figure 5 where the cumulative cost of congestions on particular strategic sensors as well as the level of service (LOS) is shown.
Figure 6 further demonstrates the impact of each of the factors. Clearly, Q 1 ( . ) (i.e., the lost time) is the biggest contributor to the cost of congestion.

3. New Road Tunnel Traffic Control Algorithm

Urban road tunnels, when left without control, often face congestions. Congestions influence several aspects from performance index in Equation (2). Clearly, they impact the transport performance (less vehicles can get through the network), but they also negatively influence the environmental aspects.
The congestions in tunnels can be addressed mainly by two control approaches. Both of them are based on highway management strategies [15,16]:
A.
Influencing characteristics of the traffic flow, usually through speed harmonization. It has been demonstrated [17] the capacity of a communication is increased in case a speed limit is imposed on highways. This is achieved through harmonizing the traffic flow (i.e., minimizing the speed differences among vehicles), thus decreasing the vehicular headways and thus increasing the throughput. Nowadays, this control approach is however limited by the existing norms (for example Czech norm 73 6101) stating that the tunnel is just a continuation of the road network and should maintain the same speeds. For this reason, a speed variation is not a suitable option.
B.
Changing the travel demand parameters, particularly by managing (constraining) the number of vehicles entering the tunnel. This is similar to the concept of ramp metering, often adopted on highways and freeways.
Nowadays, tunnels are typically controlled by the second approach. It is, however, usually performed manually and often in a binary matter. In case queues are forming in a tunnel, the police decide to close the tunnel. This principle is demonstrated on a case study of an urban road tunnel complex Blanka (Prague, Czech republic), which is depicted in Figure 7. It is an important part of the (still not finished) Prague city ring and it was built to lighten the traffic in the central historical areas of the city. The tunnel complex is 5.5 km long and it is composed by three underground tunnels (red lines in the Figure 7). The opening of the tunnel complex Blanka in 2015 had a major impact on traffic in the city and clearly demonstrated need to take such tunnel complex as a part of the city.
The effect of tunnel closing clearly leads to an improvement within the tunnel, but has a strong negative impact on the traffic around the tunnel, in the rest of the city. This is described by Faltus and Hrdina in [18] and demonstrated in Figure 8. The green points denote sensors for which the average speed increased after opening the tunnel complex Blanka; the red points mean decrease in average speed. Always, the change in percent is presented. The full circle denotes the sensor that measures in one direction only, the split circles show values in both directions.
Another negative aspect of the current traffic control is the recovery phase, after the tunnel is opened again. It can take several dozens of minutes (sometimes even hours) to recover the stable state after the tunnel is opened [19].

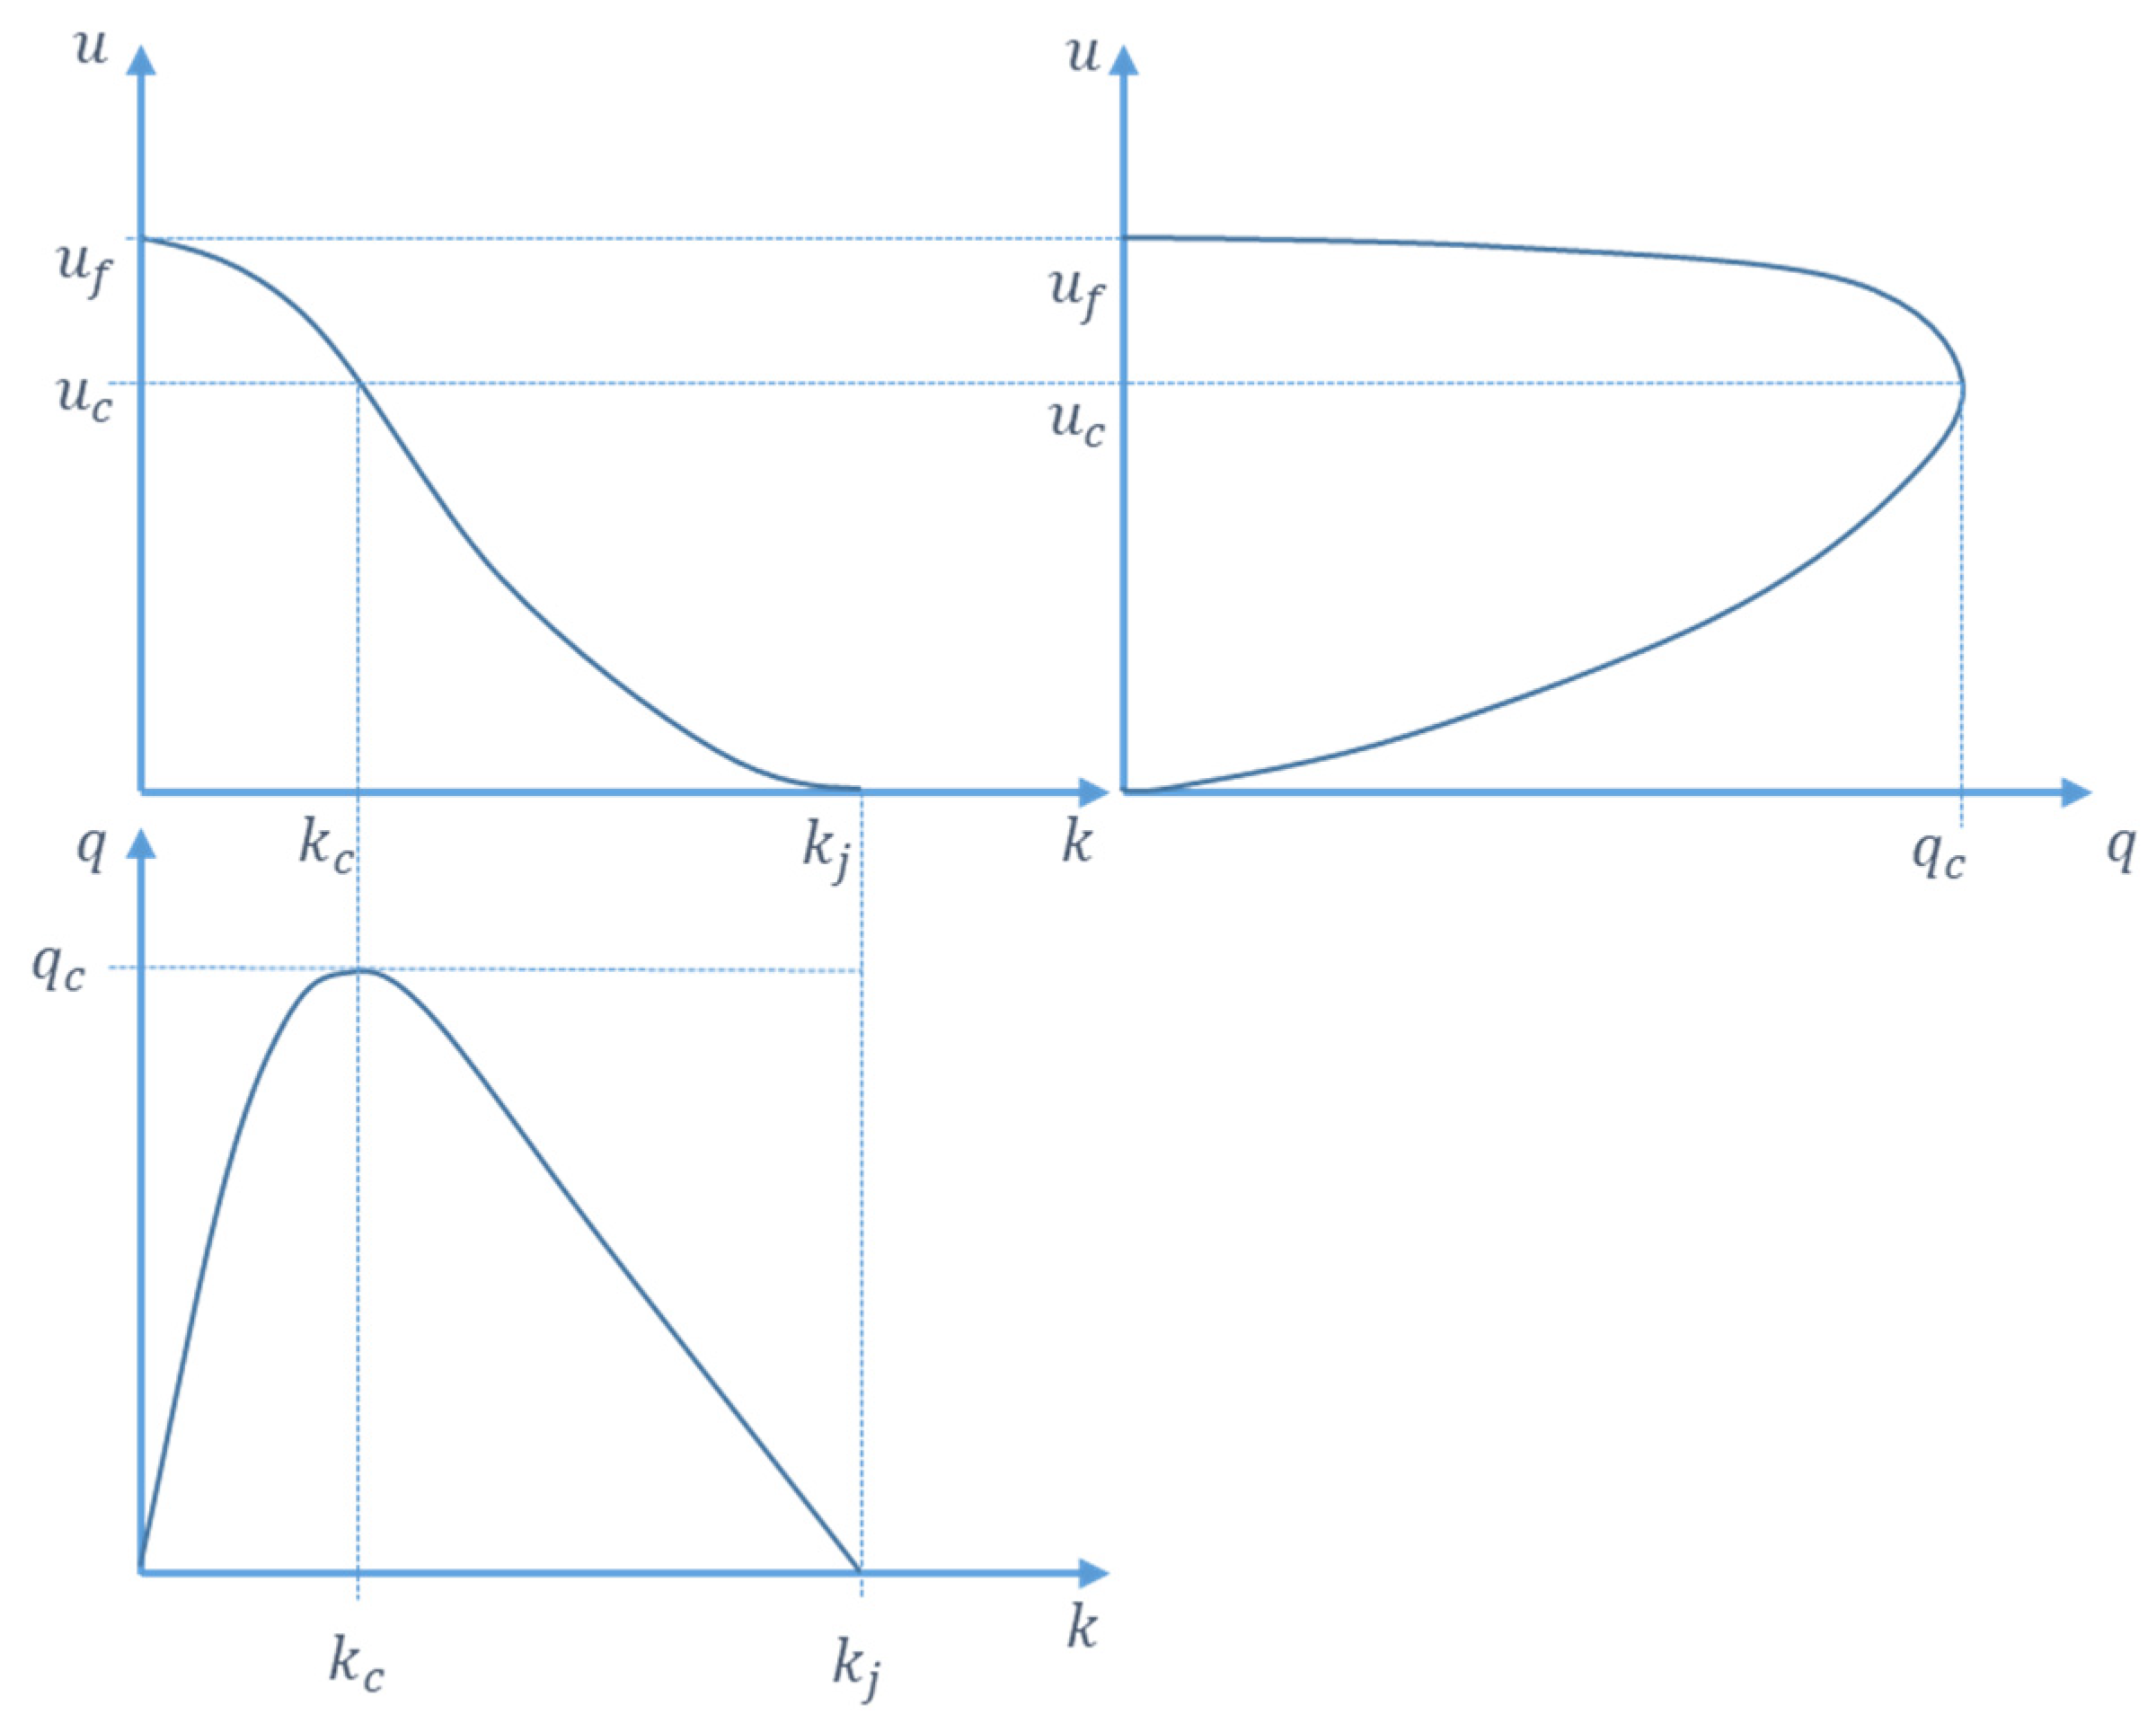
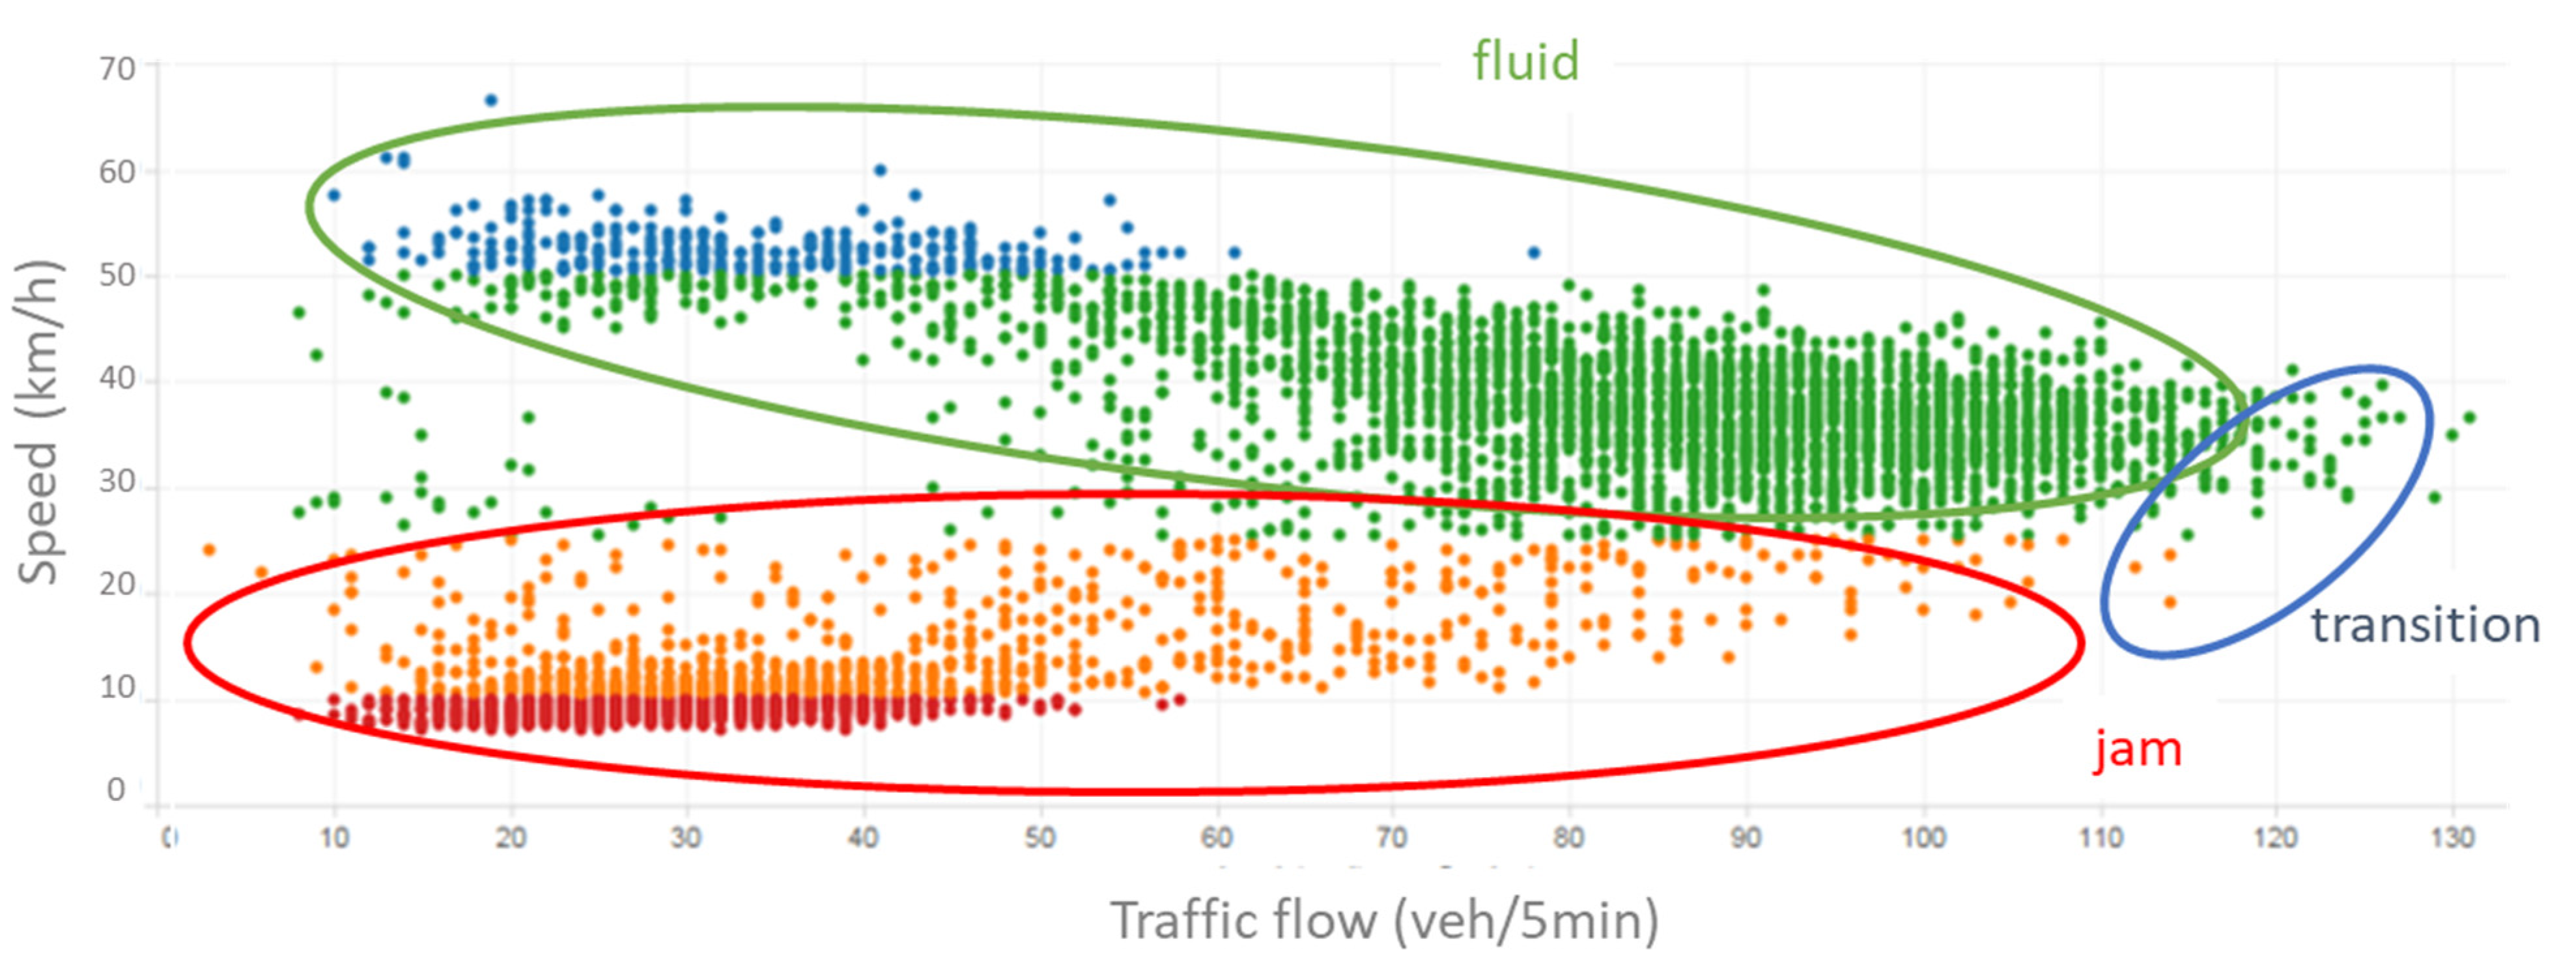
3.1. Fundamental Traffic Flow Theory

In order to develop an optimized traffic control strategy, it is necessary to look at the characteristics of traffic flow. The traffic flow is characterized by three basic variables [20]: flow rate q, density k and mean speed u. Due to the fundamental relation q = k . u there are only two independent variables. The relationship among the variables is often depicted using so-called fundamental diagrams (see Figure 9).
For the purpose of this paper, we need to focus on the following points and areas of interest in the diagrams:
Completely free flowing traffic, when vehicles are not impeded by other traffic and travel at a maximum (or desired) speed of u f (free speed). This free speed depends on the road design speed (based on curvature, transverse slope, road surface quality and other parameters), the speed restrictions (speed limits), the weather, but also on the driver’s characteristics. At free speed, flow rate and density will be close to zero.
Saturated traffic, when the flow rate, q, and speed, u, are down to zero. The vehicles are queuing and there is a maximum density of k j (jam density).
Capacity traffic, with the capacity of a road equal to the maximum flow rate, q c . The maximum flow rate of q c has an associated capacity speed, u c , and a capacity density, k c . The diagram shows that the capacity speed, u c , lies below the maximum speed, u f .
There exist various models trying to find an analytical solution fitting as best as possible the empirical measured data, for example linear model [21], triangular diagram [22], or more realistic high-order macroscopic models addressing certain discontinuity [23].
Here, we focus on the last class of models as they well describe the phenomena we face in tunnels. Ning Wu in [24] uses an approach of homogenizing traffic and addressing the transition among them. As Wu demonstrated in his paper, the measured data confirm two major data clusters (traffic states) with different characteristics as well as transition phase between them. They are called fluid traffic and jam traffic. This is confirmed also by the data measured in the Czech Republic as demonstrated for q-v relationship on example in Figure 10. This is in a way similar to Kerner’s Three-phase theory [23], where next to the free flow, the jam is further split into two phases, namely synchronized flow and wide moving jam.
The critical part which needs an extra focus is the transition from free flow to the jam and back. The traditional models often fail as there is only a limited number of measurements. This is due to the fact that the transition is rather quick (i.e., the flow does not stay in this phase for too long) and there is a clear observable hysteresis (i.e., the recovery from the jam does not follow the same trajectory as falling from the free flow to the jam). The traditional models thus tend to overestimate the road capacity. The principle of this transition is further depicted in Figure 11.
For the purpose of this paper and the road urban tunnel control system, it is clear from the above-mentioned theory that we need to focus on density. We are mainly interested in the point when the fluid traffic breaks into the jam, that is at density κ K O (i.e., at the state that the average length of the net headways between the vehicles is equal to τ K O in the fluid convoy). The jam traffic turns back upwards into the fluid traffic at κ g o ,   m i n (i.e., at the state that the average length of the net headways between the vehicles is equal to τ g o in the jam convoy). For more details on identifying the critical values of density, refer to Wu [24].

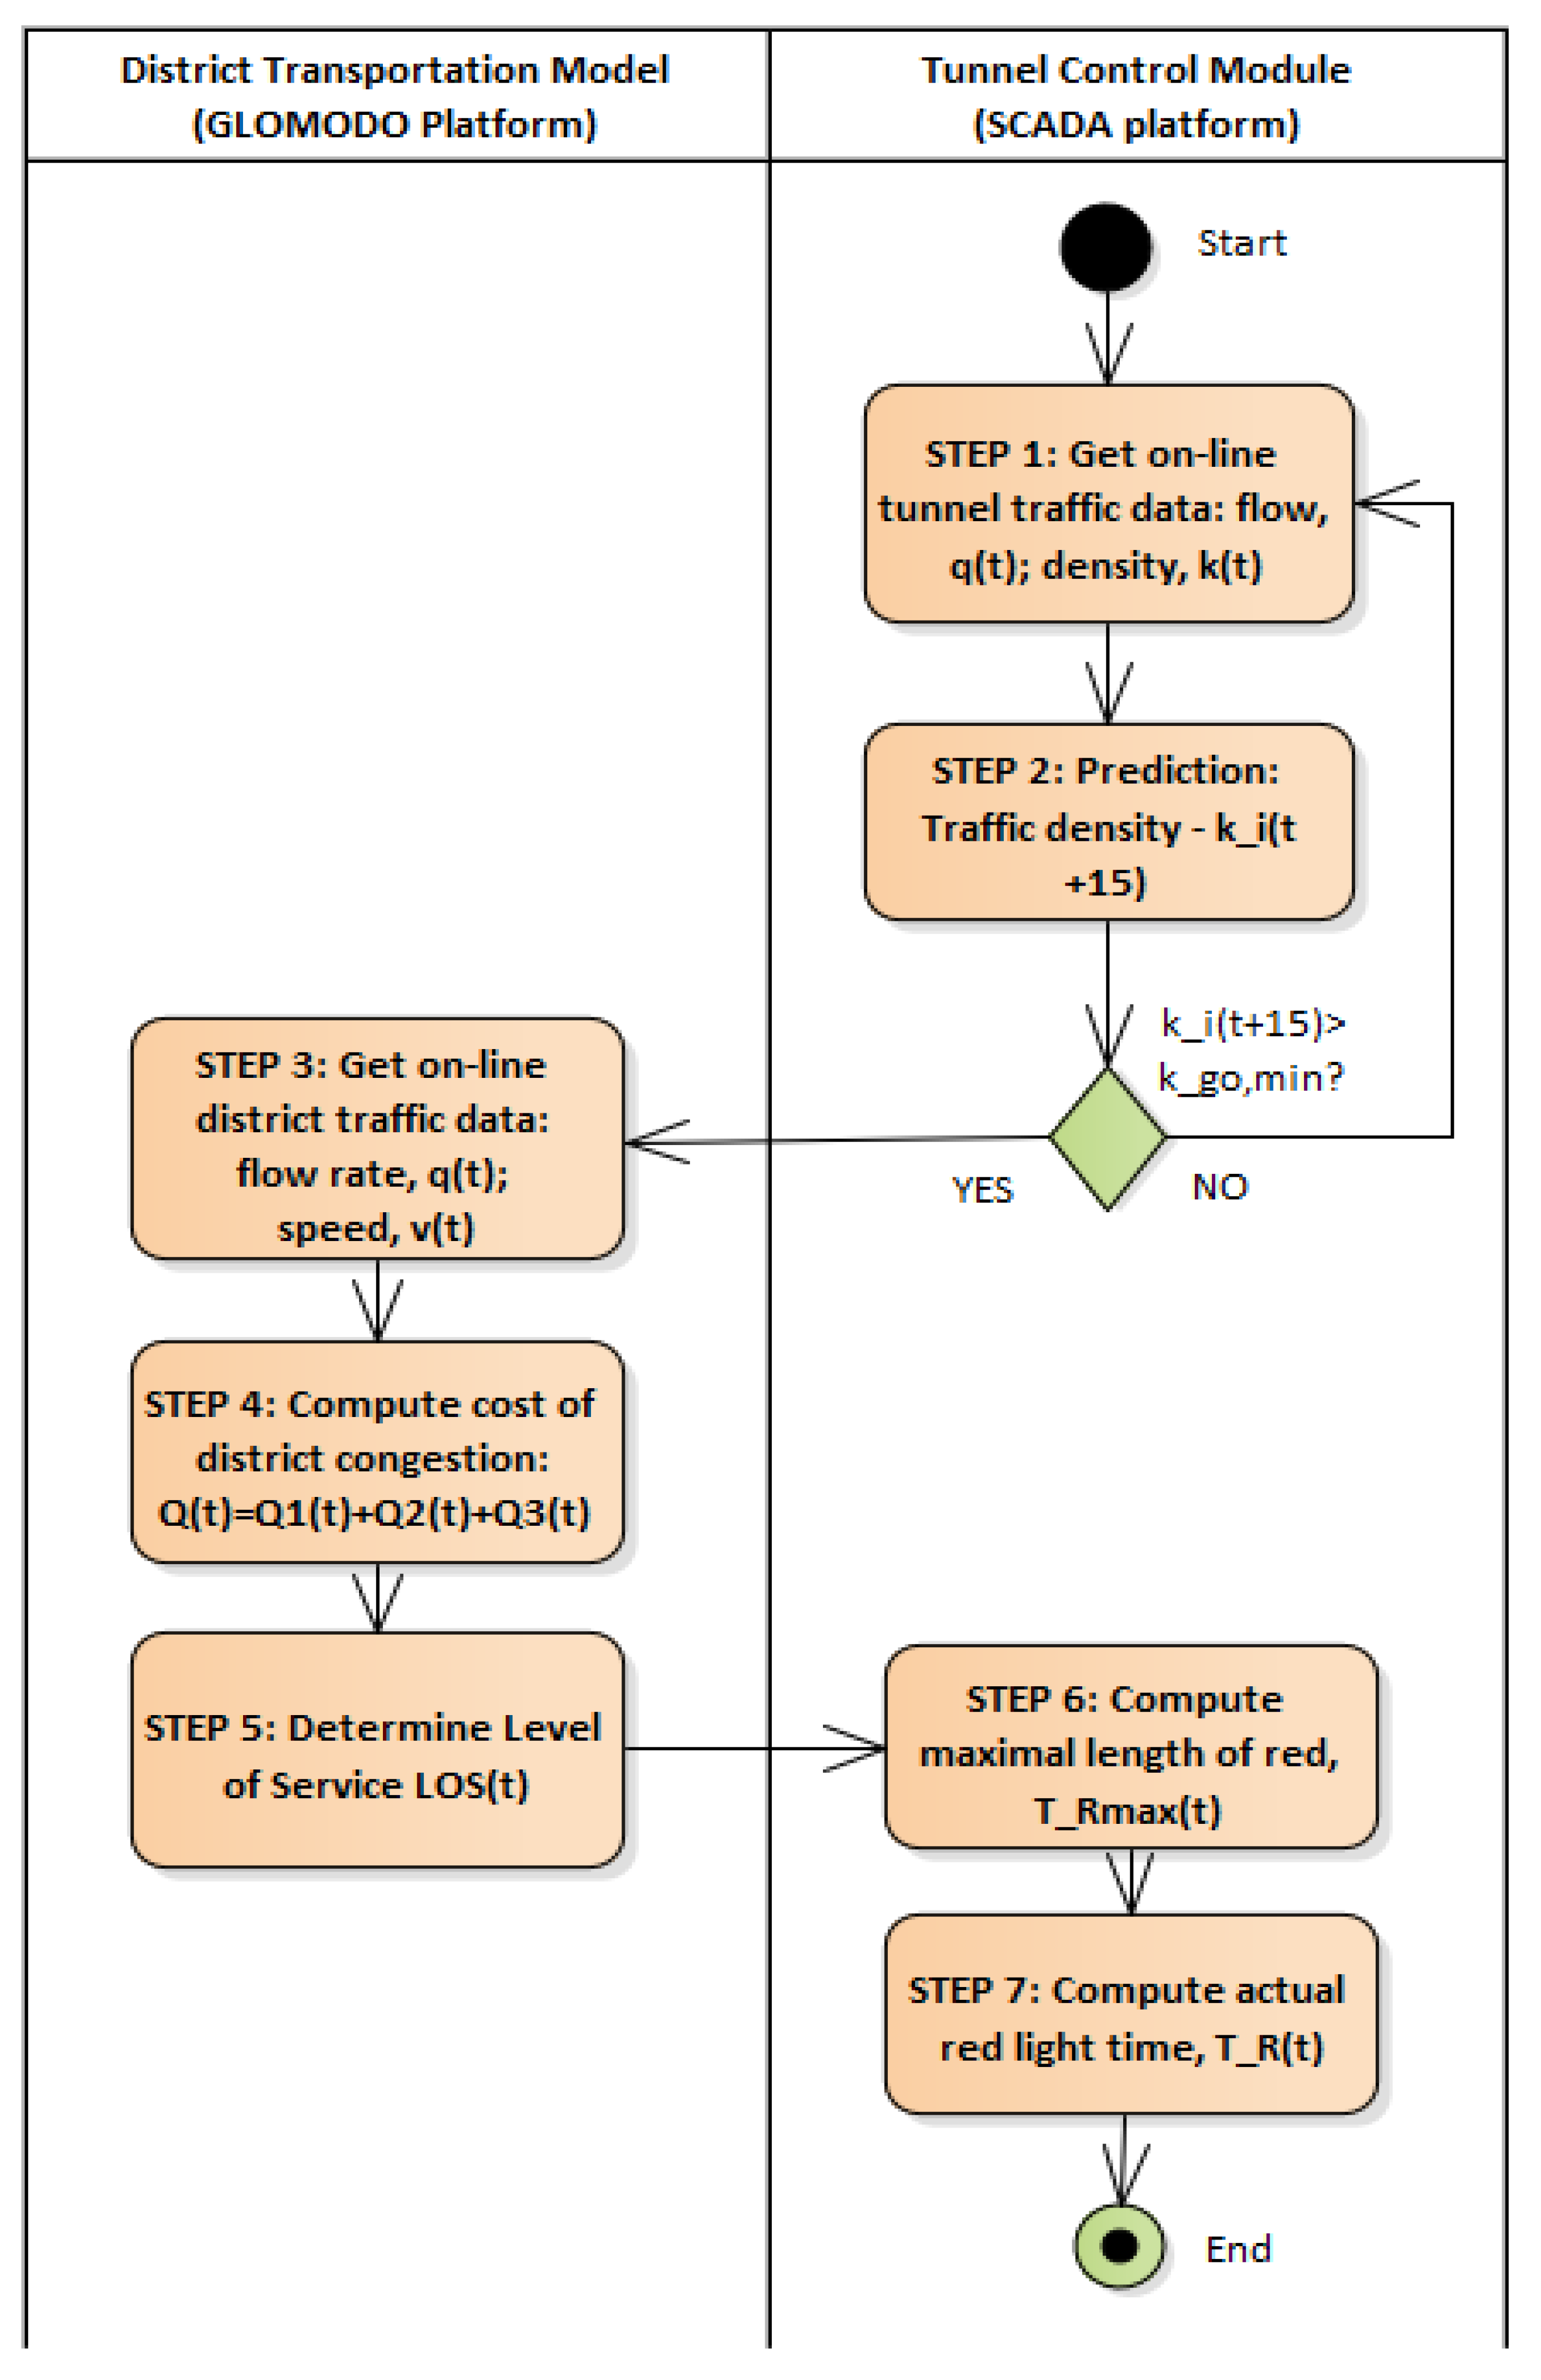
3.2. New Road Urban Tunnel Traffic Control

As mentioned above, nowadays the most common “control” approach in an urban tunnel is a closure of a tunnel. Tympakianaki et al. [16] calls closure a disruptive traffic management strategy and further claims that the resulting strategy shall depend on the cause and type of congestions. Tunnel closure solves the problems of hygienic (environmental) limits in the tunnel. However, it means a big intervention in the quality of traffic in the whole city, which is contradicting the idea of smart cities. At the same time, due to the distributed nature of traffic spread in the city and implicit hysteresis of the traffic stream characteristics (as explained above), the recovery phase is very slow.
In this chapter we propose a new traffic control management system based on the properties of traffic flow described above. A flow chart (using the SW modelling tool Enterprise Architect) for the proposed control algorithm is provided in Figure 12 and explained within this section.
It aims to prevents traffic flow transiting into the jam phase. Similar principle of stabilizing main traffic stream is known from highways as ramp metering [25,26]. In ramp metering there is a main traffic flow going on the motorway, and a traffic signalization allows only a limited number of vehicles entering from a side on-ramp. In the case of a tunnel, we are using a similar principle, with the difference, that we are restraining vehicles entering the tunnel (see Figure 13). It is not carried out in a binary manner (tunnel open/closed), but using variable length of a red signal, T R . The objective is to keep the density below the value of κ K O (See Figure 11) and thus avoid falling into the jam traffic.
Let us consider a fixed cycle length of 120 s. The length of the red-light signal then varies between 0 s and 120 s (which in a 120-second-long cycle means that the tunnel is closed) depending on two factors.
The first parameter is the traffic density in the tunnel (see explanation in previous section and Figure 11). Since it is difficult to measure directly density, we use a parameter called occupancy, o i (%) (the index i denotes i-th sensor). Occupancy is measured directly by point traffic sensors and under certain assumptions (mainly a uniform vehicle length L) it can be used to calculate density [27]:
o i = ( L + d ) .   κ i = c K . κ i
where L is the uniform vehicle length and d is the length of the sensor (e.g., inductive loop). While computing density, in order to allow better link to the theoretical section of this paper, we refer to the corresponding value of computed density in all calculations and figures.
To be able to react to the expected worsening of the situation in advance a prediction module is used to have a prediction of the density (for example, 15 min in advance, κi (t + 15)). There are several existing algorithms to predict traffic stream characteristics. Yu and Liu [28] are using spatial-temporal data fusion using traffic volume, road geometry, or even weather conditions. Laña et al. [29] use random forest regressors on traffic flow time series. Lv et al. in [30] predict traffic flow using a deep learning approach and Guo et al. in [31] use statistical hybrid Gaussian process regression. Altogether, the various research methods show rather strong prediction capabilities.
Please note that in our approach we do not wait until the density reaches value κ K O (in Figure 11). We start limiting the vehicles already by κ g o ,   m i n . Clearly, we want to prevent the transition into the jam phase, so the algorithm starts earlier. This shall be sufficient as it is linked to the predicted value of occupancy.
The second parameter that influences the outcome of the traffic control is the traffic situation in the city, expressed by level of service (LOS). When the traffic situation on a selected location in the city is good, the traffic control in tunnel is not influence at all. However, if the traffic situation in the city worsens, it would be contradictory to even contribute to the worsening by improving situation in the tunnel. It can be expected that under such conditions, the situation in the tunnel worsens as well. The length of the red-light phase will be shorter.
In Figure 5 the cumulative cost of congestions and related Level of Service were introduced. The urban road traffic control algorithm works with LOS categorization—LOS 1—green; LOS 2—yellow; LOS 3—red. To obtain valuable on-line data, the system must be connected to GLOMODO (Figure 3), which continuously monitors the LOS, including available short-term predictions. This fulfills the idea of connecting the road urban tunnel with the Smart city system through presented syntactic and semantic interface.
In the case of LOS = 1 (green), a full interval T R will be used for urban tunnel control according to occupancy prediction, as it is shown in Figure 13. In case of LOS = 2 and LOS = 3, the maximum of interval T R ,   m a x will be reduced accordingly. STEP 6 of the algorithm (see Figure 12) is based on the Equation (9):
T R , m a x ( t ) = { M R T f o r     L O S   1 0.8 · M R T   f o r     L O S   2   0.4 · M R T f o r     L O S   3
where MRT denotes the maximum red time and it is a parameter that depends on the particular tunnel. For the case of the tunnel Blanka, the value of parameter MRT equals to 120 s (which corresponds to the cycle length discussed above). The reaction of the tunnel control system will be thus more sensitive to the surrounding traffic situation.
The actual length of the red-light signal, T R ( t ) , i.e., STEP 7 of algorithm (see Figure 12) is currently computed according to the Equation (10):
T R ( t ) = k i ( t + 15 ) · T R , m a x ( t ) ( κ K O κ g o ,   m i n )
As a next enhancement of the algorithm, nonlinear characteristics will be modeled using a fuzzy inference system mechanism [32,33], which will be tailored-made for specific tunnel construction and its traffic features.

3.3. Case Study Results—Control of Road Urban Tunnel Blanka in Prague

In this section, we demonstrate the effect of closing the tunnel Blanka using a BEFORE and AFTER analysis. Figure 14 shows the development of the speed index for one working day and one weekday before, resp. after the tunnel opening. The figure demonstrates that the speed index dropped more substantially before opening of the tunnel Blanka.
The average speed index increased from 0.909 to 0.915 for a weekend day before, respectively, after and from 0.857 to 0.865 for a selected Tuesday before, respectively, and after. The actual economic impact is demonstrated in Table 1. It uses the presented cost of congestion computations. It provides aggregated values for all traffic sensors presented in Figure 2 and always the whole day. Please note that we are looking at the impact on the rest of the city and not values in the tunnel.
The table presents the following variables:
  • Sum of flow (veh/day), which takes the daily total number of vehicles on each sensor (without the traffic flow in the tunnel) and sums these numbers;
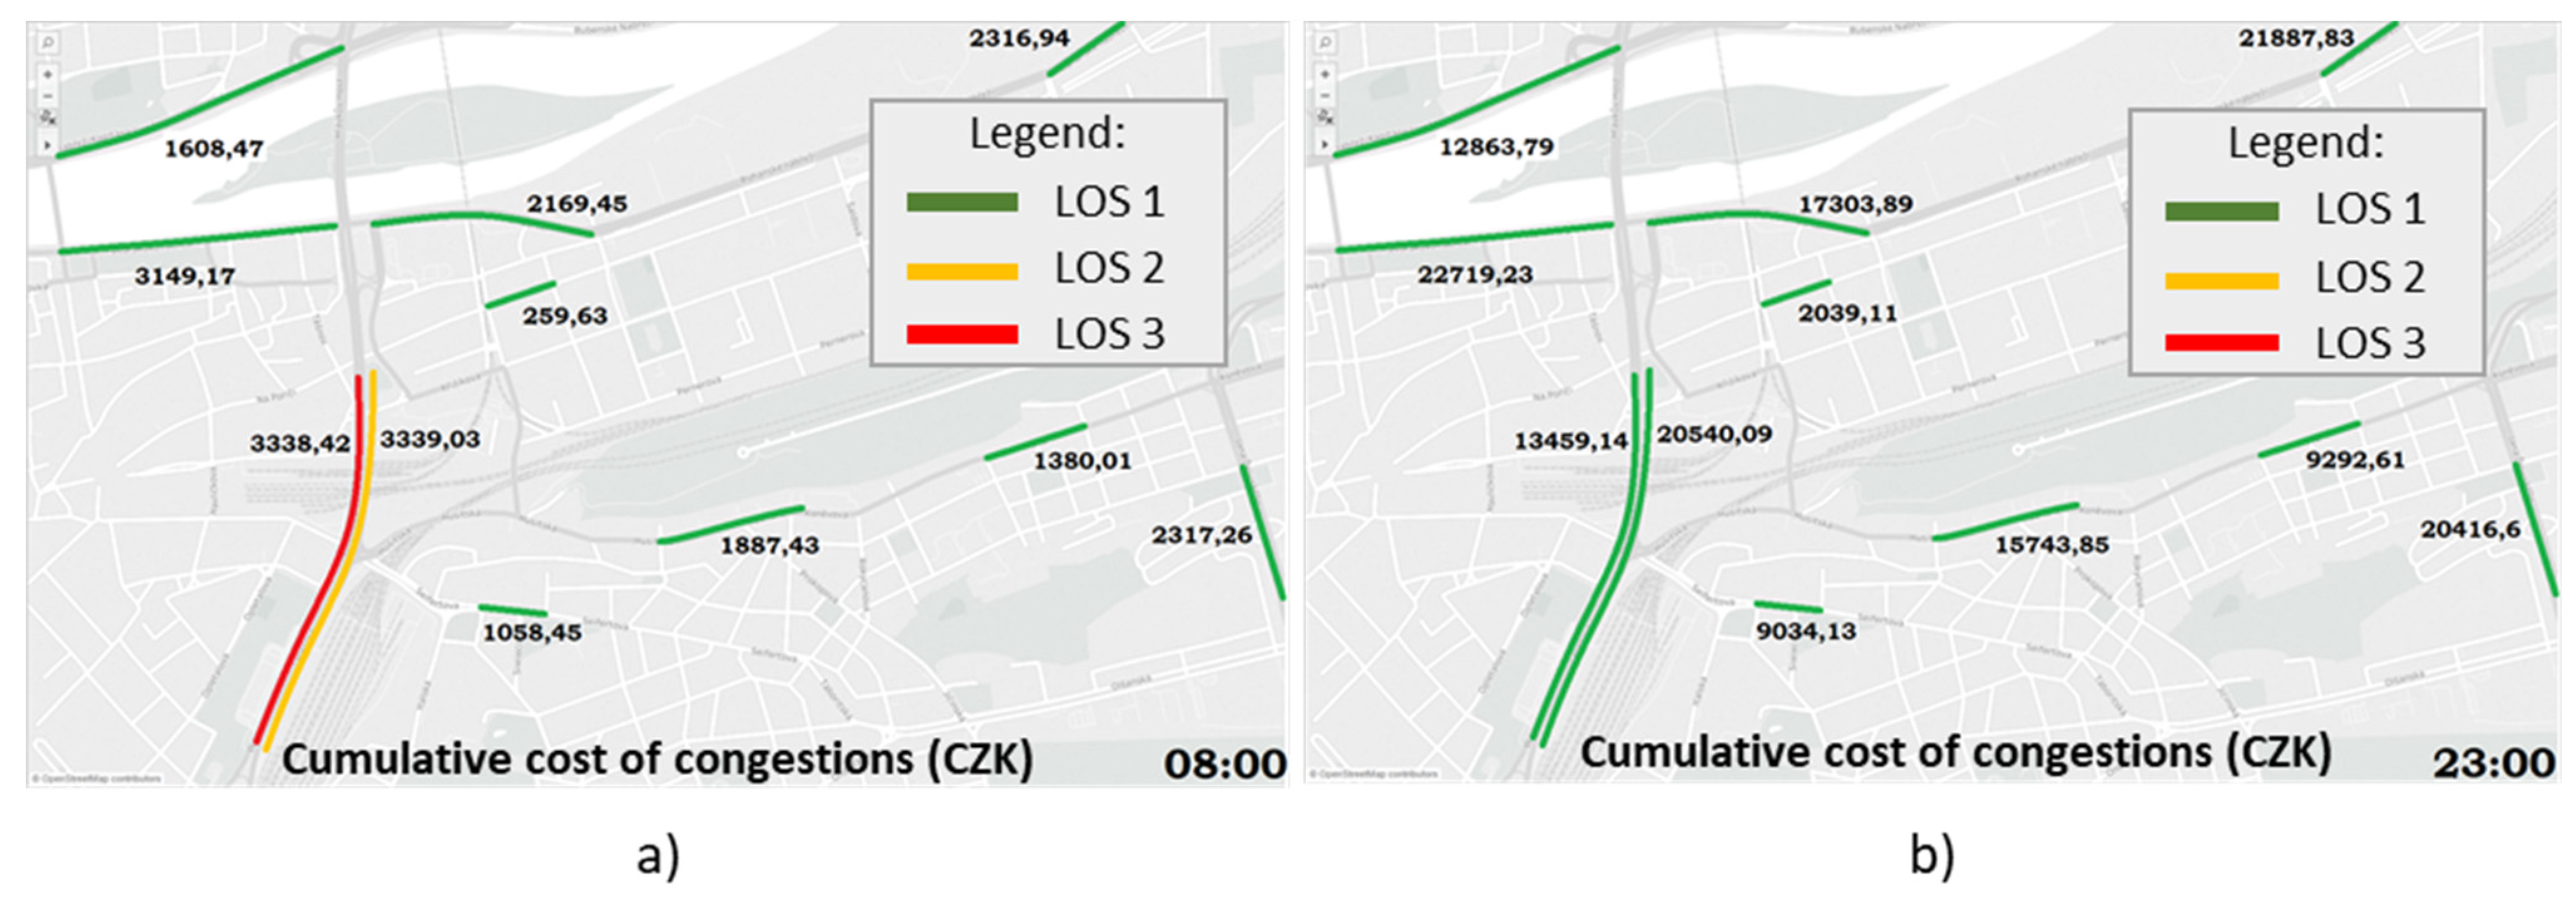
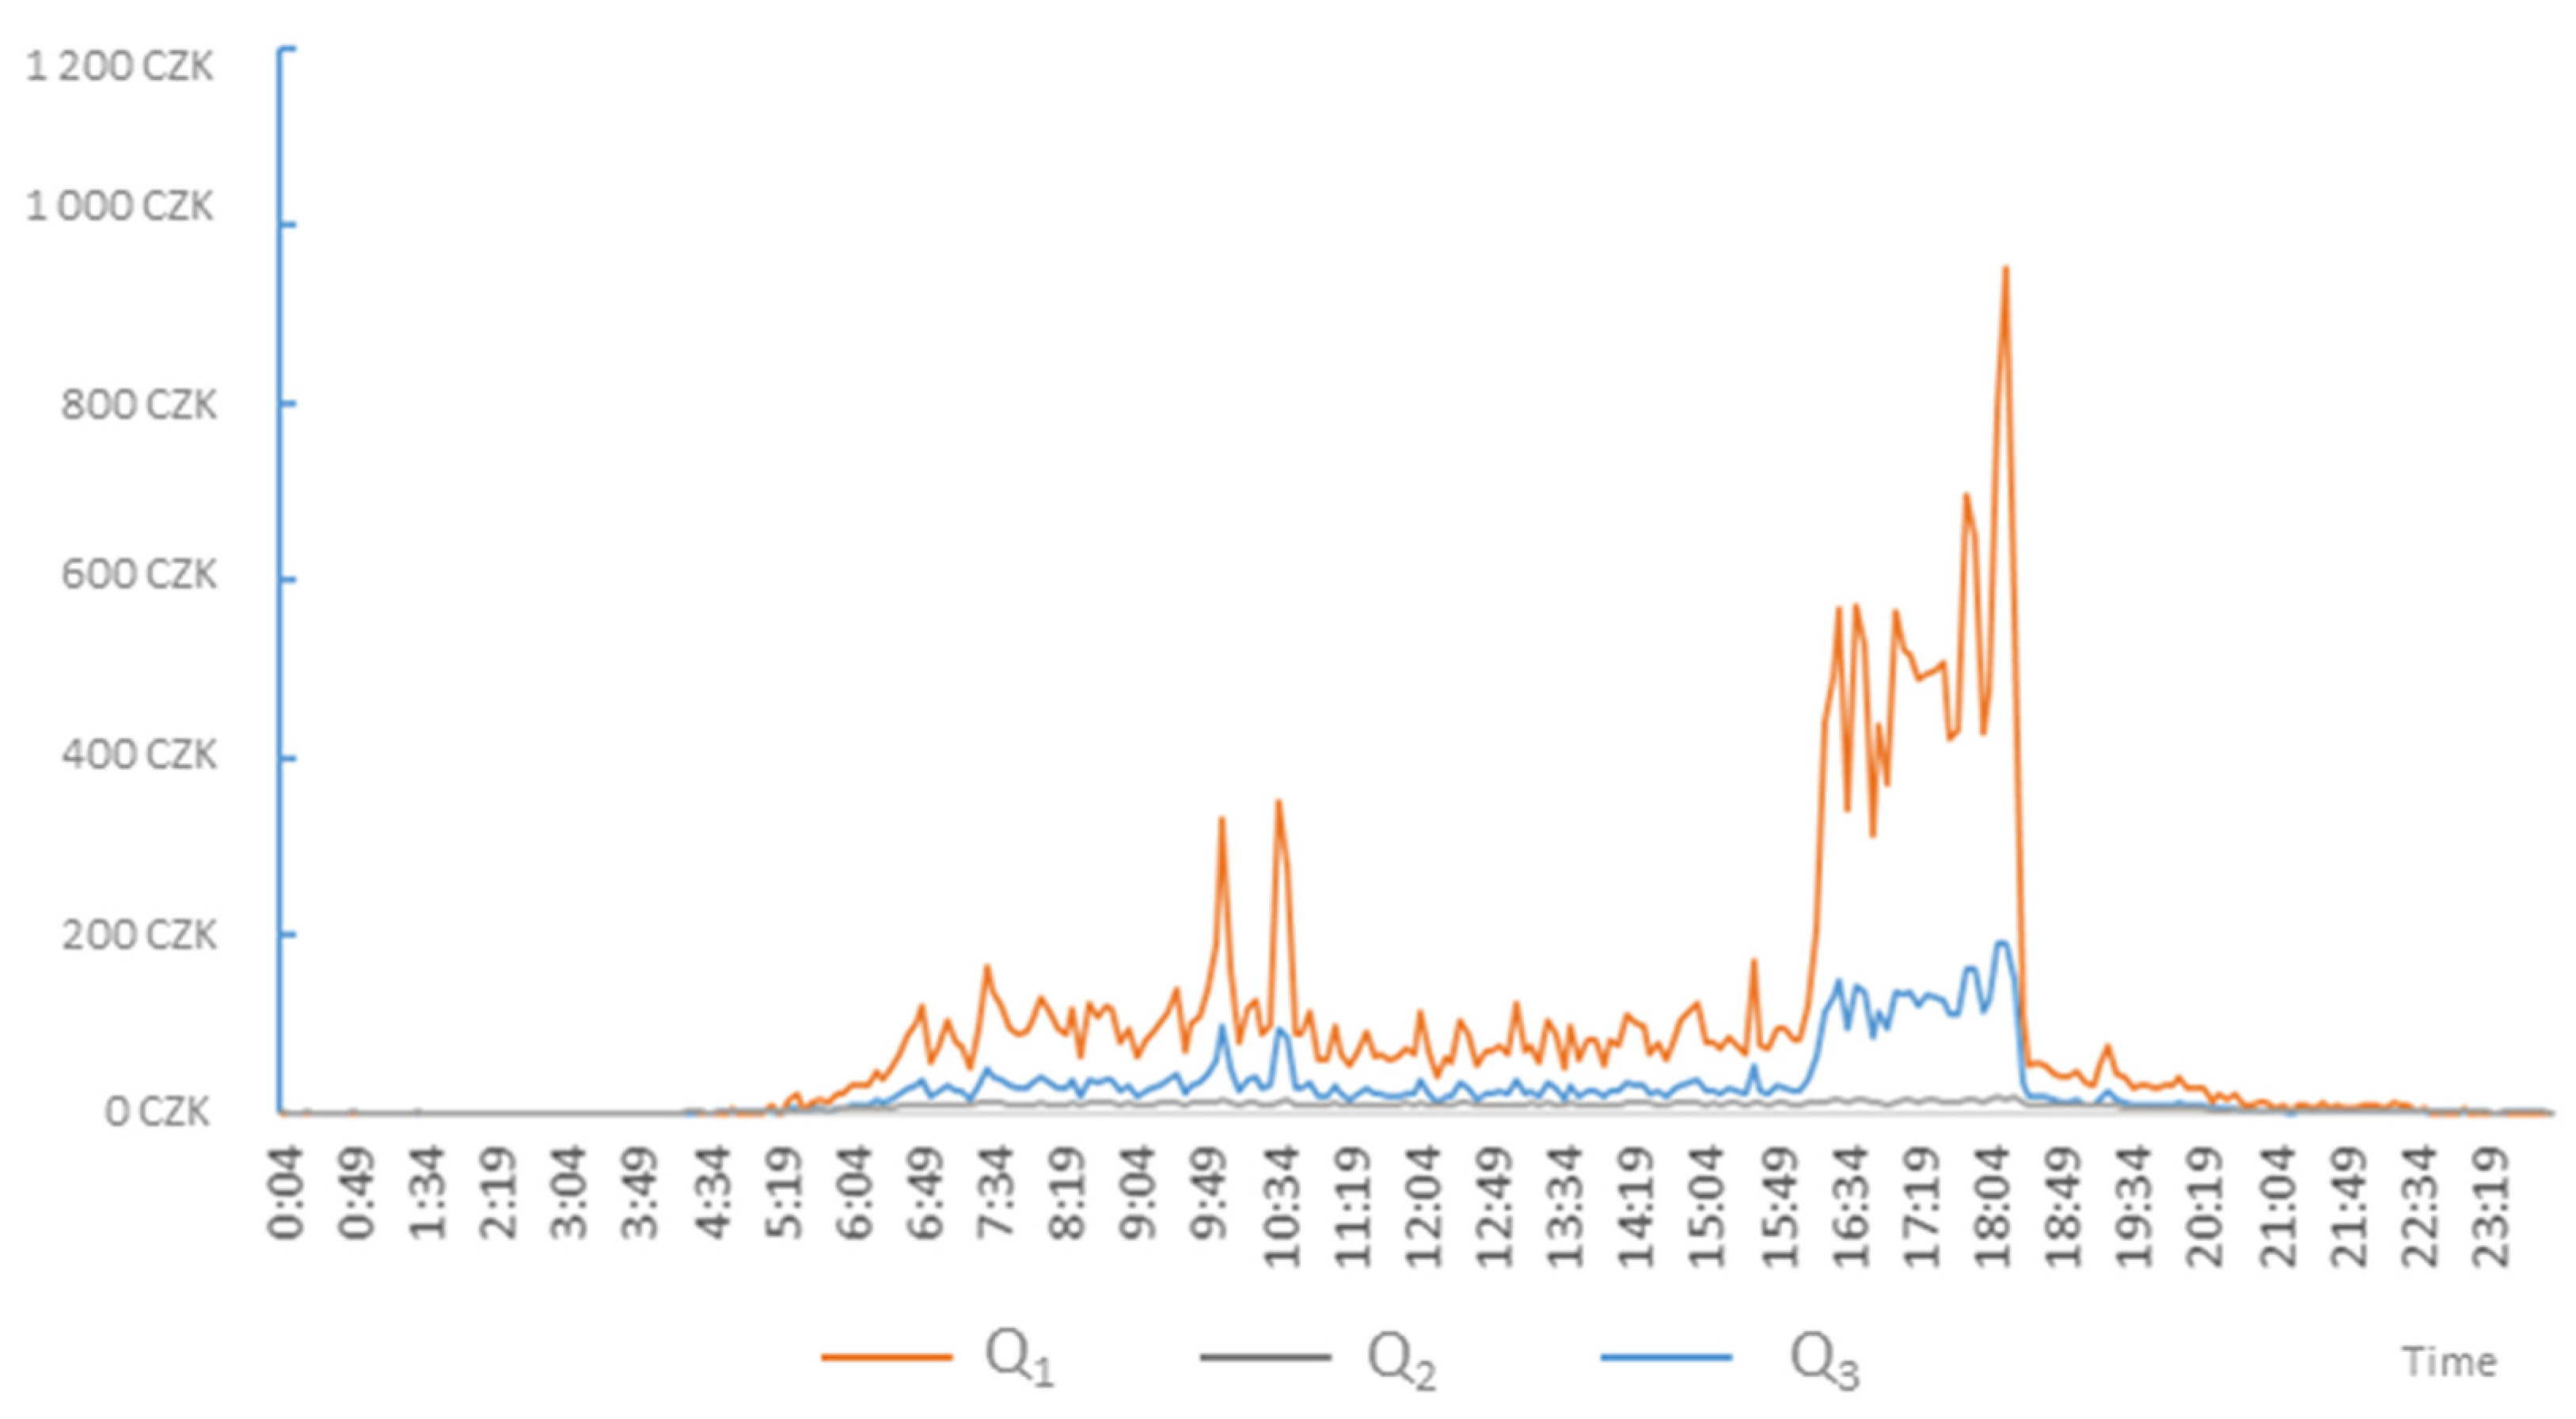
  • Total cost, which provides the aggregated and cumulative cost of congestions in millions of Czech crowns;
  • Index, which is just an indication of the impact of the daily sum of flows on the total price by dividing it by the variable sum of flows;
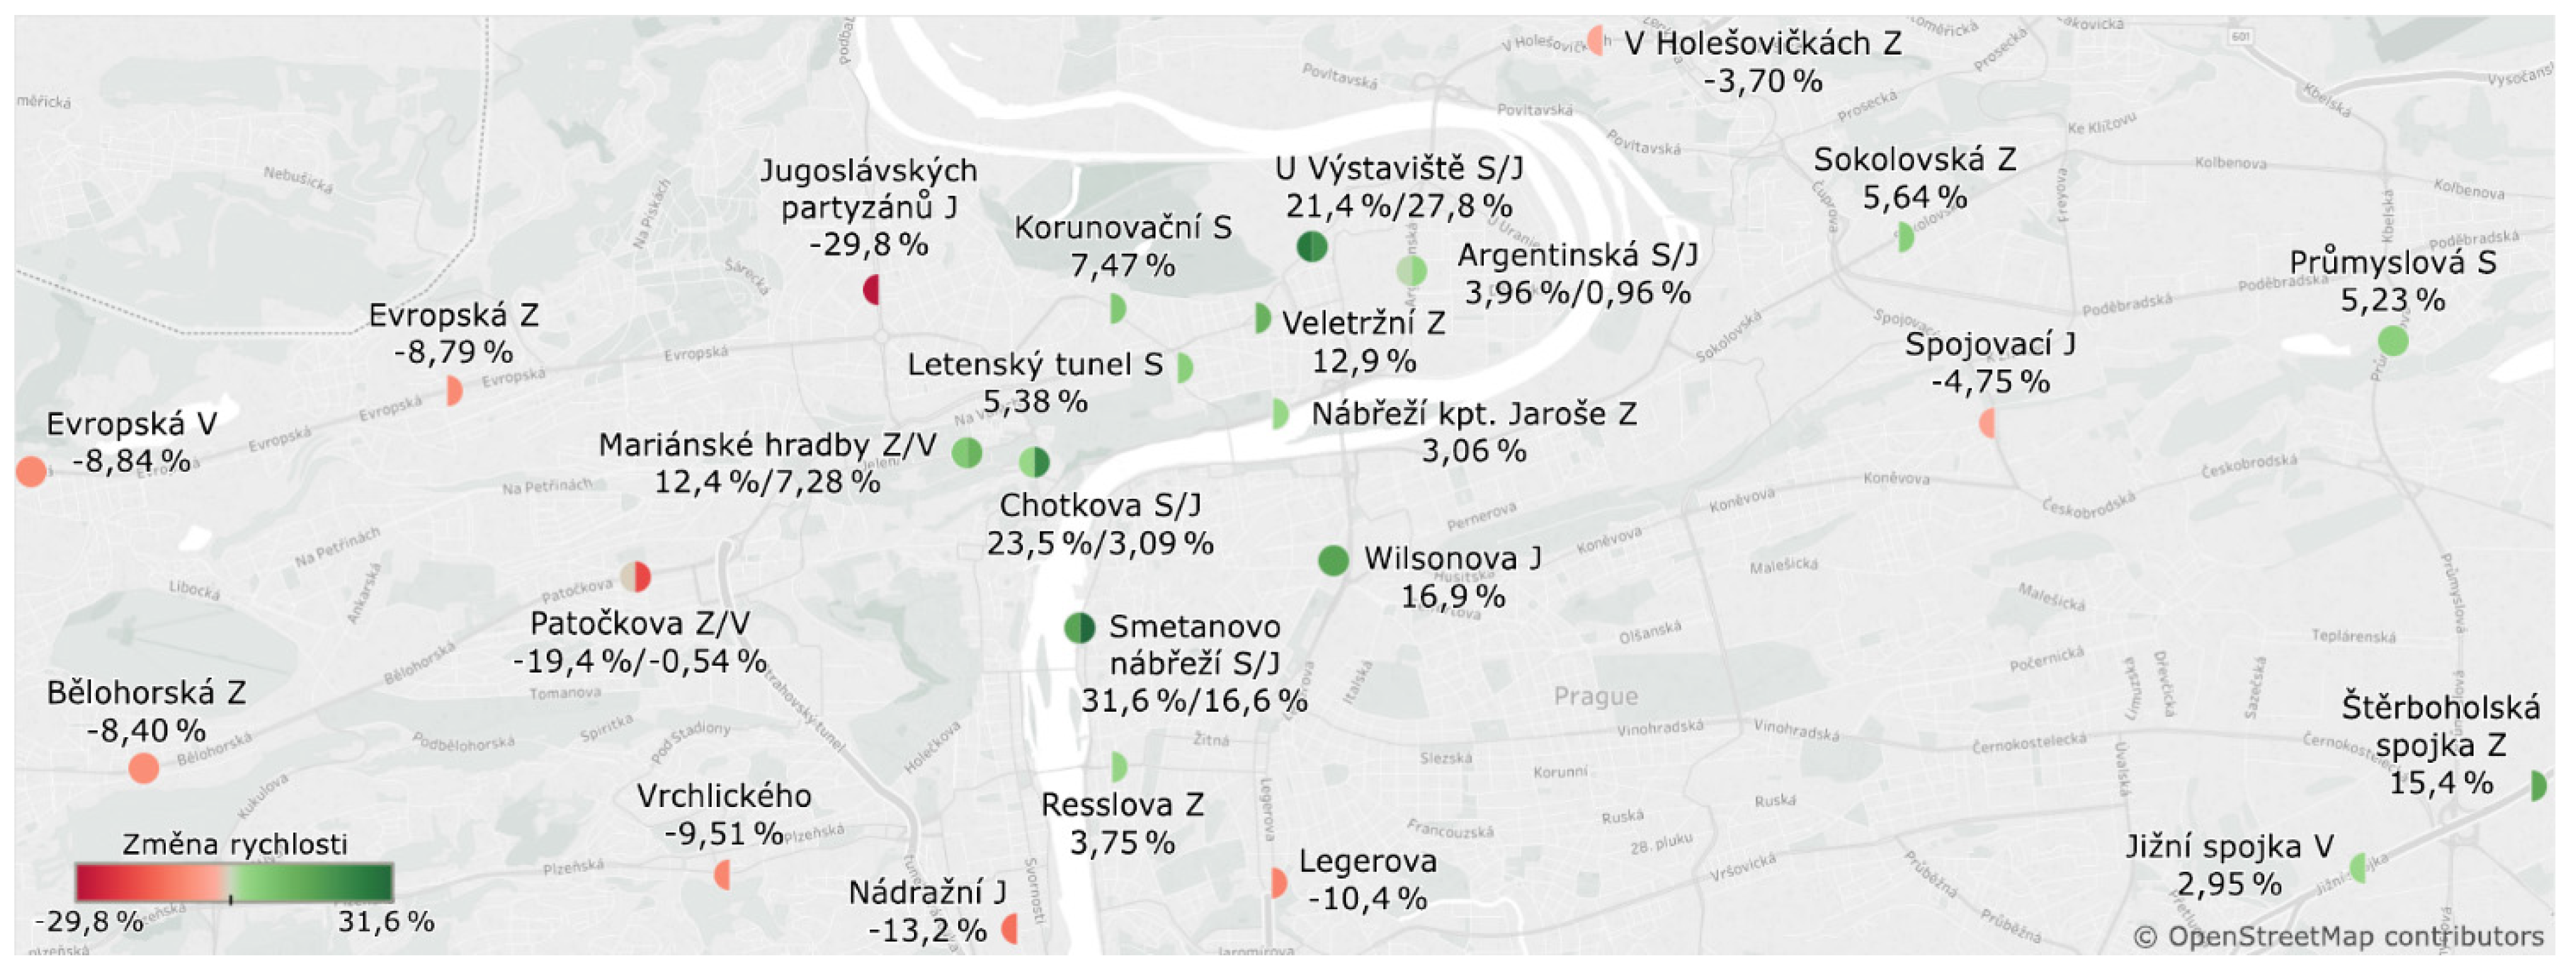
  • Average speed.
The first part of the table focuses on weekends. We can see that there was a decrease in the total flow outside of the tunnel (−2.21%). This can mean that since the traffic is lower, more people selected to travel through the tunnel. This leads to a decrease in the total price for congestion by about 623 thousand CZK per day.
During the week, there is not only the traffic in the tunnel, but the sum of flows within the city increased by over 2.2%. Even for this increase in traffic flow, there is a decrease in the cost of congestion of about 596 thousand CZK. In both cases we also observe an increase in the average speed and especially for the weekday decrease in the Index.
Even more substantial increases of traffic (and thus deterioration of the traffic flow characteristics such as average speed) is expected if the tunnel is closed nowadays. All of the induced traffic will play an essential role to that. The tunnel attracts daily over 80,000 vehicles that in case of closure of the tunnel must disperse into the city.

4. Discussion

An urban tunnel is often presented using the word “Smart”. In most cases, it however focuses on using new technologies, such as automated incident detection [34], emergency management and lighting [35], energy efficiency [36], or, for example, predictive maintenance [37]. Our aim is to move beyond new technology to integrated control strategies.
Li et al. [38] classifies a road tunnel into so-called urban underground infrastructure. They claim (for example, with Shanghai and other world cities) it to be an important part of current and future megacities. The authors confirm our conclusions that proper integration and effective and joint management of various city subsystems is essential. The impact of proper integration on sustainability is further elaborated for example in [39,40] and on an example of urban utility tunnels also [41].
The importance of implementing the cooperative control strategies is further discussed in [42]. Haddad et al. claim that a highway management without proper integration to adjacent urban intersection controllers is not sufficient. They provided a model for the mixed environment and used model predictive control to optimize the traffic control at the intersections, ramp metering and speed harmonization. Our paper clearly focuses on a similar approach, when the adjacent city network influences the parameters of the tunnel control system. As part of our control design, we managed to convert the cooperative tunnel management into a well-known method of harmonizing traffic flow described in [43,44]. It is therefore possible to use these control results to determine the required key performance indicators (KPIs) of whole district area.
The presented results of this paper are in accordance with the ongoing fourth industrial revolution [45], the basic feature of which is the interconnection of sub-subsystems into more complex system. The importance of understanding the distributed nature of the control problem was described in [46]. An example of this trend is also the concept of smart cities and the interconnection of its elements, such as the road urban tunnel. The subsystems can no longer be controlled by standard methods based on the collection and processing of local data, but it is necessary to use artificial intelligence algorithms that can work with knowledge bases based on ontologies and perform more sophisticated decision-making and management of these complex systems [47].
In order to be able to specify the impact of certain control strategies on the entire city, we have moved beyond the traditional key performance indicators (KPIs) [48]. We offered a solution to measure the environmental and social impact of congestions by its monetary equivalent. This allows the control strategies to take into account integration of various subsystems in a distributed environment.
In this paper, we focused on an example of how to approach the management of a road urban tunnel with knowledge of the traffic situation in its neighborhood. The above results show that even if the tunnel is controlled so that the passage of vehicles is minimal, it is far better than if it was closed, as is the case today. Although its closure solves the local situation inside the tunnel, it significantly worsens the traffic in the surrounding district. If other elements of transport infrastructure are managed by similar methods, it is possible to expect better transport throughput and the achievement of a better quality of life in these cities.

5. Conclusions

Within this paper, a system analysis of both the tunnel as a complex system and the method of its integration into the smart city concept was presented. The result of the analysis yields to the conclusion that the road urban tunnel integration into the concept of smart city can bring many benefits to municipality and also to drivers.
The level of service (LOS) was introduced, which represents the transport quality in the whole district based on quantification of congestion prices, namely financial implication of the loss of drivers’ time, financial impacts of transport on the environment and energy losses in the whole area. The required parameters were obtained for Blanka tunnel in Prague thanks to the described GLOMODO (global model of traffic in the capital Prague) system.
The current practice of many cities, which include a road urban tunnel, deals with tunnel control by closing the tunnel in the case of congestion to prevent congestion inside the tunnel. It is a logical and local solution, since congestion in the tunnel is expensive in terms of ventilation and other support services. On the other hand, it will significantly worsen congestion outside the tunnel itself.
For these reasons, a new “road urban tunnel control algorithm” has been proposed, which would not only contain two states “open” and “closed”, but which would let vehicles enter into the tunnel in small amount and maintain the traffic flow within the transition phase between fluid and jam traffic. Experiments performed in the Blanka tunnel in Prague have shown that even such a small traffic flow can significantly contribute to solving a complex traffic situation in the entire area.
In the future, we intend to develop more advanced road urban tunnel control algorithm, based on the principle of fuzzy methods, which allows the control strategy to be adapted to the specific construction and traffic parameters of a given tunnel.
The results presented here were demonstrating the working principle of the algorithm. In order to have more clear view on the real impact of the method on tunnel as well as city parameters, a large-scale study will be conducted. Here also the environmental aspects shall be measured.
The paper can be understood as a methodology for the integration of similar infrastructural elements (bridges, railway crossing, etc.) and their management into a complex system for a smart city. Thanks to the knowledge of a wider area (neighborhood, district, etc.) than the element itself, it is possible to achieve better sustainability of a specific part of the city and to increase resilience of the whole solution.

Author Contributions

Conceptualization, O.P., P.P. and M.S.; methodology, O.P., P.P. and M.S.; validation, M.S.; writing—original draft preparation, P.P., O.P. and M.S.; writing—review and editing, O.P. All authors have read and agreed to the published version of the manuscript.

Funding

This research was funded by the European Regional Development Fund under the project AI & Reasoning (reg. No. CZ.02.1.01/0.0/0.0/15_003/0000466).

Institutional Review Board Statement

Not applicable.

Informed Consent Statement

Not applicable.

Conflicts of Interest

The authors declare no conflict of interest.

References

  1. Ruhlandt, R.W.S. The governance of smart cities: A systematic literature review. Cities 2018, 81, 1–23. [Google Scholar] [CrossRef]
  2. Schmitz, P. PIARC Road Tunnels Manual. PIARC. Version 2019. Available online: https://tunnelsmanual.piarc.org/en (accessed on 1 November 2021).
  3. Rzevski, G.; Skobelev, P. Managing Complexity; WIT Press: Southampton, UK, 2014. [Google Scholar]
  4. Grösser, S.N. Complexity management and system dynamics thinking. In Dynamics of Long-Life Assets; Springer: Singapore, 2017; pp. 69–92. [Google Scholar]
  5. PIARC. Technical committee 3.3 road tunnel operation. In Proceedings of the Road Tunnels: Complex Underground Road Networks (2016R19EN), Da Nang, Vietnam, 23–25 October 2013; ISBN 978-2-84060-404-4. [Google Scholar]
  6. Flint, R.W. Basics of Sustainable Development. In Practice of Sustainable Community Development; Springer: Singapore, 2012; pp. 25–54. [Google Scholar]
  7. Dong, Y.; Xu, J.; Liu, X.; Gao, C.; Ru, H.; Duan, Z. Carbon emissions and expressway traffic flow patterns in China. Sustainability 2019, 11, 2824. [Google Scholar] [CrossRef] [Green Version]
  8. Fraihat, A. Computer networking layers based on the OSI model. Test Eng. Manag. 2021, 83, 6485–6495. [Google Scholar]
  9. Svítek, M.; Votruba, Z.; Moos, P. Towards information circuits. Neural Netw. World 2010, 20, 241–247. [Google Scholar]
  10. Přibyl, P.; Přibyl, O.; Svítek, M.; Janota, A. Smart city design based on an ontological knowledge system. In Communications in Computer and Information Science; Springer: Singapore, 2020; Volume 1289, pp. 152–164. [Google Scholar]
  11. Luin, B.; Petelin, S. Coupling models of road tunnel traffic, ventilation and evacuation. Transport 2020, 35, 336–346. [Google Scholar] [CrossRef] [Green Version]
  12. Svítek, M. Information Physics-Physics-Information Analogies for Complex Systems Modelling; Elsevier: Amsterdam, The Netherlands, 2021; ISBN 978-0-323-91011-8. [Google Scholar]
  13. He, F.; Yan, X.; Liu, Y.; Ma, L. A traffic congestion assessment method for urban road networks based on speed performance index. Procedia Eng. 2016, 137, 425–433. [Google Scholar] [CrossRef] [Green Version]
  14. Přibyl, P.; Přibyl, O.; Faltus, V.; Hrdina, L.; Matowicki, M. Methodology for determining price of congestions in Prague (in Czech-Metodika Kvantitativního hodnocení kongescii V HL. M. PRAZE). Res. Rep. 2019, 51. [Google Scholar]
  15. Pribyl, O.; Koukol, M.; Kuklová, J. Computational intelligence in highway management: A review. Promet-Traffic Transp. 2015, 27, 439–450. [Google Scholar] [CrossRef] [Green Version]
  16. Tympakianaki, A.; Koutsopoulos, H.N.; Jenelius, E. Anatomy of tunnel congestion: Causes and implications for tunnel traffic management. Tunn. Undergr. Space Technol. 2019, 83, 498–508. [Google Scholar] [CrossRef]
  17. Beneš, J.; Přibyl, O. Effects of highway management on traffic flow characteristics. Arch. Transp. Syst. Telemat. 7 2014, 2, 14–18. [Google Scholar]
  18. Faltus, V.; Hrdina, L. Systémové modelování přínosů tunelu Blanka. Silniční Obz. 2018, 79, 63–69. (In Czech) [Google Scholar]
  19. Helbing, D.; Treiber, M. Critical discussion of synchronized flow. Cooper. Transp. Dynam. 2002, 1, 2.1–2.24. [Google Scholar]
  20. Kühne, R. Foundation of traffic flow theory I: Greenshields legacy highway traffic. In Symposium on the Fundamental Diagram: 75 Years (Greenshields 75 Symposium) Transportation Research Board; Woods Hole: Falmouth, MA, USA, 2008. [Google Scholar]
  21. Greenshields, B.D. A study of highway capacity. Highw. Res. Rec. 1935, 14, 448–477. [Google Scholar]
  22. Yperman, I.; Logghe, S.; Immers, B. The link transmission model: An efficient implementation of the kinematic wave theory in traffic networks. In Proceedings of the 10th EWGT Meeting and 16th Mini-Euro Conference, Poznan, Poland, 13–16 September 2005. [Google Scholar]
  23. Kerner, B. Three-phase traffic theory and highway capacity. Phys. A Stat. Mech. Appl. 2004, 333, 379–440. [Google Scholar] [CrossRef] [Green Version]
  24. Wu, N. A new approach for modeling of Fundamental Diagrams. Transp. Res. Part. Policy Pr. 2002, 36, 867–884. [Google Scholar] [CrossRef]
  25. Gaffney, J.; Zurlinden, H. City Wide Coordinated Ramp Meters - Keeping Urban Motorways Safe and Efficient With City Wide Coordinated Ramp Meters. Int. Encycl. Transp. 2021, 10–20. [Google Scholar] [CrossRef]
  26. Papageorgiou, M. Overview of road traffic control strategies. IFAC Proc. 2004, 37, 29–40. [Google Scholar] [CrossRef]
  27. Gartner, N.; Messer, C.J.; Rathi, A.K. Traffic Flow Theory-A State-of-the-Art Report: Revised Monograph; Turner-Fairbank Highway Research Center: McLean, VA, USA, 2002; p. 386. [Google Scholar]
  28. Yu, G.; Liu, J. A hybrid prediction approach for road tunnel traffic based on spatial-temporary data fusion. Appl. Intell. 2019, 49, 1421–1436. [Google Scholar] [CrossRef]
  29. Lana, I.; Olabarrieta, I.I.; Del Ser, J.; Rodriguez, L. Data-driven predictive modeling of traffic and air flow for the improved efficiency of tunnel ventilation systems. In Proceedings of the 2020 IEEE 23rd International Conference on Intelligent Transportation Systems (ITSC), Rhodes, Greece, 20–23 September 2020; pp. 1–6. [Google Scholar]
  30. Lv, Y.; Duan, Y.; Kang, W.; Li, Z.; Wang, F.-Y. Traffic flow prediction with big data: A deep learning approach. IEEE Trans. Intell. Transp. Syst. 2014, 16, 865–873. [Google Scholar] [CrossRef]
  31. Guo, J.; Chen, F.; Xu, C. Traffic flow forecasting for road tunnel using PSO-GPR algorithm with combined kernel function. Math. Probl. Eng. 2017, 2017, 2090783. [Google Scholar] [CrossRef] [Green Version]
  32. Balal, E.; Cheu, R.L. Comparative evaluation of fuzzy inference system, support vector machine and multilayer feed-forward neural network in making discretionary lane changing decisions. Neural Netw. World 2018, 28, 361–378. [Google Scholar] [CrossRef] [Green Version]
  33. Koukol, M.; Přibyl, O. Fuzzy algorithm for highway speed Harmonisation in VISSIM. In Robotics; Springer: Singapore, 2013; pp. 459–467. [Google Scholar]
  34. Fed4sae (Federated Cps Digital Innovation Hubs for the Smart Anything Everywhere Initiative) Website. Available online: https://fed4sae.eu/innovative-projects/smart-tunnel/ (accessed on 15 August 2021).
  35. Smartcitystreets Website. Available online: https://smartcitystreets.com/tunnels/ (accessed on 15 August 2021).
  36. Schreder Website. Available online: https://www.schreder.com/en/projects/smart-tunnel-lighting-solution-ensures-safety-comfort-velser-tunnel (accessed on 15 August 2021).
  37. Smart Tunnel Project Website. Available online: https://wtc2023.gr/smart-tunnel-project/ (accessed on 15 August 2021).
  38. Li, H.Q.; Fan, Y.Q.; Yu, M.J. Deep Shanghai project–A strategy of infrastructure integration for megacities. Tunn. Undergr. Space Technol. 2018, 81, 547–567. [Google Scholar] [CrossRef]
  39. von der Tann, L.; Ritter, S.; Hale, S.; Langford, J.; Salazar, S. From urban underground space (UUS) to sustainable underground urbanism (SUU): Shifting the focus in urban underground scholarship. Land Use Policy 2021, 109, 105650. [Google Scholar] [CrossRef]
  40. Translator Qiao, Y.-K.; Peng, F.-L.; Sabri, S.; Rajabifard, A. Socio-environmental costs of underground space use for urban sustainability. Sustain. Cities Soc. 2019, 51, 101757. [Google Scholar] [CrossRef]
  41. Shahrour, I.; Bian, H.; Xie, X.; Zhang, Z. Use of smart technology to improve management of utility tunnels. Appl. Sci. 2020, 10, 711. [Google Scholar] [CrossRef] [Green Version]
  42. Haddad, J.; Ramezani, M.; Geroliminis, N. Cooperative traffic control of a mixed network with two urban regions and a freeway. Transp. Res. Part. B Methodol. 2013, 54, 17–36. [Google Scholar] [CrossRef] [Green Version]
  43. Diakaki, P.; Kotsialos, D.W. Review of Road Traffic Control Strategies; IEEE: Piscataway, NJ, USA, 2003; Volume 91, pp. 2041–2042. [Google Scholar]
  44. Přibyl, P.; Přibyl, O.; Apeltauer, T. Mobile highway telematics system on D1 highway in the Czech Republic. Proc. IEEE 2014, 91, 386–395. [Google Scholar]
  45. Lom, M.; Přibyl, O.; Svítek, M. Industry 4.0 as a Part of Smart Cities. In 2016 Smart Cities Symposium Prague (SCSP); IEEE: Piscataway, NJ, USA, 2016; ISBN 978-1-5090-1116-2. [Google Scholar]
  46. Mustapha, K.; Mcheick, H.; Mellouli, S. Smart cities and resilience plans: A multi-agent based simulation for extreme event rescuing. In Public Administration and Information Technology; Springer: Singapore, 2016; pp. 149–170. [Google Scholar]
  47. Janota, A.; Nemec, D.; Hruboš, M.; Pirník, R. Knowledge-Based Approach to Selection of Weight-in-Motion Equipment. Commun. Comput. Inf. Sci. 2016, 640, 1–12. [Google Scholar] [CrossRef]
  48. Hara, M.; Nagao, T.; Hannoe, S.; Nakamura, J. New Key Performance Indicators for a Smart Sustainable City. Sustainability 2016, 8, 206. [Google Scholar] [CrossRef] [Green Version]
Figure 1. Sustainable development of a road tunnel: balance of safety, economy, and environment.
Applsci 11 10950 g001
Figure 2. Overview of strategic sensors located in Prague and used within the project GLOMODO.
Applsci 11 10950 g002
Figure 3. Main modules developed within the project GLOMODO.
Applsci 11 10950 g003
Figure 4. Comparison of fuel consumption (in liters per 100 km) according to models HERA COPERT and TRANSYT.
Applsci 11 10950 g004
Figure 5. The cumulative cost of congestions (in CZK) and the level of service (LOS 1—green; LOS 2—yellow; LOS 3—red) as computed for an example network in Prague at (a) 8 a.m. and (b) 11 p.m.
Applsci 11 10950 g005
Figure 6. An example demonstrating the split of the cost of congestions (in CZK) to particular contributing factors Q_i during the day.
Applsci 11 10950 g006
Figure 7. Schematic overview of the tunnel complex Blanka.
Applsci 11 10950 g007
Figure 8. Changes in the average speed on selected sensors after opening the tunnel complex Blanka.
Applsci 11 10950 g008
Figure 9. The fundamental diagram.
Applsci 11 10950 g009
Figure 10. Data measured on Strakonicka street in Prague (October 2015) demonstrating the fluid and jammed traffic states.
Applsci 11 10950 g010
Figure 11. The hysteresis within transition phase between fluid and jam traffic.
Applsci 11 10950 g011
Figure 12. Flow chart for the proposed new road urban tunnel traffic control algorithm.
Applsci 11 10950 g012
Figure 13. Schematic depiction of the road urban tunnel traffic control algorithm.
Applsci 11 10950 g013
Figure 14. The average speed index over all sensors during the measurement days.
Applsci 11 10950 g014
Table 1. BEFORE-AFTER analysis results with respect to changes in the traffic flow (veh), total cost (mio CZK), index and average speed (km/h).
Day of WeekPhaseSum of Flow (veh/day)Total Cost (mio CZK)Index: Total Cost Divided by Sum of FlowAverage Speed (km/h)
SundayBEFORE 3,017,26118.976.2953.8
SundayAFTER2,950,67418.356.2254.9
Change (%)−2.21%−3.28%−1.10%1.99%
TuesdayBEFORE 4,351,69331.507.2450.5
MondayAFTER4,447,79730.906.9551.5
Change (%)2.21%−1.89%−4.01%1.99%
Publisher’s Note: MDPI stays neutral with regard to jurisdictional claims in published maps and institutional affiliations.

