Article

Development of a Microwave-Assisted Extraction Protocol for the Simultaneous Determination of Mycotoxins and Pesticide Residues in Apples by LC-MS/MS

by
Natasa P. Kalogiouri
1,*,
Emmanouil-Nikolaos Papadakis
2,*,
Maria G. Maggalou
2,
George S. Karaoglanidis
3,
Victoria F. Samanidou
1 and
Urania Menkissoglu-Spiroudi
2
1
Laboratory of Analytical Chemistry, School of Chemistry, Faculty of Sciences, Aristotle University of Thessaloniki, 54124 Thessaloniki, Greece
2
Pesticide Science Laboratory, School of Agriculture, Faculty of Agriculture Forestry and Natural Environment, Aristotle University of Thessaloniki, 54124 Thessaloniki, Greece
3
Laboratory of Plant Pathology, School of Agriculture, Faculty of Agriculture Forestry and Natural Environment, Aristotle University of Thessaloniki, 54124 Thessaloniki, Greece
*
Authors to whom correspondence should be addressed.
Appl. Sci. 2021, 11(22), 10931; https://doi.org/10.3390/app112210931
Submission received: 29 October 2021 / Revised: 16 November 2021 / Accepted: 17 November 2021 / Published: 19 November 2021
(This article belongs to the Special Issue Analysis of Contaminants and Residues in Food)

Abstract

:
The possible presence of contaminants, pesticide residues and mycotoxins, in agricultural commodities is a critical issue for food safety, causing great concern. In this work, a simple and rapid analytical method employing liquid chromatography–tandem mass spectrometry (LC-MS/MS) was developed for the simultaneous determination of pesticide residues and mycotoxins in apples. Microwave-assisted extraction (MAE) was used for sample preparation. The MAE protocol was optimized after evaluating the effects of the following extraction parameters: (a) extraction solvent, (b) acidic environment, (c) temperature, and (d) extraction time. The multiresidue MAE-LC-MS/MS method was validated for linearity, accuracy (bias and precision), limits of detection (LODs), limits of quantification (LOQs), and matrix effect. The validation of the method was carried out according to the SANTE/12682/2019 document. The method demonstrated good linearity with R2 ≥ 0.99, acceptable accuracy in the recovery rate range 70–116%, acceptable interassay precision with RSD% ≤ 20, and low LODs and LOQs in the ranges 0.005–0.015 μg/g and 0.01–0.03 μg/g, respectively. Matrix effects were observed only for the 25% of the analytes. The performance of the MAE-LC-MS/MS method was compared to that of the QuEChERS sample preparation method, and the MAE-LC-MS/MS method proved to be rapid and effective.

1. Introduction

The safety of agricultural products is of great importance, and it is considered as part of their quality. Fruit safety can be compromised by various contaminants, entering any point of the food chain, including farming, storage, processing, and commercialization. Treatment of crops with pesticides may leave residues in products of plant origin and indirectly of animal origin, and phytopathogenic fungi produce toxic metabolites such as mycotoxins. The presence of mycotoxins and pesticide residues in food has a negative impact on public health, as their consumption causes lethal effects or long-term diseases [1,2]. Food and crops may contain different classes of contaminants, and for many of them, maximum limits have been established by the EU legislation [3].
Apple, due to its high nutritional value and unique organoleptic characteristics, is a highly valued agricultural product with high economic importance on a global scale. In Greece, apple is one of the most important tree crops. As with any other crop, apples can be affected by many pests, such as insects or plant pathogens, at any stage of cultivation in the farm or postharvest [2,4]. Therefore, several registered plant protection products are used, which can be harmful to human health and the environment [5,6]. Among plant pathogens, the mycotoxigenic fungi Alternaria spp. and Penicillium expansum are mainly responsible for the production of mycotoxins in apples, which can be harmful to humans and animals. Alternaria is a ubiquitous fungal genus that causes pre- and postharvest damage to agricultural products and along with Penicillium expansum and a few other pathogens causes up to 25% losses of total apple yield during postharvest storage and transport [4]. These postharvest apple losses are both quantitative due to fruit decay and qualitative due to possible mycotoxin contamination. Considering that large amounts of apple fruit are used for juice, the presence of mycotoxins is important for human consumption [2,4]. Alternaria species (e.g., A. alternata) produce more than 70 secondary metabolites, but only a few of them have been structurally identified and reported as mycotoxins [5]. Among these Alternaria toxins, altenuene (ALT), alternariol (AOH), alternariol monomethyl ether (AME), tentoxin (TEN), and tenuazonic acid (TEA) are the main ones of concern. Up to now, there are no specific international regulations for Alternaria mycotoxins in food and feed, and with the recent report, EFSA concludes that there is a need to develop more sensitive analytical methods and obtain more analytical data on Alternaria toxins in fruit and fruit products. Because of the potential presence of both mycotoxins and pesticides in agricultural products, methods for the simultaneous determination of these contaminants improve the time and reduce the cost of analysis. Therefore, the development of rapid, effective, high-throughput, and reliable multiresidue methods (MRMs) to verify food safety and integrity is required [6,7].
To such an end, robust analytical methodologies have been proposed in the literature with the aim of determining a large number of contaminants in a single run, including pesticides and mycotoxins that need to be monitored to guarantee the quality and safety of agricultural products. However, it is a demanding task to develop and apply a single analytical method for the simultaneous determination of a diverse group of compounds. Several strategies have been proposed in the literature based on capillary electrophoresis [8] and gas chromatography (GC) [9]. Several liquid chromatography (LC) methodologies report the simultaneous determination of a large number of contaminants in a single run [10]. LC in reversed phase (RP) or hydrophilic interaction (HILIC) enables the separation of a wide polarity range of contaminants commonly found in food at low concentration levels [11,12]. LC coupled to UV has been adopted as the official AOAC method for quantifying patulin in apple juice [13]. The coupling with mass spectrometry (MS) detectors enables high multiclass pesticide detection [10]. The use of high-resolution mass spectrometry (HRMS) enables the effective screening and tentative identification of a large number of species even without the need for standards [14].
Prior to the instrumental determination, sample preparation is the most important step. Several sample preparation protocols have been proposed to isolate pesticide residues and mycotoxins from foods, employing liquid–liquid extraction (LLE); solid-phase extraction (SPE); supercritical fluid extraction (SFE); accelerated solvent extraction (ASE); quick, easy, cheap, effective, rugged, and safe (QuEChERS); and microwave-assisted extraction (MAE), as has already been reviewed [6,15,16]. Several microextraction and miniaturized extraction techniques, such as solid-phase microextraction (SPME), liquid-phase microextraction (LPME), gas purge microsyringe extraction (GP-MSE) [17], fabric phase sorptive extraction (FPSE), stir bar sorptive extraction (SBSE), dispersive solid-phase extraction (d-SPE), and magnetic solid-phase extraction (MSPE), have been proposed for the extraction of contaminants [18,19]. The use of MAE presents several advantages, such as high extraction rate, automation, and the possibility of the simultaneous extractions of samples without interferences [20]. In recent years, the use of microwaves as a method of extracting ingredients, mainly from plant tissues, has been of great research interest. MAE is a process of using microwave energy to heat solvents in contact with a sample in order to transfer the substances to be analyzed from the substrate to the solvent, offering high sample throughput with low solvent consumption [21]. Extraction tests with the MAE method have also been reported for the mycotoxins ochratoxin A and zearalenone as well as for the group of cereal aflatoxins. However, there are no reports of the application of this method to patulin, citrinin, and mycotoxins of the genus Alternaria spp. [22,23,24].
The objective of this work was to develop and validate an MAE-LC-MS/MS analytical methodology for the simultaneous determination of two mycotoxins of the Alternaria genus (AOH, AME), two mycotoxins of the Penicillium genus (citrinin, patulin), and pesticide residues in apples. The use of MAE provided automation and rapidity during the extraction.

2. Materials and Methods

2.1. Chemicals and Reagents

Methanol (MeOH), acetonitrile (ACN), ethyl acetate (AcOEt), and water LC-MS grade and HPLC gradient grade were acquired from Chem-LabNV (Zedelgem, Belgium). Sodium chloride was purchased from Sigma-Aldrich (St. Louis, MO, USA). Anhydrous magnesium sulfate pro analysis grade was supplied by Alfa Aesar (Karlsruhe, Germany). Ammonium acetate LC-MS grade was purchased from Fluka (Buchs, Switzerland). Primary secondary amine (PSA) was supplied by Agilent Technologies (Santa Clara, CA, USA). Acetic acid 99.5% pro analysis grade was purchased from Carlo Erba reagents (Barcelona, Spain), and LC-MS grade was acquired from Fluka. Formic acid 99% was supplied by Carlo Erba reagents. The standard compounds abamectin 98%, acetamiprid 98%, acrinathrin 98%, alternariol (AOH) 96%, alternariol monomethyl ether (AME) 98%, boscalid 98%, bupirimate 98%, carbendazim 97%, chlorpyrifos 98%, citrinin 98%, clofentezine 98%, clothianidin 98%, cyproconazole 98%, cyprodinil 98%, deltamethrin 98%, difenoconazole 95%, etofenprox 98%, fenbuconazole 98%, fenpyroximate 98%, flonicamid 95%, fludioxonil 98%, flyopyram 98%, fluquinconzole 98%, flutriafol 95%, hexythiazox 98%, imazalil 98%, indoxacarb 95%, kresoxym methyl 95%, lambda-cyhalothrin 97%, methoxyfenozide 98%, myclobutanil 98%, patulin 98%, penconazole 98%, pirimicarb 98%, pyraclostrobin 98%, pyrimethanil 98%, pyriproxyfen 98%, spinosyn A 95%, spinosyn D 95%, spirodiclofen 98%, tau-fluvalinate 95%, tebuconazole 98%, tebufenozide 98%, tebufenpyrad 98%, thiabendazole 99%, thiacloprid 98%, thiamethoxam 98%, and trifloxystrobin 98% were acquired from Sigma-Aldrich (St. Louis, MO, USA).

2.2. Preparation of Stock and Working Standard Solutions

For the preparation of the stock standard solutions, each individual pure standard was weighed and dissolved in LC-MS grade MeOH at 1 mg/mL concentration level. Citrinin, alternariol, and alternariol monomethyl ether were dissolved in can, whereas patulin was dissolved in ethyl acetate. All the stock standard solutions were stored in glass vials at −20 °C until use. A mixed standard working solution of 40 mg/L containing all the aforementioned analytes was prepared by diluting the stock standard solutions in LC-MS grade MeOH. An intermediate mixed standard solution of 10 mg/L was prepared in LC-MS grade MeOH from the mixed standard solution of 40 mg/L, and then working standard solutions of 0.03, 0.05, 0.1, 0.15, 0.2, and 0.5 mg/L were prepared in MeOH.
Matrix-matched calibration standards were prepared by mixing 100 μL of the pesticide mixture standard working solutions and 900 μL of the mobile phase mixture (80% mobile phase A and 20% mobile phase B) used for LC-MS/MS analysis in the blank extract to reach the final concentrations of 0.03, 0.05, 0.1, 0.15, 0.2, and 0.5 mg/L. All the working standard solutions were kept in a freezer at −20 °C until use.

2.3. Instrumentation

A VORTEX agitator (Velp Scientifica Zx3, Milan, Italy); a centrifuge 5810 (Eppendorf, ValleyPark, MO, USA); a cooling centrifuge 5804 R (Eppendorf, ValleyPark, MO, USA); a TurboVap Concentrator (CalboVap Science, Hopkinton, MA, USA); and a MARS X microwave oven (CEM, Model 1000, Matthews, NC, USA) equipped with a 14-position holder, PTFE vessels, and stirring mechanism were used.
A liquid chromatography–mass spectrometry system consisting of a Surveyor LC pump and autosampler and a TSQ Quantum Discovery Max triple quadrupole mass spectrometer (Thermo Electron Corporation, Waltham, MA, USA) was used for analysis. The mobile phases consisted of water:methanol:acetic acid mixture 90:10:0.1, v/v, containing 5 mM of ammonium acetate (A), and water:methanol:acetic acid mixture 10:90:0.1, v/v, containing 5 mM of ammonium acetate, 10:90, v/v (B). The LC pump gradient program was as follows: 0–5 min, 20% mobile phase B; 5–16 min, 100% mobile phase B; 16–27.5 min, 20% mobile phase B. The mobile phase flow rate was 0–18.5 min at 0.2 mL/min flow rate, 18.5–25.5 min at 0.5 mL/min flow rate, and 25.5–27.5 min at 0.2 mL/min flow rate. A HyPurity C18 analytical column (150 mm × 2.1 mm, 5 μm particle size) supplied by Thermo Scientific (Waltham, MA, USA) was used for the chromatographic separation. The column oven temperature was set at 40 °C, the injection volume was 20 μL, and the total analysis time was 27.50 min. The MS system consisted of a triple quadrupole equipped with an electrospray ionization (ESI) source operated in positive and negative ion mode with the following parameters: sheath gas (nitrogen) pressure was 30 arbitrary units; auxiliary gas (nitrogen) pressure was 10 arbitrary units; spray voltage was 4000 V; capillary temperature was 325 °C. The collision gas pressure was 1.5 mTorr. Selected reaction monitoring (SRM) mode was set for the acquisition. Processing was carried out using the Xcalibur software (Thermo Scientific). For each compound, the respective standard solution (10 μg/mL) was infused directly in-to the MS/MS system for the optimization of the collision energy of the most abundant fragments, following the software’s automated procedure. The LC-MS/MS parameters are presented in the Supplementary Material, Table S1. Characteristic Total Ion Current and selected SRM chromatograms of an apple sample fortified at 0.01 μg/g level are presented in Figure S1.

2.4. Microwave-Assisted Extraction Optimization

MAE extraction was employed for the extraction of the analytes from the matrix. Portions of homogenized apple samples were weighed and transferred into the PTFE vessels. The samples were fortified with the standard mixture containing all the analytes at 0.1 μg/g concentration level, and then 20 mL of extraction solvent was added.
The extraction experiments involved the optimization of several parameters such as the extraction solvent (ACN, MeOH, AcOEt, and water), the extraction temperature (60, 80, and 100 °C), and the extraction time (5 and 10 min), and the addition of acids of different concentrations (acetic acid 5%, formic acid 1%).

2.5. Sample Preparation

Apple samples were chopped and stored at −20 °C until analysis. They were homogenized, and 5 g ± 0.2 portions were weighed and transferred to the microwave PTFE vessels. For the extraction, 20 mL of ACN and 0.2 mL of acetic acid were added. The vessels were agitated and a magnetic rod was added to each vessel for stirring. The extraction was carried out at 60 °C for 5 min. After the completion of the extraction, the PTFE vessels were removed from the microwave oven and remained at room temperature for 30 min until their temperature dropped. Then, the extracts were transferred in 50 mL Falcon tubes and centrifuged at 3000 rpm for 5 min. Then, 2 mL was collected from the supernatant and evaporated to dryness under nitrogen atmosphere at 15 psi and 35 °C. At this point, 0.5 mL of MeOH:mobile phase A (10:90, v/v) was used for reconstituting the samples, and finally, 20 μL was injected into the chromatographic system.

2.6. QuEChERS Extraction

The original QuEChERS method [25] was employed for comparing the efficiency of the proposed method to that of an established and well-reviewed one. Briefly, 10 g portions of homogenized apple were transferred into 50 mL Falcon tubes and 10 mL of ACN were added. The tubes were closed and shaken by vortex for 1 min. Subsequently, 4 g of anhydrous magnesium sulfate and 1 g of sodium chloride were added, and the samples were vortexed for another 1 min followed by centrifugation at 7000 rpm for 5 min. From the clear supernatants, 3 mL portions were transferred into 15 mL Falcon tubes containing 450 mg of anhydrous magnesium sulfate (fine) and 75 mg of PSA sorbent. The samples were vortexed again for 1 min and centrifuged at 4000 rpm for 5 min, and 1.5 mL portions of the supernatants were taken for solvent evaporation. Sample reconstitution was performed in 1.5 mL of MeOH:mobile phase A (10:90, v/v).

2.7. Method Validation

The analytical performance of the MAE-LC-MS/MS methodology was assessed by evaluating the linearity, accuracy (bias and precision), limit of detection (LOD), and limit of quantification (LOQ). The bias of the method was assessed by means of relative percentage of recovery (RE%) from spiked samples at 0.01, 0.03, 0.1, and 1 μg/g fortification level, according to the following equation:
RE % =     C   spiked   sample C   neat   sample C   standard × 100
where C spiked sample is the concentration of the analyte in a, C neat sample is the concentration of the extracted sample (control sample), and C standard is the concentration of the spike standard.
For each level of fortification, five replicates were analyzed (n = 5).
Precision was expressed as repeatability in terms of the relative standard deviation (RSD%) at 0.03 and 0.1 μg/g fortification levels. Repeatability, expressed as within-day precision (RSDr%), was assessed in ten replicates (n = 10), and reproducibility, expressed as between-days precision (RSDR%), was assessed after analyzing four spiked samples at 0.1 μg/g fortification level within one month (n = 4 × 3), according to the following equation:
RSD % =     RE %   standard   deviation RE %   mean × 100
where RE% standard deviation is the standard deviation (SD) of the RE% of each analyte and RE% mean is the mean concentration of each spiked sample, analyzed in three replicates.
LODs were calculated according to EURACHEM guidelines (EURACHEM 1998). Ten independent blank samples were fortified at the lowest acceptable concentration and processed in the chromatographic system. The LOD for each analyte was expressed as the analyte concentration corresponding to 3 times the SD. LOQs were determined as described in the European Commission (EC) Document No. SANTE/12682/2019 [26]. The LOQs were set as the lowest fortification levels for each analyte with acceptable bias (RE% = 70–120) and precision (RSDr% ≤ 20).
Matrix effect (ME) was estimated as the ratio of the slopes of the calibration curves prepared with matrix-matched standards to those of solvent-based standards, according to the following equation:
ME % = slope   of   matrix   matched   calibration   curve slope   of   solvent   based   standards   calibration   curve × 100

2.8. Statistics

Statistical evaluation of the results was carried out by SPSS 25.0. Tukey’s range test (a = 0.05) was used for all pairwise comparisons.

3. Results

3.1. Microwave-Assisted Extraction Optimization Results

Several parameters such as the extraction solvent (ACN, MeOH, AcOEt, and water), the extraction temperature (60, 80, and 100 °C), the extraction time (5 and 10 min), and the addition of acids of different concentrations (acetic acid 5%, formic acid 1%) were tested in an attempt to find the optimum parameters for the effective simultaneous extraction of the 49 analytes.

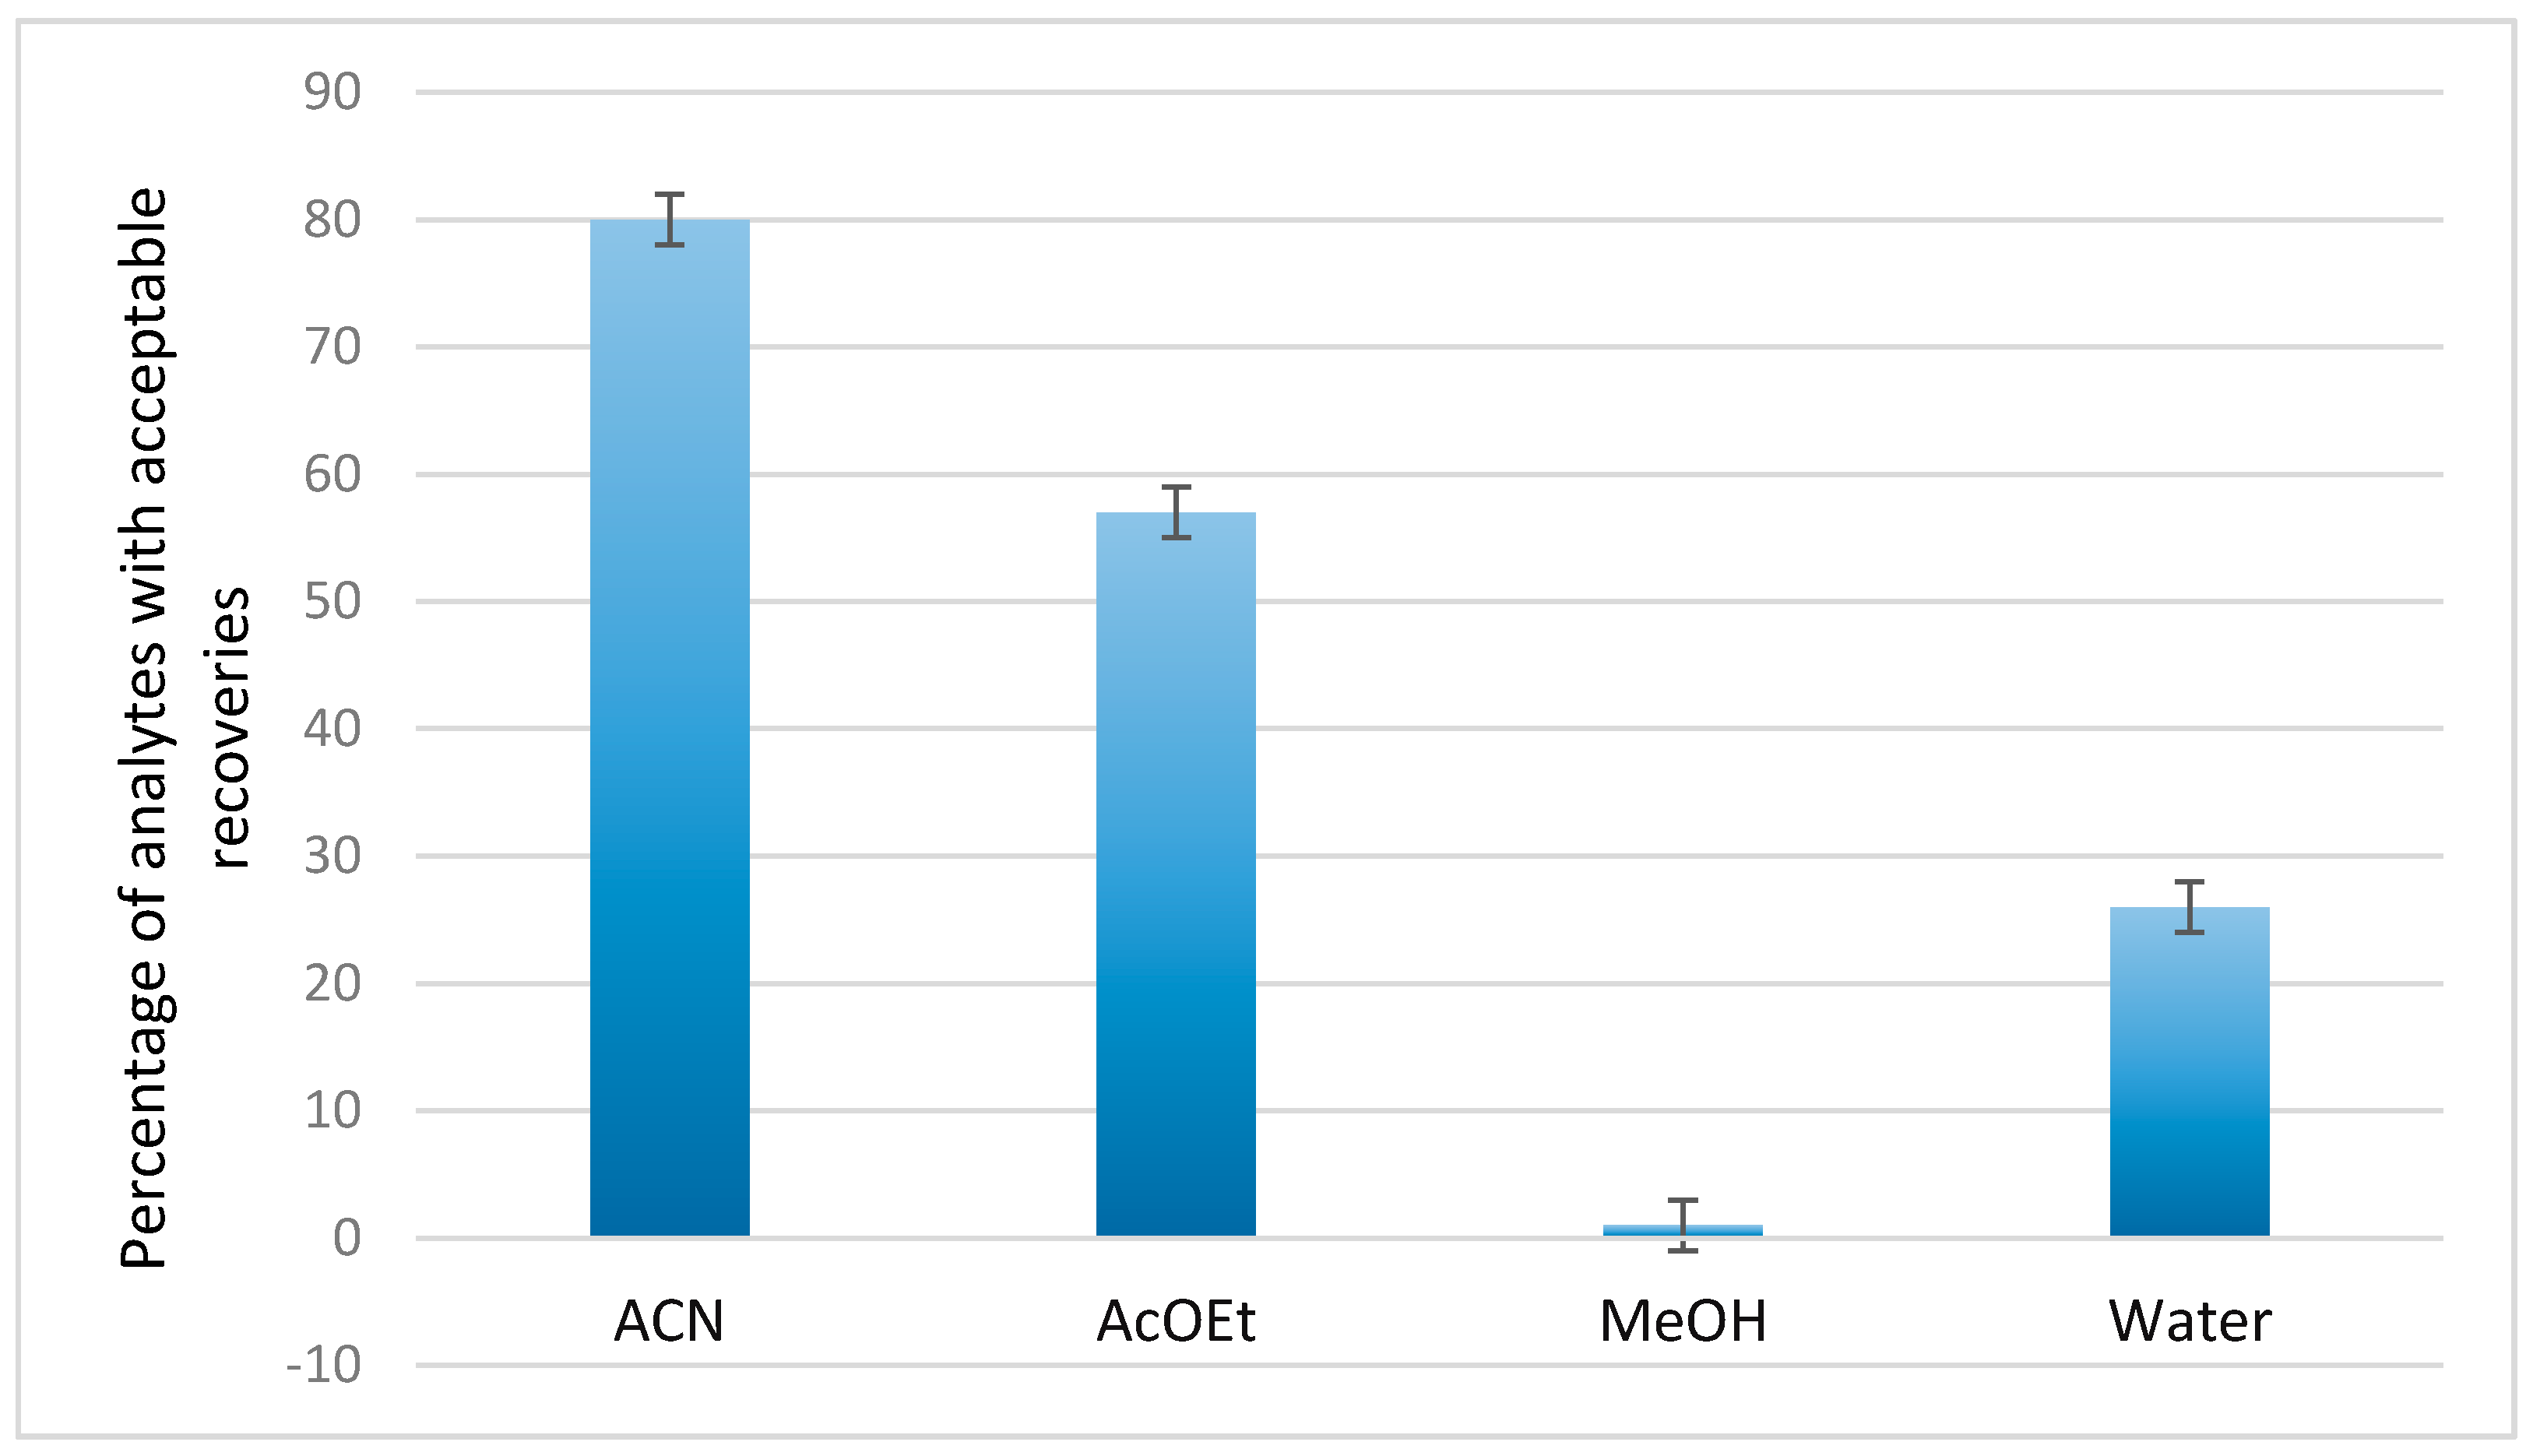
3.1.1. Extraction Solvent

For the development of the extraction method and the selection of the most appropriate solvent, experiments were performed using ACN, AcOEt, water, and MeOH as extraction solvents at 60 °C for 5 min. ACN and AcOEt were found to lead to satisfactory recoveries for a larger number of compounds compared to water and MeOH, according to the graph presented in Figure 1. The obtained RE% for all the analytes using different extraction solvents are presented in the Supplementary Materials, Table S2. According to the calculated RE%, the extraction using ACN resulted in acceptable recoveries (70–120%) for 80% of the analytes, while the use of AcOEt reduced the percentage of acceptable recovered compounds to 57%. Under the same parameters, water extraction was successful in extracting only 26% of the analytes, while the RE% obtained with MeOH as an extraction solvent were relatively low.
In general, ACN exhibits increased microwave absorption capacity and has already been successfully used in an MAE technique to extract pesticides from food matrices [27]. This solvent was also used to extract aflatoxins from cereals and was found to be most suitable compared to MeOH and AcOEt [24]. The use of AcOEt resulted in lower RE%, for all the analytes, except for the mycotoxins citrinin (CIT) and alternariol (AOH), for which the RE% increased when using AcOEt. The RE% of alternariol monomethyl ether (AME) were found to be at the same level as those obtained when ACN was used as the extraction solvent, while in the case of patulin the RE% when using AcOEt were low. These differences are due to the different solubility of each compound in different free extracts, which affects their extraction capacity.

3.1.2. Extraction Temperature
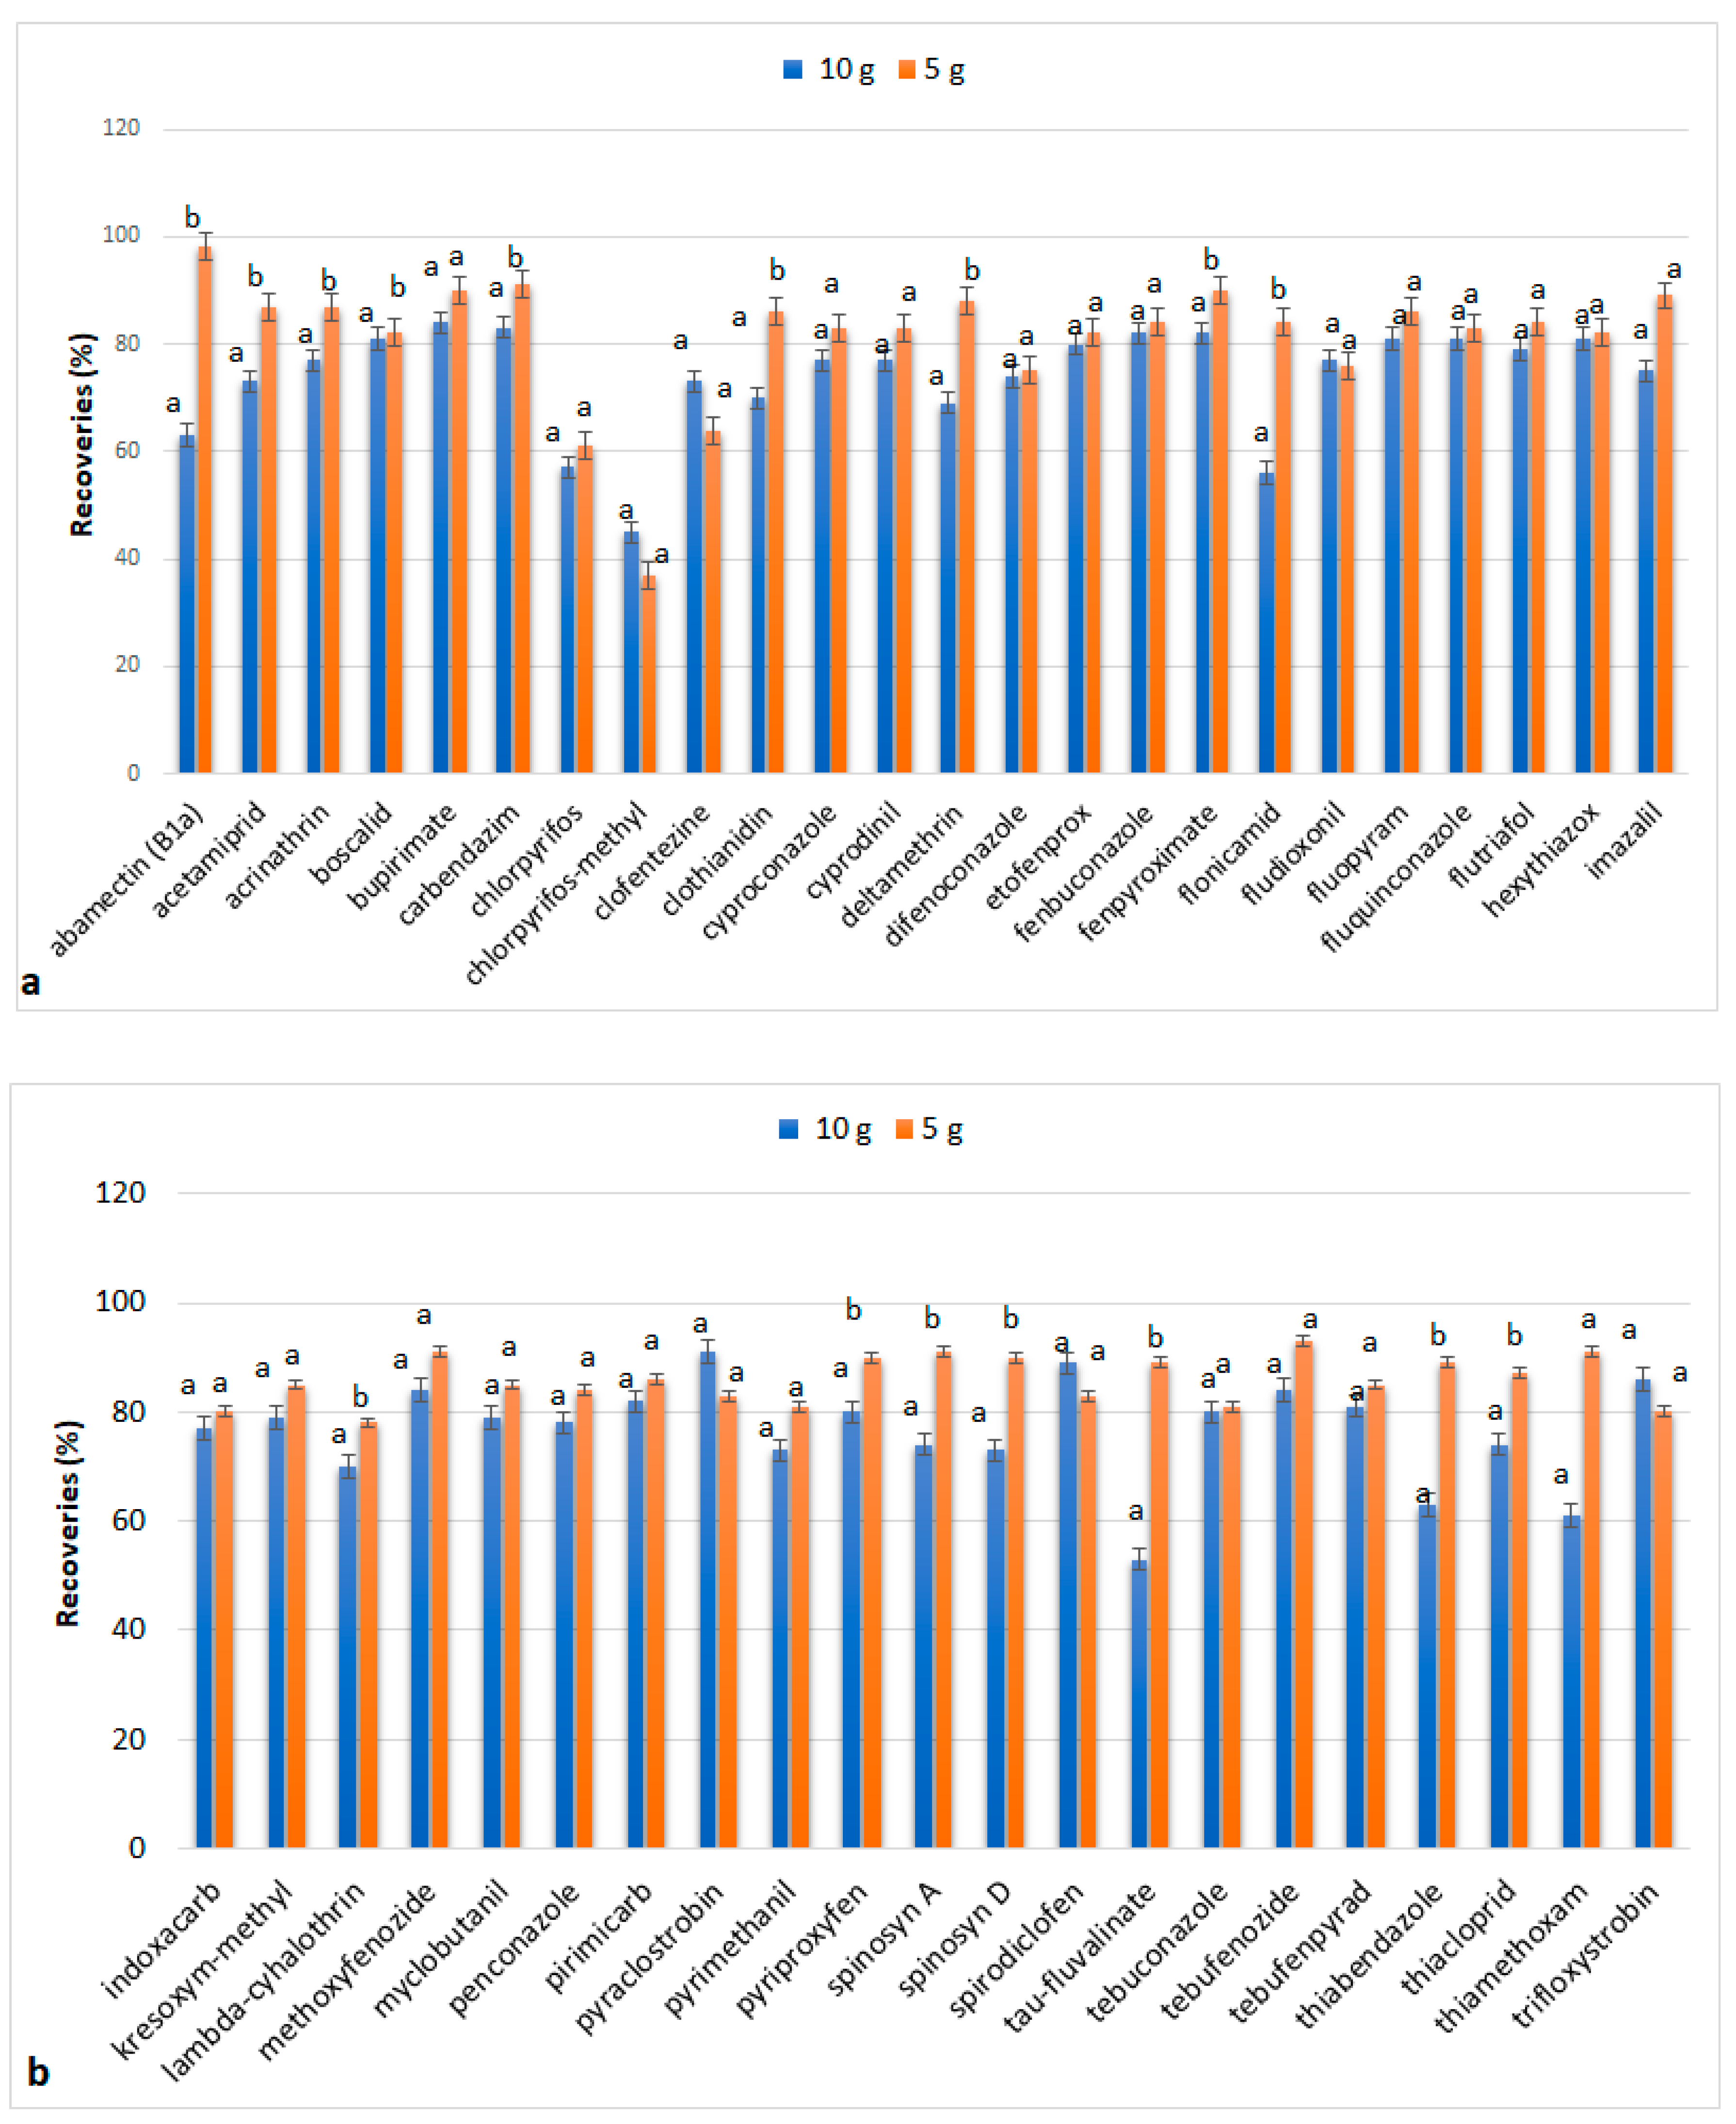
In subsequent experiments, the efficiency of the extraction method was studied at three temperature levels, 60, 80, and 100 °C, when using ACN and AcOEt as extraction solvents. The temperatures of 60 and 80 °C with AcOEt resulted in the acceptable extraction for 57% of the compounds. The percentage was reduced to 53% when the extraction temperature was set at 100 °C. On the other hand, the extraction with ACN at 60 °C gave satisfactory results for 80% of the compounds. This percentage decreased to 62.5% when the extraction was performed at 80 °C, while at 100 °C the obtained RE% were adequately low, possibly due to degradation. The percentages of analytes with acceptable RE% at different extraction temperatures are graphically presented in Figure 2. The obtained RE% of all individual analytes using ACN and AcOEt as extraction solvents are presented in Tables S3 and S4, respectively.
The results demonstrate that ACN is the most appropriate solvent and the temperature of 60 °C is optimal. The determination of patulin was not successful. Even though LC-MS analysis demonstrates several advantages in the analysis of mycotoxins, offering high sensitivity, the presence of interfering compounds competing with the analytes in the ionization process prevents accurate quantification [28]. In general, apples, regardless of their variety, have a high content of sugars and pigments, which are extracted simultaneously with patulin and interfere with chromatographic analysis, infecting the system [29]. Thus, a clean-up method should be included to avoid the significant effects of the matrix. Considering that a clean-up method was not used in the present study, patulin was not included in the next experiments. In addition, CIT RE% were found to be adequately low in most trials. The results show that when the extraction is carried out at 60 °C with AcOEt, the highest recovery value is 63%. It was shown, however, that AcOEt is not an appropriate solvent for the extraction of the majority of the studied contaminants, and for this reason CIT was also not included in the subsequent assay experiments.

3.1.3. Sample Mass

For the next optimization experiments, the previous factors that proved to be appropriate for extraction were employed, and tests were performed with the amount of apple tissue reduced to 5 g. Figure 3 indicates that the difference in the obtained recoveries when using 5 and 10 g of sample is statistically insignificant, in most cases. In particular, the RE% of 38% of the compounds increased significantly when the sample mass was reduced to 5 g. The recoveries of abamectin, deltamethrin, flonicamid, tau-fluvalinate, thiabendazole, and thiamethoxam increased and were included in the acceptable values (>88%). The remaining 62% of the compounds showed slight differences which, according to the statistical processing, were considered negligible. Thus, subsequent experiments were conducted using 5 g sample mass.

3.1.4. Extraction Time

The next studied factor was the duration of the extraction process. For this purpose, experiments were performed for 5 and 10 min of extraction time, and the calculated RE% are presented in Figure 4. According to the results, the differences in recovery values between the two tested factors were not statistically significant. However, for a percentage of 21%, the recoveries decreased significantly when the extraction process lasted for 10 min but maintained their acceptable levels (70–120%). Exceptions were acrinathrin, lambda-cyhalothrin, and spinosyn A, whose recoveries were reduced from 119%, 102%, and 89% in 5 min extraction time to 53%, 66%, and 65% in 10 min extraction time, respectively. For this reason and considering that the increased speed in the method is desirable, the extraction time of 5 min was chosen as the optimum extraction time. The results confirm that the increase in time has a different effect on each chemical group, as it has been previously reported [30].

3.1.5. Acid Addition

During sample preparation, an attempt was made to create an acidic environment, which contributes to the extraction of certain compounds, using 1% acetic acid in all tests. This enables a better extraction of pesticide analytes that usually have stability problems [31]. In order to determine whether the low recoveries of some compounds are due to the creation or lack of a sufficiently acidic environment, a last series of experiments was performed in the absence of acids, in the presence of 5% acetic acid, and in the presence of 1% formic acid. The calculated recoveries are presented in Table S5. According to the results, extraction in the presence of 1% acetic acid showed the best results with acceptable recoveries for 94% of the analytes. The addition of 1% formic acid resulted in acceptable recovery values for 83% of the analytes, while in the absence of acids acceptable recovery values were obtained only for the 34% of the studied analytes. Finally, the extraction with 5% acetic acid gave the lowest recoveries since only 4% of the studied analytes were within the acceptable range. The high recoveries obtained in the presence of acids were in accordance with the results reported by Wang et al. [32] and Satpathy et al. [27]. The addition of higher acid concentration resulted in the reduction in the percentage of the analytes with satisfactory recovery values. The results are graphically illustrated in Figure 5.

3.2. Method Validation Results

The linearity assessment was performed based on the correlation coefficient of the compounds in the concentration range of 0.03–0.2 μg/mL. Table S6 shows the regression equations and the corresponding correlation coefficients of each compound when analyzing a standard solution prepared by dilution in a solvent and a standard solution prepared by dilution in a sample extract. According to these results, all compounds show excellent linearity with values R2 ≥ 0.99.
The comparison of the slope of the regression lines between the pure standard and the standard diluted in sample extract shows a considerable matrix effect when the slopes of the regression lines differ by more than 40% [33]. According to Table S7, the effect of the substrate is significant for 25% of the compounds, while for 75% it is negligible. For the compounds carbendazim, deltamethrin, etofenprox, fenpyroximate, lambda-cyhalothrin, pyraclostrobin, pyriproxyfen, spinosyn A, spinosyn D, tau-fluvalinate, thiabendazole, and thiamethoxam, the matrix effect causes signal enhancement. The results are graphically presented in Figure 6, and the bars exceeding the black horizontal line indicate the compounds that are significantly affected by the matrix, causing signal enhancement.
Analytes for which no significant matrix effect was observed could be quantified using the standard calibration curve, while those analytes presenting significant matrix effect could be quantified using the matrix-matched curve.
The bias of the method was assessed by means of relative percentage of recovery at four concentration levels (0.01, 0.03, 0.1, and 1 μg/g). All validation results are presented in Table 1. The results show that 66% of the studied analytes spiked at 0.01 μg/g concentration level and 94% of the analytes spiked at 0.03, 0.1, and 1 μg/g presented satisfactory recoveries. The analytes chlorpyrifos and clofentezine at 0.03, 0.1, and 1 μg/g showed recoveries <70%, while the calculated recoveries for the rest of the compounds ranged between 70 and 107%. Overall, the method is accurate for the majority of the compounds at concentration levels equal to or greater than 0.03 μg/g. In contrast, at lower concentrations of 0.01 μg/g, the number of the compounds accurately determined by the proposed method decreases, which is negligible as the MRLs of the compounds are higher than this concentration level. Chlorpyrifos was detected at 0.01 μg/g since the MRL is equivalent to this concentration level. For chlorpyrifos-methyl, very erratic results were noticed during the validation procedure (very inconsistent recoveries among concentration levels), and thus the method was not validated for this compound. The repeatability of the method was assessed after analyzing 10 samples in one day. For most of the compounds, the RSD values ranged between 6 and 20% at 0.03 μg/g concentration level and between 3 and 20% at 0.1 μg/g concentration level. Repeatability values for all the analytes are presented in Table 1. LODs and LOQs were calculated and found to be in the ranges 0.005–0.014 μg/g and 0.010–0.030 μg/g, respectively, as presented in Table 1. The precision of the method was evaluated in terms of reproducibility at the 0.1 μg/g concentration level. Table 1 presents the average recoveries from the four repetitive applications of the method over a period of one month and their RSD%. Overall, the results are considered satisfactory.

3.3. Comparison with QuEChERS

QuEChERS method was applied for comparison with the proposed methodology. The calculated recoveries at 0.1 μg/g concentration level are graphically presented in Figure 7. Carbendazim, chlorpyrifos, difenoconazole, flonicamid, and thiamethoxam showed higher recovery values using the QuEChERS methodology, while abamectin, imazalil, pyriproxyfen, spinosyn A, spinosyn D, and thiabendazole showed higher recoveries using the proposed methodology. No statistically significant differences were observed for the majority of the analytes (74%). Similar results have been reported by Lagunas-Allué et al. [34] in experiments comparing MAE and QuEChERS methods for the extraction of pesticides from grapes.
Even though QuEChERS is a standard non-labor-intensive process for residue analysis that requires minimum usage of chemical solvents and is considered a fast and environmentally friendly method, MAE proves to be faster. MAE accelerates sample preparation owing to its automation, offering the possibility of the simultaneous extraction of 14 samples in the microwave oven, within a single step. The reported data are in accordance with the results reported by Lagunas-Allué et al. [34] and Wang et al. [32].

4. Conclusions

A rapid and selective MAE-LC-MS/MS methodology was developed for the simultaneous determination of pesticides and mycotoxins in apples. The MAE extraction protocol was optimized, and the optimum parameters involved the use of ACN as extraction solvent in acidified environment and heating at 60 °C for 5 min. The method was validated and demonstrated good linearity with R2 ≥ 0.99; acceptable accuracy in the range 70–116%; acceptable precision with RSD% ≤ 20; and low LODs and LOQs in the ranges 0.005–0.015 μg/g and 0.01–0.03 μg/g, respectively, and it can be applied in the simultaneous determination of 43 pesticides and mycotoxins. The proposed methodology was compared to QuEChERS, and no statistically significant differences were observed in the effectiveness of the two methodologies for 32 analytes. The results of this research support that the proposed MAE protocol could be used as a green and rapid alternative to QuEChERS methodology for the simultaneous effective extraction and determination of pesticides residue and mycotoxins.

Supplementary Materials

The following are available online at https://www.mdpi.com/article/10.3390/app112210931/s1. Table S1: LC-MS/MS parameters; Table S2: Recoveries (%) obtained using acetonitrile, ethyl acetate, methanol, and water as extraction solvents; Table S3: Recoveries (%) obtained using acetonitrile as extraction solvent at different temperatures (60 °C, 80 °C, 100 °C); Table S4: Recoveries (%) obtained using ethyl acetate as extraction solvent at different temperatures (60 °C, 80 °C, 100 °C); Table S5: Recoveries (%) obtained in the absence of acids, and after the addition of 1% CH3COOH, 5% CH3COOH, and 1% HCOOH; Table S6: Regression equation and correlation coefficients of pure standards and spiked extracts; Table S7: Matrix effect results; Figure S1: Total Ion Current and selected SRM chromatograms from a 0.01 μg/g level fortified apple sample.

Author Contributions

Conceptualization, U.Μ.-S. and E.-N.P.; methodology, M.G.M. and E.-N.P.; software, M.G.M.; validation, E.-N.P. and M.G.M.; formal analysis, M.G.M. and E.-N.P.; investigation, M.G.M. and E.-N.P.; resources, U.Μ.-S.; data curation, E.-N.P. and N.P.K.; writing—original draft preparation, N.P.K. and E.-N.P.; writing—review and editing, N.P.K., E.-N.P., U.Μ.-S. and V.F.S.; visualization, M.G.M., E.-N.P. and N.P.K.; supervision, U.Μ.-S. and E.-N.P.; project administration, U.Μ.-S.; funding acquisition, U.Μ.-S. and G.S.K. All authors have read and agreed to the published version of the manuscript.

Funding

This research received no external funding.

Informed Consent Statement

Not applicable.

Conflicts of Interest

The authors declare no conflict of interest.

References

  1. Patra, J.K.; Das, G.; Shin, H.S. Microbial Biotechnology; Springer: Singapore, 2018; Volume 2, ISBN 9789811071409. [Google Scholar]
  2. Kovač, M.; Bulaić, M.; Jakovljević, J.; Nevistić, A.; Rot, T.; Kovač, T.; Šarkanj, I.D.; Šarkanj, B. Mycotoxins, pesticide residues, and heavy metals analysis of croatian cereals. Microorganisms 2021, 9, 216. [Google Scholar] [CrossRef]
  3. European Commission Regulation (EC) No 396/2005, Maximum residue levels of pesticides in/on food and feed of plant and animal. Off. J. Eur. Union 2005, L70, 1–16.
  4. Konstantinou, S.; Karaoglanidis, G.S.; Bardas, G.A.; Minas, I.S.; Doukas, E.; Markoglou, A.N. Postharvest fruit rots of apple in Greece: Pathogen incidence and relationships between fruit quality parameters, cultivar susceptibility, and patulin production. Plant Dis. 2011, 95, 666–672. [Google Scholar] [CrossRef] [Green Version]
  5. Arcella, D.; Eskola, M.; Gómez Ruiz, J.A. Dietary exposure assessment to Alternaria toxins in the European population. EFSA J. 2016, 14, e04654. [Google Scholar] [CrossRef]
  6. Kalogiouri, N.P.; Thomaidis, N.S. Screening and High-Throughput Multi-Contaminants Methods. In Food Authentication: Management, Analysis and Regulation; John Wiley & Sons: Hoboken, NJ, USA, 2017. [Google Scholar]
  7. Reichert, B.; de Kok, A.; Pizzutti, I.R.; Scholten, J.; Cardoso, C.D.; Spanjer, M. Simultaneous determination of 117 pesticides and 30 mycotoxins in raw coffee, without clean-up, by LC-ESI-MS/MS analysis. Anal. Chim. Acta 2018, 1004, 40–50. [Google Scholar] [CrossRef] [PubMed]
  8. Zhang, W.; Yang, F.; Zhang, Y.; Zhou, K. Simultaneous Determination of Seven Carbamate Pesticide Residues in Vegetable by Capillary Electrophoresis with Solid Phase Microextraction. Int. J. Electrochem. Sci. 2021, 16, 1–14. [Google Scholar] [CrossRef]
  9. Mota, M.F.S.; Waktola, H.D.; Nolvachai, Y.; Marriott, P.J. Gas chromatography—Mass spectrometry for characterisation, assessment of quality and authentication of seed and vegetable oils. TrAC—Trends Anal. Chem. 2021, 138, 116238. [Google Scholar] [CrossRef]
  10. Vargas Medina, D.A.; Bassolli Borsatto, J.V.; Maciel, E.V.S.; Lanças, F.M. Current role of modern chromatography and mass spectrometry in the analysis of mycotoxins in food. TrAC—Trends Anal. Chem. 2021, 135. [Google Scholar] [CrossRef]
  11. Yang, Y.; Li, G.; Wu, D.; Liu, J.; Li, X.; Luo, P.; Hu, N.; Wang, H.; Wu, Y. Recent advances on toxicity and determination methods of mycotoxins in foodstuffs. Trends Food Sci. Technol. 2020, 96, 233–252. [Google Scholar] [CrossRef]
  12. Leite, M.; Freitas, A.; Silva, A.S.; Barbosa, J.; Ramos, F. Maize (Zea mays L.) and mycotoxins: A review on optimization and validation of analytical methods by liquid chromatography coupled to mass spectrometry. Trends Food Sci. Technol. 2020, 99, 542–565. [Google Scholar] [CrossRef]
  13. Katerere, D.R.; Stockenström, S.; Balducci, G.; Shephard, G.S. Determination of patulin in apple juice: Comparative evaluation of four analytical methods. J. AOAC Int. 2007, 90, 162–166. [Google Scholar] [CrossRef] [Green Version]
  14. Bletsou, A.A.; Jeon, J.; Hollender, J.; Archontaki, E.; Thomaidis, N.S. Targeted and non-targeted liquid chromatography-mass spectrometric workflows for identification of transformation products of emerging pollutants in the aquatic environment. TrAC—Trends Anal. Chem. 2015, 66, 32–44. [Google Scholar] [CrossRef] [Green Version]
  15. Fibigr, J.; Šatínský, D.; Solich, P. Current trends in the analysis and quality control of food supplements based on plant extracts. Anal. Chim. Acta 2018, 1036, 1–15. [Google Scholar] [CrossRef]
  16. Perestrelo, R.; Silva, P.; Porto-Figueira, P.; Pereira, J.A.M.; Silva, C.; Medina, S.; Câmara, J.S. QuEChERS—Fundamentals, relevant improvements, applications and future trends. Anal. Chim. Acta 2019, 1070, 1–28. [Google Scholar] [CrossRef]
  17. Nan, J.; Wang, J.; Piao, X.; Yang, C.; Wu, X.; Quinto, M.; Li, D. Novel and rapid method for determination of organophosphorus pesticide residues in edible fungus using direct gas purge microsyringe extraction coupled on-line with gas chromatography-mass spectrometry. Talanta 2015, 142, 64–71. [Google Scholar] [CrossRef] [PubMed]
  18. Manousi, N.; Kabir, A.; Zachariadis, G.A. Recent advances in the extraction of triazine herbicides from water samples. J. Sep. Sci. 2021. [Google Scholar] [CrossRef]
  19. Kalogiouri, N.P.; Samanidou, V.F. Recent Trends in the Development of Green Microextraction Techniques for the Determination of Hazardous Organic Compounds in Wine. Curr. Anal. Chem. 2019, 15, 788–800. [Google Scholar] [CrossRef]
  20. Mastellone, G.; Marengo, A.; Sgorbini, B.; Rubiolo, P.; Cagliero, C. New phases for analytical scale extraction from plants: Current and future trends. TrAC—Trends Anal. Chem. 2021, 141, 116288. [Google Scholar] [CrossRef]
  21. Ihnat, M. Sample Preparation for Food Analysis; Elsevier: Amsterdam, The Netherlands, 2003; Volume 41, ISBN 9780444511010. [Google Scholar]
  22. Pallaroni, L.; Von Holst, C.; Eskilsson, C.S.; Björklund, E. Microwave-assisted extraction of zearalenone from wheat and corn. Anal. Bioanal. Chem. 2002, 374, 161–166. [Google Scholar] [CrossRef] [PubMed]
  23. Liazid, A.; Palma, M.; Brigui, J.; Barroso, C.G. Investigation on Ochratoxin A stability using different extraction techniques. Talanta 2007, 71, 976–980. [Google Scholar] [CrossRef]
  24. Chen, S.; Zhang, H. Development of a microwave-assisted-extraction-based method for the determination of aflatoxins B1, G1, B2, and G2 in grains and grain products. Anal. Bioanal. Chem. 2013, 405, 1623–1630. [Google Scholar] [CrossRef]
  25. Anastassiades, M.; Lehotay, S.J.; Štajnbaher, D.; Schenck, F.J. Fast and easy multiresidue method employing acetonitrile extraction/partitioning and. J. AOAC Int. 2003, 86, 412–431. [Google Scholar] [CrossRef] [PubMed] [Green Version]
  26. European Commision. Guidance Document on Analytical Quality Control and Method Validation for Pesticide Residues Analysis in Food and Feed. 2019. Document No. SANTE/12682/2019. Available online: https://www.eurl-pesticides.eu/docs/public/tmplt_article.asp?CntID=727 (accessed on 16 November 2021).
  27. Satpathy, G.; Tyagi, Y.K.; Gupta, R.K. A novel optimised and validated method for analysis of multi-residues of pesticides in fruits and vegetables by microwave-assisted extraction (MAE)-dispersive solid-phase extraction (d-SPE)-retention time locked (RTL)-gas chromatography-mass spectrometry. Food Chem. 2011, 127, 1300–1308. [Google Scholar] [CrossRef] [PubMed]
  28. Beltrán, E.; Ibáñez, M.; Sancho, J.V.; Hernández, F. Determination of patulin in apple and derived products by uhplc-ms/ms. Study of matrix effects with atmospheric pressure ionisation sources. Food Chem. 2014, 142, 400–407. [Google Scholar] [CrossRef] [PubMed] [Green Version]
  29. Sadok, I.; Stachniuk, A.; Staniszewska, M. Developments in the Monitoring of Patulin in Fruits Using Liquid Chromatography: An Overview. Food Anal. Methods 2019, 12, 76–93. [Google Scholar] [CrossRef]
  30. Eskilsson, C.S.; Bjorklund, E. Analytical-scale microwave-assisted extraction. J. Chromatogr. A 2000, 902, 227–250. [Google Scholar] [CrossRef]
  31. Rizzetti, T.M.; Kemmerich, M.; Martins, M.L.; Prestes, O.D.; Adaime, M.B.; Zanella, R. Optimization of a QuEChERS based method by means of central composite design for pesticide multiresidue determination in orange juice by UHPLC-MS/MS. Food Chem. 2016, 196, 25–33. [Google Scholar] [CrossRef] [Green Version]
  32. Wang, M.; Jiang, N.; Xian, H.; Wei, D.; Shi, L.; Feng, X. A single-step solid phase extraction for the simultaneous determination of 8 mycotoxins in fruits by ultra-high performance liquid chromatography tandem mass spectrometry. J. Chromatogr. A 2016, 1429, 22–29. [Google Scholar] [CrossRef] [PubMed]
  33. Bester, K.; Bordin, G.; Rodriguez, A.; Schimmel, H.; Pauwels, J.; VanVyncht, G. How to overcome matrix effects in the determination of pesticides in fruit by HPLC-ESI-MS-MS. Anal. Bioanal. Chem. 2001, 371, 550–555. [Google Scholar] [CrossRef] [PubMed]
  34. Lagunas-Allué, L.; Sanz-Asensio, J.; Martínez-Soria, M.T. Comparison of four extraction methods for the determination of fungicide residues in grapes through gas chromatography-mass spectrometry. J. Chromatogr. A 2012, 1270, 62–71. [Google Scholar] [CrossRef]
Figure 1. Percentage of pesticides and mycotoxins with acceptable recoveries in the range 70–120% when using acetonitrile (ACN), ethyl acetate (AcOEt), methanol (MeOH), and water as extraction solvents.
Applsci 11 10931 g001
Figure 2. Percentage of pesticides and mycotoxins with acceptable recoveries in the range 70–120% when using acetonitrile and ethyl acetate as extraction solvents, at different temperatures (60, 80, 100 °C).
Applsci 11 10931 g002
Figure 3. Recoveries (%) of analytes when MAE extraction was performed on 10 g and 5 g of tissue: (a) abamectin (B1a), acetamiprid, acrimathrin, boscalid, bupirimate, carbendazim, chlorpyrifos, chlorpyrifos-methyl, clofentezine, clothianidin, cyproconazole, cyprodinil, deltamethrin, difenoconazole, etofenprox, fenbuconazole, fenpyroximate, flonicamid, fludioxonil, fluopyram, fluquinconazole, flutriafol, hexythiazox, imazalil; (b) indoxacarb, kresoxym-methyl, lambda-cyhalothrin, methoxyfenozide, myclobutanil, penconazole, primicarb, pyraclostrobin, pyrimethanil, pyriproxyfen, spinosyn A, spinosyn D, spirodiclofen, tau-fluvalinate, tebuconazole, tebufenozide, tebufenpyrad, thiabendazole, thiacloprid, thiamethoxam, trifloxystrobin, alternariol (AOH), alternariol monomethyl ether (AME). The values for each substance followed by the same letter do not differ significantly statistically (p < 0.05).
Applsci 11 10931 g003
Figure 4. Recoveries (%) of analytes when MAE extraction was carried out for 5 and 10 min: (a) abamectin (B1a), acetamiprid, acrimathrin, boscalid, bupirimate, carbendazim, chlorpyrifos, chlorpyrifos-methyl, clofentezine, clothianidin, cyproconazole, cyprodinil, deltamethrin, difenoconazole, etofenprox, fenbuconazole, fenpyroximate, flonicamid, fludioxonil, fluopyram, fluquinconazole, flutriafol, hexythiazox, imazalil; (b) indoxacarb, kresoxym-methyl, lambda-cyhalothrin, methoxyfenozide, myclobutanil, penconazole, primicarb, pyraclostrobin, pyrimethanil, pyriproxyfen, spinosyn A, spinosyn D, spirodiclofen, tau-fluvalinate, tebuconazole, tebufenozide, tebufenpyrad, thiabendazole, thiacloprid, thiamethoxam, trifloxystrobin, alternariol (AOH), alternariol monomethyl ether (AME). The values for each substance followed by the same letter do not differ significantly statistically (p < 0.05).
Applsci 11 10931 g004
Figure 5. Percentage of pesticides and mycotoxins with acceptable recoveries in the range 70–120% in the absence of acids and the presence of 1% acetic acid, 5% acetic acid, and 1% formic acid.
Applsci 11 10931 g005
Figure 6. Matrix effect (%) results: (a) abamectin (B1a), acetamiprid, acrimathrin, boscalid, bupirimate, carbendazim, chlorpyrifos, chlorpyrifos-methyl, clofentezine, clothianidin, cyproconazole, cyprodinil, deltamethrin, difenoconazole, etofenprox, fenbuconazole, fenpyroximate, flonicamid, fludioxonil, fluopyram, fluquinconazole, flutriafol, hexythiazox, imazalil; (b) indoxacarb, kresoxym-methyl, lambda-cyhalothrin, methoxyfenozide, myclobutanil, penconazole, primicarb, pyraclostrobin, pyrimethanil, pyriproxyfen, spinosyn A, spinosyn D, spirodiclofen, tau-fluvalinate, tebuconazole, tebufenozide, tebufenpyrad, thiabendazole, thiacloprid, thiamethoxam, trifloxystrobin, alternariol (AOH), alternariol monomethyl ether (AME). The bars of the compounds exceeding the black horizontal line indicate they are significantly affected by the matrix.
Applsci 11 10931 g006
Figure 7. Recoveries (%) extracted by QuEChERS and MAE methods at 0.1 μg/g concentration level for the analytes: (a) abamectin (B1a), acetamiprid, acrimathrin, boscalid, bupirimate, carbendazim, chlorpyrifos, clofentezine, clothianidin, cyproconazole, cyprodinil, deltamethrin, difenoconazole, etofenprox, fenbuconazole, fenpyroximate, flonicamid, fludioxonil, fluopyram, fluquinconazole, flutriafol, hexythiazox, imazalil; (b) kresoxym-methyl, lambda-cyhalothrin, methoxyfenozide, myclobutanil, penconazole, primicarb, pyraclostrobin, pyrimethanil, pyriproxyfen, spinosyn A, spinosyn D, spirodiclofen, tau-fluvalinate, tebuconazole, tebufenozide, tebufenpyrad, thiabendazole, thiacloprid, thiamethoxam, trifloxystrobin, alternariol (AOH), alternariol monomethyl ether (AME). The values for each analyte followed by the same letter show that the two methodologies do not differ significantly statistically (p < 0.05).
Applsci 11 10931 g007
Table 1. Validation results.
CompoundsAccuracy Repeatability Reproducibility
Recoveries (%)RSD (%)Recoveries (%)RSD (%)LOQLOD
0.01 μg/g0.03 μg/g0.1 μg/g1 μg/g0.03 μg/g0.1 μg/g0.1 μg/g0.1 μg/g(μg/g)(μg/g)
abamectin (B1a)-100988271988180.0300.005
acetamiprid1079287887987100.0100.006
acrinathrin-808770181598200.0300.011
alternariol12010680819477160.0100.008
alternariol monomethyl ether116105828910688110.0100.009
boscalid1079782866694140.0100.007
bupirimate-89908113891170.0300.007
carbendazim1081049199191291150.0100.005
chlorpyrifos8653615971051180.0100.007
clofentezine-57645211560220.0100.009
clothianidin1019286889488120.0100.006
cyproconazole96888383181286140.0100.007
cyprodinil10984837313789190.0100.006
deltamethrin-1008873172064120.0300.011
difenoconazole-90758010781110.0300.009
etofenprox-97828519157490.0300.011
fenbuconazole115958481111285160.0100.007
fenpyroximate-10190861157670.0300.014
flonicamid1029384839888140.0100.009
fludioxonil78887670748170.0100.007
fluopyram108948686171392130.0100.008
fluquinconazole9788838714996180.0100.006
flutriafol1001008486171586140.0100.005
hexythiazox-100829018680140.0300.014
imazalil120808975171990170.0100.008
indoxacarb-100808616587250.030.012
kresoxym-methyl11489858711486200.0100.011
lambda-cyhalothrin-107787410567160.0300.015
methoxyfenozide10693919411495110.0100.011
myclobutanil101938583121190150.0100.007
penconazole11489848010385130.0100.006
pirimicarb105858686171283130.0100.008
pyraclostrobin-928385161490190.0300.009
pyrimethanil94828179201486160.0100.007
pyriproxyfen-1019092191581110.0300.013
spinosyn A-969174182079180.0300.011
spinosyn D-9790709572170.0300.014
spirodiclofen-868385151175110.0300.014
tau-fluvalinate-91897014989240.030.011
tebuconazole11692818216387170.0100.007
tebufenozide1159393949796130.0100.011
tebufenpyrad-1008586101383160.0300.011
thiabendazole97888978161192170.0100.010
thiacloprid10292878911488110.0100.007
thiamethoxam10487919013189450.0100.008
trifloxystrobin-968086101688160.0300.011
Publisher’s Note: MDPI stays neutral with regard to jurisdictional claims in published maps and institutional affiliations.

