1. Introduction
The psychological characteristics of stock market investors has always been a point of interest for behavioural scientists who seek to unfold the decision-making processes of investors based on their attitudes and specific attributes. Transactions on the stock market are based on information, while the way in which the information is processed directly impacts the behaviour of the financial system. The central assumption that financial and economic models are based on the rationality of investors is far from the reality. In fact, traditional theoretical models have failed to justify investors’ cognitive biases. This phenomenon in financial markets which causes stock prices to deviate from their fundamental values consequently attracts arbitrageurs and creates stock market bubbles and causes capital flight. Economists have underlined that these fallacies have a considerable impact when they result in collective actions, that is, when they are replicated and enforced by the actions of other investors [
1,
2]. In the case of financial markets, this may bring about instability or even crises.
Economic and psychological literature (e.g., [
3]) lists almost 100 different cognitive biases; however, not all of them refer to investors’ behaviour in financial markets. We selected seven of them: confirmation bias, loss aversion, gambler’s fallacy, availability cascade, hot-hand fallacy, bandwagon effect, and Dunning–Kruger effect. These are often listed as the most critical fallacies occurring in financial markets. However, the literature thus far has primarily analysed them individually, which has created an important research gap. This paper considers the joint cognitive biases affecting stock exchange investors; this is the main area of innovation in the research. We propose the hypothesis that these bundles of cognitive biases are heterogeneous among different groups of investors, and that this may form the foundations of some specific market distortions.
As many researchers have shown (e.g., [
4,
5]), inter-cultural differences affect the economic and investment decision-making process. Economic and cultural systems, involvement in financial issues, wealth, attitude to risk and many other factors influence behavioural patterns. This means that the results of studies on financial markets can not necessarily be extrapolated to other markets; in fact, all cultural environments need special attention. What is more, international, and intercultural comparisons are necessary for understanding the degree to which these environments are specific. There is a relative wealth of studies contained within the literature on well-developed financial markets and the behaviour of their investors, while studies on less-developed markets are sparser. Teheran Stock Exchanges of investors on the Tehran Stock Exchange (TSE) are gaining increasingly more attention in the literature. Indeed, one can find studies focusing on the following: IPOs (Initial Public Offering) [
6], confirmation of the existence of these effects [
7,
8], correlation of personality characteristics with conservatism and availability biases [
9], targeting of a deeper understanding of individual investment decisions and portfolios [
10,
11,
12]; demonstration of the correlation between overconfidence and trading volume [
13]; and an examination of intuitive thinking [
14] and mental accounting [
15]. However, these studies mostly report the existence of these effects but do not explain interactions between cognitive biases. This paper fills this gap by examining bundles of cognitive biases evident in the behaviour of Iranian stock exchange investors. It delivers further insight to the international community with regard to this niche financial market. An important aspect of studies on cognitive biases and investors’ behaviour beyond the cultural environment is the research methodology. The most common stream of research focuses on analysing stock prices and volumes and drawing conclusions on psychological attitudes and failures indirectly by assuming the behavioural patterns (e.g., [
16]). Such studies usually examine time series and their correlations and co-integration (e.g., [
17]). The second, much more infrequent stream of research concentrates on surveying investors in the market directly. Our research method develops this direct approach by examining investors’ behavioural attitudes and such profile metrics as gender, age, investment amount, and portfolio experience. Individual data require adequate quantitative analytics. This study proposes the use of unsupervised learning methods, such as clustering and dimension reduction, which enable a more detailed analysis of investors’ profiles to be conducted. This methodology may reveal which cognitive biases occur either jointly or separately, and whether personal and professional concerns have a significant role to play in their occurrence.
Contributions: This study fills a research gap and proposes a few contributions in behavioural economics and finance:
It uses the joint analysis of cognitive biases observed among stock market investors to derive investors’ behavioural profiles;
It examines bundles of cognitive biases present among TSE investors;
It provides methodological solutions based on individual data using unsupervised learning methods better to understand bundles of cognitive biases and investors’ profiles.
The remainder of the paper is as follows.
Section 2 presents the literature review on seven analysed cognitive biases,
Section 3 gives a summary of the study design,
Section 4 describes details of the quantitative analysis,
Section 5 discusses the results, and
Section 6 provides the conclusions.
2. Cognitive Biases in the Stock Market: Literature Review
This section presents and discusses the most commonly observed cognitive biases that occur in the decision-making process of stock exchange investors. Those mental effects are the basis of this study and are empirically tested in the analytical part of this paper.
Cognitive bias can be defined as a systematic error in the thought process that occurs when people handle and interpret the data and knowledge at their disposal, affecting their judgements and conclusions [
3]. Even though the human brain is well developed and highly complex, it is nevertheless subject to limitations. Cognitive biases are often the result of the brain’s attempt to automate the processing of information and make the interpretation of such information more understandable and straightforward. However, there are some situations in which these biases have a substantial impact on the decision-making process, which is the main focus of this study.
This study considers the seven most common fallacies that investors in the stock market commit in their financial decisions: confirmation bias, loss aversion, gambler’s fallacy, availability cascade, hot hand fallacy, the bandwagon effect, and the Dunning–Kruger effect. These fallacies are the central focus of the paper. They are discussed below and addressed in a further part of the study in the form of a questionnaire. There also exists a number of other fallacies which were not covered in this text: mental accounting, adjustment bias, affinity bias, anchoring bias, cognitive dissonance bias, herd behaviour bias, hindsight bias, the illusion of control, incentive-caused bias, limited attention span (or bounded rationality), neglect of probability, outcome bias, overconfidence bias, oversimplification tendency, recency bias, a paradox of choice, regret bias (or endowment bias), representativeness bias, restraint bias, self-attribution bias, self-control bias, and snakebite effect. A wider list can be found in [
3].
Confirmation bias—following [
18], “confirmation bias is the tendency to seek out information that supports our beliefs and ignore information that contradicts them.” In the stock market, it is likely that investors overlook information that is not entirely aligned with their ideas, especially when they acquire information that confirms their beliefs. However, through comprehensive research, McKenzie [
19] has shown that even simply asking confirmatory questions can lead to a false sense of confirmation among investors. Investors’ reactions to good and bad information depends on their attitudes; pessimistic investors undervalue good news and over-react to bad news. Conversely, optimistic investors over-react to good news and respond too optimistically to bad news [
20]. This diversity in the handling of information causes deep divisions among traders and may explain particularly diverse behaviours in stock markets [
21]. This cognitive bias was addressed in Q7 of the survey: “If you hear that the company which you invested in is on the verge of declaring bankruptcy, you consider selling your stocks”.
Loss aversion is observed among investors who must choose between guaranteed, low-return investments and riskier, high-return investment. As Tversky and Kahneman [
22] have shown in their experiments (confirmed recently in [
23]), such investors are more sensitive to losses than gains. This leads to numerous perspectives on every individual choice and asset price in stock markets. Loss aversion influences the financial markets by impacting the risk attitudes of investors. It essentially occurs when investors continue to hold onto losing investments for much longer than they should and end up suffering much more significant losses than they otherwise would have. Investors do not acknowledge a loss as being such until it is realised; they can avoid mentally and emotionally coming to terms with the truth of their loss as long as they have not yet closed out the trade. This cognitive bias was addressed in Q8 of the survey: “You prefer to choose a low-return, guaranteed investments rather than a more promising investment with higher risk”.
Availability cascade is recognised as a self-reinforcing cycle in which a specific idea or belief gains rapid currency in popular discourse; its rising popularity makes people more likely to believe it and to spread it further among society. This bias mainly occurs due to the combined effects of two distinct components: informational cascades and reputational cascades [
24] (in the case of stock exchange investors, this would start with the verification of decision based on the findings of social media reports and announcements broadcasted by news agencies). When these two types of cascades happen simultaneously on a large scale and strengthen each other, a phenomenon is triggered whereby a piece of news or information is repeated and widely circulated. The result is an availability cascade, where investors regularly spread a specific chunk of data or a particular belief while increasing the opportunity for others to do likewise.
Accordingly, an availability cascade is a kind of positive-input framework, since the greater the number of individuals bringing attention to an idea, and the more time they spend doing so, the more others are inclined to do the same. In particular, when the rising prevalence of a specific belief is such that it reaches a specific minimum amount and passes this threshold, the attention it draws is sufficient to set off a chain response, which makes it increasingly indisputable.
Pollock et al. [
25] have examined how the recency and availability of information regarding others’ actions within and between different communities have a significant role to play in the allocation of attention and evaluations. They have demonstrated how widely available and recent information interacts to influence people’s attention and evaluation, which is a foundation of the availability heuristic. They have also shown that market investors use the information gained from others’ activities to handle the unpredictability of the market. By definition, it advances directional research on how imitative characteristics affect market activities. Their study emphasised how the public impact is conveyed through homogenised practices, social networks, and learning. Yet, they illustrated a more widespread procedure of social effects based on the core activities carried out by a group of market investors, their collaborative motion and direction, and the market roles of various actors. Their study also offers “additional insights into the cognitive biases of persistence and change in social systems that may not be apparent when a researcher is studying these systems from a purely structural point of view or considering interactions within a single community.” This cognitive bias was addressed in Q10 of the survey: “You read in the news that the company you invested in experienced a high level of trading on specific days. You buy more stocks of the company in the upcoming days”.
Gambler’s fallacy is the expectation that a random sequence of outcomes should exhibit systematic reversals and that a long series of the same results are of low probability. It occurs very regularly, especially for inexperienced investors. Kenton [
26] explained it as a phenomenon that takes place when an individual wrongly believes that a particular stochastic event is less likely to occur based on the outcome of a preceding event or series of events. This evaluation is incorrect, since past occurrences do not change the probability that certain events will occur in the future. Hon-Snir [
27] describes this bias as “an (incorrect) belief in negative autocorrelation of a non-auto correlated random sequence. For example, individuals who are prone to the gambler’s fallacy believe that after three red numbers appearing on the roulette wheel, a black number is ‘due’ that is, it is more likely to appear than a red number”. The history of this behaviour goes back to 1796 according to a published paper by Wilcox [
28]. It was first identified in the laboratory and under controlled circumstances in the literature on probability matching. It was observed in real life in a Las Vegas casino in 1913; for this reason, it is known as the Monte Carlo fallacy. The gambler’s fallacy is caused by the representativeness heuristic (Tversky and Kahneman [
29]). Examples of this fallacy include the instance where a group of experienced investors were asked a couple of questions [
30] in order to identify their thinking methodology and, consequently, their decision-making approaches; there are also documents revealing that market “signals” considered by practical analysts are compatible with a number of cognitive fallacies, including gambler’s fallacy. In general, the gambler’s fallacy is considered to be a well-known phenomenon, both in the laboratory and in the real world, including stock market decisions and behaviour. This cognitive bias was addressed in Q9 of the survey: “The price of the company which you invested in has decreased in the last six months, thus you expect it to increase in the next six months”.
Hot hand fallacy is the opposite of gambler’s fallacy; it is the belief in excessive persistence rather than reversals [
31]. It assumes that a long series of the same results will last longer still. It relies on the intuition accumulated from past events and the transposition of their results into future outcomes. With hot hand fallacy, though, one may think that a winning streak will continue in the future so that it can be interpreted as a false uninterrupted success sequence. Rabin and Vayanos [
32] have built a theoretical model for the analysis of both hot hand and gambler’s fallacies and have proven that both cognitive biases may strongly impact the behaviour of financial markets. It was also shown by way of experiment that it is gender-dependent and that female-only groups are more prone to this bias than male-only groups [
33]. This cognitive bias was addressed in Q11 of the survey: “As the returns of the company you invested in have risen over the last six months, you would expect them to continue to rise over the next six months”.
Bandwagon effect (or groupthink) is part of a larger group of cognitive biases or errors in thinking that influence people’s judgments and decisions [
34]. Cognitive biases are often designed to help people think and reason more quickly, but they often introduce miscalculations and mistakes. “If potential investors pay attention not only to their own information about a new issue, but also to whether other investors are purchasing, bandwagon effects, or informational cascades, may develop” [
35]. This phenomenon is similar to the herd behaviour of agents and can be observed in the stock market decision-making process when investors try to include themselves in a large cluster of investors, so they feel relatively safe and secure regarding their investment (since everyone else is walking the same path). In reference to financial markets, the bandwagon effect can be observed when an investor who discovers that the total trading proportion for the company they invested in was more than expected would consider increasing the sum of their stock market share. This cognitive bias was addressed in Q12 of the survey: “Over the past two months, the total trading proportion for the company you invested in was more than expected, so you consider increasing the sum of your stock market holdings”.
The Dunning–Kruger effect is observed when people tend to overestimate their own competency, which leads to overconfidence and underestimation of the limits of their own understanding [
36]. This fallacy is especially dangerous in situations where agents assume that they have sufficient knowledge for predicting and managing their stock portfolios. It can also be more time-consuming for investors to behave in this way. In our question, we asked about the impossibility of making a profit from the market, which is based on the Dunning–Kruger curve; this stage is identified as a “valley of despair”, and it occurs after the initial stage on which most investors entering the field think that they are relatively knowledgeable about every aspect of the stock market. This cognitive bias was addressed in Q13 of the survey: “Making a profit from investing in the stock market is very difficult and at some point, becomes impossible”.
3. Survey Design
This research is based on a collection of individual data, such as the answers from TSE investors to a particular set of questions. The questions surveyed their attitudes towards specific cognitive fallacies in the context of financial investment. Some crucial aspects of the survey design are discussed below.
Firstly, in addition to a good sample, an effective survey design requires the
robust design of questions that can reliably reflect people’s thoughts, experiences, and public actions. Accurate random samples and high response rates may not be possible if the information obtained is subject to uncertainty or bias. The fundamental development of suitable measures includes writing suitable questions and then arranging them in a questionnaire format. The questionnaire constitutes a multi-stage process that highlights and scrutinizes many details simultaneously. The task of designing the questionnaire is not a straightforward one, since questions can be asked in various formats and to different levels of detail. Questions posed earlier in the survey can also affect how participants respond to later questions. The survey design process becomes more intricate when it involves the estimation and measuring of the degree of psychological biases. It is necessary for us to scrutinise all aspects of design, including verifying the order of questions, in order to ensure that the respondents answer each question accurately, which ultimately gives us the means for our study. All these aspects were considered when designing a questionnaire (see
Appendix A) which addresses the cognitive fallacies discussed.
Secondly, one should understand the
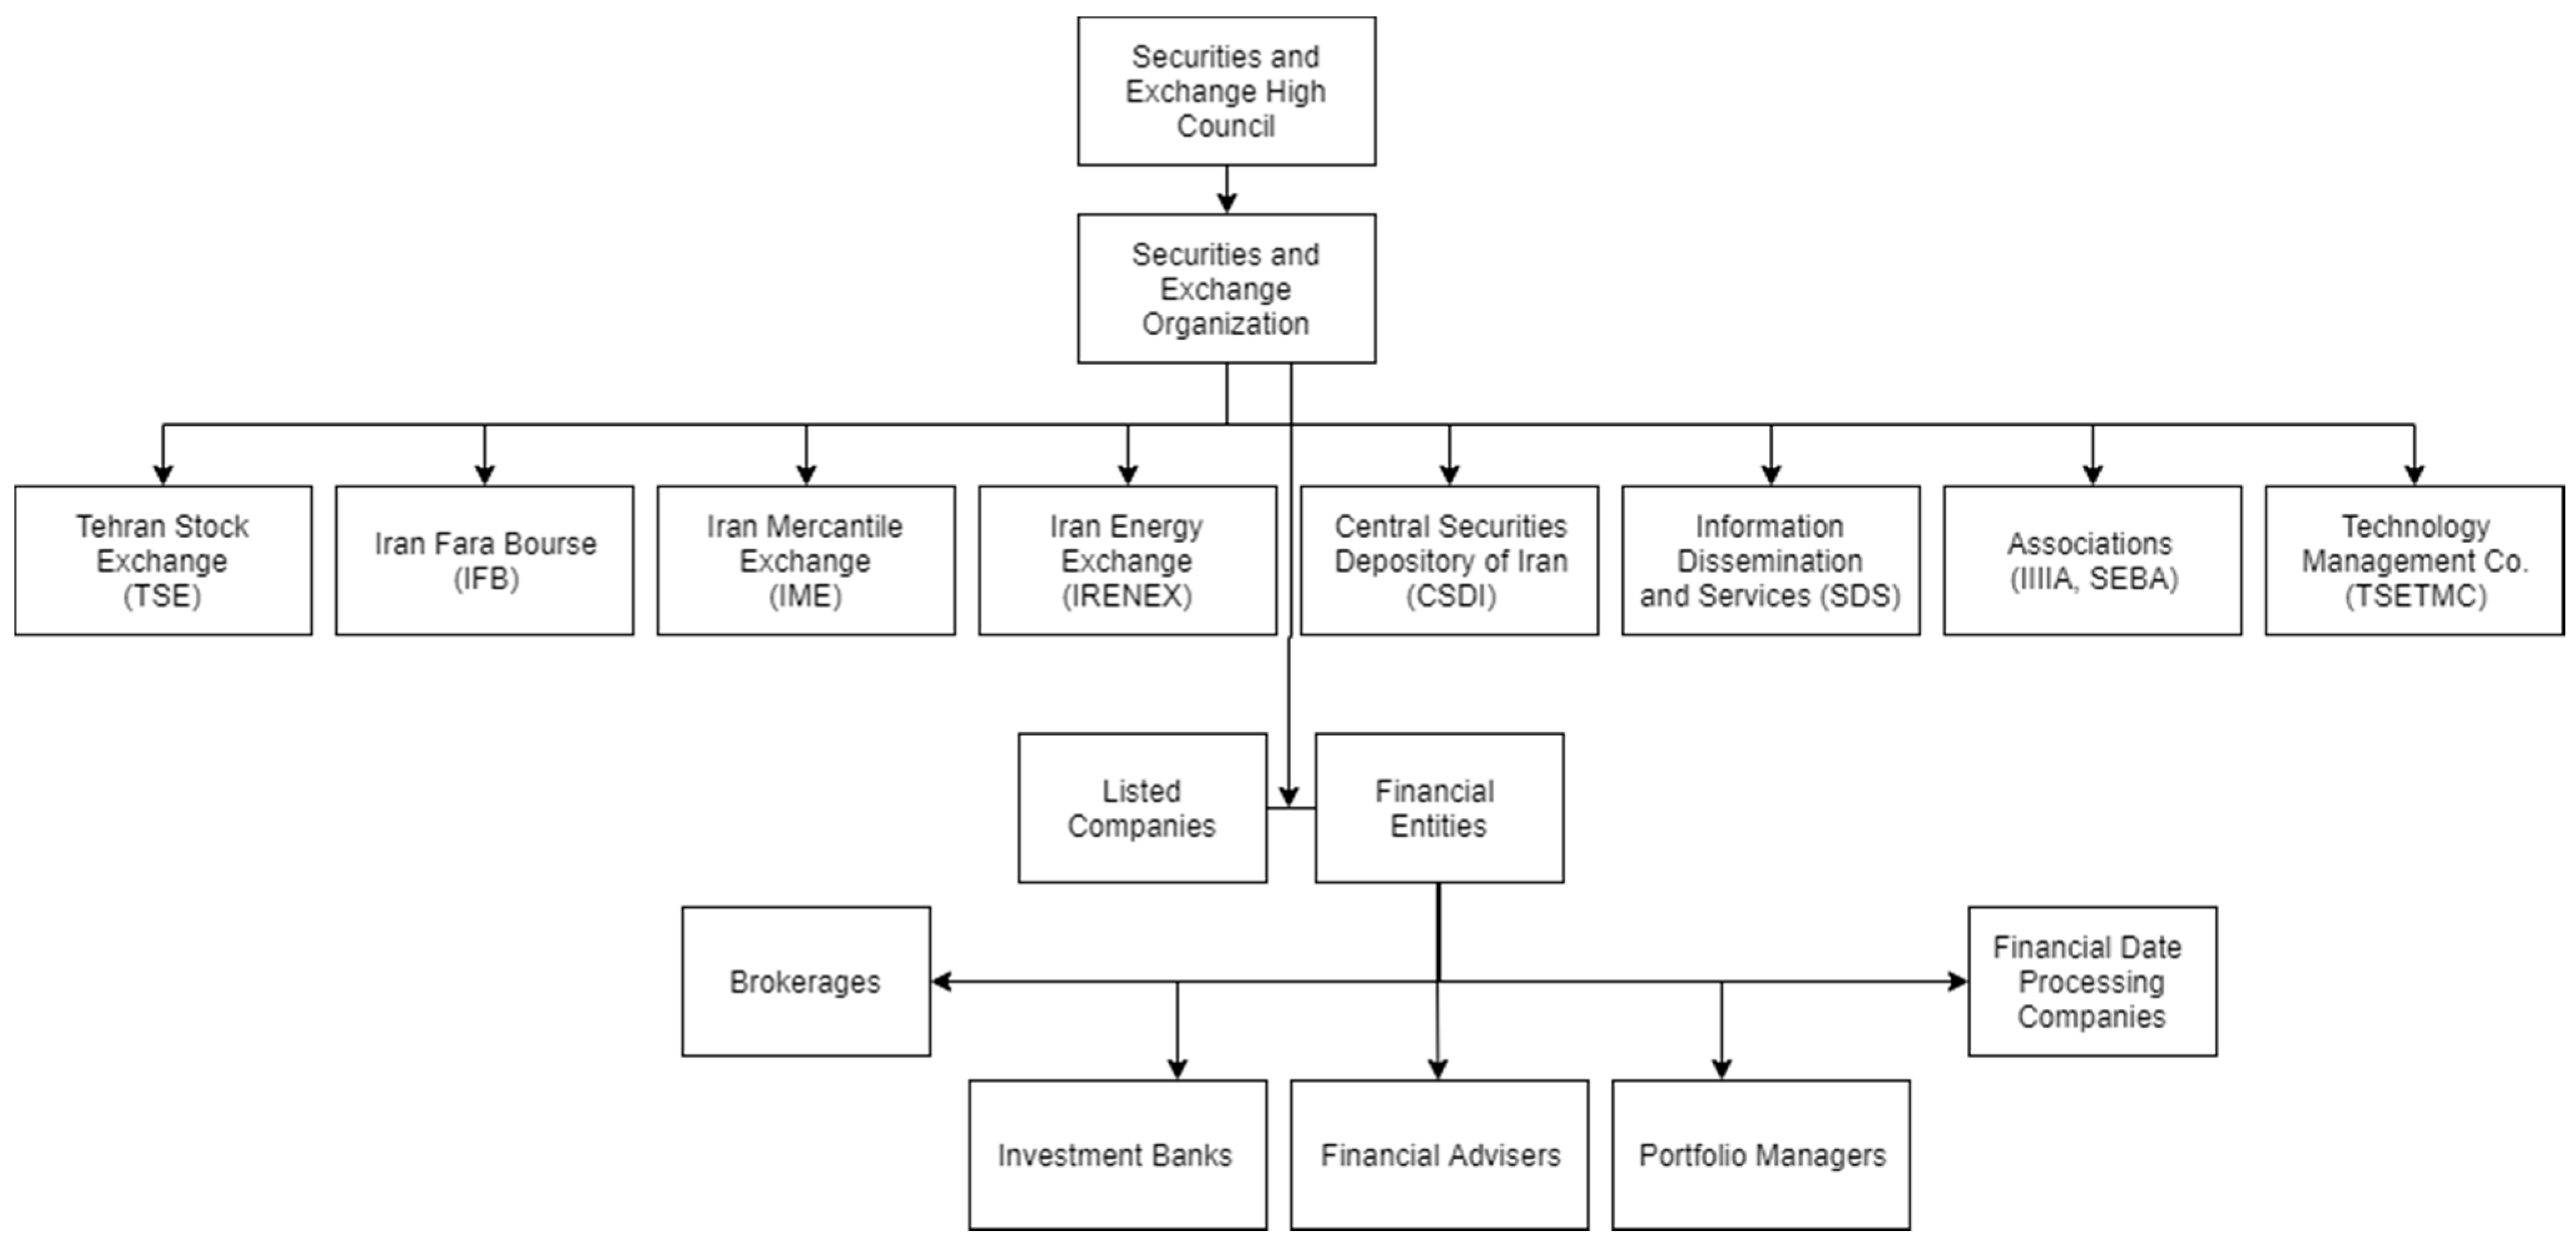
institutional environment of interviewees. The research was conducted on the Iranian Stock Exchange. There are a wide variety of entities active in the Iranian capital market (
Figure 1). There are four exchanges, comprising two equity markets, TSE (Tehran Stock Exchange) and IFB (Iran Fara Bourse), and two commodity markets, IME (Iran Mercantile Exchange) and IRENEX (Iran Energy Exchange). They are supported by institutions such as CSDI (Central Securities Depository of Iran), and IDS (Information Dissemination Services), and associations such as IIIA, SEBA, and TSETMC (Tehran Securities Exchange Technology Management Co.). Since November 2005, the Tehran market has been in its fourth stage of development, oriented towards attracting small investors and financing companies. As of September 2021, TSE’s total market capitalisation was USD 1,427,595,000 (CEIC data). As these markets play a constructive role in the allocation of resources and national capital, they are heavily relied upon for the economic development of society. TSE has a similar structure to other markets of its size and impact, which increases the transferability of results.
Thirdly, the survey should mimic the
behavioural conditions of decision-makers; this may lead to a high degree of consistency in the questionnaire and participants’ natural reactions. The psychological aspect of decision-making in the stock markets cannot be overlooked, since many investors tend to bypass rationality and, at some point, rely solely on intuition. These effects, which can also be referred to as fallacies, are based on feelings, emotions, and intuition, rather than on rational considerations, and they often result in inferior financial performance [
27]. Additionally, cognitive biases can be understood as “hard wired” actions [
37], making us all liable to take shortcuts, oversimplify complex decisions and be overconfident in our decision-making processes. Therefore, understanding the cognitive fallacies of the stock market holders can lead to better decision being made, which is fundamental to lowering risk and improving investment returns over time. Furthermore, investors can often be misled, simply due to the order or manner in which they have received information or the circumstances under which they make a decision; therefore, being aware and mindful of these biases can ultimately lead to optimal investment judgments being made. Consequently, survey questions were kept as direct and straightforward as possible and were pilot tested for wording and transparency of meaning. They were also inspired by other questions which already had an established place in the literature.
Fourthly, the
operational details of the survey are of high importance for the validation of results. The sample comprises 104 surveyed investors, the stock market holders in TSE (Tehran Stock Exchange). The study aims to analyse their behaviour based on the most well-known examples and cases of cognitive biases. In order to measure the tendency to exhibit these expected behaviours, we dedicated specific questions in the survey to analysing these biases. After some initial general questions regarding gender, age, experience, the preferred method of approach in the stock market and the amount of the stock market holder’s investment, we asked questions that analysed the behaviour of the investor in terms of cognitive biases. We also included a question addressing investor’s overall views of Iran’s economic situation, which we believe can link the underlying approach of the investor—being either optimistic or pessimistic—to their individual thought process, which ultimately influences their choices around selling or buying stocks and mutual funds. Furthermore, the questions were based on the Likert scale for multiple choice answers, since this is the most widely used psychometric approach for asking the investors about their opinions or feelings about different stock market situations in a survey. Details of the survey are in the
Appendix A. As will be shown in the following sections, this approach enables a valuable and reliable research sample to be obtained, in turn allowing conclusions to be drawn on the bundling of cognitive biases.
Fifthly, we present threats to validity. We have analysed the existing research that (1) considered cognitive biases of investors on financial markets, (2) examined seven selected biases jointly, (3) analysed individual data from investors’ surveys, and (4) examined the behavioural studies for Tehran Stock Exchange. We have screened the databases of Web of Science, Scopus, IEEE Xplore, ACM Digital Library, Science Direct, and Springer Link. Additionally, we ran forward and backward searches in Google Scholar and Research Gate. We looked for multiple combinations of “stock exchange”, “financial market”, “Tehran Stock Exchange”, “confirmation bias”, “loss aversion”, “availability cascade”, “gambler’s fallacy”, “hot hand”, “bandwagon effect”, “Dunning–Kruger effect”. We focused on papers published since 2017 in the first round and since 2010 in the second round. The usefulness of the research was assessed based on the abstract. We found many papers that dealt with a given cognitive bias separately, which was not our interest. We did not find any papers which either analysed seven cognitive biases jointly or used unsupervised learning methods. All other papers presenting interesting approaches and findings were mentioned as references.
4. Study Results
The analysis presented below was conducted in three ways. Firstly, we followed the traditional statistical approach of testing the hypothesis on equality of means in subgroups by features, also crossed with gender, age and market experience. This allowed us to gain a greater understanding of the one- and two-dimensional relationships between perceptions and the personal attributes of investors. Secondly, we ran a Principal Component Analysis (PCA) to reduce features with similar information in order to determine the strength and direction of cognitive biases. We also carried out clustering of observations using a dendrogram and k-means to separate groups of features revealing similar behaviour; the role of these factors in building clusters of features was tested using the variable importance method. Thirdly, we applied clustering of features using a dendrogram and k-means to separate groups of investors revealing similar behaviour; we put the investors’ profiles showing similar behavioural patterns into the following subgroups: age, invested amount, market experience and market perception. All computations and graphics were conducted using R software.
4.1. Hypothesis Testing
The data collected show that in most cases, the outputs precisely matched expectations. In some instances, the findings from the data revealed truths that could not be seen directly. Some cases were surprising and went beyond any logical explanation. We observed that the dataset is heterogeneous, and simple generalisation could distort the results. The study avoids giving universal attributes to the whole sample of investor respondents. Instead, significant biases in profiled groups were measured in selected characteristics such as gender, age, investment amount, and years of experience on the stock market. Not all attributes are significant in all cases. We used a t-test for equality of means. For pair comparisons, we applied the standard version of the test, while for multiple comparisons, we used the Bonferroni correction.
Firstly, we
compared the results in groups by gender by testing the differences in biases between male and female investors (
Table 1). The only meaningful differences in biases observed between the two genders were in the cases of gambler’s fallacy and availability heuristics (where the
p-value of the
t-test for equality of group means is below the significance threshold of 0.05). We surveyed the investors about the availability cascade based on the information from the news. It was revealed that women are more likely to make a decision based on a mental shortcut that relies on immediate examples (such as a news report that mentions a high level of trading on specific days for the company they invested in), while men are less likely to fall into this bias. However, even if the aforementioned two effects were observed, it was found that gender does not play a role in clustering or building investors’ profiles.
Second, we determined which bias is the strongest. A notable finding was that the most common fallacy for both genders was confirmation bias. Many investors were not keen to verify the information gained prior to action and considered immediate action, even if said information could turn out to be false. The investors fell into availability bias in the same way. Both availability and confirmation bias serve as evidence that the information to which investors have been exposed greatly affects the way they respond in the stock market (even though all investors need reliable information to continue to make stable investments). Conversely, it demonstrates how dangerous it is to surround investors with targeted information, which may lead to designed and planned actions which favour certain agencies and companies. The existence of these biases means that news, advertisements, and the media all have a considerable influence on the way investors make decisions.
Third, we explicitly asked investors about their
dedicated approaches to succeeding in TSE in order to better understand these methods and confirm these patterns in the direct answers to the question: “Which approach do you use in your stock analysis?”. It is reasonable to expect that results would differ from those found in the experiments we had already conducted. The possible choices were as follows: Technical, Fundamental, News, Consultation, Self-Strategy and No Strategy; more than one choice was allowed. The results are presented in
Figure 2. The two most commonly chosen methods were Consultation and Technical analysis, each of these being applied by more than 40% of investors of both genders. Our results can be compared with the analysis conducted by Davis [
38], who studied the role of the mass media in investor relations and found there to be a slow decline in the importance of financial news media in the investment process. However, he argued that financial news nevertheless plays a significant role in trading in the city and can, at times, still have a powerful impact on investment patterns. It can also be observed from
Figure 2 that News was, for men, a more popular method than fundamental analysis, but equally as popular as No Strategy. Here, we reached similar results, albeit not for different periods (differing from [
38], which compares the effects of mass media over time); however, we reached the conclusion that men are more likely to rely on news than women.
Fourth, we analysed questionnaires with regard to the
age of investors. For better segmentation, we divided the investors into three age groups (
Table 2). People in the age group “>45” are less likely to fall into confirmation bias than the two younger groups. Most of the groups of investors that appear to commit confirmation bias fall into the 36–45 age group. Additionally, it is noticeable that loss aversion is much higher in this age group (36–45) than in other age groups. The loss aversion question was designed to measure whether the investors prefer lower- risk investments to higher–risk ones. It emerged that, as we had expected, the youngest groups favour riskier investments. Even though the age group “>45” is quite close to the youngest, the difference between them is still significant.
There can also be observed significant differences in the hot hand fallacy between age groups. As can be recalled from the definition, both hot hand and gambler’s fallacies involve the conclusion of future outcomes based on past events. In theory, it is reasonable to assume that these two phenomena will occur in parallel. If a person feels that the past values of their assets will affect future values, then their thought process would align with both hot hand and gambler’s fallacies. However, we observed that a subtle difference between these two biases means that they may not necessarily occur together. In the case of the hot hand fallacy, there is no change of direction. It assumes a consistent series of outcomes in the future; if a company’s returns have risen over the past two months, then this trend will continue into the future without any change. On the other hand, the gambler’s fallacy states that if returns have decreased over the past two months, they are bound to increase in the future. Thus, the latter fallacy is based on a notable shift in circumstances. We assumed the hypothesis that both the gambler’s and hot hand fallacies have the same mean, and they are equally preferred. However, based on the data, we rejected the null hypothesis, and we can assert that investors favoured consistency in their stock returns (hot hand) over changes to them (gambler’s) (
Table 3).
Fifth, an important consideration is that we have used
positive framing in asking both questions, that is, we have asked them in such a manner that the outcomes lean towards a better situation; if it is increasing, then it will continue to grow (hot hand), and if it is decreasing, then it is due to increase (gambler’s). For both biases, we observed some optimistic responses since most investors agreed with them. In another question, we asked investors to give their opinions regarding Iran’s economy, that is, whether or not it is growing. The majority of investors either strongly disagreed (48.3%) or disagreed (32.2%), which in total is 80.5%. This highlights the fact that the stock market is not the economy, and there could well be a considerable disconnection between these two. The paper “Economic Forces and the Stock Market” [
39] shows it is not always the case that macroeconomic variables systematically and directly affect stock market returns. To shed more light on the situation in Iran and in recent times, Goodman’s [
40] article in New York Times “Iran’s Economy Is Bleak. Its Stock Market Is Soaring” justifies these findings and has been correlated with aspects of geopolitics such as U.S sanctions and macroeconomics.
Sixth, we have analysed
fallacies with regard to investors’ experience on the stock market. The first bias that is noticeable in
Table 4 is the Dunning–Kruger effect. Investors who are more experienced in the TSE are more likely to agree with our statement in the survey about the obstacles to make a profit in the stock market. There was more agreement among more experienced investors than those in the other two groups with fewer years of experience. As investors become more acquainted with the ups and downs of the stock market, they would think and behave differently with regard to making a profit in the long term.
Similarly, in the case of the bandwagon effect, investors with greater experience (the 5–10 years group) are more immune to this bias than those in other groups. Additionally, loss aversion was more prevalent in groups with more experience, where investors preferred low returns and steady profits over riskier and higher returns. As expected, the confirmation bias among less experienced investors (especially those with less than three years of experience) is higher than among more experienced ones.
4.2. Direction and Strength of Biases
The previous section revealed the patters of biases based on individual characteristics such as gender, age, and experience, but examined them separately. The analysis below goes further by discussing the behaviour of fallacies in groups (clusters). By grouping the biases together and comparing them with each other, one can measure which biases are crucial to explaining the variability within our data. For this purpose, we first implemented the Principal Component Analysis (PCA) method to reduce the dimensions of our independent variables and to then extract the variables that contribute the most to the dispersion of our individual investors. This analysis is oriented towards discovering whether any cognitive biases or investors’ features overlap in terms of informational content. PCA analysis, based on eigenvectors, finds the synthetic variables—the axes of highest variability of data. The first and second eigenvectors are typically analysed and plotted, while their explanatory power results from the percentage of variance explained. The contribution of the variable to the following principal components is to make a ranking of their importance. The second method applied here, clustering of observations, allows for explicit groups of similar factors to be obtained. Unsupervised learning algorithms, such as k-means, require setting a priori the number of clusters; this parameter is crucial for the final grouping. There are many criteria for selecting the most appropriate number of clusters [
41], while their recommendations are often very diverse, as shown in practice. Each dataset requires individual treatment due to differing degrees of clusterability. An efficient approach is to inspect the hierarchical clustering, for which the dendrogram presents all available partitioning (from separation of all observations into individual [bottom] clusters called singletons to collection of all data into a single [top] cluster). Vertical lines illustrate the number of clusters at a given height (on the y axis) and support the clustering decision with regard to clusterability. To assure the robustness of division into groups, the dendrogram clusters are compared with k-means clusters. The following two measures of quality were applied: silhouette statistic, which examines whether the centroids of an object’s own cluster are closer than centroids of the second-closest cluster (fine partitioning if all individual silhouette values are non-negative); and variable importance, which checks for each variable the degree to which partitioning changes when the examined variable is shuffled (a variable is important when, due to mixing of its values, the misclassification rate on the x-axis is high).
As a result, explanatory variables in the first two principal components of PCA cumulatively account for 34% of the variation in our data set (
Table 5). This result proves that reducing dimensions in this dataset is a challenging, due to a relatively low information overlap among analysed variables.
In this two-dimensional PCA, the hot hand fallacy, together with availability and confirmation, seem to be the variables that explain the most variance. At the same time, the amount of investment is the least important variable (see
Figure 3). Those factors also had a higher range of variation among investors, which therefore explains the greater degree of dispersion observed than with the other biases and characteristics. With regard to gender, even if the different biases discussed tend to be more apparent in female subgroups, one can see that the overall variation in responses in the dataset did not have much to do with gender. Much more influential than gender is the age of investors and amount of experience in the financial market. It must be said that answers for the questions on Dunning-Kruger, gender, investment, and Iran’s economy were very similar across different investors in the context of a two-dimensional PCA.
Two dimensional-visualisation of PCA (
Figure 4) can help identify the strength and direction of biases and other variables so that they can be grouped. Positively related variables are grouped together, while negatively related variables are positioned on the opposite sides of the plot origin in opposing quadrants. The distance between variables and the origin determines the quality of the variables on the factor map. Variables that are far away from the origin are well represented on the factor map. Thus, one can conclude that the perception of Iran’s economy is negatively correlated with most factors. The reaction for the bandwagon effect and availability cascade is very similar.
As well as PCA dimensions reductions, individual data can be clustered with k-means and visualised in 2D space (
Figure 5). With an optimal number of clusters k = 3 selected using the dendrogram approach, one can check the groupings and separation of variables. K-means clustering with Euclidean distance showed that confirmation bias and investment amount form one group; gender, age and assessment of Iran’s economy form the second group; and the remaining biases (availability, bandwagon, loss aversion, hot-hand, Dunning–Kruger and gambler’s), together with experience, form the third group. This partitioning is stable both in k-means and in the dendrogram, while the silhouette statistic proves its high quality. Feature Importance, a method for diagnosing the impact of a given variable on cluster formation, plays a role similar to significance in parametric statistics. One can see that the most influential factor for partitioning is loss aversion bias, followed by experience and gambler’s bias. The three least important factors are gender, age, and perception of Iran’s economy, and they build their own cluster. The conclusion is that diversification of investors likely results mostly from experience and somehow inherited risk aversion, while gender and age are not decisive factors.
4.3. Individual Investors’ Profiles
The dataset from the survey is a two-dimensional table with observations (people) and their features. Previous analysis has focused on clustering of observations to obtain groups of features. The following approach is the opposite; it involves clustering of features to obtain groups of observations that constitute investors’ profiles. The data were numeric; thus, the k-means algorithm is sufficient, and extensions as k-modes for qualitative data or k-prototypes for mixed data are unnecessary. We also considered using Self-Organising Maps to detect clusters [
42], but the results were not straightforward in interpretation. We ran pre- and post- clustering diagnostics to validate the results. In the pre-clustering analysis, we considered an optimal number of clusters using the silhouette statistic, the gap statistic, inertia and a dendrogram. In the post-clustering analysis, we examined the significance of differences in group means using a pairwise
t-test with the Bonferroni
p-value correction, using tabular and visual inspection tools. We also calculated the ratio of average values inside and outside the cluster, which shows whether values within the cluster are significantly higher or lower than those in the rest of the sample.
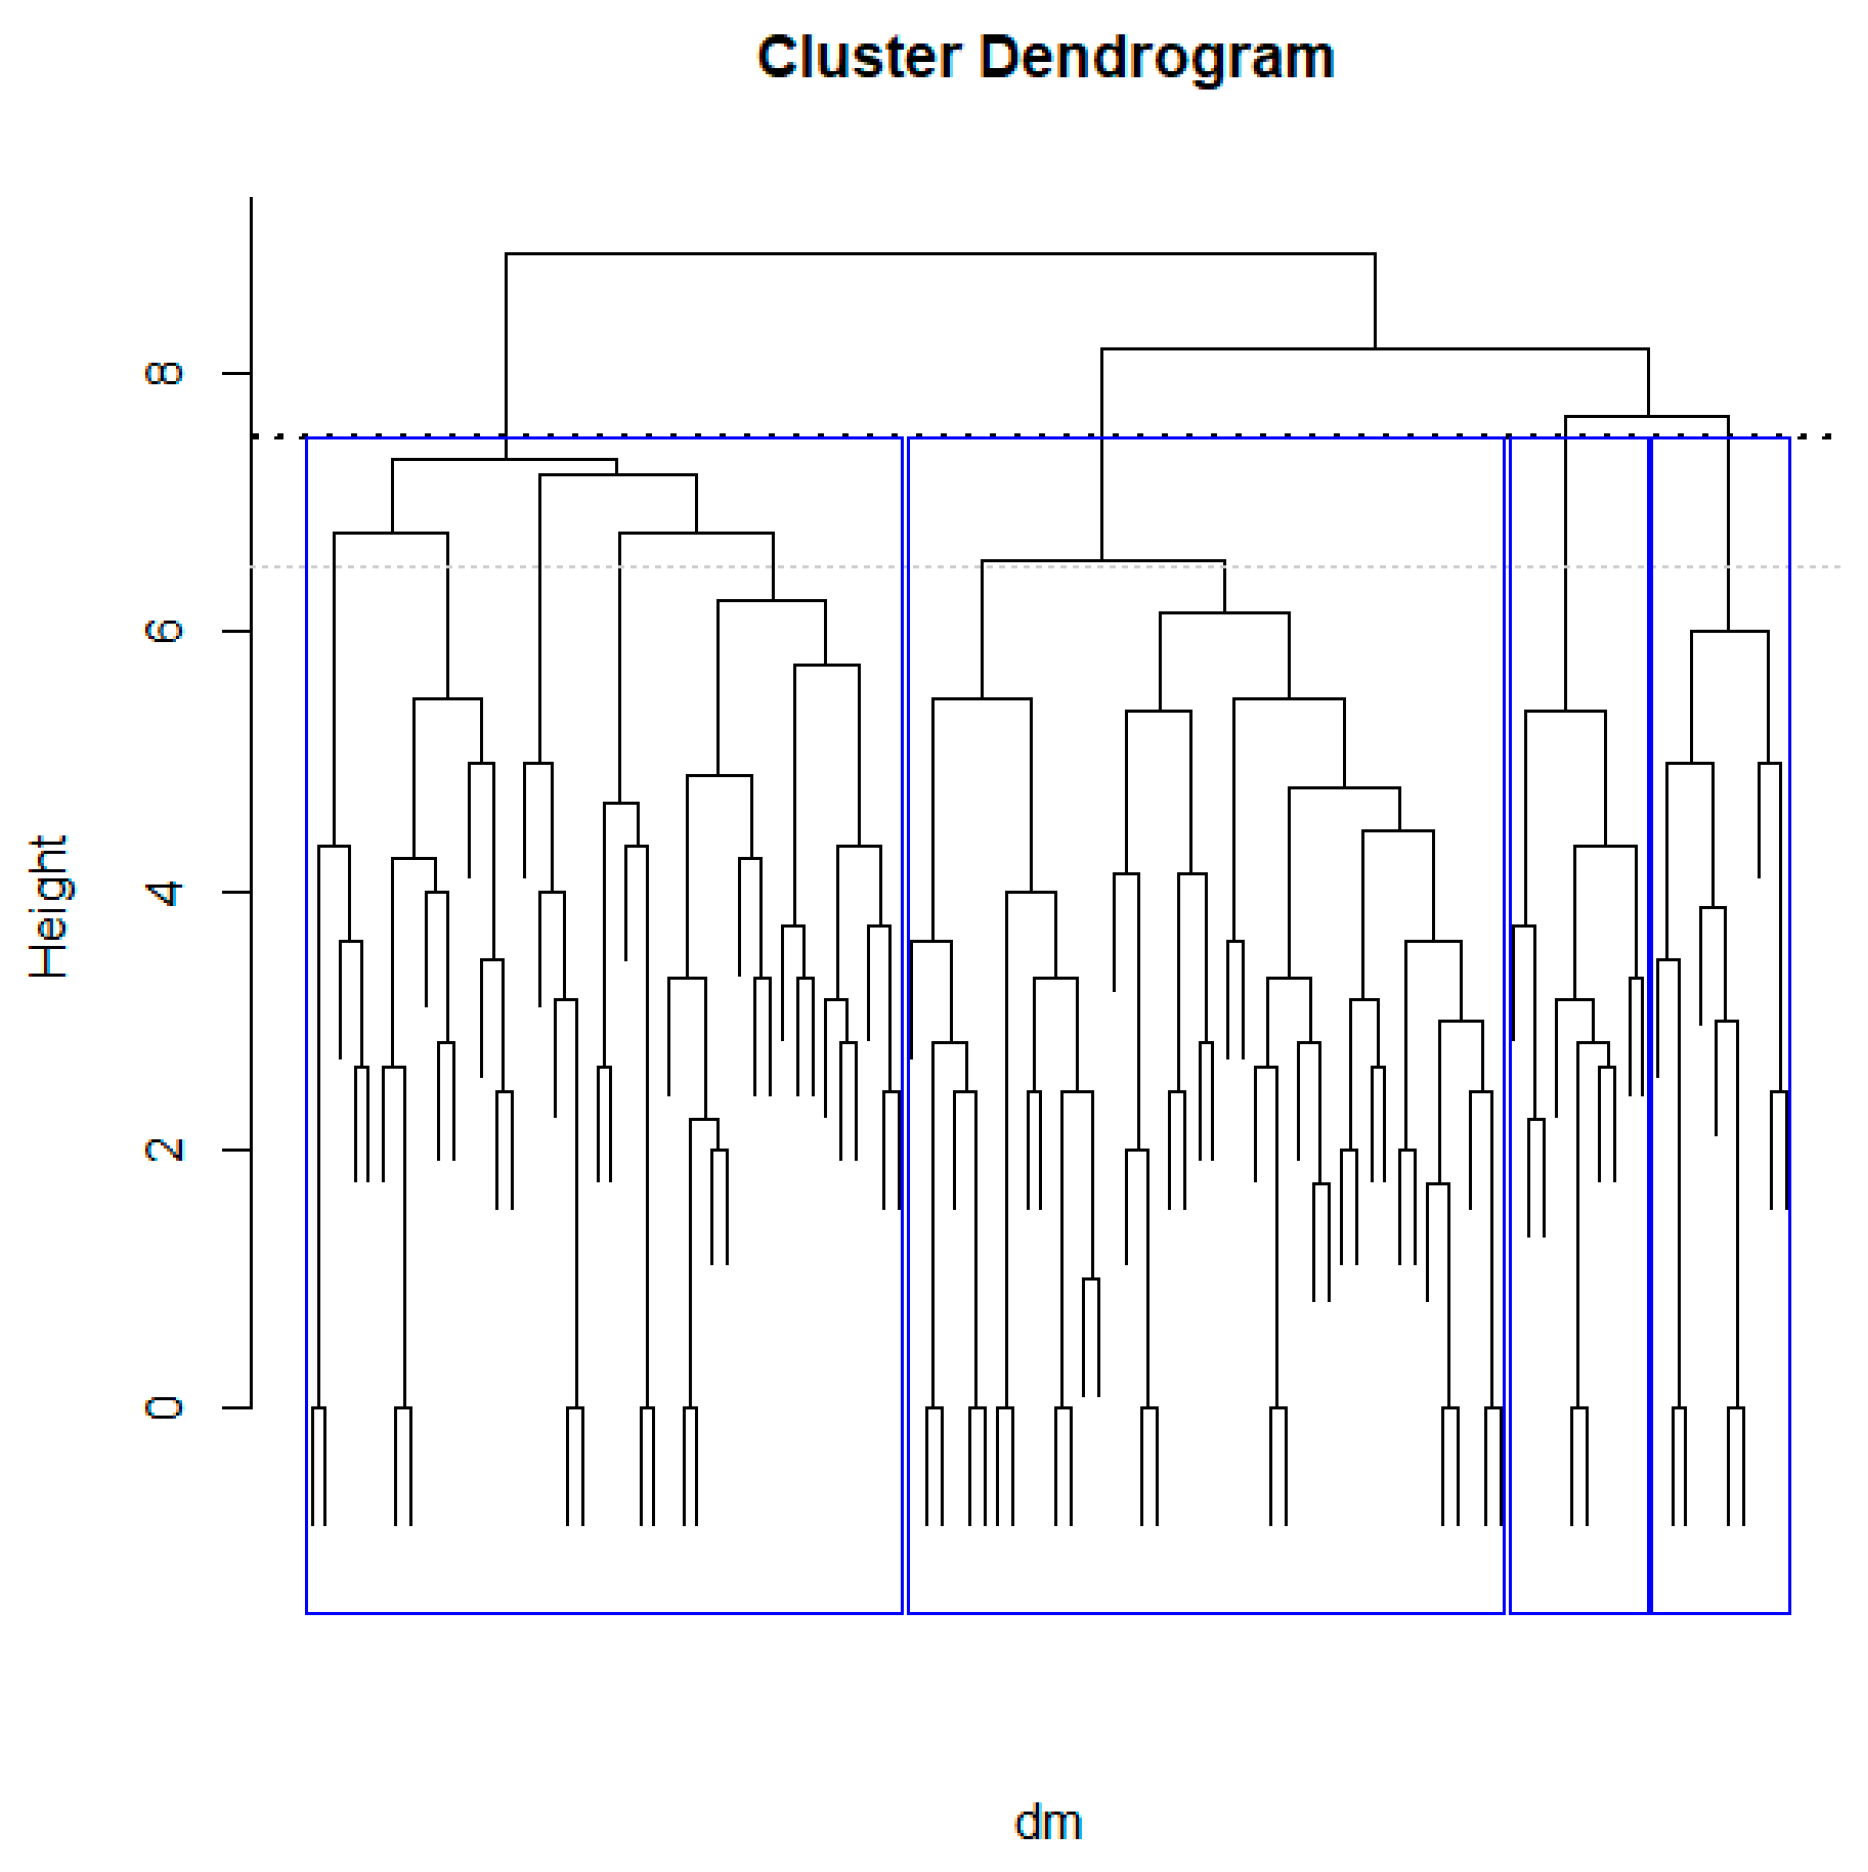
In the pre-clustering phase, the silhouette statistic recommended two clusters only, the gap statistic recommended a single cluster, inertia advised 14 clusters, while the dendrogram separated four visible groups. As in the previous section, we used results from the dendrogram, which performed the best with this dataset regarding sample size and inherited clusterability. A number of clusters are visible as vertical groupings (
Figure 6). Distinctive division of observations into four clusters was possible at the height of ca. 8. The second feasible partitioning at height = 6.5 generated nine groups, which for 104 observations was too many. Partitioning below height = 6 are almost random and drive the system to singletons.
In the post-clustering phase, each of the four obtained clusters conducted for each of the 12 variables involved a test for equality of means inside and outside the cluster. We examined the significance of the differences between inside- and outside-cluster values to determine the significant and important disparities only (
Table 6). This helped us to find the significant drivers of each cluster and to validate the quality of partitioning.
The four derived clusters, which constitute the predominant investors’ profiles, can be characterised as follows (
Table 6) (values in brackets are ratios of values within the cluster to those outside the cluster):
- Cluster 4:
Experienced, older investors (age and experience are higher than average) who invested more than average (1.11). These investors are less liable to fall into confirmation bias (0.85); instead, they look for reliable information prior to making decisions. They also reveal higher instances of both hot hand bias (1.2) (showing an optimistic attitude in terms of sticking with trends) and Dunning–Kruger bias (1.17) (betraying realistic awareness of the difficulty of making a profit on the stock exchange at certain times).
- Cluster 1:
Less experienced investors who invested large amounts (1.13) and are pessimistic about stock trends (0.79). These investors are vulnerable to all analysed biases except for Dunning–Kruger. However, they are most susceptible to loss aversion bias (1.49)– among all cluster groups, they are the group most concerned with not wanting to risk too much.
- Cluster 2:
Less experienced investors (experience 0.797) who invested only a small amount (investment 0.55). They are afraid of loss (loss bias 1.23) and are risk-averse, but are vulnerable to gambler’s (0.83), hot hand (0.67), and availability cascade (0.85). This means that they are less sensitive to information stimuli and do not tend to make predictions based on their emotions.
- Cluster 3:
Less experienced investors (experience 0.736) who invested a large amount (investment 1.19) and are relatively young (0.706). They behave similarly to investors from cluster 2, with two differences: they are much less vulnerable to both loss aversion bias (0.597), which makes them risk-lovers, and much less susceptible to bandwagon bias (0.758). One can conclude that this group of young investors are non-emotional and love risk.
This summary demonstrates that risk-seeking is a predominant characteristic among young investors. A pessimistic attitude to general market trends makes investors vulnerable to all possible biases. There is no division by gender—females exhibit the same behaviour as males. Among inexperienced groups of investors (clusters 1, 2, 3), two contradictory biases can be seen to occur in parallel; gambler’s and hot hand biases are jointly declared (either strongly or weakly). This may be interpreted as irrationality on the part of investors or their poor understanding of market trends and forecasting methods. The overall conclusion is that vulnerability of investors to various biases is a complex phenomenon. This study reveals the existence of (at least) four factors significant for cognitive biases: experience, age, the value of the investment, and market perception. Interestingly, a greater level of experience in the stock market means a more limited number of biases that may be manifested; however, by no means are they eliminated entirely.
5. Discussion of Results
From a methodological perspective, this study encountered a few challenges in data analysis, the most significant one being a moderate sample size. Even if datasets of more than 100 observations are not considered a small sample, they require careful treatment and validation to assure stability and robustness of results. We applied robust statistical solutions, such as a t-test based on t-Student distribution, which is dedicated to moderate samples. In the clustering procedure, we considered a few alternative methods. The multitude of available clustering criteria results from their various characteristics and usefulness addressing a diverse range of problems; thus, deciding what to use requires research expertise and robustness checks. The examined dataset was only clusterable to a moderate degree, and a trial to extract a large number of groups failed due to instability. The comprehensive analysis of possible groupings allowed robust partitioning, with significantly different values of variables. ANOVA and pairwise tests of differences in means among cluster groups revealed significantly diverse characteristics among obtained investors’ profiles. For validity checking, we ran alternative partitioning (not reported in detail); the results were similar, statistically weaker, and led to satisfying conclusions. In the validation procedure, we also considered bootstrapping to improve the statistical features of the sample; however, the results did not alter significantly, which confirms the robustness of outputs from pure data.
From a conceptual perspective, this approach is innovative in a number of ways. Firstly, the cognitive biases were considered jointly, not separately; secondly, the problem was approached directly from individual survey data, not indirectly from market data; thirdly, unsupervised learning methods such as clustering and PCA were applied (rather than time-series, as has been used in the majority of studies). This innovative approach also presents methodological challenges in designing survey questionnaires and analytical paths. The lack of other similar studies using these methods limits the possibility of comparison with existing state-of-the-art. On the other hand, it opens the door for further scientific discussion on profiling of investors and understanding how their attitudes and perceptions can influence the market in the form of collective, non-rational behaviour.
From an empirical perspective, we believe that the obtained profiles of investors present an interesting cross section of competencies, behaviour, rationality, and cognitive biases. Moreover, the size of groups suggests that TSE investors are widely diversified and that these groups have a significant impact on the financial market. Going forward, a challenge for the scientific community will be to validate these results by comparing them with studies on other markets or on the same market in the following years. This may help understand the unexplainable patterns in financial markets and more accurately predict potential financial crises.
6. Limitations and Future Directions
The presented study is the first trial evident in the international literature to bundle investors’ cognitive biases. However, the conclusions from this research are far from being generalised to all world financial markets. The local specificity of Iranian investors has some evident similarities to other markets, but without a doubt, it also has significant differences due to cultural and economic diversified systems. Thus, the main limitation of this study is the narrow possibility to classify investors universally on the other markets by using classes and categories from this analysis.
The major limitation of this study is also a future direction for further research. The impossibility of using this classification of investors on the other markets opens the door for similar analyses in different countries. This comparative stream of research would be important because of at least two reasons. Firstly, international studies on cognitive biases among investors could present how much the Iranian financial market is similar or different to other markets. Understanding the homogeneities and heterogeneities of investors’ profiles are essential in designing institutions and mechanisms for financial markets. Secondly, a study for the single market cannot test the correlation between the strength of cognitive biases and financial crises. The broader understanding of differences between investors, as well as of the degree of participation in the market of given groups (with specific biases), can be an important factor in explaining non-rational behaviours and other non-typical phenomena. The research design developed in this paper can be used universally.
7. Conclusions
In this research, we aimed to reveal the various cognitive biases present among investors in the Tehran Stock Exchange (TSE), taking into account such factors as age, gender, and experience in order to reveal the underlying reasons for investors’ behaviour in the stock market. We measured the most common cognitive fallacies by asking 104 investors to fill out the survey in which each question was related to a different cognitive bias. We observed that different groups of investors—these groups being defined by their attributes—react differently in their decision-making processes towards achieving success in their stock market journeys. Our hypothesis that cognitive biases occur to varying degrees between groups defined by age, experience and money invested is true. However, we obtained clear evidence that gender does not have an impact on cognitive biases and choices. Therefore, one cannot generalise when forming opinions and making judgements without taking into account the personal characteristics of investors.
The survey data were analysed with the use of the unsupervised learning methods as PCA and k-means clustering. We analysed clusters of features and clusters of individual observations. We found similarities in behaviour among analysed personal characteristics and biases; level of experience is a significant factor in almost all cognitive biases, while the amount invested is related to confirmation bias. When clustering, the strongest drivers of partitions were loss aversion, experience, and gambler’s bias, while the weakest were gender, perception of the market situation and age. However, they were never observed to act individually; thus, the final investor’s profile depends on the specific bundle of features. In clusters of individual values, we applied a t-test to examine whether within-cluster values differed significantly from other values. We found out that the relationships between some factors are not linear but multi-dependent and exogenous. We discovered that even those biases that tend to be similar in theory (gambler’s fallacy and hot hand fallacy in this case of this study) do not necessarily behave and influence the investors in the same way. One can conclude that cognitive biases occur jointly; investors exhibit similar behaviours in terms of confirmation, availability, loss and bandwagon biases, which is partly supported by their level of experience and their perception of the overall situation.
This study raises a few issues. Firstly, cognitive biases in behavioural finance appear jointly and depend on the personal characteristics of investors. Secondly, investors’ profiles are influenced by age, stock market experience and perception of market trends, but not by gender. Thirdly, inexperienced investors who are pessimistic about market developments and have invested a great amount are the group most vulnerable to almost all analysed biases. Fourthly, young investors who are more optimistic about general trends are, for the most part, less susceptible to all biases. Fifth, older and experienced investors are not affected by loss aversion bias, gambler’s fallacy, availability cascade bias or bandwagon bias. Sixth, one can put together an investor’s profile using unsupervised learning methods, such as k-means, feature importance and PCA.
This study opens the door for further analysis, specifically around joint cognitive biases which are known in the literature. It proves that making generalisations about investors’ behaviour without referring to their characteristics blurs the picture of real transmission channels of perceptions into decisions on the financial market. It also demonstrates that unsupervised learning methods serve as useful analytical approaches, even in the case of cognitive science questionnaires.
Despite a relatively simple survey being used, the use of new data science methods enabled consistent and interpretable results to be gained and the clustering of cognitive biases to be identified. Repeating this type of research across different markets would allow certain differences in behaviour resulting from these markets’ cultural and institutional differences to be identified. Perhaps the grouping of cognitive errors in given groups of investors is a common phenomenon, but the characteristics of the market behaviour are determined by the proportions in which these errors occur.


