Article

Influence of Soil Particle Size on the Engineering Properties and Microstructure of a Red Clay

1
Research and Development Center of Transport Industry of Intelligent Manufacturing Technologies of Transport Infrastructure, CCCC Second Harbor Engineering Company Ltd., Wuhan 430000, China
2
State Key Laboratory of Coastal and Offshore Engineering, Dalian University of Technology, Dalian 116024, China
*
Author to whom correspondence should be addressed.
Appl. Sci. 2021, 11(22), 10887; https://doi.org/10.3390/app112210887
Submission received: 21 September 2021 / Revised: 13 November 2021 / Accepted: 16 November 2021 / Published: 18 November 2021
(This article belongs to the Special Issue Advances in Geotechnologies in Infrastructure Engineering)

Abstract

:
Particle size exerts a significant influence on the mechanical behavior of soil. However, insufficient research has been carried out on red clay formations, which are widespread in some Chinese provinces. Here, using unconfined compressive strength (UCS) tests, wetting–drying (WD) tests, and low-temperature nitrogen adsorption tests, we examined the relationship between the particle size and a number of mechanical and microstructural characteristics of a red clay outcropping at a construction site in China. Our results suggest that, depending on the surface area, porosity, particle size, and dry density, the failure mechanism in UCS tests will be different. That is, as the particle size increases, the failure mode of soil changes from split failure into shear failure. In addition, as the dry density increases, the UCS of the soil sample is significantly improved, and its total porosity and fractal dimension decrease. We also evaluated a dependence on particle size and the number of WD cycles on the distribution and size of cracks in WD tests. We conclude by suggesting that particle size, dry density, and WD behavior should all be taken into account in roadbed designs in red clay formations.

1. Introduction

Red clay is a shared, but problematic soil characterized by a high liquid limit (LL) and plasticity index (PI) and usually presents a high natural moisture content (NMC). It is generally distributed in the hot and humid regions of South China [1,2,3]. With the development of the economy, an increasing number of railways and roads pass through this particular soil area. However, if red clay is widely used in roadbeds as filler, it will inevitably lead to road cracks, uneven road surface settlement, and other engineering problems, which will further cause damages to the roads. Therefore, specialized treatments are required for red clay to be exploited in embankments.
Soil mass is a complex particle system, and the grain composition and size of particles play an essential role in their internal deformation characteristics [4]. Accordingly, it is necessary to consider the impact of the particle size on the roadbed when processing red clay. Furthermore, soil particles with different scales have different modes of action [5,6], resulting in various binding modes between particles. From a microscopic perspective, divergent clay minerals, arrangements, and distribution relationships affect the specific surface area (SSA), micropores, single-grain structure, and cemented structure of soil particles, where van der Waals’ force is the main force between particles. From a macroscopic perspective, cracks, layers, and large pores directly impact the deformation and mechanical properties of the soil, where the external load is the main force. Under the imposition of external forces, the soil mass begins to break down and deform from the microstructure. Then, the particles contact and stagger and eventually become dislocated and discrete, damaging the macroscopic structure.
Regarding the study on the impact of particle size effect on soil mass, Cho [7] et al. showed that the size and shape of soil particles reflect their formation history, and the macroscale behavior of the soil is, in turn, the result of particle-level interactions influenced by particle shape. The increase in particle irregularity leads to a decrease in stiffness but an increase in sensitivity to stress states. The macroscale behavior of soils explained in microscopic terms is reviewed by Santamarina et al. [8]. The primary distinction between fine and coarse particulate materials was emphasized. Thornton [9] investigated the quasi-static shear deformation of granular media and examined the evolution of internal variables associated with micromechanical processes occurring at the particle scale by numerical simulations. The results illustrate the effect of inter-particle friction on macroscopic mechanical and micromechanical behavior. Wang et al. [10] studied the effect of particle size distribution on the shear strength of the accumulated soil by direct shear and triaxial tests, and found that the shear angle increased with the increase of median particle size and gravel content. Qi et al. [11] explored the effect of particle size on the thermal desorption of PCBs from contaminated soil and found that fine soil particles have higher removal and destruction efficiency than coarse ones. Chang et al. [12] built a mathematical model based on the concept of a dominant particle network to predict the minimum porosity of granular soil with arbitrary particle size distribution. Cubrinovski and Ishihara [13] studied the effects of fineness, grain-size composition, and particle shape on porosity, giving a set of empirical correlations, as well as characterized the importance of grain-size distribution and the presence of interstices in laboratory-produced composite soils or mixtures containing pulverized sands. Fuggle et al. [14] studied the effect of particle size on the void ratio of loosely packed binary particle mixtures and argued that the relative content of fine particles in the mixture significantly changes the void structure of the material and affects the material properties. Experimental and numerical simulation results manifest how the pore ratio varies nonlinearly when the binary mixture contains other fine particles, and a series of experimental results for the particle size ratio is presented. Islam et al. [15] reported that the angle of internal friction and the maximum horizontal shear stress of uniform sands increase with increasing particle size, and the larger the gradation, the higher the shear strength. Furthermore, a theoretical method correlating particle size to the macroscopic response has also been proposed. Cheraghi et al. [16] studied the effect of particle size on hysteretic sediment transport. By assessing rainfall patterns, flow rates and sand content data were measured for seven particle size classes. It was found that the hysteresis rate varied with the particle size, decreasing when particles were more prominent than 50 µm. Rasti et al. [17] conducted an experimental study on the shear strength characteristics of sandy soils with different particle sizes. They found that sandy soils with larger particle sizes have larger friction angles than smaller ones, determining a direct relationship between soil friction angle and soil particle characteristics. Aberg [18], Bobei et al. [19], and Peters and Berney [20] also reported that the particle size distribution of granular soils has a significant effect on their mechanical properties.
The above research mainly studied the impact of particle size on soil mass, but few were concerned about the impact of red clay with different particle sizes on engineering characteristics. Therefore, this paper aims to determine how the engineering characteristics of red clay will change by varying particle sizes. The red clay in Guilin is chosen as the research material, and the selected particle sizes are 0.25 mm, 0.5 mm, 2 mm, and 5 mm. Multiple tests are conducted on red clay samples with different particles and dry densities, including unconfined compressive strength (UCS) tests, wetting–drying (WD) tests, and low-temperature nitrogen adsorption tests, to explore the impact of particle size on the engineering properties and microstructure of red clay.

2. Materials and Methods

2.1. Research Materials

2.1.1. Exploration of Physical Properties of Sample Site

The red clay was taken from a construction site in Yanshan Town, Guilin City, located in the east wing of the Yanshan anticline and the western end of the Ertang syncline. The distribution stratum is a light gray thick layered massive limestone from the Devonian Donggangling Formation (D2d), where the regional structure is relatively stable. The local average temperature is 18.9 ℃; the average rainfall is 1949.5 mm; the average relative humidity is between 73 and 79%; the average sunshine hours is 1670 h; the rainfall is abundant; the surface water system is relatively developed; and the water level of the nearby river is 152.60 m, as measured during the survey.
According to the results of on-site drilling, in situ testing, and laboratory soil testing, the foundation soil (rock) in the site is mainly composed of cultivated soil (Q4pd), red clay (Q3el), and limestone (D2d). The soil used in this test is red clay (Q3el) with a pH from 6.80 to 6.92. The specific physical and mechanical parameters of the soil are displayed in Table 1.

2.1.2. Material Composition of Soil Samples

An S-4800 Field Emission Electron Microscope (JEM-2100F) jointly produced by the Japanese High-tech Company and the British Oxford Company was used to analyze the energy spectrum of the soil sample. The energy spectrum result of the red clay is exhibited in Figure 1, and the content of each element is shown in Table 2.
The X′PertPRO X-ray diffractometer produced by PANalytical B.V. in the Netherlands was used to examine the mineral composition of the soil sample. The X-ray diffraction pattern is shown in Figure 2, and the mineral composition is shown in Table 3. Following Figure 2 and Table 3, the minerals in the red clay samples can be identified as quartz, laurel, montmorillonite (2:1 layered silicate), kaolinite, clinochlorite (2:1 phyllosilicate), and illite. In addition, the color of the soil sample also determines the existence of hematite; however, its content in some samples is possibly lower than the XRD limit of detection, so the XRD peak is not apparent (approximately 35 2theta). The semi-quantitative method chosen for minerals was the Rietveld method [21].

2.2. Testing Methods

The retrieved soil samples were air-dried, crushed, and then passed through sieves with particle sizes of 0.25 mm, 0.5 mm, 2 mm, and 5 mm, respectively. The initial moisture content was measured using a drying oven, and the quantity of distilled water required to reach the optimal moisture content of red clay at 37.78% was calculated using Formula (1). In addition, the distilled water and the soil sample were evenly mixed, and the mixture was sealed for 24 h after completion.
m w = m 0 1 + 0.01 w 0 × 0.01 ( w 1 w 0 )
where mw represents the amount of water required (g), m0 represents the quality of air-dried soil samples (g), w0 represents the moisture content of air-dried soil (%), and w1 represents the moisture content required for sample preparation (%).
Three soil samples with different particle sizes were selected, and their masses were 163.21 g, 175.77 g, and 188.32 g, respectively. The three samples were compacted in six layers, obtaining cylindrical samples with dry densities of 1.3 g/cm3, 1.4 g/cm3, and 1.5 g/cm3. Finally, an UCS test was carried out using an unconfined compression apparatus. Next, three soil samples with different particle sizes with 102.01 g, 109.86 g, and 117.70 g were selected. We compressed soil samples of different masses into a 20 mm ring knife to obtain samples with dry densities of 1.3 g/cm3, 1.4 g/cm3, and 1.5 g/cm3, respectively. WD cycles were performed after saturation: the sample was placed in a constant temperature box at 40 °C for 12 h for drying cycles and then immersed in water with a saturator for 12 h for wetting cycles. A high-speed scanner was used to take pictures in each cycle until the test was completed, repeating the cycle 12 times. The SSA and pore distribution of red clay with different particle sizes were measured via a low-temperature nitrogen adsorption test, using the TriStar II 3020 automatic three-station SSA and porosity analyzer from Mike Instruments Inc. (Norcross, GA, USA). The analysis of pore size showed that the range was 3.5 angstroms to 5000 angstroms, the pressure range was 0 to 1000 mmHg, the SSA could be as low as 0.01 m2/g, the time required to measure specific the surface area was 20 min, the repeatability was better than 1%, the analysis bath was at −195.850 °C, and the balance time was 10 s. The experiment process is as follows. A certain amount of red clay was put into the sample tube to be degassed and then weighed. Finally, the red clay was placed on the analysis station for sample analysis and calculation.

3. Results and Analysis

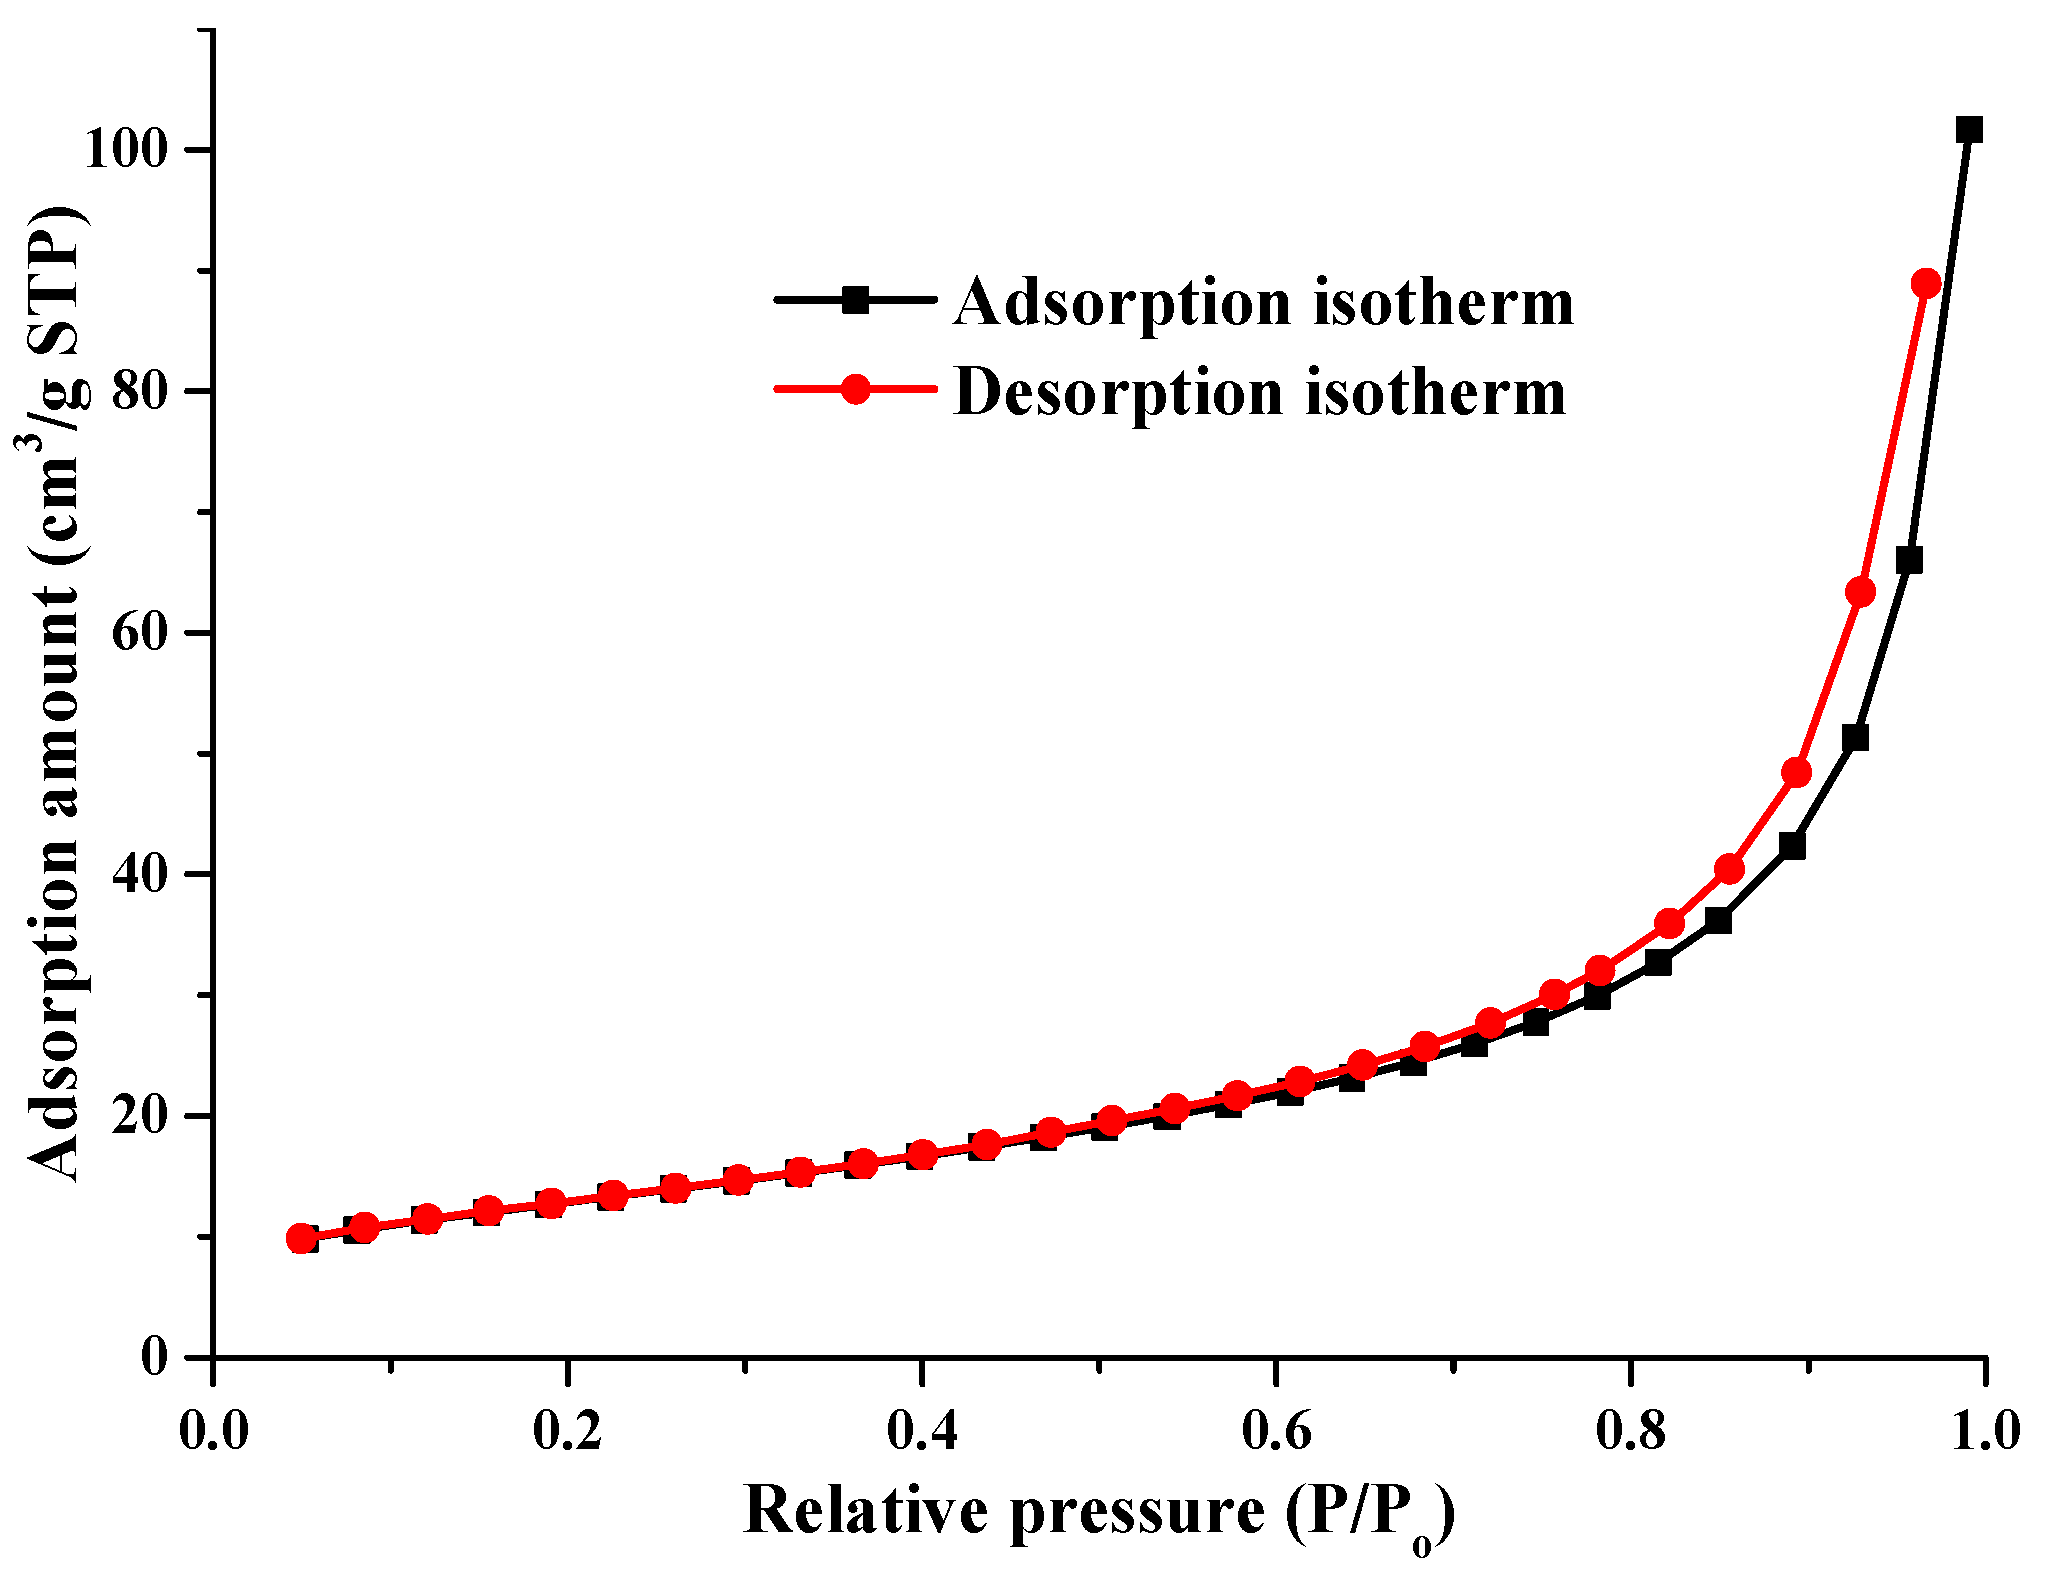
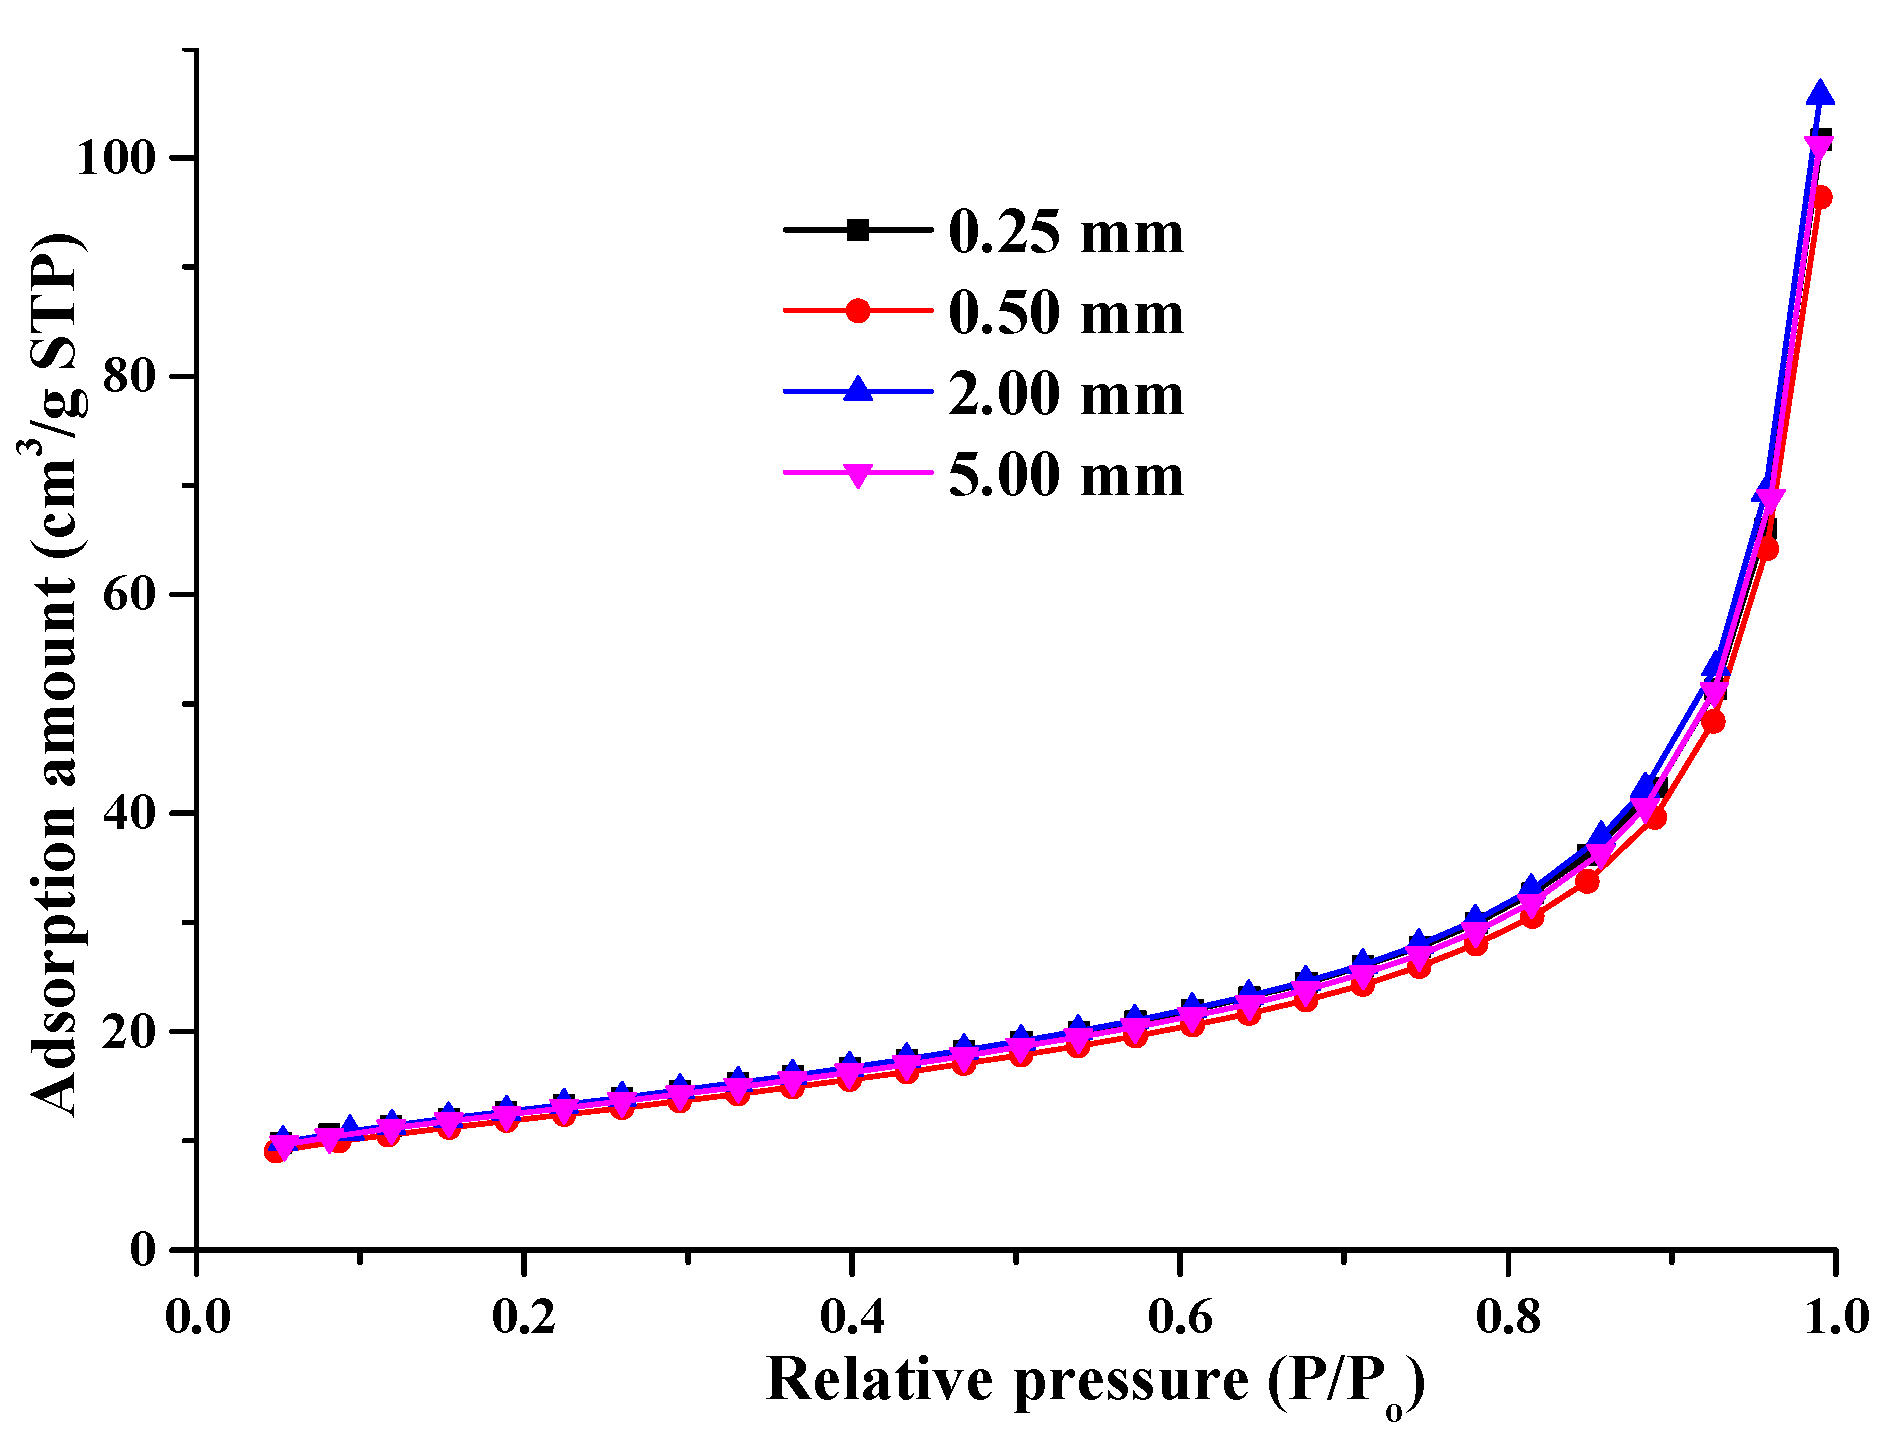
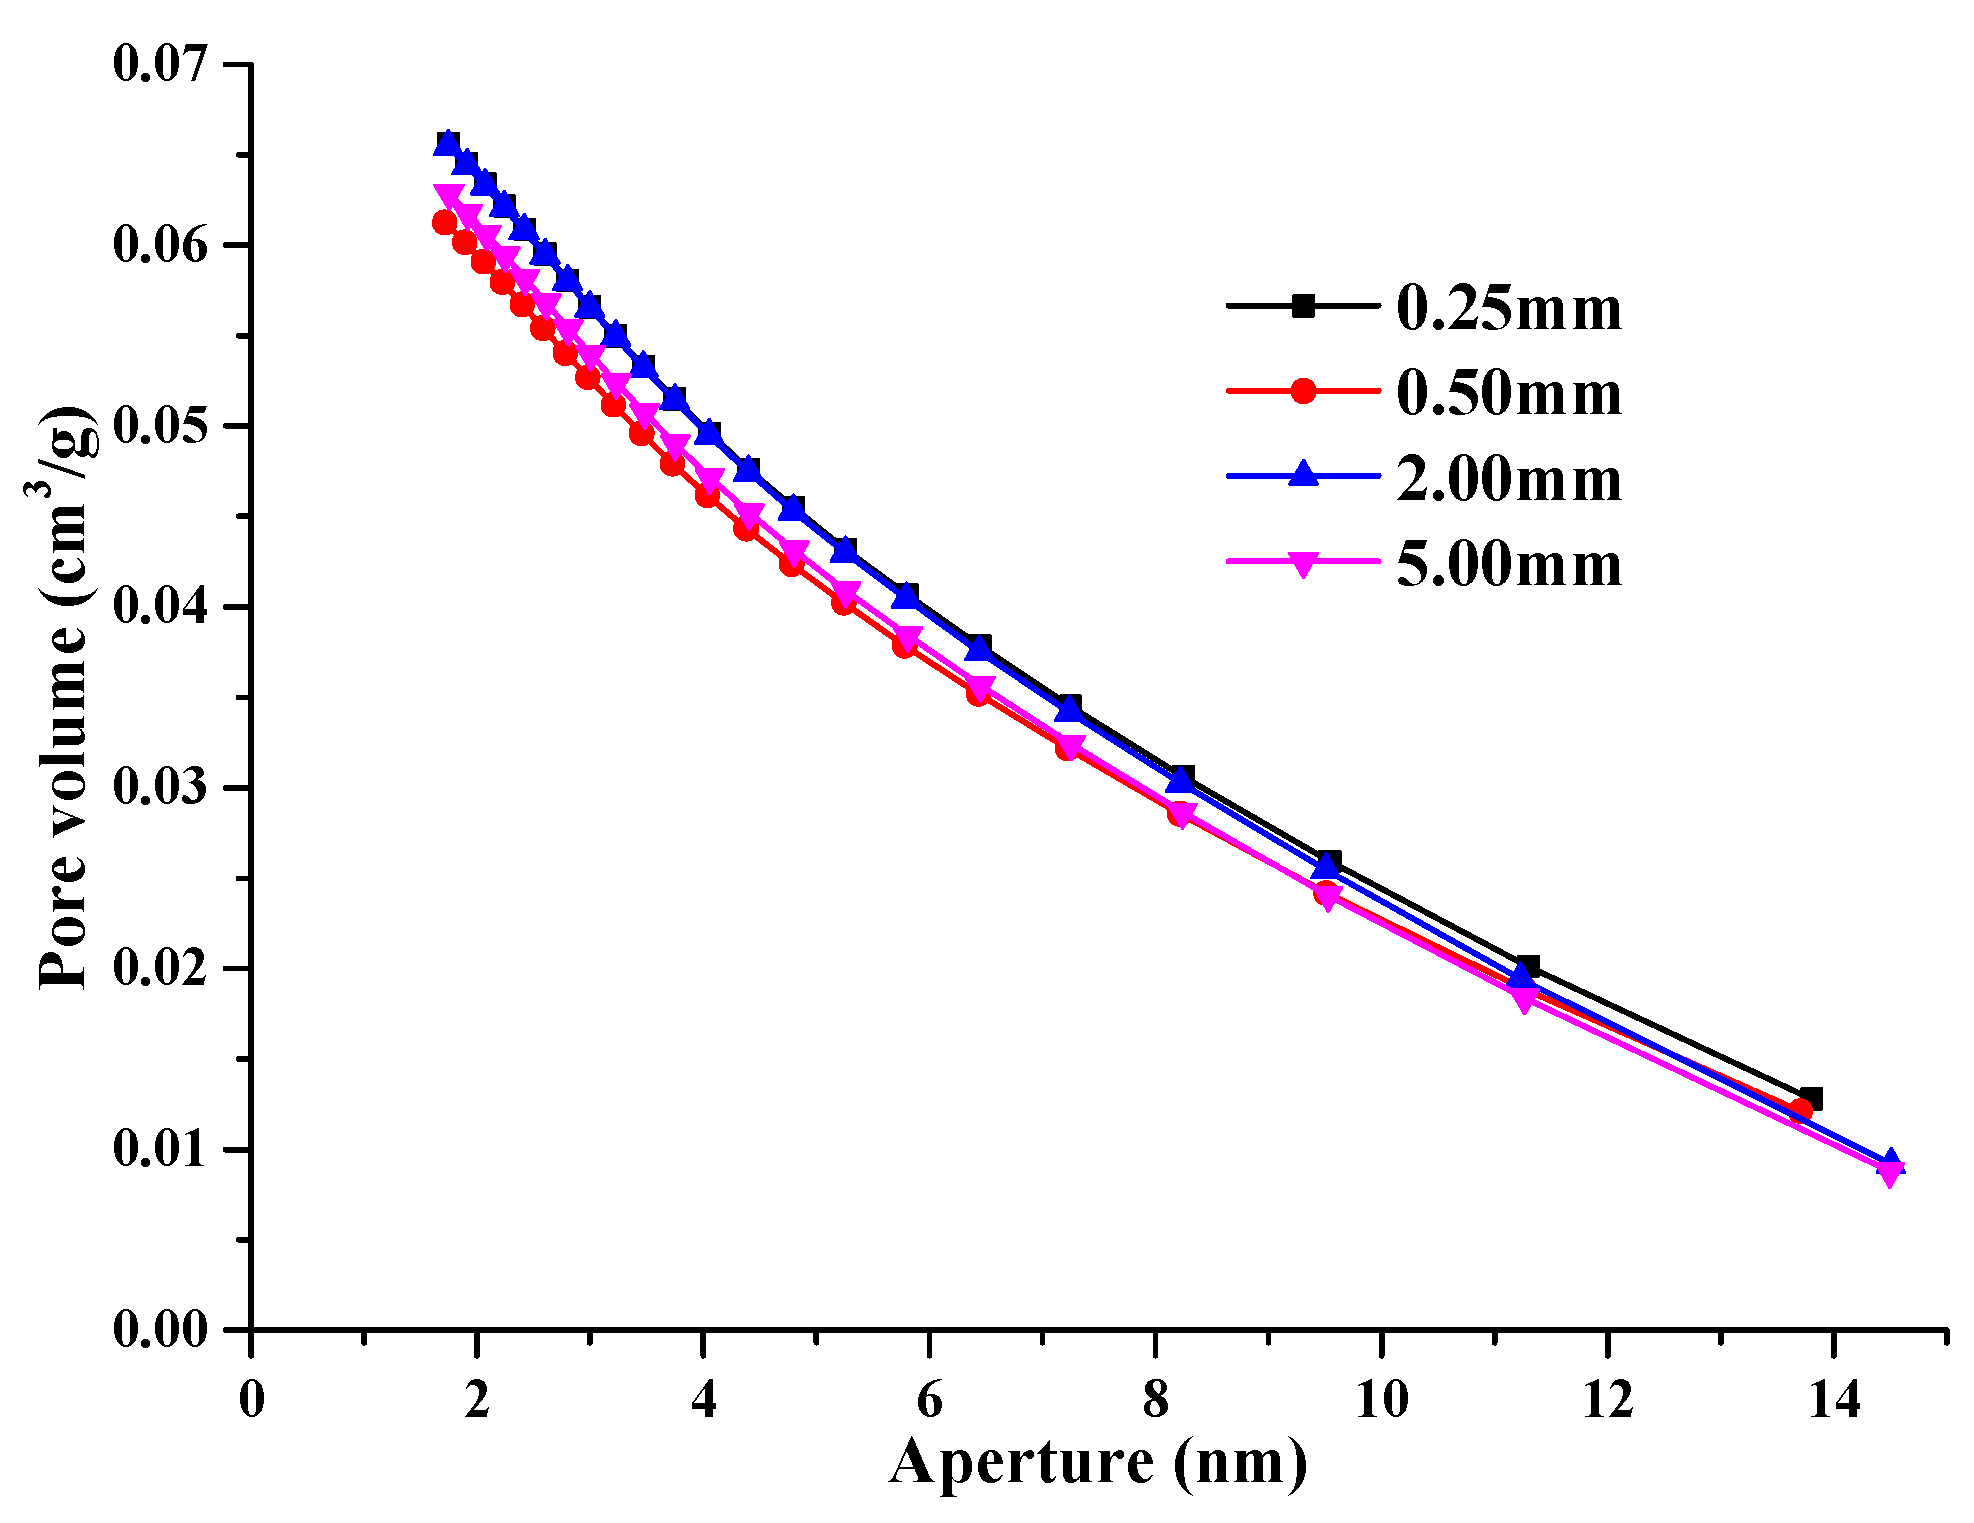
3.1. Analysis of Specific Surface Area and Pore

3.1.1. Specific Surface Area
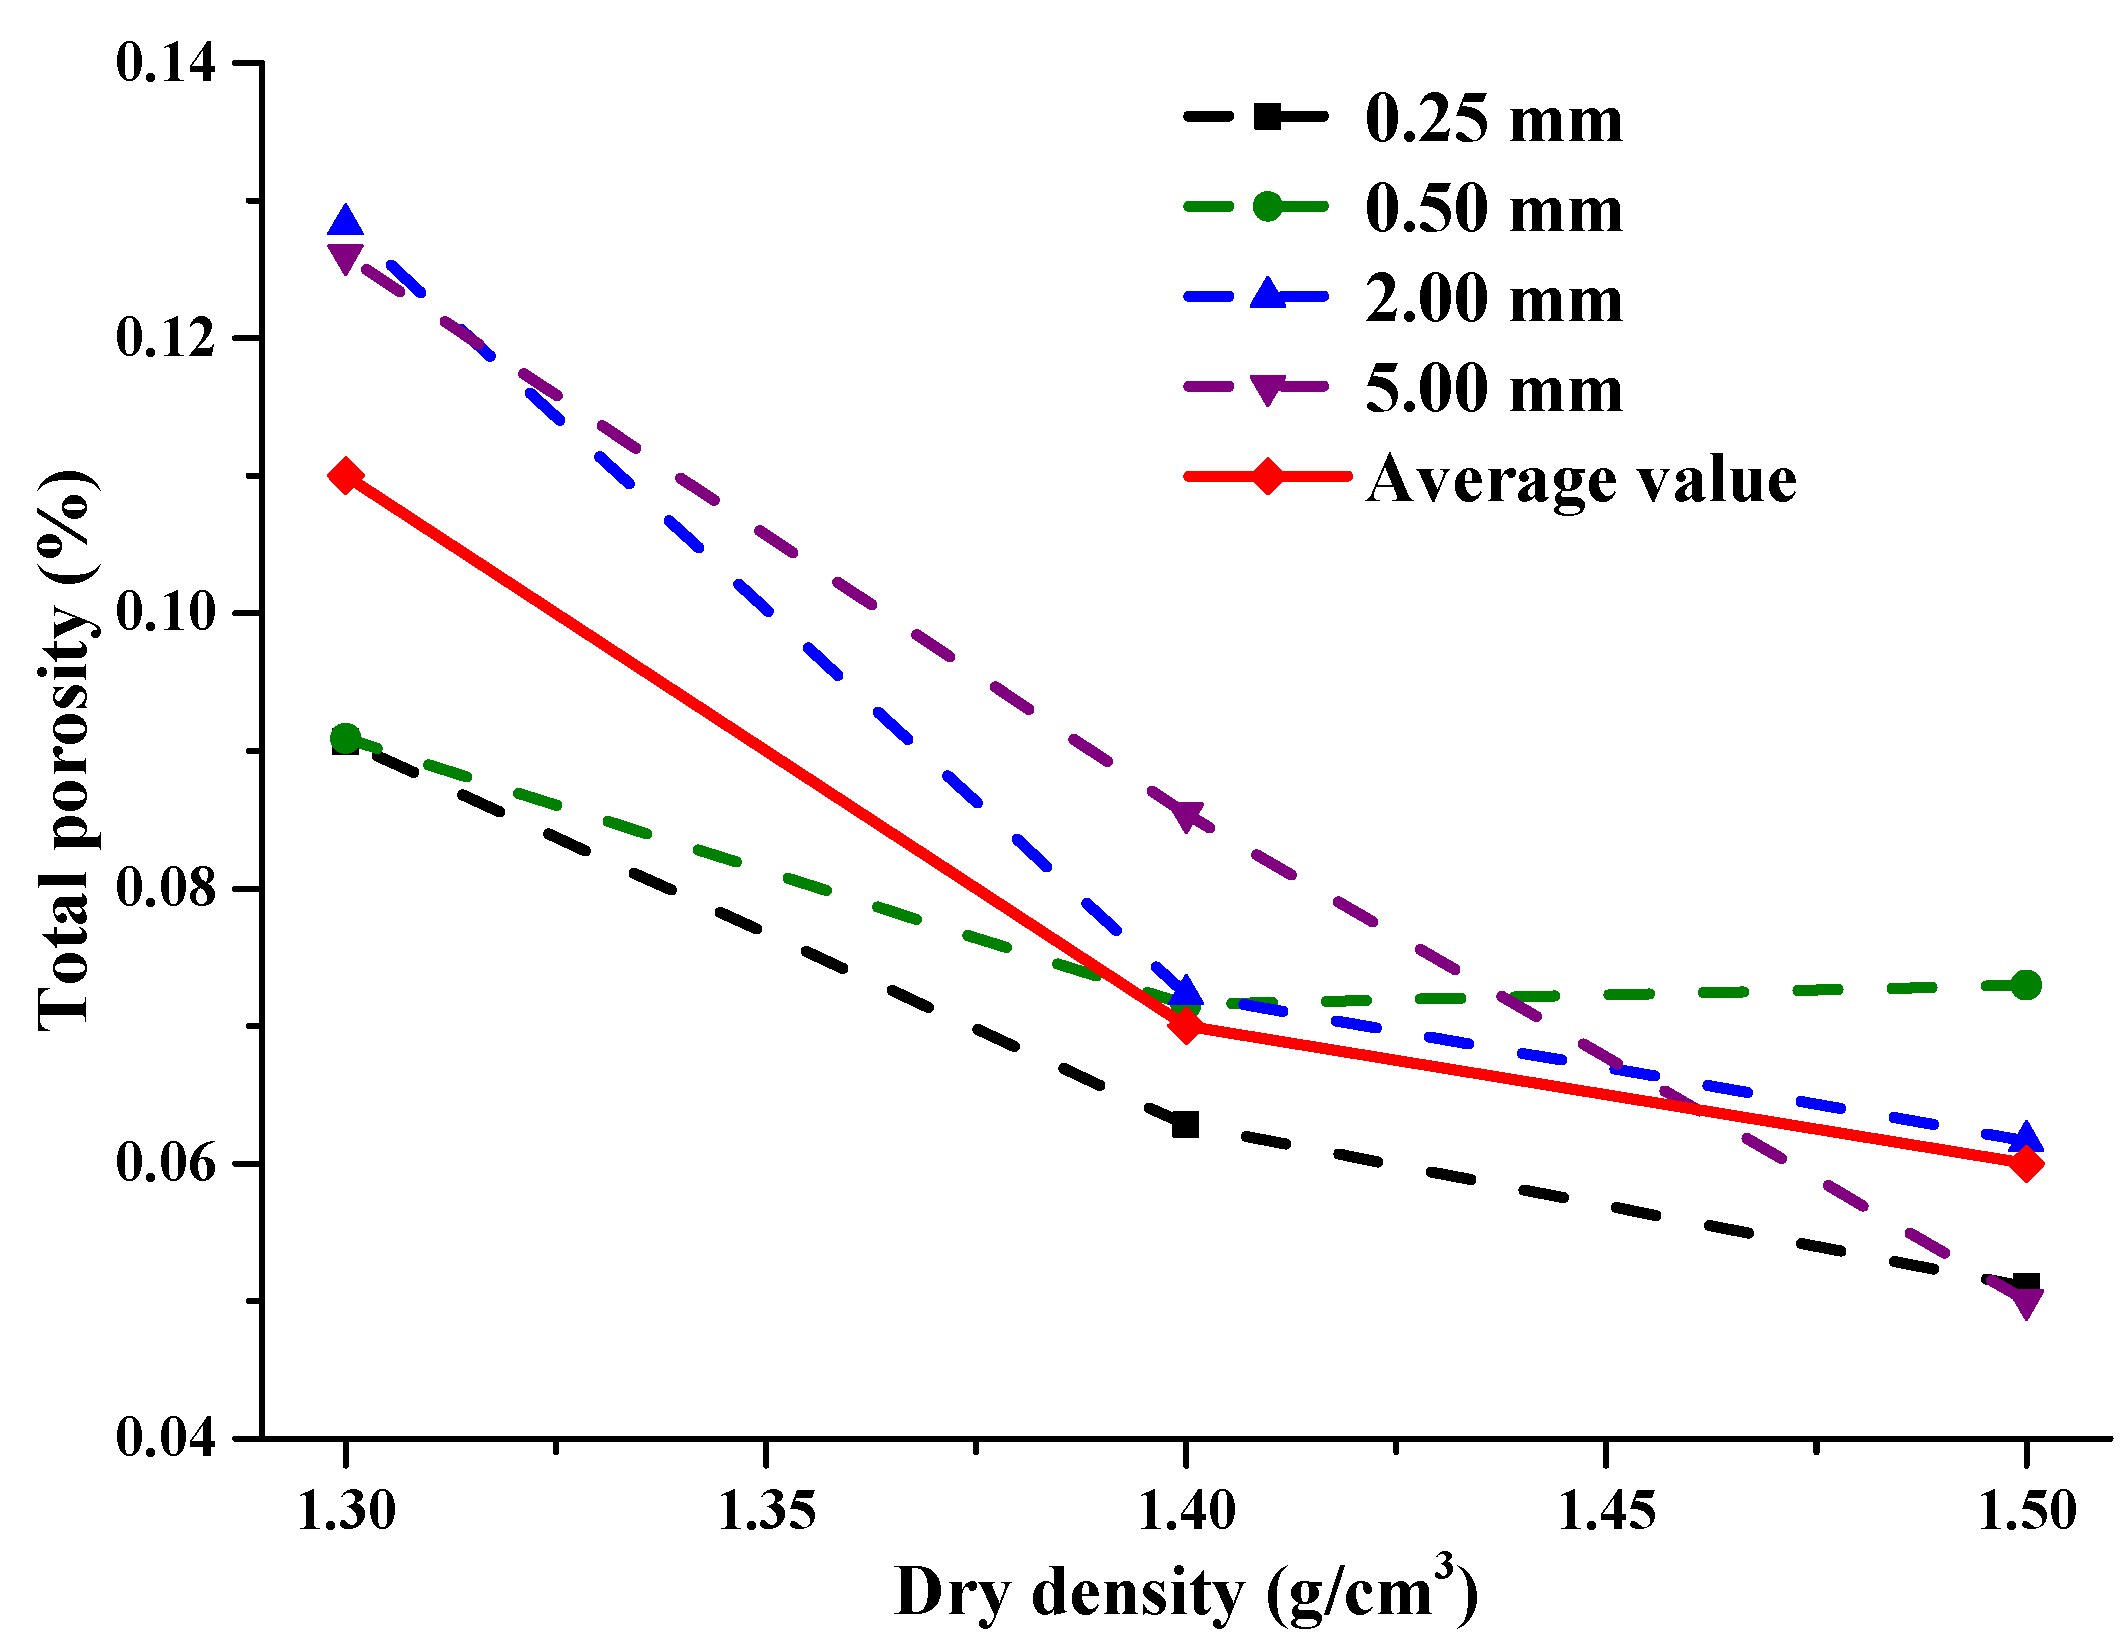
The features of the SSA of the soil are closely related to the macroscopic physical and mechanical properties of the soil. According to the law of adsorption of a gas on the surface of soil particles, the sum of the internal surface area and the external surface area of soil particle lattice per unit mass that the adsorbate molecules can reach is the SSA of the soil particles. The BET adsorption isotherm equation of the multilayer adsorption theory and the Langmuir adsorption isotherm equation is provided in Equations (2) and (3), respectively [22,23].
P / P 0 V ( 1 p / p 0 ) = C 1 V m C × P / P 0 + 1 V m C
where V represents the gas adsorption capacity, V m represents the monolayer saturated adsorption capacity, P represents the adsorbate’s pressure, P 0 represents the saturated vapor pressure of adsorbate, and C represents the constant.
θ = V s V m l = b P 1 + b P
where b represents the adsorption equilibrium constant, P represents the gas pressure, θ represents the surface area coverage of solid surface occupied by adsorbed gas, V s represents the volume of adsorbed gas per gram of solid, and V m l represents the volume of adsorbed gas per gram of solid covered by a monolayer.
The low-temperature nitrogen adsorption test (LT-NAT) measurement process is divided into two stages: adsorption and desorption. Take red clay with a particle size of 0.25 mm as an example. The adsorption amount of red clay during increasing and decreasing the relative pressure is illustrated in Figure 3. It is apparent that when the relative pressure is slight, the adsorption isotherm and the desorption isotherm coincide with each other. When the relative pressure is more extensive than 0.8 P/P0, the desorption isotherm is above the adsorption isotherm, indicating that red clay has a larger adsorption capacity during desorption than adsorption. The adsorption isotherms of red clay with different particle sizes are provided in Figure 4. These adsorption isotherms show a similar upward trend with the increase in relative pressure, and the curve is concave, indicating weak interaction. In addition, the adsorption isotherm can be divided into two stages: (1) Slow linear growth stage (when the relative pressure P/P0 is between 0 and 0.6, the adsorption isotherms of red clay with different particle diameters coincide with each other). (2) Rapid non-linear growth stage (when the relative pressure P/P0 is between 0.6 and 1.0, there is a slight difference between the adsorption isotherms of red clay with different particle sizes, and the adsorption quantity of red clay with a particle size of 0.5 mm is significantly lower than that with other particle sizes under the same relative pressure). Table 4 describes the SSA of red clay with different particle sizes, as calculated by Equations (2) and (3).
As shown in Table 4, the SSA of the red clay obtained by the Langmuir adsorption isotherm equation is about 2.5 times that of the BET adsorption isotherm equation. The sum of the internal and external surface areas is the BET surface area, and the external surface area accounts for 93–95% of the total surface area. Additionally, the BJH adsorption cumulative surface area of the pores between 1.7 nm and 300 nm is smaller than the desorption cumulative surface area. With the increase in soil particle size, the SSA does not appear to decrease; instead, SSA(2.0) > SSA(0.25) > SSA(5.0) > SSA(0.5). The main reason for this is that the mass of red clay sample approximately between 0.5 g and 0.7 g is too small, and the area at the lattice level cannot reflect the influence of soil particle size on the structure of the sample, let alone the particle size effect of the soil on SSA. The difference in the SSA of soil samples with different particle sizes is mainly due to the mineral composition of the selected test soil samples. The differentiation in the SSA of the soil samples with different particle sizes is mainly due to the different mineral compositions of the selected test soil samples.

3.1.2. Porosity

The pore size distribution principle is based on the capillary condensation phenomenon and the volume equivalent exchange rule [24]. The amount of liquid nitrogen permeated in the red clay particles is equal to the volume of the pores. Based on the Kelvin equation, the relationship between the partial pressure of adsorbate and the pore size of capillary condensation is described in Equation (4). The cumulative pore volume curves of BJH adsorption and desorption are given in Figure 5 and Figure 6, respectively, and the pore volume of red clay with different particle sizes is shown in Table 5.
R k = 0.414 log ( P / P 0 )
According to the size of the pore radius, the pores on the solid surface can be divided into three categories: (1) micropores with a radius less than 2 nm; (2) mesopores with a radius between 2 and 50 nm; and (3) macropores with a radius greater than 50 nm. According to Figure 5 and Figure 6, it is evident that the BJH adsorption and desorption cumulative pore volume of the red clay gradually decreases with the increase in the pore size, implying that the pores of the red clay are primarily tiny (main mesopores with the pore size ranging from 1.7 to 15 nm). Moreover, the pore volume ranges from 0.008 to 0.08 cm3/g, and the minimum pore volume during desorption is 0.072–0.08 cm3/g, while that during adsorption is 0.061–0.066 cm3/g. The red clay with the smallest particle size of 0.25 mm shows a more remarkable relative change than the others by comparing the desorption and adsorption processes. The pore volume is the largest during the adsorption process, and the volume of small pore size equals the pore volume of the red clay, with a particle size of 2 mm; however, during the desorption process, the pore volume of the red clay with a particle size of 0.25 mm was significantly reduced compared with clays with different particle sizes.
According to Table 5, the internal pore volume of soil particles is the smallest when the particle size is 0.5 mm, with the internal pore volume of other particle sizes remaining proportional to the particle size. The BJH adsorption and desorption cumulative volumes change little with the particle size, and the cumulative volume of desorption is larger than the cumulative volume of adsorption. The average pore sizes of BJH adsorption and BJH desorption are equal to 4 times the pore volume within the SSA, which might generate significant errors when the soil mass is unevenly distributed.

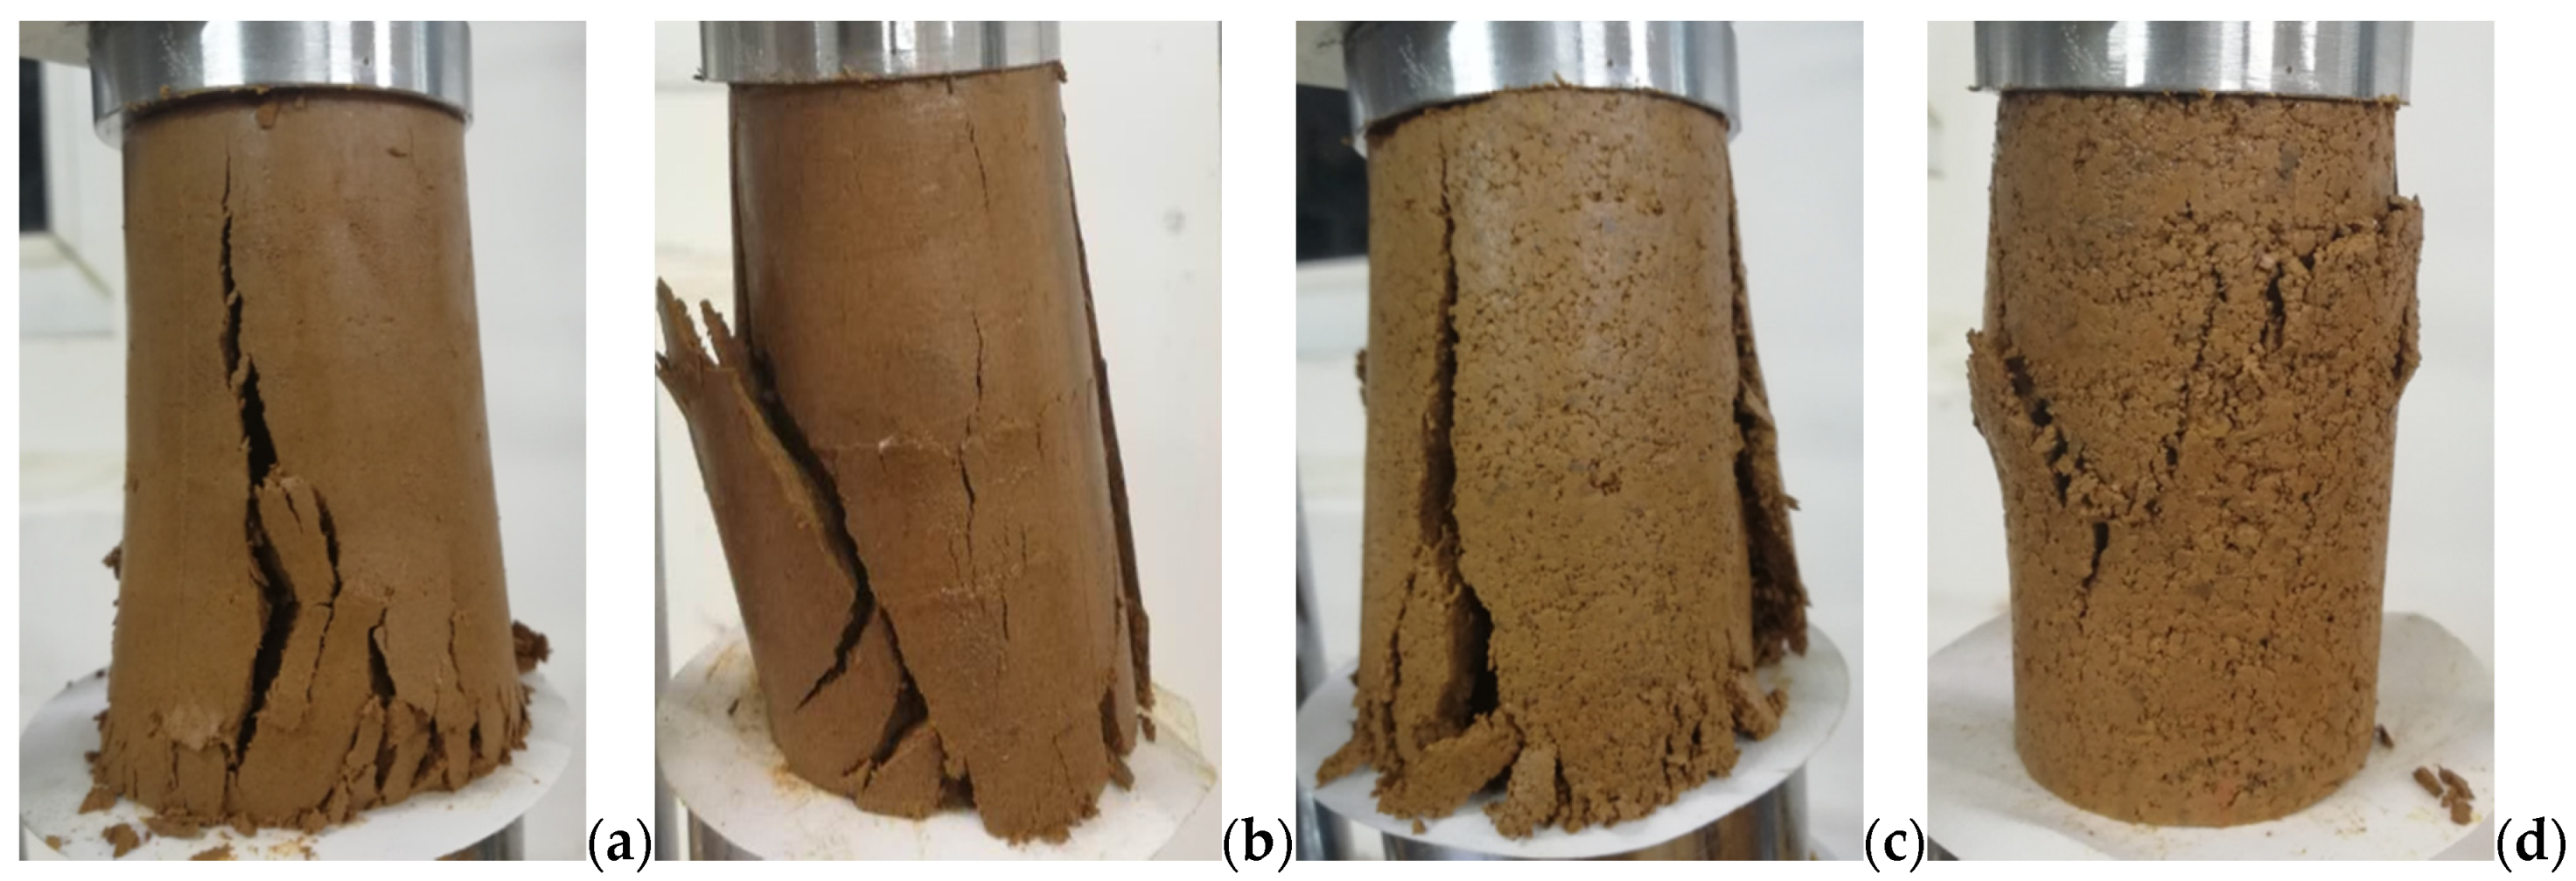
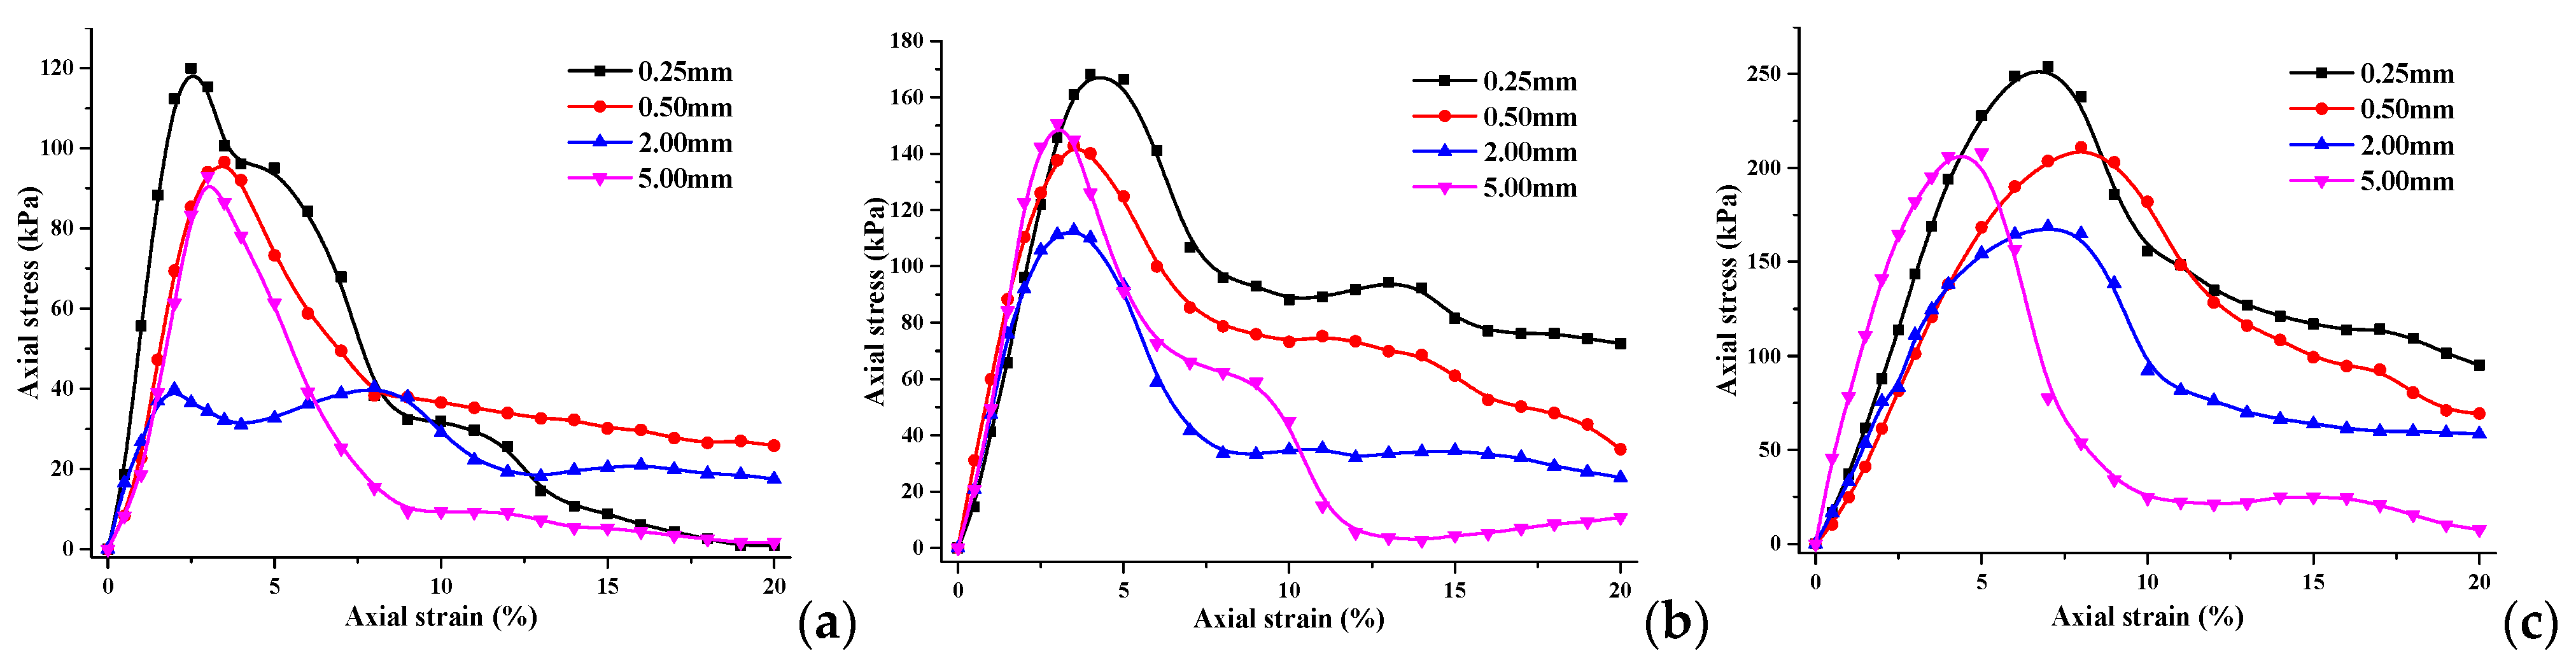
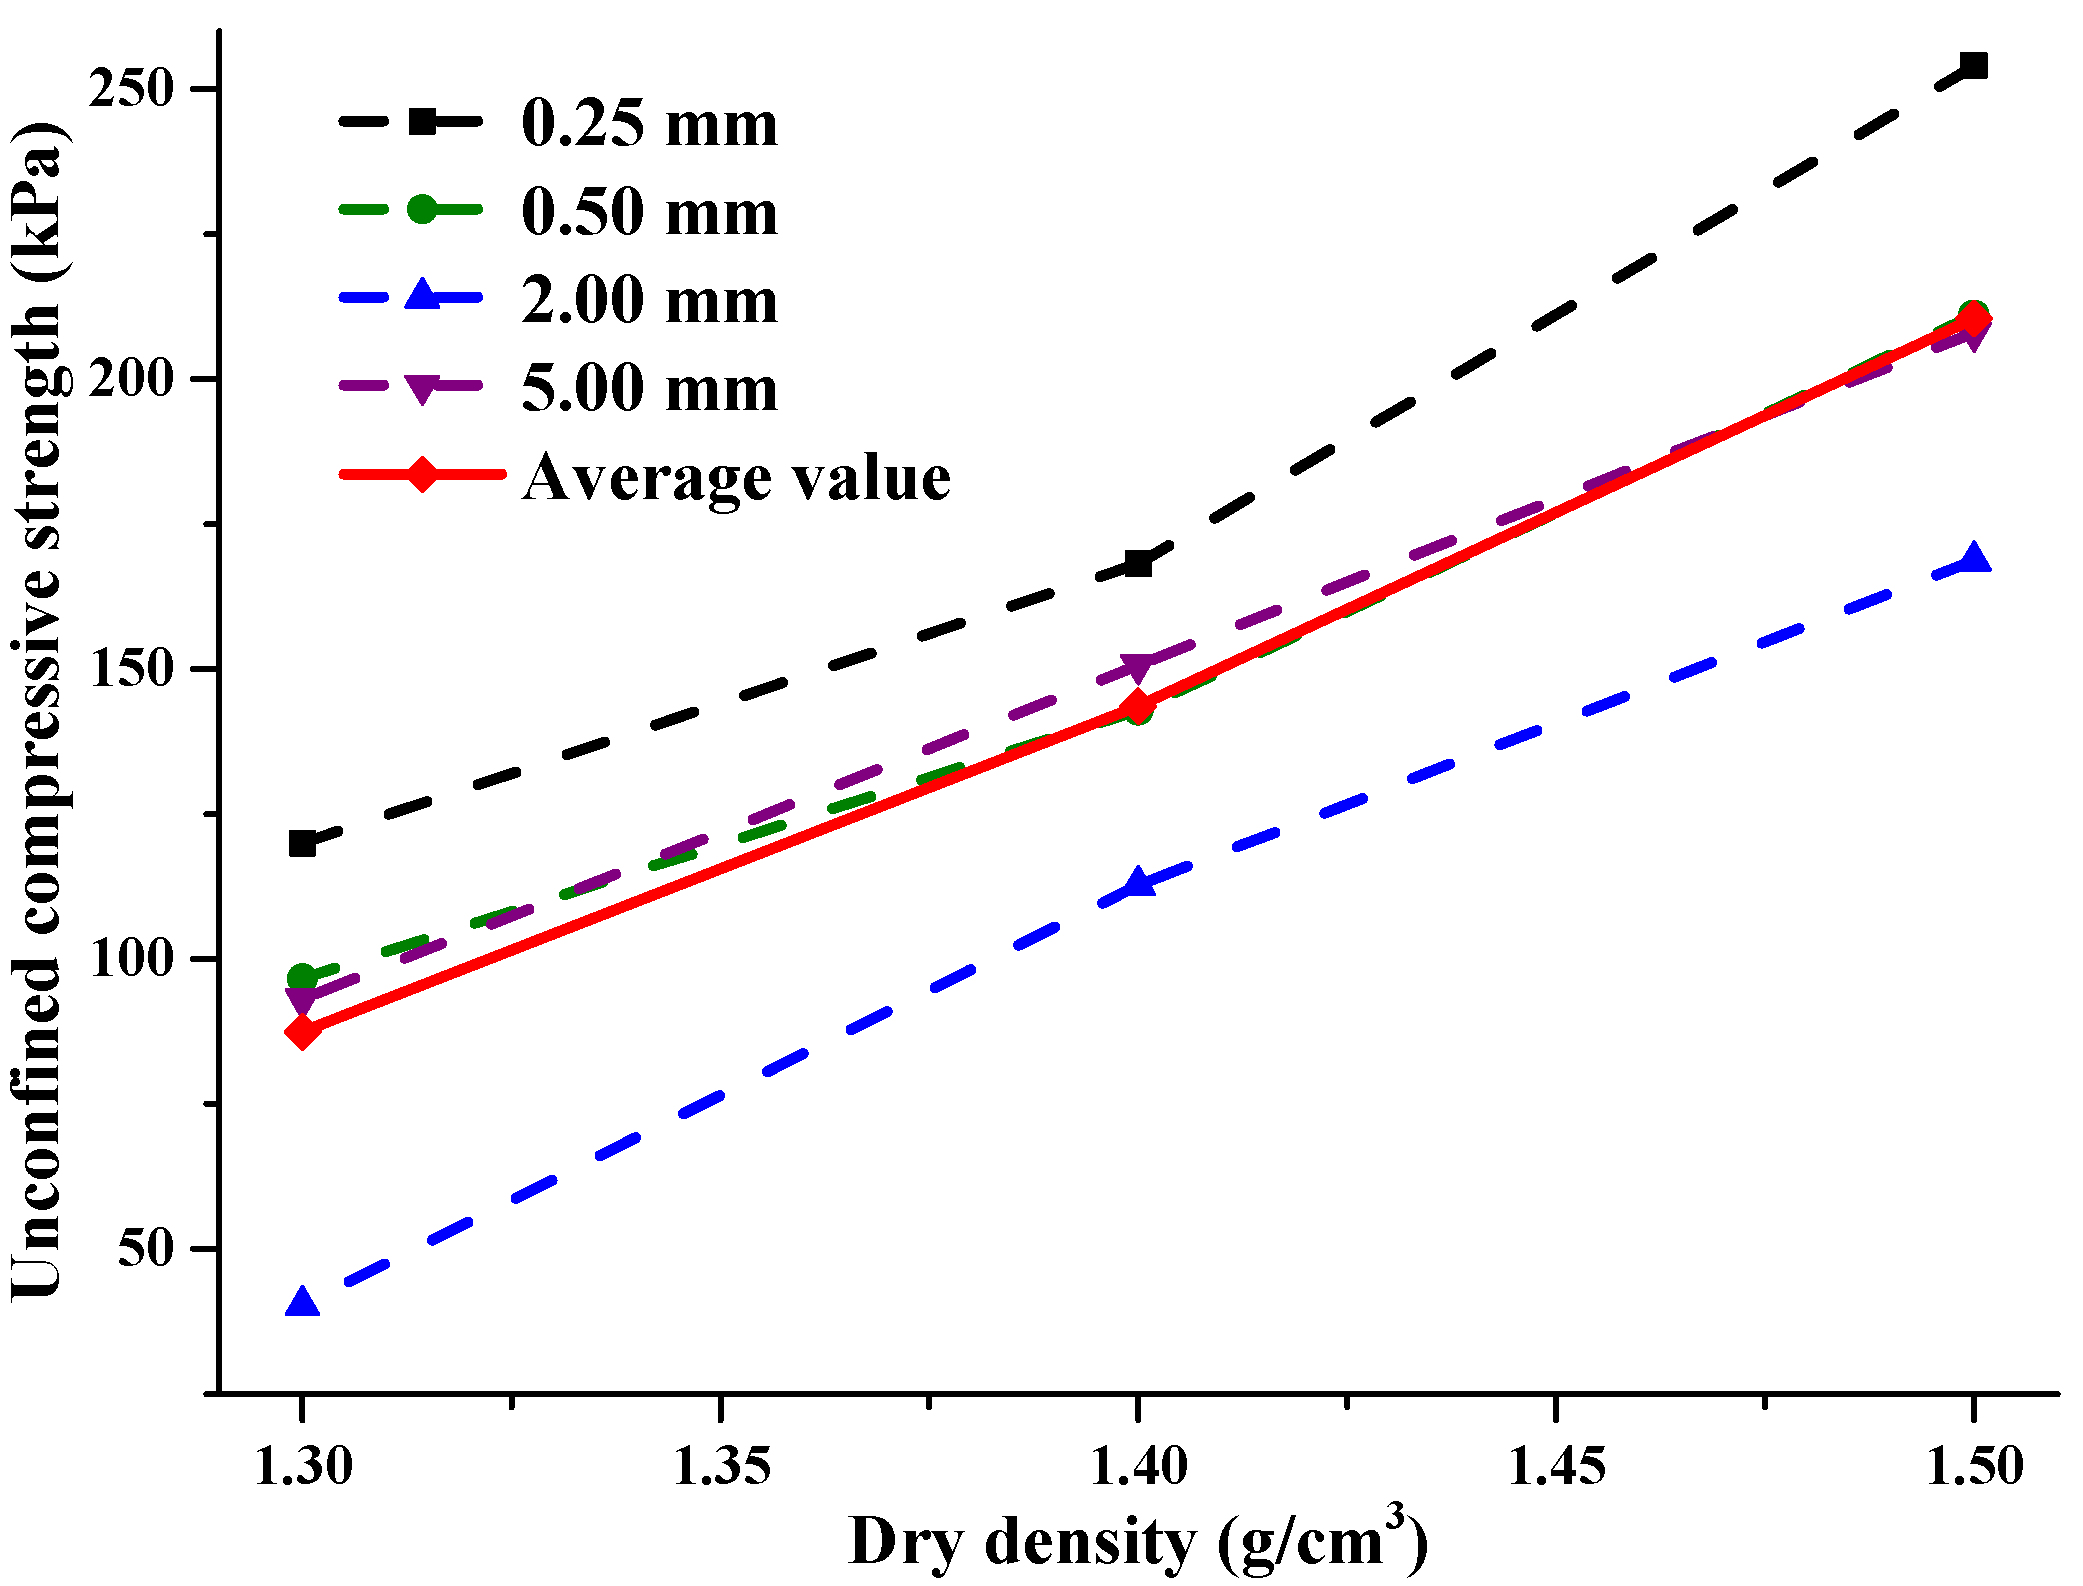
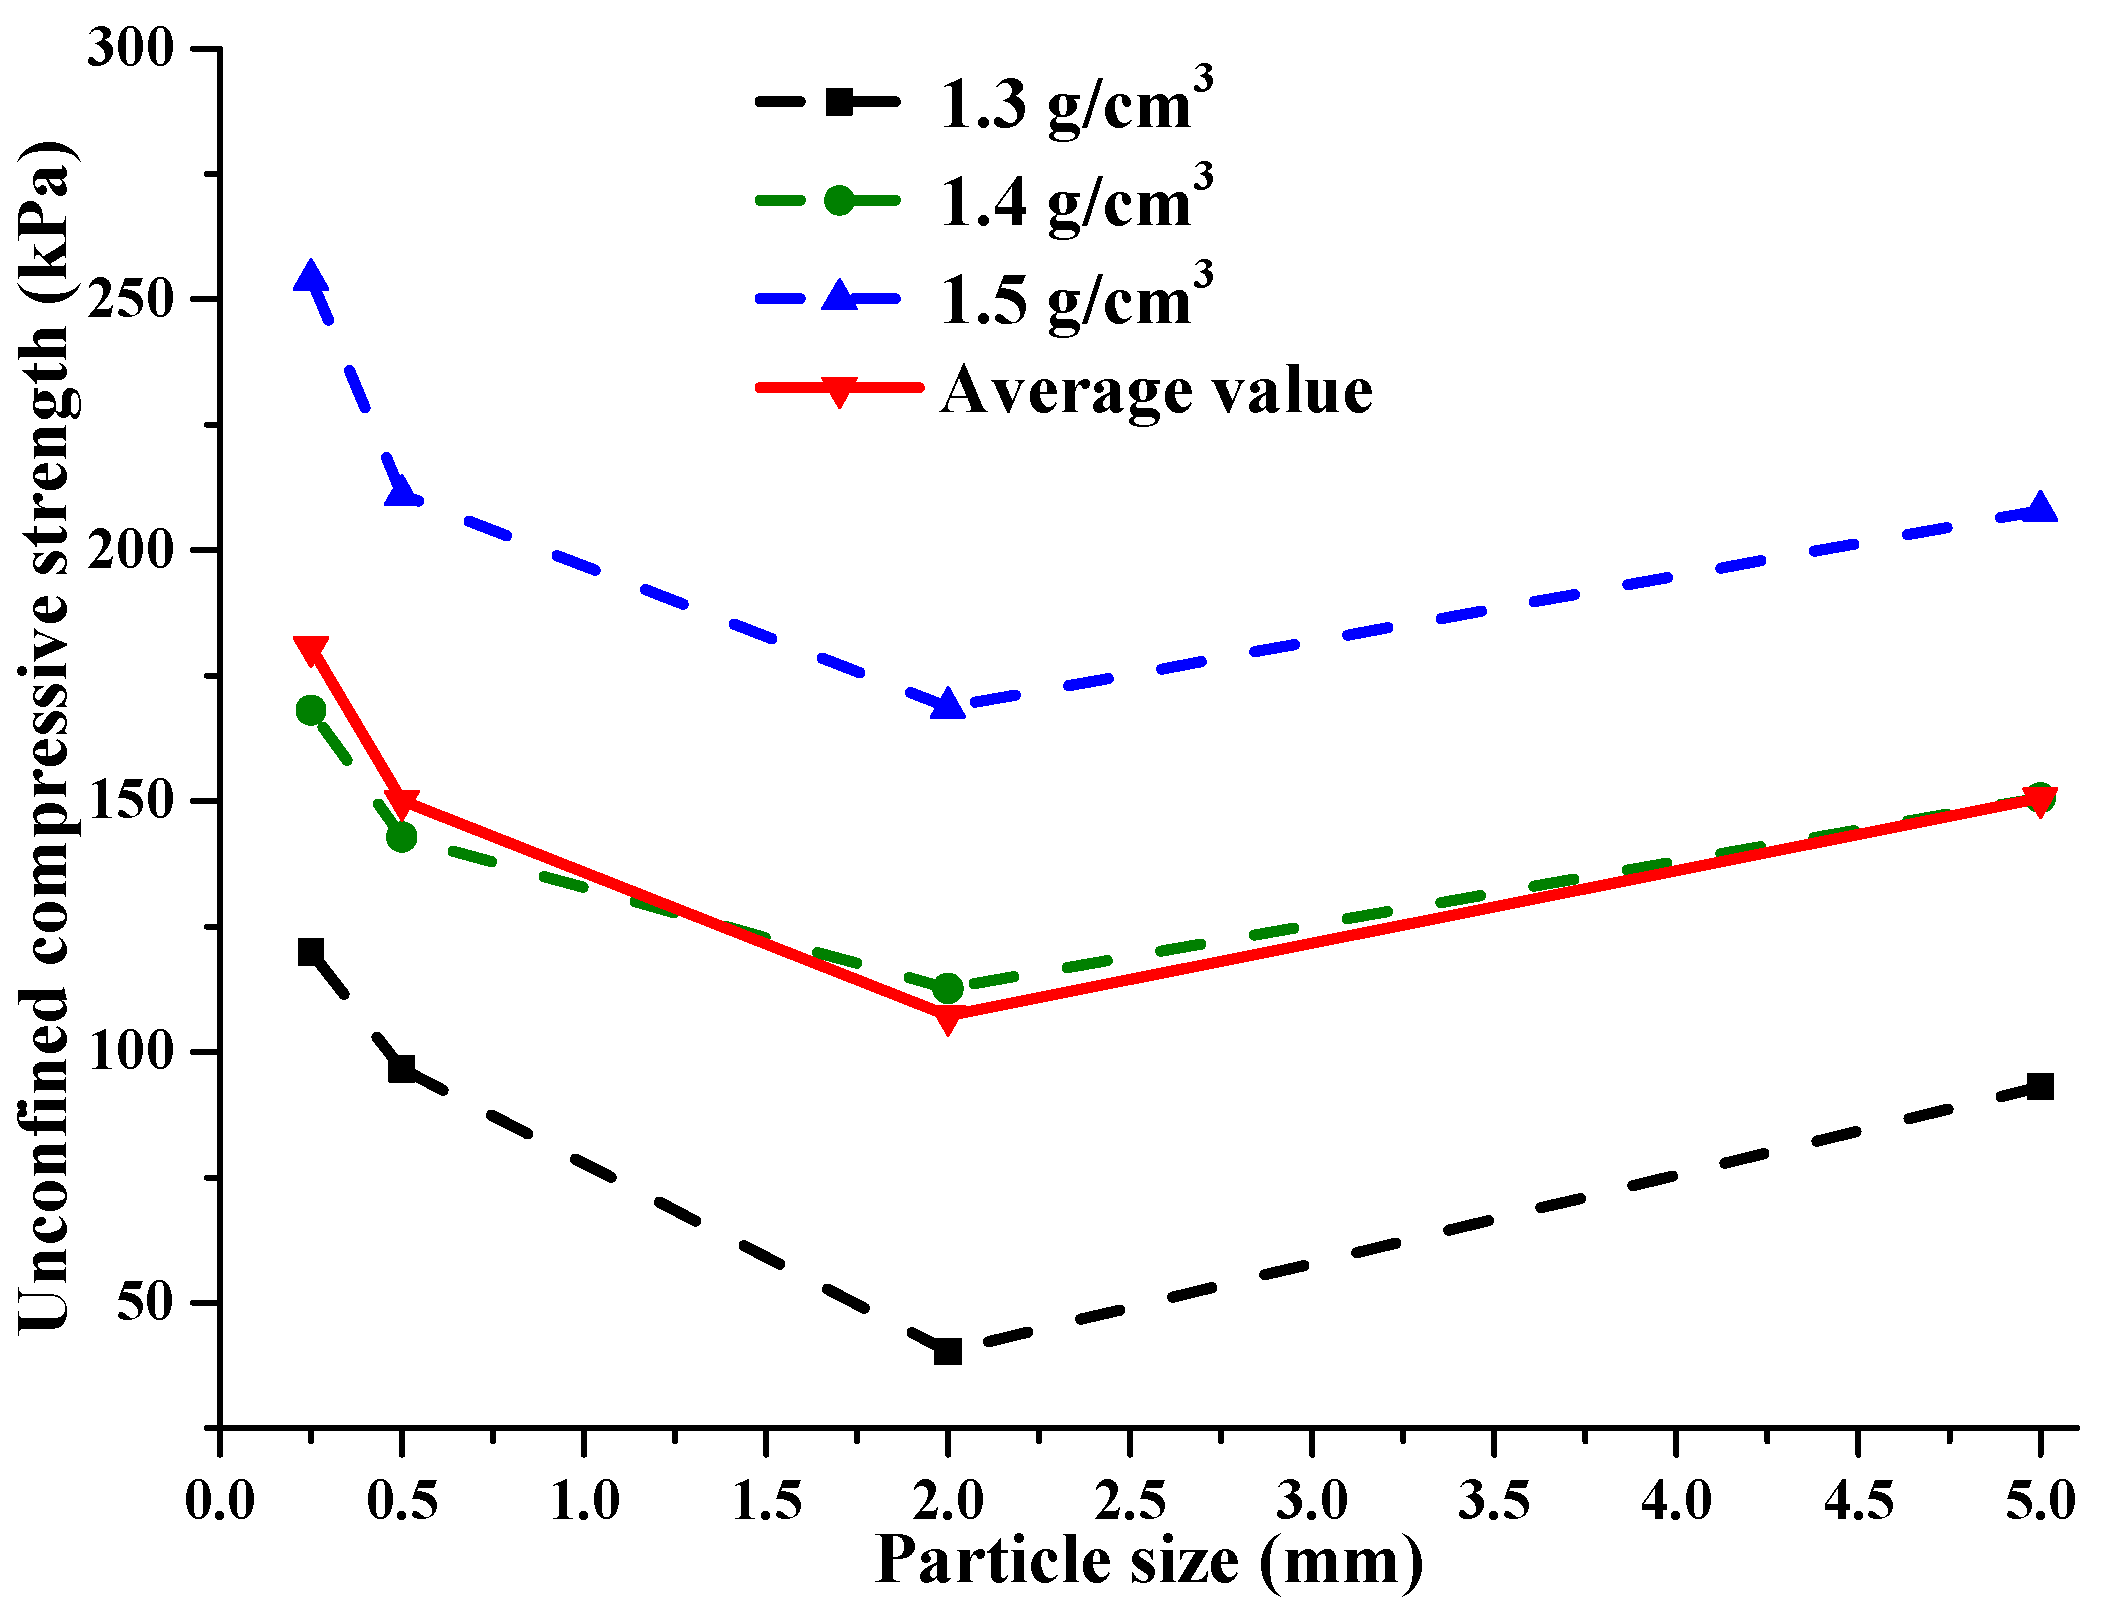
3.2. Results of UCS Test

Take the red clay with a dry density of 1.4 g/cm3 as an example. The failure pattern of the soil samples after the UCS test is provided in Figure 7. The failure patterns of red clay samples with different particle sizes appear as split and shear failure after the UCS test. It is worth noting that when the particle size is 0.5 mm, although the soil sample shows apparent shear failure, there are also evident cracks on the surface of the soil sample and split failure on the other side. Furthermore, when the particle size is between 0.25 and 2 mm, the bottom of the sample fails first, and the damaged surface expands from the bottom upwards as the pressure increases until the sample is destroyed. The main reason is that the top of the unconfined compression instrument is fixed, and the pressure is loaded onto the soil sample when the bottom rises. When the soil particles are small, the internal structure of the soil sample is dense, and the pores are tiny. As the loading pressure increases, relative slippage between soil particles is arduous, causing the soil sample to split or undergo shear failure from the bottom first. When the particle size is 5 mm, as the pressure increases, no fracture cracks appear at the upper and lower ends of the soil sample; on the contrary, shear bands are generated in the middle, resulting in shear failure. The main reason is that when the soil particles are significant, there are many pores between them, which causes relative slippage. As the loading pressure grows, the pores gradually connect from point to line and then to the surface, forming a shear zone and causing shear failure in the soil sample.
As shown in Figure 8, the UCS tests of red clay under different dry density conditions have obtained stress–strain curves of different particle diameters, which all reveal strain-softening with evident peak strength, and the peak point is on the left. As axial strain increases on the left side of the peak point, the axial stress increases rapidly. The soil mass is undergoing compaction, and the internal pores are gradually reduced. To the right side of the peak point, the axial stress rapidly drops and then slowly decreases. Comparing these with the curves of the red clay of different dry densities, as the dry density increases, the peak point gradually moves to the right along the horizontal axis, indicating that the soil mass has a more extraordinary ability to withstand deformation before failure with the increase in dry density.
Furthermore, by comparing the angle formed by the peak point and the curve on both sides, it is easy to see that the greater the dry density, the greater the angle; this also indicates that the ability of the soil to withstand deformation before failure enhances with the increase in dry density. In addition, by comparing the residual strength values of damaged soil samples with the exact particle sizes but different dry densities (when the axial strain is 20%), a similar result is obtained that the dry density is proportional to the residual strength. The residual strength of the soil sample with a particle size of 5 mm is smaller than the residual strength of the soil sample with a particle size of 1.25–2 mm. The failure patterns displayed in Figure 7 show that after the shear failure, the friction force generated by the relative movement of the soil sample along the shear zone is smaller than the resistance of the soil mass after split failure when the soil particle is large. In addition, except for the one corresponding to 0.25 mm, the other curves at the dry density of 1.3 g/cm3 follow the same rule, whereby the smaller the particle size, the greater the residual strength, which shows that the interaction force between the small particles is intensive.
By defining the axial stress corresponding to the peak point of the stress–strain curve as the UCS of red clay, the curve of the relationship between the dry density and UCS of red clay with different particle sizes can be derived (Figure 9). The relationship between the particle size and the UCS of red clay at various dry densities is shown in Figure 10. According to these two figures, the greater the dry density, the greater the UCS of the red clay under different particle size conditions. Furthermore, as soil’s particle size increases, the red clay’s UCS first decreases and then increases under different dry density conditions. In Figure 9, at the same dry density, the UCS is most prominent at a particle size of 0.25 mm, smallest at a particle size of 2.0 mm, and closest at particle sizes of 0.5 mm, and 5 mm. The average UCS is 87.46 kPa for different particle sizes at a dry density of 1.3 g/cm3, increasing by 64.17% and 140.59% for dry densities of 1.4 g/cm3 and 1.5 g/cm3, respectively. In Figure 10, the average UCS for different dry densities is 107.22 kPa at a particle size of 2.0 mm, increasing by 68.53%, 40.03%, and 40.42% at particle sizes of 0.25 mm, 0.5 mm, and 5.0 mm, respectively. The UCS is mainly related to the failure mode of the soil mass. Videlicet, when the soil particle size is smaller than 2.0 mm, the soil mass undergoes split failure. The larger the particle size, the smaller the UCS of the red clay. However, when the particle size of the soil is relatively large, the soil undergoes shear failure, and the UCS is mainly related to the friction between the particles, enhancing the strength of the soil. Hence, with the growth in particle size, the failure pattern of the soil mass changes from split failure to shear failure.

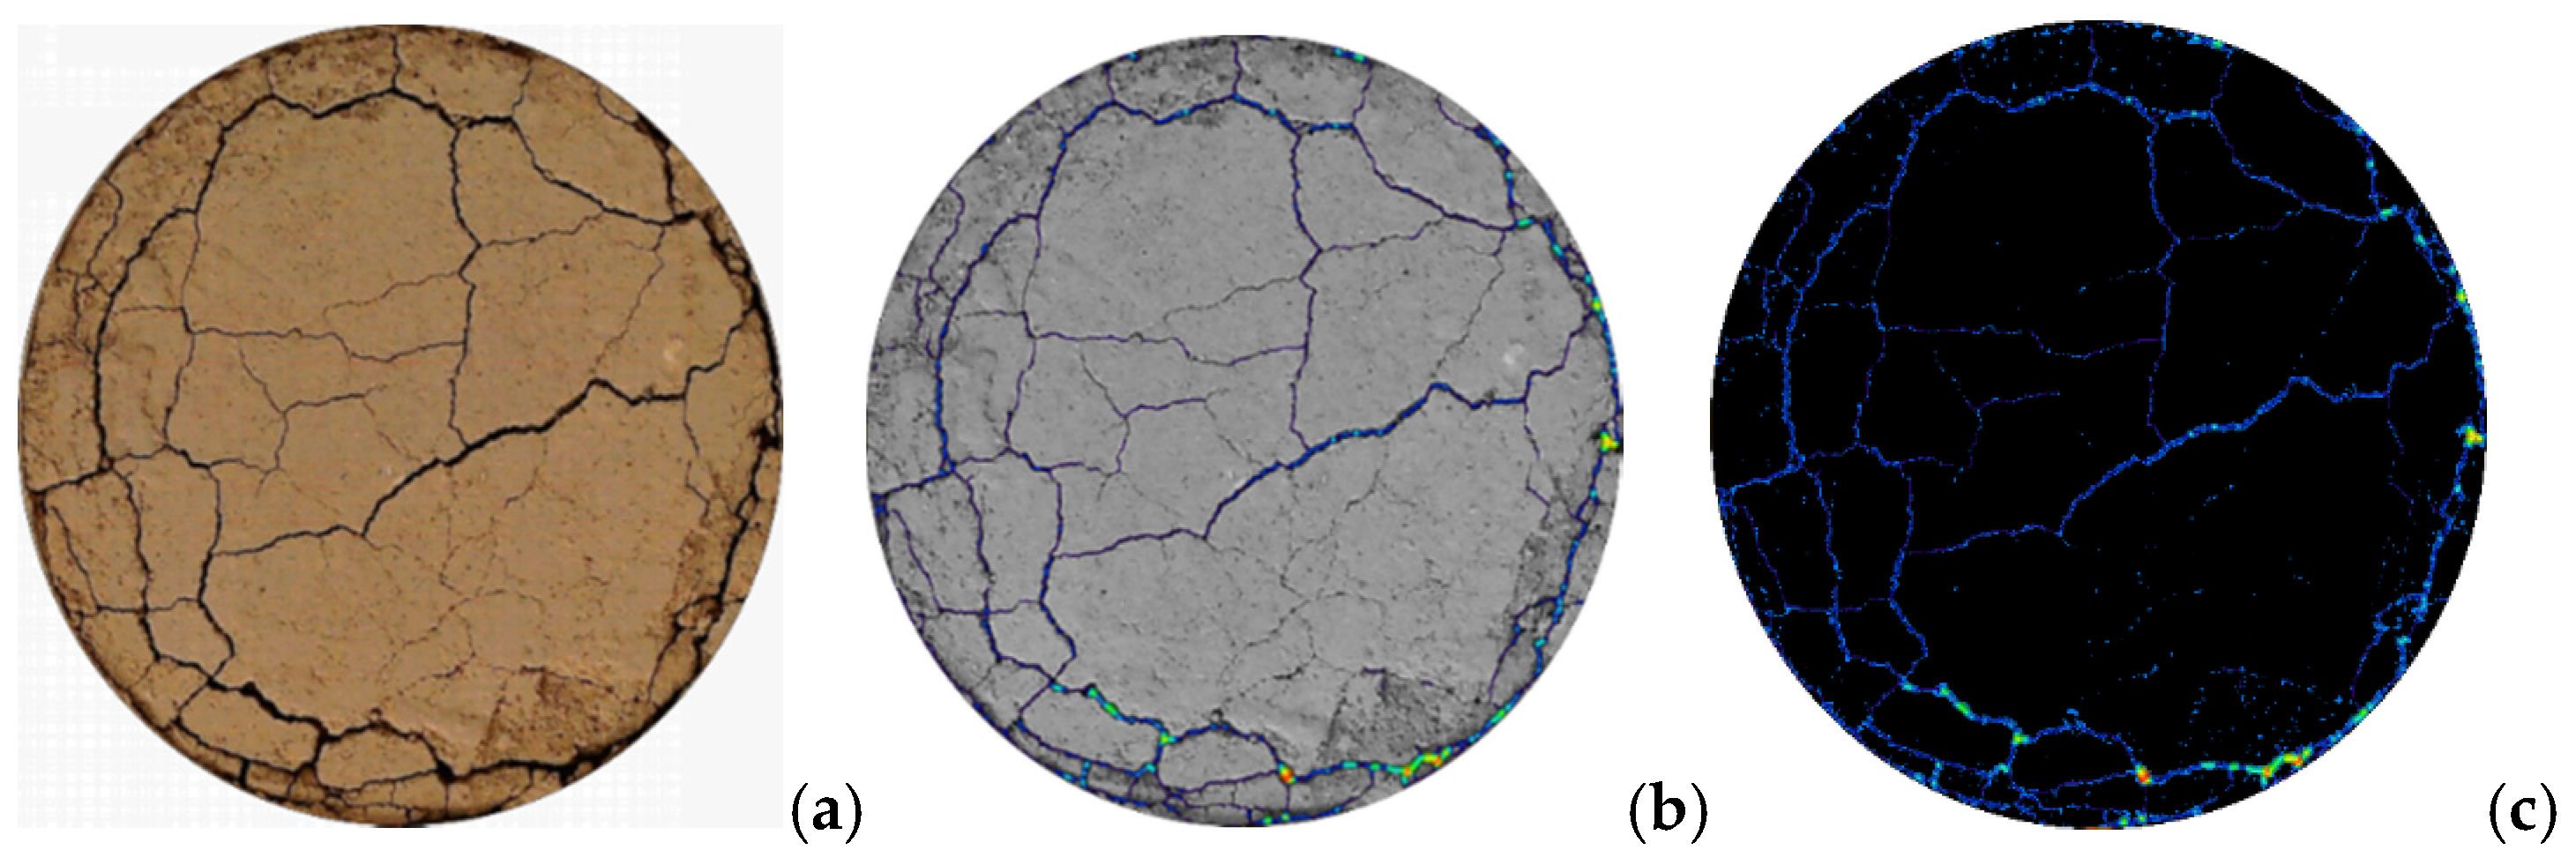
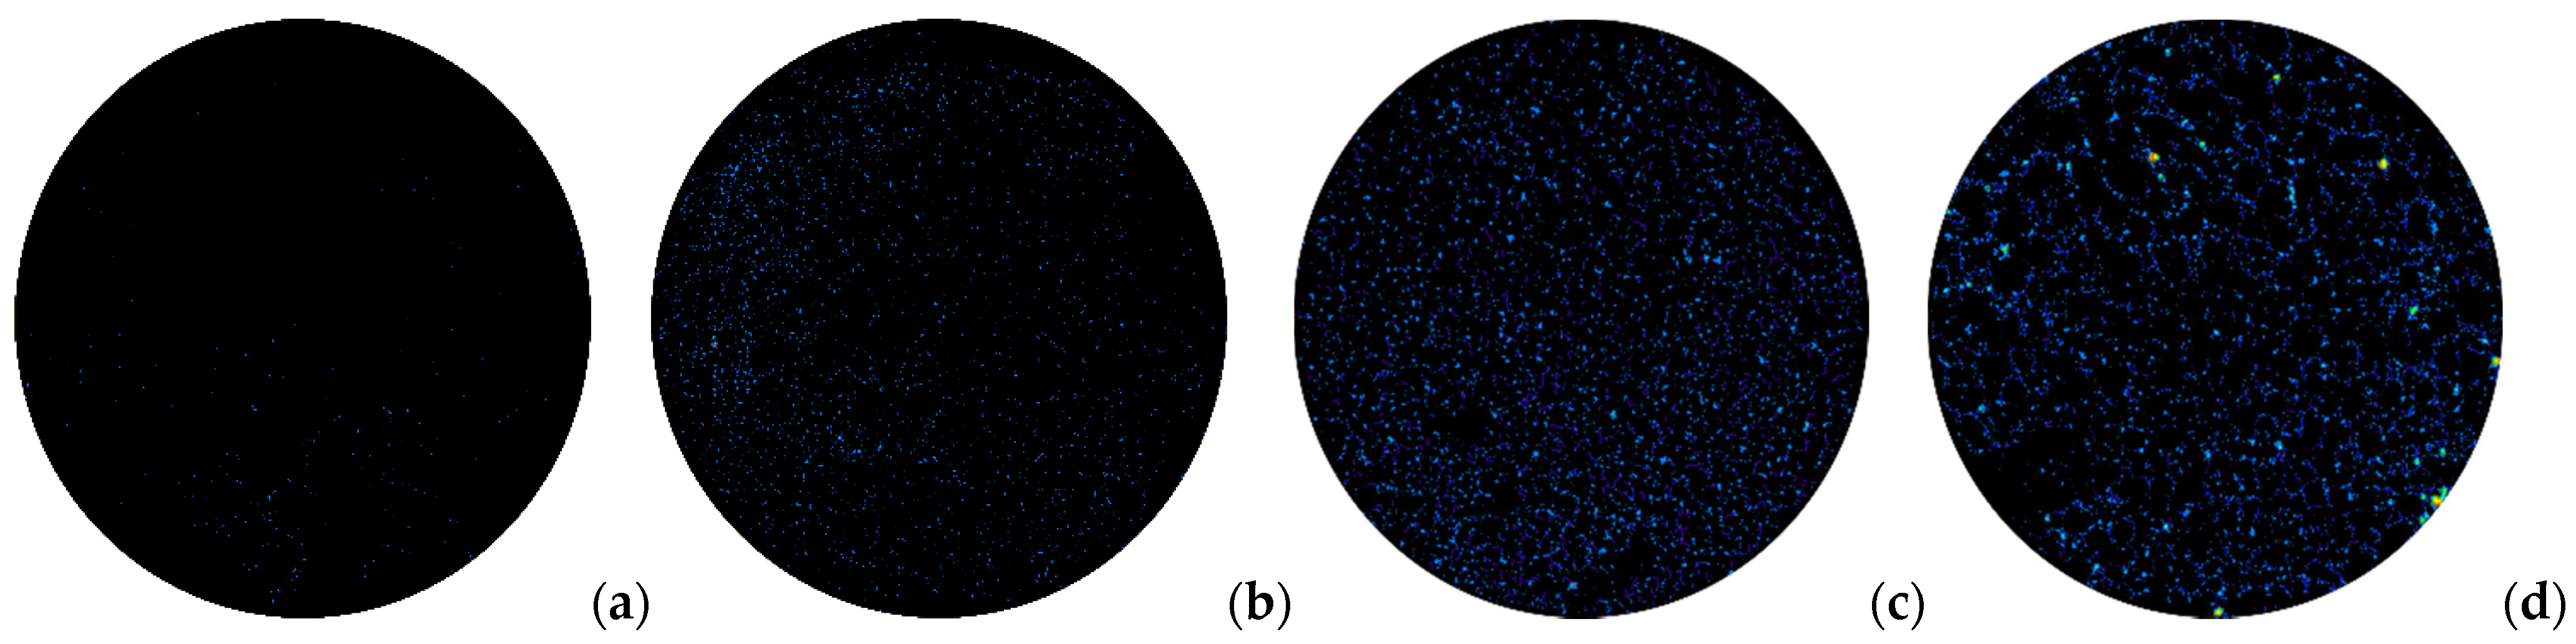
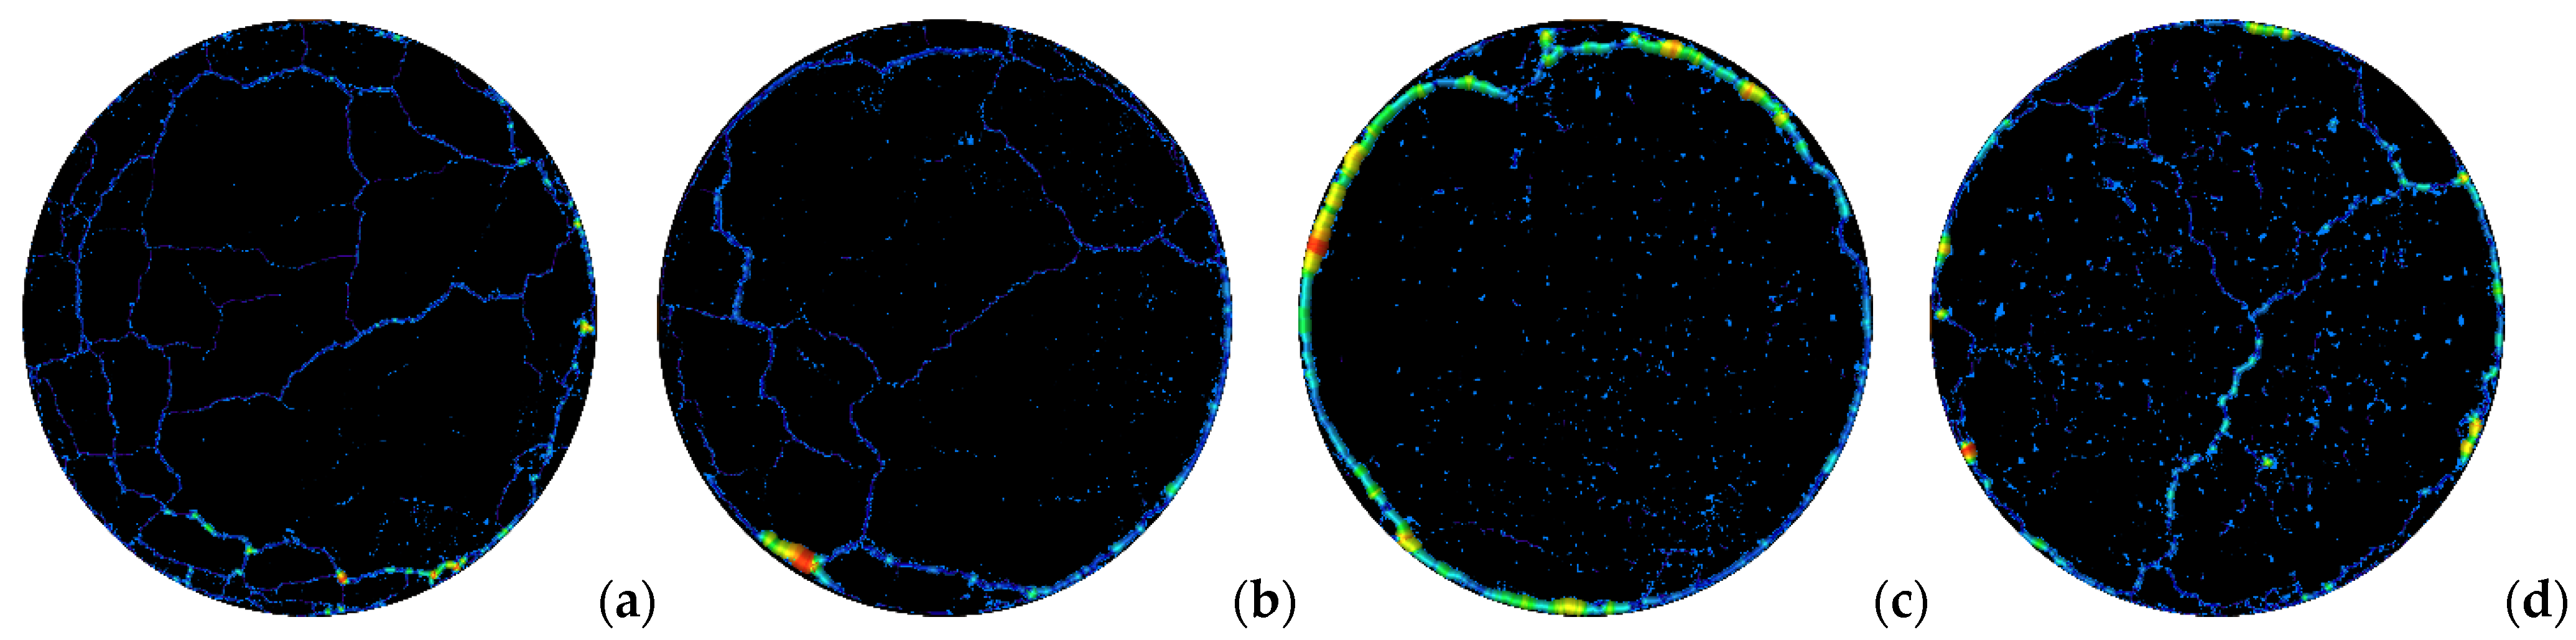
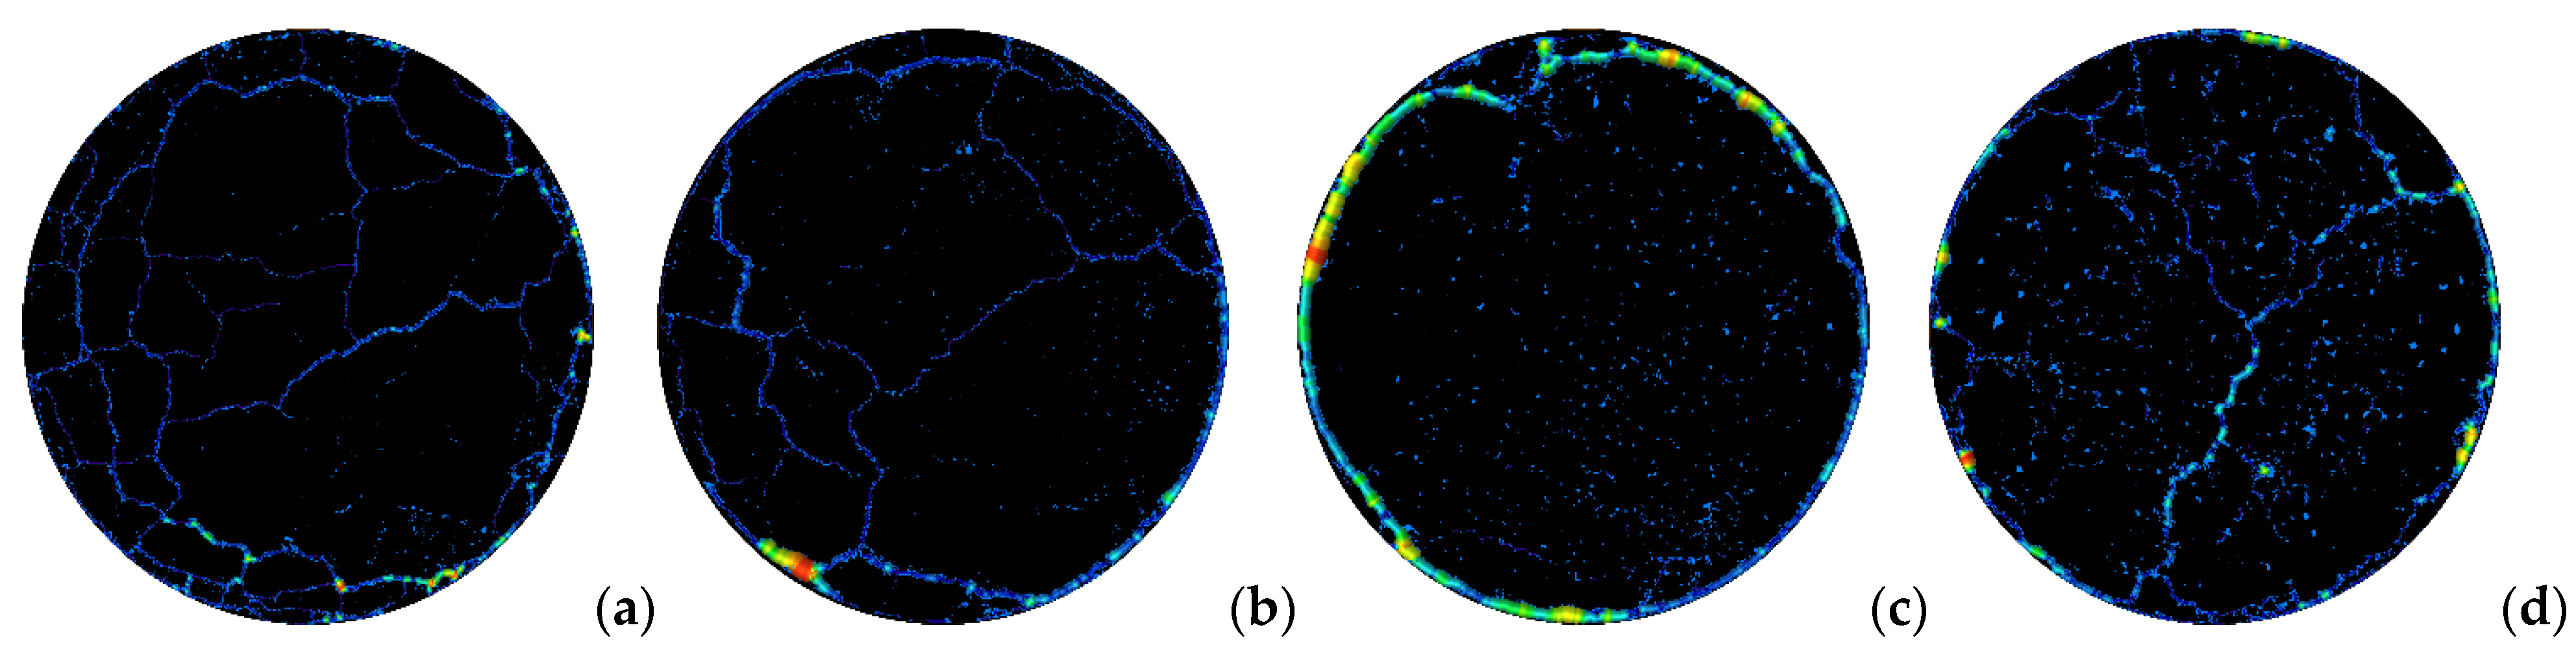
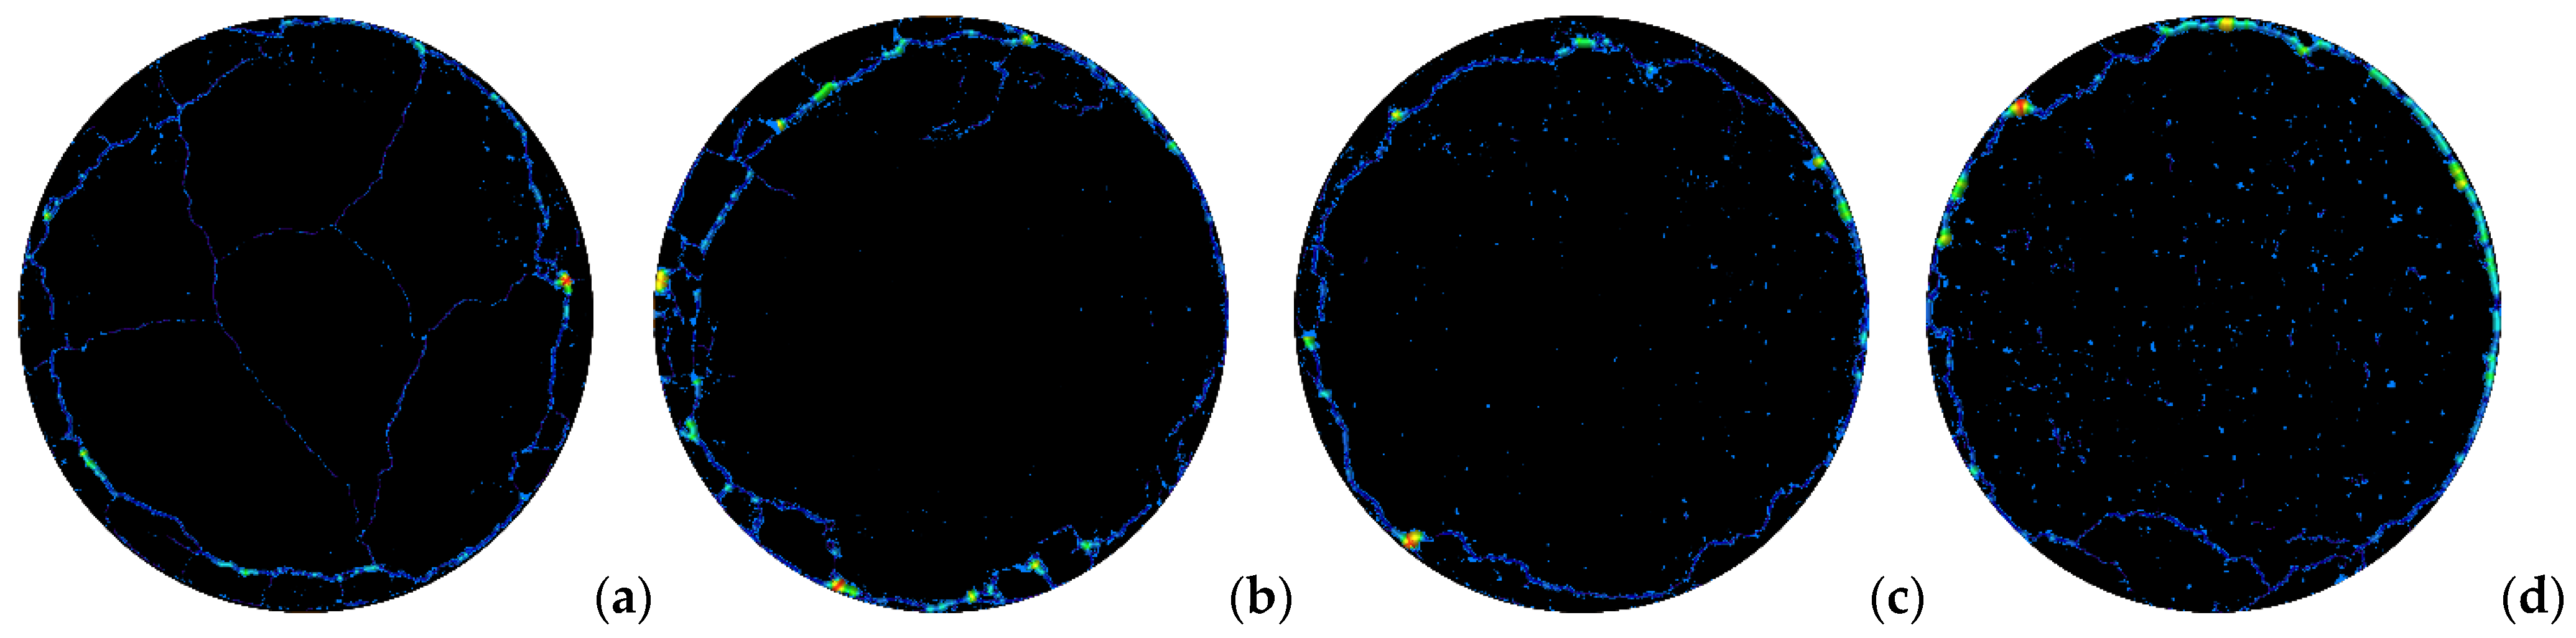
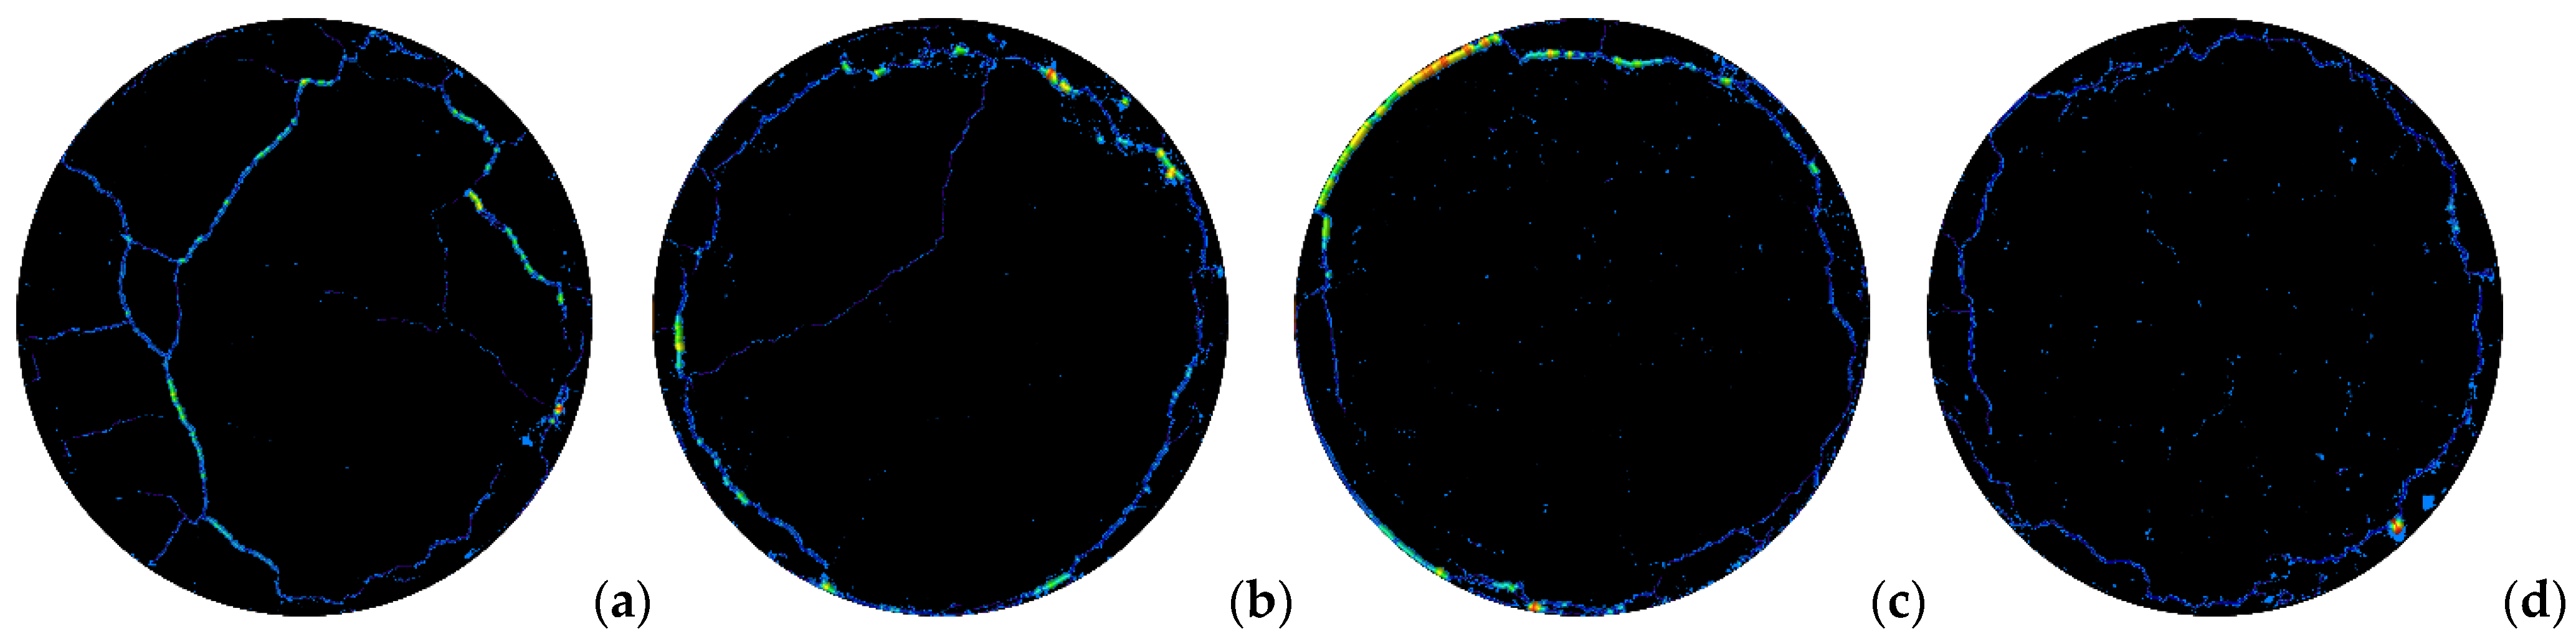
3.3. Results of Macro Cracks

3.3.1. The Influence of WD Cycles on the Crack of Red Clay with Different Particle Sizes

Red clay samples with different particle sizes and dry densities were subjected to 12 WD cycle tests, and three-dimensional crack extraction was performed on a ring knife sample of each. The fracture extraction process of the twelfth cycle of the soil sample with a dry density of 1.3 g/cm3 and particle size of 0.25 mm is illustrated in Figure 11.
The three-dimensional cracks and pores in the soil sample are filled and extracted, shown in Figure 11a–c, indicating that the method is feasible. The crack changes of red clay samples with different particle sizes and a dry density of 1.3 g/cm3 after 1, 4, 8, and 12 WD cycles are displayed in Figure 12, Figure 13, Figure 14 and Figure 15.
After one WD cycle, it is found that the red clay soil sample with different particle sizes is mainly composed of tiny independent pores, and the larger the particle size, the greater the number of pores in the sample. The soil sample with a particle size of 0.25 mm generated evident cracks after four WD cycles (Figure 13). The particle size was 0.50–5.00 mm, with mainly independent pores. The changes between 0.50 mm and 2.00 mm were small. When the particle size was 5.00 mm, large pores increased, and the number of connected pores in local areas increased. Figure 14 demonstrates that after eight WD cycles, the local cracks of the soil sample with a particle size of 0.25 mm become connected, with a long crack appearing that almost penetrates itself. In the red clay with a particle size of 0.50 mm, small cracks appeared. There was still tiny independent pores and obvious water-loss and shrinkage cracks in the boundary of the soil sample with a size of 2.00 mm. In samples with a particle size of 5.00 mm, pierced cracks also appeared. There were many independent pores, and the soil sample boundary also displayed shrinkage cracks due to water loss. Figure 15 shows that during the 12th WD cycle, the cracks in the soil sample with a particle size of 0.25 mm were developed intensely; meanwhile, there were almost no independent pores remaining. There were evident pierced cracks at 0.50 mm, and the cracks were wider than 0.25 mm. The range in size of cracks’ boundaries increased when the particle size was 2.00 mm, and the number of tiny pores inside the soil sample decreased. When the size was 5.00 mm, the primary cracks became broader and more branched, and the independent pores also showed a decreasing tendency. The comparison results infer that as the number of wet and dry cycles increases, cracks on the red clay sample become more pronounced and the first crack appeared when the particle size was 0.25 mm. When the particle size reaches 2.00 mm, the occurrence of boundary cracks is mainly due to water loss and shrinkage. When the particle size reaches 5.00 mm, the most significant number of cracks appears.
The pores and cracks were quantified, as were the fractal dimension and total porosity of each soil sample, as shown in Table 6. With the same number of WD cycles, the red clay’s total porosity and fractal dimension increased with the growth in particle size, consistent with the results shown in Figure 15. With the same particle size, as the number of wet and dry cycles increased, the total porosity increased first and then decreased. In addition, the pores with the highest value in the fourth cycle were mainly independent; then, when the number of cycles increased, the soil sample manifested cracks, but the reason for the decrease in total porosity was the reduction in independent pores. Regarding the fractal dimension, when the particle size was between 2 mm and 5 mm, the fractal dimension gradually decreased as the number of WD cycles increased. When the particle size was between 0.25 mm and 0.50 mm, the fractal dimension fluctuated. As the number of wet and dry cycles increases, the fractal dimension indicated a law of increasing-decreasing-finally increasing.

3.3.2. The Impact of Dry Density on the Cracks of Red Clay with Different Particle Sizes

The development of pores and cracks in red clay soil with the dry density values of 1.3 g/cm3, 1.4 g/cm3, and 1.5 g/cm3 after 12 WD cycles are displayed in Figure 16, Figure 17 and Figure 18.
It can be seen from Figure 16, Figure 17 and Figure 18 that after 12 WD cycles, the soil samples with particle sizes of 0.25 mm and 0.50 mm and a dry density of 1.3 g/cm3 mainly presented cracks. As the dry density increased to 1.4 g/cm3 and 1.5 g/cm3, the number of cracks significantly declined. The soil sample with a particle size of 2.00 mm mainly presented cracks and independent pores caused by water loss and shrinkage, and the number of pores and cracks reduced with the increase in dry density. The soil sample with a diameter of 5.00 mm was mainly composed of cracks, pores, and edge cracks. When the dry density increased to 1.4 g/cm3, the cracks in the middle of the soil sample decreased, and the independent pores decreased when the dry density reached 1.5 g/cm3. With the same dry density, the larger the particle size of the red clay, the greater the number of independent pores, but the cracks in the soil sample with the smallest particle size of 0.25 mm were the most developed. After quantification, the dry density and total porosity curves were determined (Figure 19), as were the curves of dry density and fractal dimension (Figure 20).
The dry density displays curves with the total porosity and fractal dimension, as shown in Figure 19 and Figure 20. In other words, the greater the dry density, the smaller the total porosity and fractal dimension of the red clay soil sample. In Figure 19, for a dry density of 1.3 g/cm3, the average total porosity of different particle sizes is 0.11%. Compared with this, when the dry density is 1.4 g/cm3 and 1.5 g/cm3, the average total porosity is reduced by 36.36% and 45.45%, respectively, with a difference of 14.29%. In Figure 20, for a dry density of 1.3 g/cm3, the average fractal dimension of different particle sizes is 1.324. In contrast, for the dry densities of 1.4 g/cm3 and 1.5 g/cm3, the average fractal dimensions are reduced by 5.21% and 8.16%, respectively, with a difference of 3.11%. The main reason is that the higher the dry density, the denser the soil sample, the smaller the internal pores, and the larger the force between the soil particles. As a result, the WD cycle and particle sizes have little effect. In addition, at different dry densities, the total porosity and fractal dimension of soil samples also vary with particle size.

4. Conclusions

In this paper, red clay from Guilin of various particle sizes and dry densities were subjected to low-temperature nitrogen adsorption tests, UCS tests, and WD cycle crack quantitative tests to study the effects of particle size on the engineering properties and the microstructure. The results are as follows:
(1) The SSA obtained by the Langmuir adsorption isotherm equation via the low-temperature nitrogen adsorption test is about 2.5 times that given by the BET adsorption isotherm equation. The external surface area of the red clay accounts for 93–95% of the total surface area. The pore size ranges from 1.7 to 15 nm, and the pores are mainly tiny. In addition, the low-temperature nitrogen adsorption test determines the internal and external surface areas of the soil particles lattice, which cannot reflect the relationship between the particle size of the red clay and the SSA.
(2) The failure modes of red clay soil samples of different particle sizes are a split failure and shear failure when subjected to unconfined compression tests. When the particle size is 0.25–2 mm, the soil sample surface expands from the bottom upwards, and when the size is 5 mm, cracks present from the middle of the soil sample, appearing as a shear failure. The stress–strain curves are all strain-softening.
(3) Through the WD cycle crack quantitative test, we found that cracks occur in all the red clay soil samples after a certain number of cycles, and the soil samples with a particle size of 0.25 mm are the most likely to have cracks. After quantification, we found that red clay’s total porosity and fractal dimension increase with the increase in particle size, and the total porosity will reach the maximum in the fourth cycle. The higher the dry density, the smaller the total porosity and fractal dimension of red clay.
(4) In real construction projects, the impact of particle size and dry density on the strength of red clay should be considered, as well as the impact of extreme weather, such as the rainfall and high temperatures in Guilin, on the cracks of red clay.

Author Contributions

Y.W. and K.L. wrote the manuscript; J.L. conducted experiments and analyzed the data; S.T. provided suggestions for the research method and revised the article completely. All authors have read and agreed to the published version of the manuscript.

Funding

This project was financially supported by the National Key Research and Development Project (2017YFC1503102) and the National Natural Science Foundation of China (Grant Nos. 51874065 and U1903112).

Institutional Review Board Statement

Not applicable.

Informed Consent Statement

Not applicable.

Data Availability Statement

Not applicable.

Conflicts of Interest

The authors declare no conflict of interest.

References

  1. Wei, X.; Ji, H.; Wang, S.; Song, C. The formation of representative lateritic weathering covers in south-central Guangxi (southern China). Catena 2014, 118, 55–72. [Google Scholar] [CrossRef]
  2. Lee, K.C.; Her, J.H.; Kwon, S.K. Red clay composites reinforced with polymeric binders. Constr. Build. Mater. 2008, 22, 2292–2298. [Google Scholar] [CrossRef]
  3. Li, J.; Tang, S.; Chen, X. Analysis of the Mechanical properties and mechanism of zinc ion-contaminated red clay. Adv. Mater. Sci. Eng. 2021, 2021, 6649691. [Google Scholar] [CrossRef]
  4. Mahinroosta, R.; Poorjafar, A. Effect of stress state and particle-size distribution on the stress reduction of sandy soils during saturation. Constr. Build. Mater. 2017, 150, 1–13. [Google Scholar] [CrossRef]
  5. Chen, L.; Chen, X.; Yang, X.; Bi, P.; Ding, X.; Huang, X.; Wang, H. Effect of calcium carbonate on the mechanical properties and microstructure of red clay. Adv. Mater. Sci. Eng. 2020, 2020, 5298186. [Google Scholar] [CrossRef]
  6. Zhang, Y.; Pu, S.; Li, R.Y.M.; Zhang, J. Microscopic and mechanical properties of undisturbed and remoulded red clay from Guiyang, China. Sci. Rep. 2020, 10, 18003. [Google Scholar] [CrossRef] [PubMed]
  7. Cho, G.; Dodds, J.; Santamarina, J. Particle shape effects on packing density, stiffness, and strength: Natural and crushed sands. J. Geotech. Geoenviron. 2006, 132, 591–602. [Google Scholar] [CrossRef] [Green Version]
  8. Santamarina, J.C.; Klein, A.; Fam, M.A. Soils and waves: Particulate materials behavior, characterization and process monitoring. J. Soils Sediments 2001, 1, 130. [Google Scholar] [CrossRef]
  9. Thornton, C. Numerical simulations of deviatoric shear deformation of granular media. Géotechnique 2000, 50, 43–53. [Google Scholar] [CrossRef]
  10. Wang, J.J.; Zhang, H.P.; Tang, S.C.; Liang, Y. Effects of Particle size distribution on shear strength of accumulation soil. J. Geotech. Geoenviron. Eng. 2013, 139, 1994–1997. [Google Scholar] [CrossRef]
  11. Qi, Z.; Chen, T.; Bai, S.; Yan, M.; Li, X. Effect of temperature and particle size on the thermal desorption of PCBs from contaminated soil. Environ. Sci. Pollut. Res. 2014, 21, 4697–4704. [Google Scholar] [CrossRef]
  12. Chang, C.S.; Deng, Y.B.; Yang, Z.N. Modeling of minimum void ratio for granular soil with effect of particle size distribution. J. Eng. Mech.-ASCE 2017, 143, 5092612. [Google Scholar] [CrossRef]
  13. Cubrinovski, M.; Ishihara, K. Maximum and minimum void ratio characteristics of sands. Soils Found. 2002, 42, 65–78. [Google Scholar] [CrossRef] [Green Version]
  14. Fuggle, A.R.; Roozbahani, M.M.; Frost, J.D. Size effects on the void ratio of loosely packed binary particle mixtures. In Geo-Congress 2014 Technical Papers; ASCE: Reston, VA, USA, 2014; pp. 129–138. [Google Scholar] [CrossRef]
  15. Islam, M.N.; Siddika, A.; Hossain, M.B.; Rahman, A.; Asad, M.A. Effect of particle size on the shear strength behavior of sands. arXiv 2019, arXiv:1902.09079. [Google Scholar]
  16. Cheraghi, M.; Jomaa, S.; Sander, G.; Barry, D. Hysteretic sediment fluxes in rainfall-driven soil erosion: Particle size effects. Water Resour. Res. 2016, 52, 8613–8629. [Google Scholar] [CrossRef]
  17. Rasti, A.; Adarmanabadi, H.R.; Pineda, M.; Reinikainen, J. Evaluating the effect of soil particle characterization on internal friction angle. Am. J. Eng. Appl. Sci. 2021, 14, 129–138. [Google Scholar] [CrossRef]
  18. Aberg, B. Void ratio of noncohesive soils and similar materials. J. Geotech. Eng. 1992, 118, 1315–1334. [Google Scholar] [CrossRef]
  19. Bobei, D.C.; Lo, S.R.; Wanatowski, D.; Gnanendran, C.T.; Rahman, M.M. Modified state parameter for characterizing static liquefaction of sand with fines. Can. Geotech. J. 2009, 46, 281–295. [Google Scholar] [CrossRef]
  20. Peters, J.F.; Berney, E.S. Percolation threshold of sand-clay binary mixtures. J. Geotech. Geoenviron. Eng. 2010, 136, 310–318. [Google Scholar] [CrossRef]
  21. Reiner, N.; Gabriel, E.; José, C.; Matheus, P. The mineral phase quantification of vermiculite and interstratified clay minerals-containing ores by X-ray diffraction and Rietveld method after K cation exchange. Miner. Eng. 2011, 24, 1323–1334. [Google Scholar] [CrossRef]
  22. Wang, Z.; Cheng, Y.; Qi, Y.; Wang, R.; Wang, L.; Jiang, J. Experimental study of pore structure and fractal characteristics of pulverized intact coal and tectonic coal by low temperature nitrogen adsorption. Powder Technol. 2019, 350, 15–25. [Google Scholar] [CrossRef]
  23. Qi, L.; Tang, X.; Wang, Z.; Peng, X. Pore characterization of different types of coal from coal and gas outburst disaster sites using low temperature nitrogen adsorption approach. Int. J. Min. Sci. Technol. 2017, 27, 371–377. [Google Scholar] [CrossRef]
  24. Sing, K. The use of nitrogen adsorption for the characterisation of porous materials. Colloids Surf. A Physicochem. Eng. Asp. 2001, 187–188, 3–9. [Google Scholar] [CrossRef]
Figure 1. The energy spectrum of red clay.
Applsci 11 10887 g001
Figure 2. X-ray diffraction spectrum.
Applsci 11 10887 g002
Figure 3. Adsorption–desorption isotherm of red clay (0.25 mm).
Applsci 11 10887 g003
Figure 4. Adsorption isotherms of red clay with different particle sizes.
Applsci 11 10887 g004
Figure 5. BJH adsorption cumulative pore volume.
Applsci 11 10887 g005
Figure 6. BJH desorption cumulative pore volume.
Applsci 11 10887 g006
Figure 7. Failure pattern of soil sample: (a) 0.25 mm; (b) 0.5 mm; (c) 2 mm; (d) 5 mm.
Applsci 11 10887 g007
Figure 8. Stress–strain curve of red clay: (a) 1.3 g/cm3; (b) 1.4 g/cm3; (c) 1.5 g/cm3.
Applsci 11 10887 g008
Figure 9. The fitting curve of dry density and UCS at different particle sizes.
Applsci 11 10887 g009
Figure 10. The fitting curve of particle size and UCS at different dry densities.
Applsci 11 10887 g010
Figure 11. Fracture extraction process: (a) original image; (b) crack filling; (c) crack extraction.
Applsci 11 10887 g011
Figure 12. Cracks in soil sample after 1 WD cycle; (a) 0.25 mm; (b) 0.50 mm; (c) 2.00 mm; (d) 5.00 mm.
Applsci 11 10887 g012
Figure 13. Cracks in soil sample after 4 WD cycles: (a) 0.25 mm; (b) 0.50 mm; (c) 2.00 mm; (d) 5.00 mm.
Applsci 11 10887 g013
Figure 14. Cracks in soil sample after 8 WD cycles: (a) 0.25 mm; (b) 0.50 mm; (c) 2.00 mm; (d) 5.00 mm.
Applsci 11 10887 g014
Figure 15. Cracks in soil sample after 12 WD cycles: (a) 0.25 mm; (b) 0.50 mm; (c) 2.00 mm; (d) 5.00 mm.
Applsci 11 10887 g015
Figure 16. The dry density of 1.3 g/cm3: (a) 0.25 mm; (b) 0.50 mm; (c) 2.00 mm; (d) 5.00 mm.
Applsci 11 10887 g016
Figure 17. The dry density of 1.4 g/cm3: (a) 0.25 mm; (b) 0.50 mm; (c) 2.00 mm; (d) 5.00 mm.
Applsci 11 10887 g017
Figure 18. The dry density of 1.5 g/cm3: (a) 0.25 mm; (b) 0.50 mm; (c) 2.00 mm; (d) 5.00 mm.
Applsci 11 10887 g018
Figure 19. The fitting curve of dry density and total porosity.
Applsci 11 10887 g019
Figure 20. The fitting curve of dry density and fractal dimension.
Applsci 11 10887 g020
Table 1. Basic physical and mechanical properties.
Unit WeightSpecific GravityFree Swelling RatioPlastic LimitLiquid LimitPlasticity IndexOptimum Moisture ContentMaximum Dry Unit Weight
18.1 kN/m32.7621%31.9%55.8%23.930.78%1.575 g·cm−3
Table 2. Chemical composition of red clay.
ElementMgKAIKSiKKKTiKFeKOTotal
Weight (%)0.9019.5422.341.321.367.7246.81100.00
Table 3. Mineral composition of red clay.
Mineral CompositionSemi-Quantitative (%)Characteristic PeakInterplanar Spacing d (Å)Angle 2 Theta (°)Relative Strength I (%)
Quartz38.00The first characteristic peak3.3326.74100
The second characteristic peak4.2320.9721.9
The third characteristic peak1.8150.239.9
Laumontite13.20The first characteristic peak9.429.38100
The second characteristic peak3.525.4447.7
The third characteristic peak4.1521.3943.8
Montmorillonite1.10The first characteristic peak14.719.75100
The second characteristic peak4.9335.0660
The third characteristic peak4.4362.0980
Kaolinite4.20The first characteristic peak7.1512.37100
The second characteristic peak3.5724.980
The third characteristic peak2.3438.5140
Clinochlore23.10The first characteristic peak14.386.2386.5
The second characteristic peak7.112.38100
The third characteristic peak4.7518.6759.6
Illite20.30The first characteristic peak9.98.961
The second characteristic peak4.4519.9100
The third characteristic peak3.525.3860.3
Table 4. The SSA of red clay with different particle sizes.
Grain Size
(mm)
BET Surface Area (m2/g)Langmuir Surface Area
(m2/g)
Internal Surface Area
(m2/g)
External Surface Area
(m2/g)
BJH Adsorption Cumulative Surface Area
(m2/g)
BJH Desorption Cumulative Surface Area
(m2/g)
0.2545.6956116.23312.889542.806146.95048.4585
0.5042.7188109.09092.069640.649244.26845.6784
2.0045.8130117.73442.916242.896847.14348.8844
5.0044.7118113.17812.962841.748945.70047.5564
Table 5. The pore volume of red clay with different particle sizes.
Grain Size
(mm)
Micropore Volume
(cm3/g)
BJH Adsorption Cumulative Volume
(cm3/g)
BJH Desorption Cumulative Volume
(cm3/g)
BJH Adsorption Average Pore Width (4 V/A)
(nm)
BJH Desorption Average Pore Width (4 V/A)
(nm)
0.250.0012100.0656120.0751295.59006.2015
0.500.0008100.0612530.0724725.53486.3463
2.000.0012350.0654730.0796855.55526.5203
5.000.0012550.0628680.0773635.50286.5070
Table 6. Total porosity and fractal dimension of red clay.
Number of Cycles0.25 mm0.50 mm2.00 mm5.00 mm
Total
Porosity (%)
Fractal DimensionTotal Porosity (%)Fractal DimensionTotal Porosity (%)Fractal DimensionTotal Porosity (%)Fractal Dimension
10.00250.85810.01291.31000.05001.49480.06451.4998
40.08751.33090.09821.32980.15861.37690.20351.5228
80.07451.25040.10851.15580.13121.34150.14191.4295
120.09071.32990.09091.29880.12831.29910.12601.3699
Publisher’s Note: MDPI stays neutral with regard to jurisdictional claims in published maps and institutional affiliations.

