1. Introduction
Digital technology is dramatically gaining momentum, taking over all sectors and areas of human life around the world [
1,
2]. The mining industry is no exception. Digital technology is being performed and implemented at a rapid pace in mining operations [
3,
4]. The widespread adoption of digital technology requires a workforce capable of understanding the specifics of this technology [
5,
6]. It requires the right approach in developing and implementing it in an existing manufacturing environment as well. Employees who understand and are ready to implement digital technologies have to either be outsourced or retrained [
7,
8]. In the first case, it takes a long time for the new employee to understand the specifics and characteristics of production from scratch. In the second case, the employee needs time to learn the new technology. In both cases, it is obviously relevant to develop special systems or complexes to simplify the training [
9,
10].
The digital industry training simulator is such a dedicated facility. The development of specific training complexes is not a new area. There are a significant number of training complexes in different sectors [
11,
12]. For example, in article [
13], a virtual reality collaborative planning simulator with methods for the three machines based on a multi-agent system is described. There are several types of training systems in the industry, such as the operator training simulator (OTS) [
14,
15]. In other words, it is a process control training system or a personal skills training system (pit management trainer, drilling rig trainer, etc.) [
16,
17]. For example, in article [
18], a virtual excavator simulator featuring hardware-in-the loop-simulation (HILS) technology and haptic joysticks is presented. A large percentage of simulators, in the classic sense of the word, developed these days are just fly [
19,
20] or driver simulators [
21,
22,
23].
The principles of developing such simulators forms a certain sequence: the development of dynamic or physical models (cab, dynamic model of a particular process), the development of training scenarios and the evaluation of the simulator’s performance [
12,
15]. The evaluation of the simulator performance can be carried out by several criteria. For example, Ref. [
24] suggests evaluating the performance by testing it and determining its technical, functional, psychological and cognitive fidelity. If fly or driver simulators are developed and have a wide application [
25], the industrial simulators are developed individually and are usually unique in its kind [
26].
Paper [
27] deals with the NPP (nuclear power plant) operator’s simulator. The authors point out a systematic error present in all simulators. This error occurs on two fronts: environmental biases (physical differences between the simulator and the control room) and motivational biases (cognitive differences between simulator training and NPP operation). The authors of the article propose a methodology for quantifying the effects of working on these simulators caused by these two directions and give recommendations for simulator bias experiments.
The article [
28] presents the process of developing and testing a simulator for training operators of the isopropyl alcohol production plant. The UniSim software package was used to simulate the technological part. The authors emphasize the suitability of the simulator for operator training, as well as for educational purposes, engineering applications and technology analysis.
Over time, the trend is gradually changing, and there is a shift from the simulator of a unique object or process to a simulator that performs a particular function, which is then used repeatedly for different purposes. For example, in the work [
29], a digital real-time simulator that predicts the behavior of power systems in a steady state and transient states is studied. This simulator is used for power system testing in extreme conditions, in design tasks, equipment adjustment, etc. There is no mention of the abolition of complex simulators covering unique processes or objects. Their construction is different for the most part, or they completely consist of separate modular block functional parts, simulating a simpler functionality.
Paper [
30] presents the development of an integrated infrastructure simulator for sustainable urban energy optimization and its application. This simulator consists of several modules according to the business model with the management strategy applied in Hamamatsu city (Japan).
The work [
31] explores an immersive VR-based safety training simulator that allows for procedural training to electric overhead crane (EOT) operators. The combination of simulation and VR technology is a typical solution for safety simulator.
The explosion in digitalizing is prompting producers to move urgently to adopt new technologies. Unfortunately, the economic impact of digitalization is often difficult to measure. First of all, this is due to the prolonged effect of the introduction of various digital tools. The article [
32] shows that the explosive spread of digitalization affects the sustainability of specific advantages. However, this effect may be transient and may last until either a more “advanced” product appears on the market, or until the technology is no longer needed. On the other hand, the same paper shows another version when digitalization has “a winner takes all” effect. In the first and in the second case, the effect is difficult to measure, because it is impossible to determine the time during which one or another digital technology will be “on top”, and it is difficult to determine the time of winning over everything. Decision-makers are faced with enormous development and implementation costs, which overshadow the effect, especially when it is intended for the long term. The simulator will help to train staff, and can be a testing ground for new solutions related to production digitalization. For example, paper [
33] emphasizes the urgent need to develop the next generation of pedagogical simulators. These simulators, according to the authors, should be simulators that combine today’s best practices (commonly used as part of bachelor and master curriculums of chemical and biochemical engineering, and are: PRO/II, Aspen Plus, Hysys, SuperPro, specific simulators that have been created as learning tools for undergraduate engineering and science students, such as BerryMaker or Labster ApS., and others like that).
Thus, simulators based on dynamic models of different parts of the production cycle and the training of specialists will significantly increase profits and reduce costs for enterprises [
34,
35]. Such implementations will clearly present to decision-makers the benefits of adopting a particular technology. This will improve the observability of the results of digital technology applications, and will practice the solutions developed without affecting the existing production. For instance, the work [
36] shows one of such simulators, DeConSim, which is an ideologically close analogue to the simulator developed by the authors. A distinctive feature of this simulator is the ability to work in two different modes: simulation and real-time mode. This approach allows us to move from a simulator to a modeling tool underlying the control system at different levels.
Mining processes are divided into a number of stages and process steps. One important stage is the beneficiation process. The most common method is flotation for valuable metal ores [
37,
38]. This method, which is founded on the principles of material separation based on the wettability of the mineral surfaces, is both versatile and can be applied to a wide range of raw material types using a variety of reagents [
39].
The purpose of this paper is to develop a dynamic model of the flotation process at a gold mining enterprise, to form criteria for assessing the suitability of this dynamic model for use in a digital training simulator and to evaluate the developed model against the formed criteria.
To achieve this goal, in the Materials and Methods chapter, the description of the general principles of the flotation model development and the principles of model development adopted in this paper are shown. In addition, a description of the methodology for assessing the suitability of the model for use in a computer simulator is given, the scheme of the computer simulator is developed and a description of the study of the model and testing for the suitability for use in the simulator complex are given. In the third chapter, Experiments, the description of the test object, the peculiarities of the experiments, the basic scheme of the research and the main characteristics and features of the flotation machine are given. The chapter Results presents the results of the study of flotation enrichment kinetics and a calculation of flotation rate constants for each factor. It also presents the appearance of the dynamic model and the testing results of this model, as well as the results of the study of the dynamic flotation model on the suitability of its use in a computer simulator.
2. Materials and Methods
In order to achieve set objective, materials and methods for the dynamic model development of the flotation process were used. The design of the evaluation criteria for the suitability of the dynamic model in a computer-based digital training simulator and the methodology for assessing the model to meet the specified criteria has also been considered.
2.1. Model Development
Several types of flotation models are proposed in flotation theory [
40]: kinetic models; mass-balance models; and probabilistic models. The most common are kinetic flotation models. In these models, the first order kinetic equation is widely used to determine the kinetic parameters of flotation. This equation is based on the idea of an elementary flotation act as an analogue of a chemical process, where a bubble and a mineral particle interact. It follows that the rate of the flotation process is directly proportional to the number of elementary flotation acts. The coefficient of proportionality in this case is the flotation rate constant. Thus, the basis for the development is the method for determining the flotation constant [
41].
However, the practice of applying these models to describe real technological processes has shown that, due to the complexity of the process, the modelling results using a single equation of flotation kinetics do not have sufficient accuracy. The solution to this problem was found in the description of the process by a system of equations with different flotation rate constants, which represents the flotation process as a set of several sub-processes. In the literature, there are two principal approaches in determining the value of flotation rate constants [
42]:
Dividing the flotation process into sub-processes according to the phase where the process takes place and determining the rate constant for each of these sub-processes;
Dividing all material into flotation classes based on its hydrophobicity, and establishing the rate constant for each of these classes.
Partitioning into phases has proven to be a good idea for models using the principles of computational fluid dynamics. Kinetic laws of transition of mineral particles between “pulp phases” and “froth phases” allow us to establish correlations with calculation of particle movement trajectories in the field of velocities of the medium.
By dividing the whole material into different hydrophobic fractions, the concept of “floatability index” is introduced. The flotation index is a dimensionless value, reflecting the relative probability of particle attachment to the bubble and its further removal into the foam product by true flotation or mechanical removal. The concept is based on the principle of classifying the entire mass of flotation material into classes for particles whose difference in attachment probability is insignificant. This is necessary in order to compensate for the difference between the recovery values determined in laboratory experiments and theoretical calculations [
43].
To simulate the process, AVEVA used an approach to describe flotation as analogous to a chemical process. It is based on an equation describing the change in mineral particle concentration with flotation time.
where:
N—particle concentration,
k—flotation rate constant,
t—flotation time.
The physical meaning of the kinetic equation’s order is conditioned by the specific number of mineral particles per air bubble. Thus, the main task is to determine the flotation rate constant.
One approach for determining the rate constant is to estimate the partial constants of the effect of the different factors on flotation efficiency. In this approach, all flotation material is divided into classes, with respect to component and size class.
where:
—overall flotation rate constant for specific
i—particle size class and
j—reagent regime,
—flotation rate constant component that correlates with particle size distribution,
—flotation rate constant component that correlates with frother concentration in pulp for specific reagent regime,
—flotation rate constant component that correlates with collector concentration in pulp for specific reagent regime,
—flotation rate constant component that correlates with air flow rate,
—flotation rate constant component that correlates with impeller speed.
This approach has several key advantages. Firstly, it allows us to more accurately account for the influence of various technological factors on the efficiency of the flotation process, based on the results of flotation tests on ores. Secondly, the approach allows for scaling the results of experimental studies from laboratory installations to industrial ones with higher values of adequacy.
One of the main issues, scaling the results of laboratory studies to industrial plants, stems from the influence of flotation cell hydrodynamics on the measure of air dispersion in the chamber. The approach to the issue is to keep the parameter of surface area bubble flux (
) and the superficial gas velocity (
) equal. The resulting parameters are the starting point for scaling the results. The parameter
relates the amount of air supplied to the flotation process to the geometric parameters of the bubbles, as well as to the geometric characteristics of the machine chamber [
44].
where:
—bubble diameter,
—air flow rate,
—flotation cell’s cross-sectional area.
The geometric size distribution parameter of the bubbles was determined by analyzing the image of the air bubbles in the cell. This approach is based on the assumption that, when mineral particles attach to bubbles, the size deformation of the latter is minor. The sizing was achieved from the captured images of the dispersion process. Only the foaming agent was used.
2.2. Development of a Methodology to Assess the Suitability of the Model for Use in a Computer-Based Digital Learning Simulator
Currently, there are many technologies related to digital ones in one way or another. The work [
45] investigated technologies used in the mining industry. Among them, the most in demand are: advanced process control, mine nerve center, virtual and augmented reality, automation, digital twins, artificial intelligent, robotics, big data, cyber security, etc.
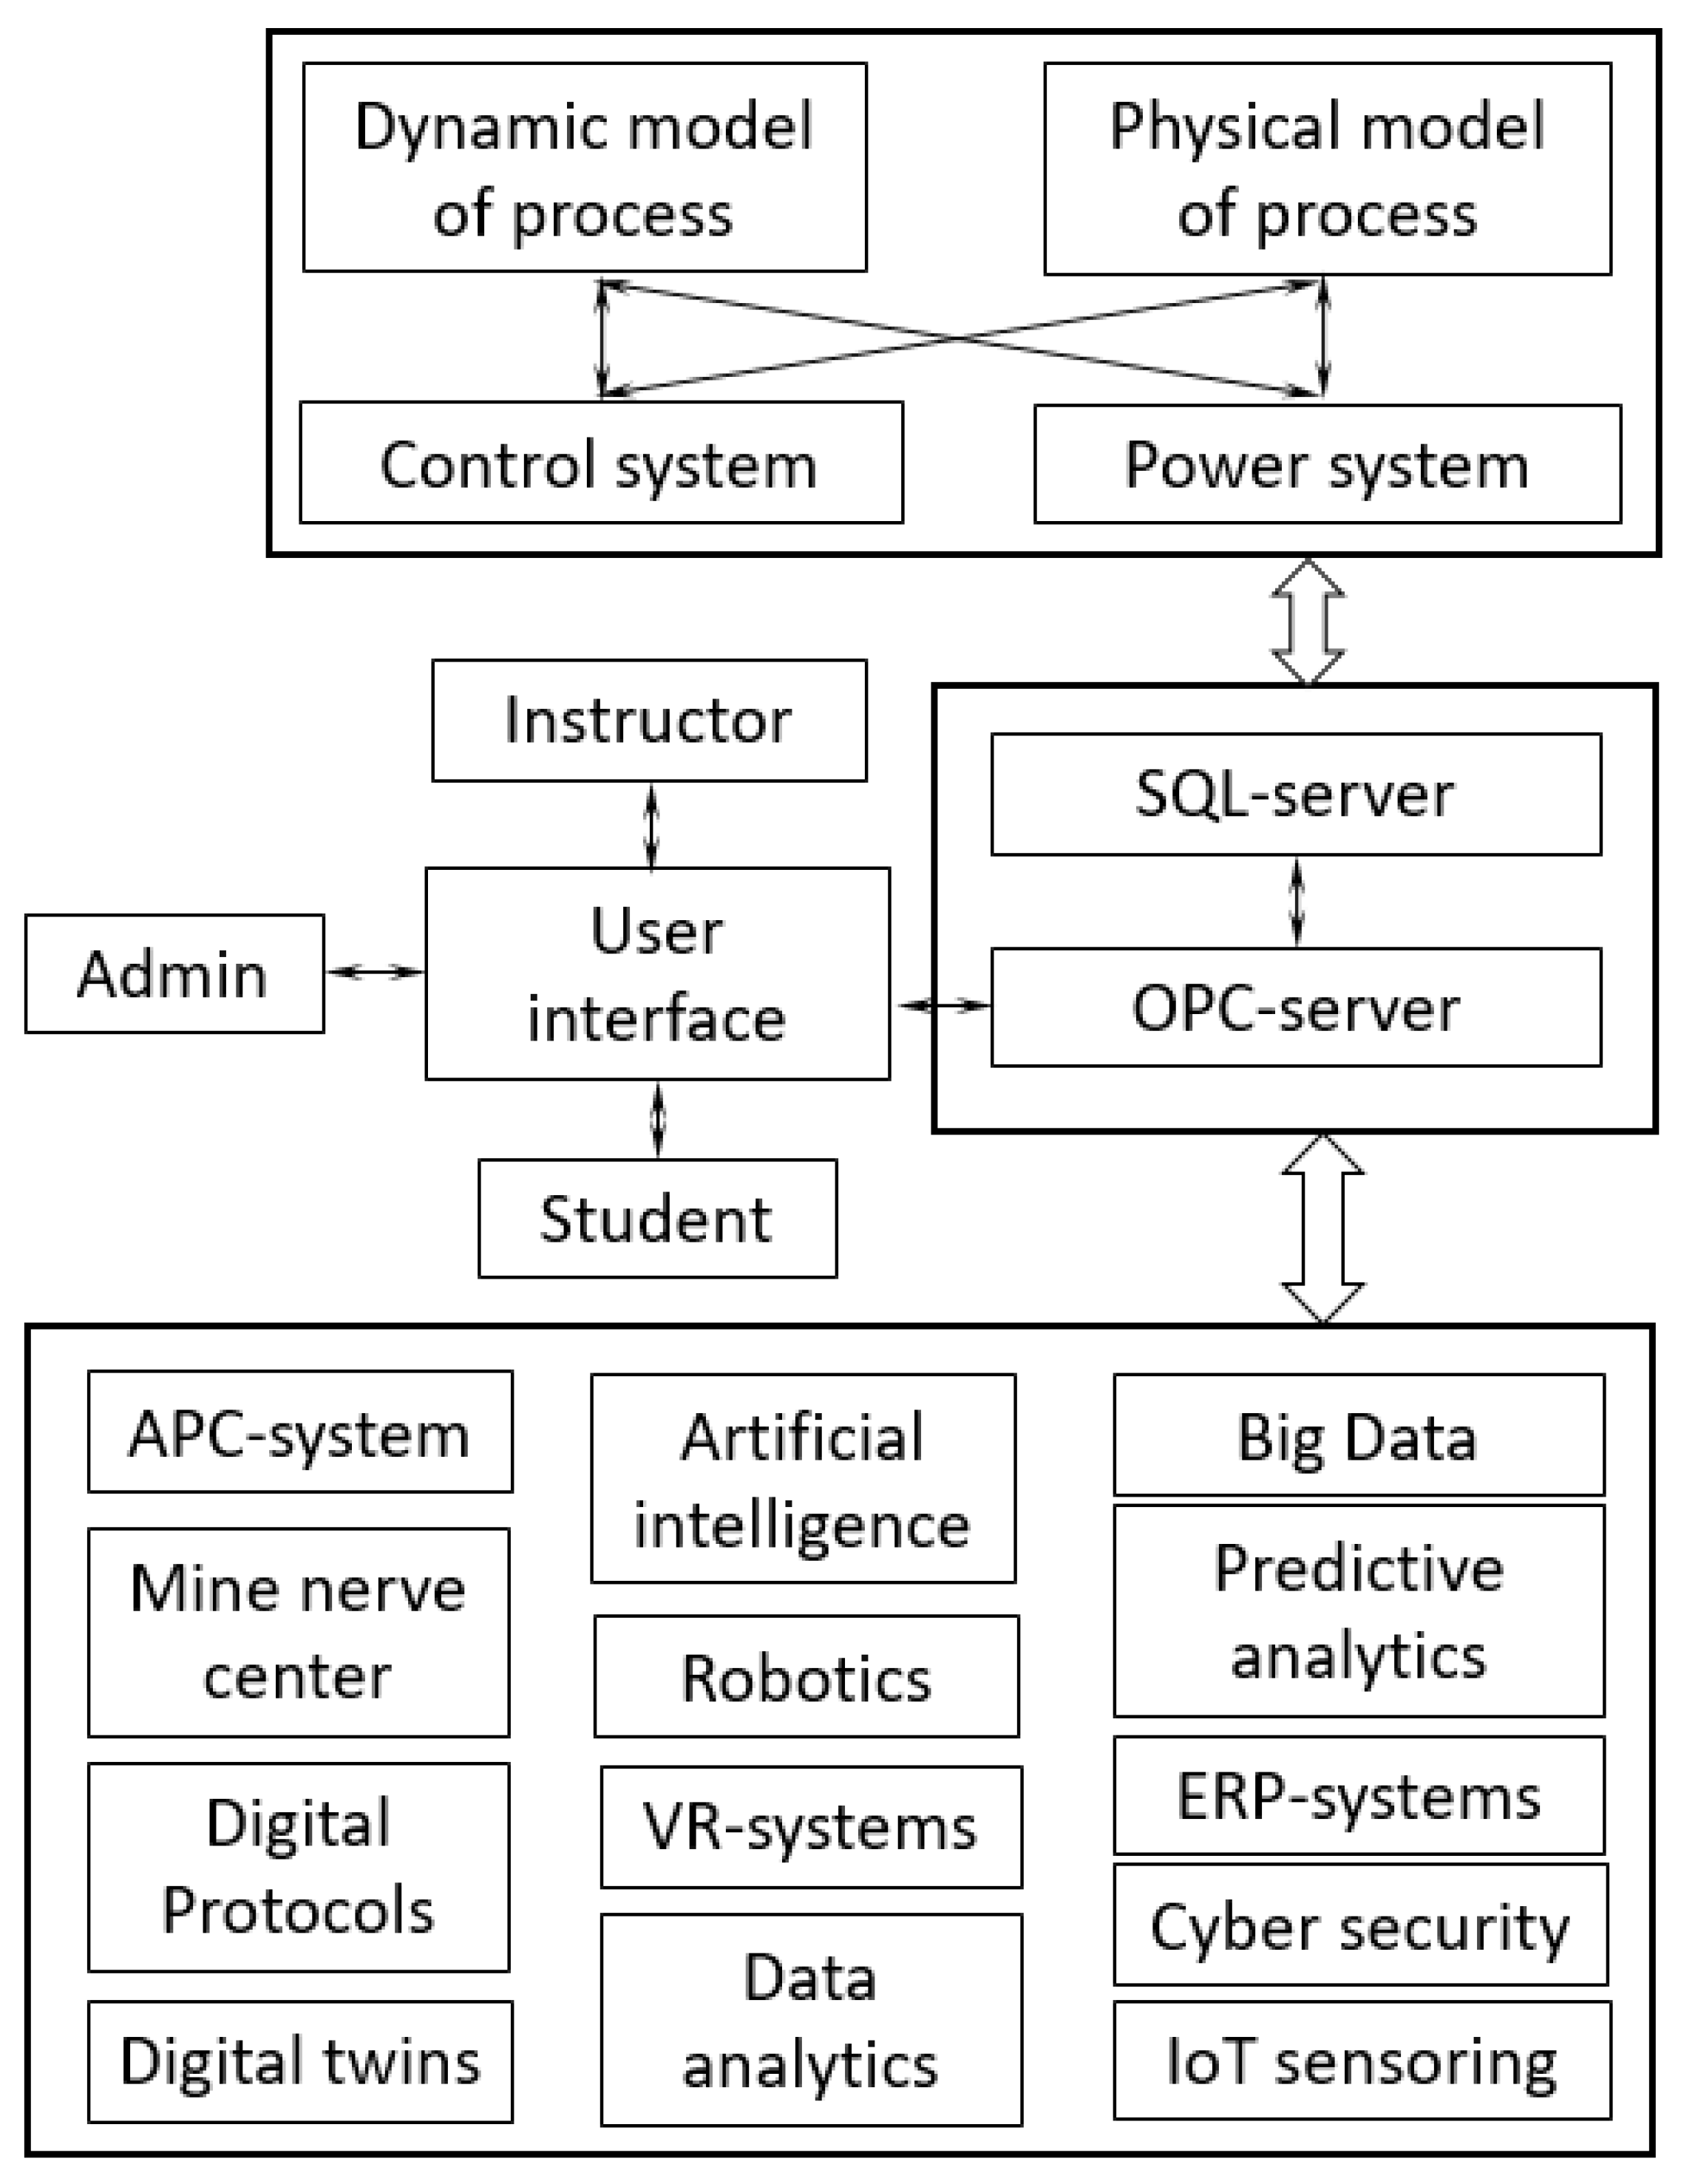
Figure 1 shows a simplified diagram of the computer simulator under development. This diagram demonstrates some of its features, namely:
- −
The control and power systems are separated into separate units (this will make it possible to understand whether to virtualize the functions of these systems or to leave the real ones in place);
- −
The physical and dynamic models are connected together.his solution allows the user to practice the functionality on physical simplified models and to see how they scale to the size of the entire enterprise;
- −
A separate user interface is allocated for the administrator and the instructor. This will give the instructor the ability to develop training tasks, and will give the administrator the ability to configure the system, etc.;
- −
Models and systems are communicated using the OPC protocol. This protocol is basic and can be changed to any other (e.g., MQTT etc.).
The study of the model jointly in terms of different technologies has its own characteristics. For example, the dynamic model can be used to investigate the performance of digital twin technology as a tool for changing process conditions. Essentially, on the one hand, the model itself can be a digital twin of the processes. On the other hand, the model can be used in the development of digital twins of devices (e.g., an engine) and, thus, will simulate changes in the operating conditions (load) of the engine in terms of real plant conditions. To verify this functionality, confirm the trainer-energy system-dynamic Model connection and obtain data exchange signals between these system components.
In order to study robotics, which are IoT sensoring technologies, some physical models of the production cycle are provided in the simulator. Dynamic models are not suitable for studying these technologies as they imply direct interaction of such systems with the process.
Despite the differences in the investigation of the model and the applicability of different digital technologies to it, the testing of the model for suitability for use in a given training complex will be the same for all technologies. It will consist of a series of actions, the basis of which being to obtain an unambiguous answer as to whether the dynamic model is linked to the software or hardware used to implement a particular digital technology.
Testing will be conducted by functionality testing only, with no other factors taken into account. During testing, a protocol will be drawn up using the following template (
Table 1).
4. Results and Discussion
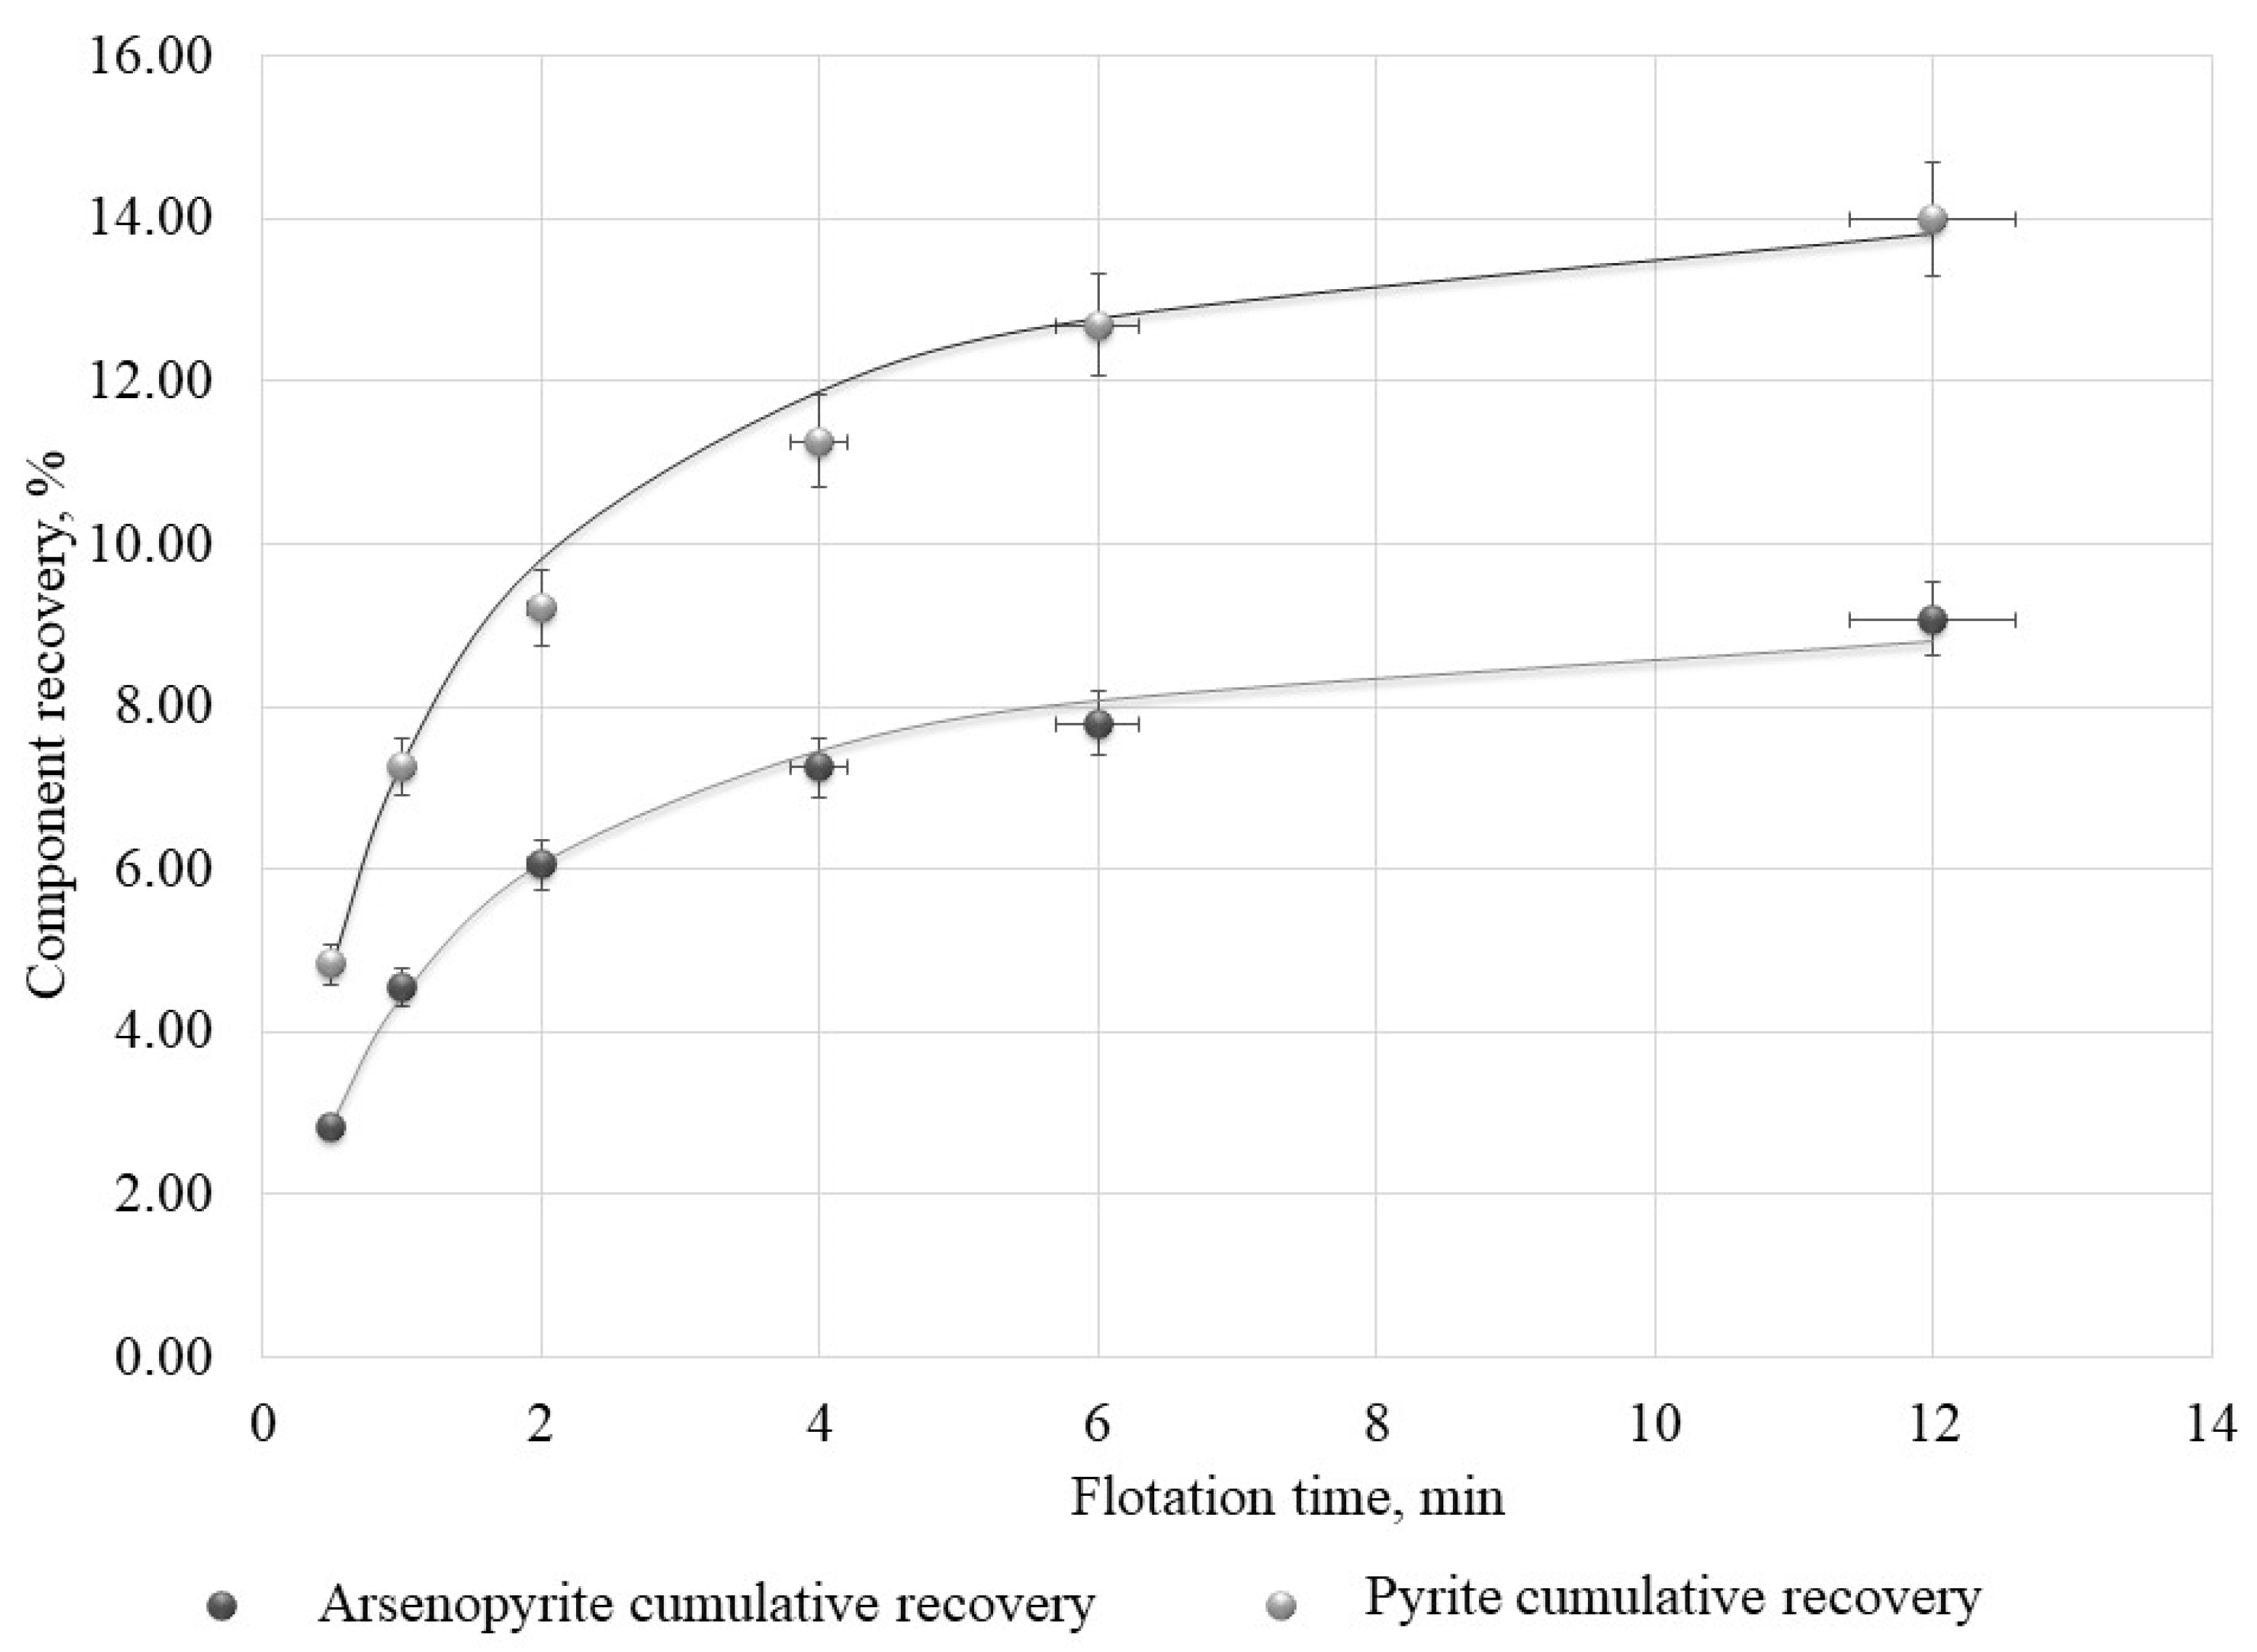
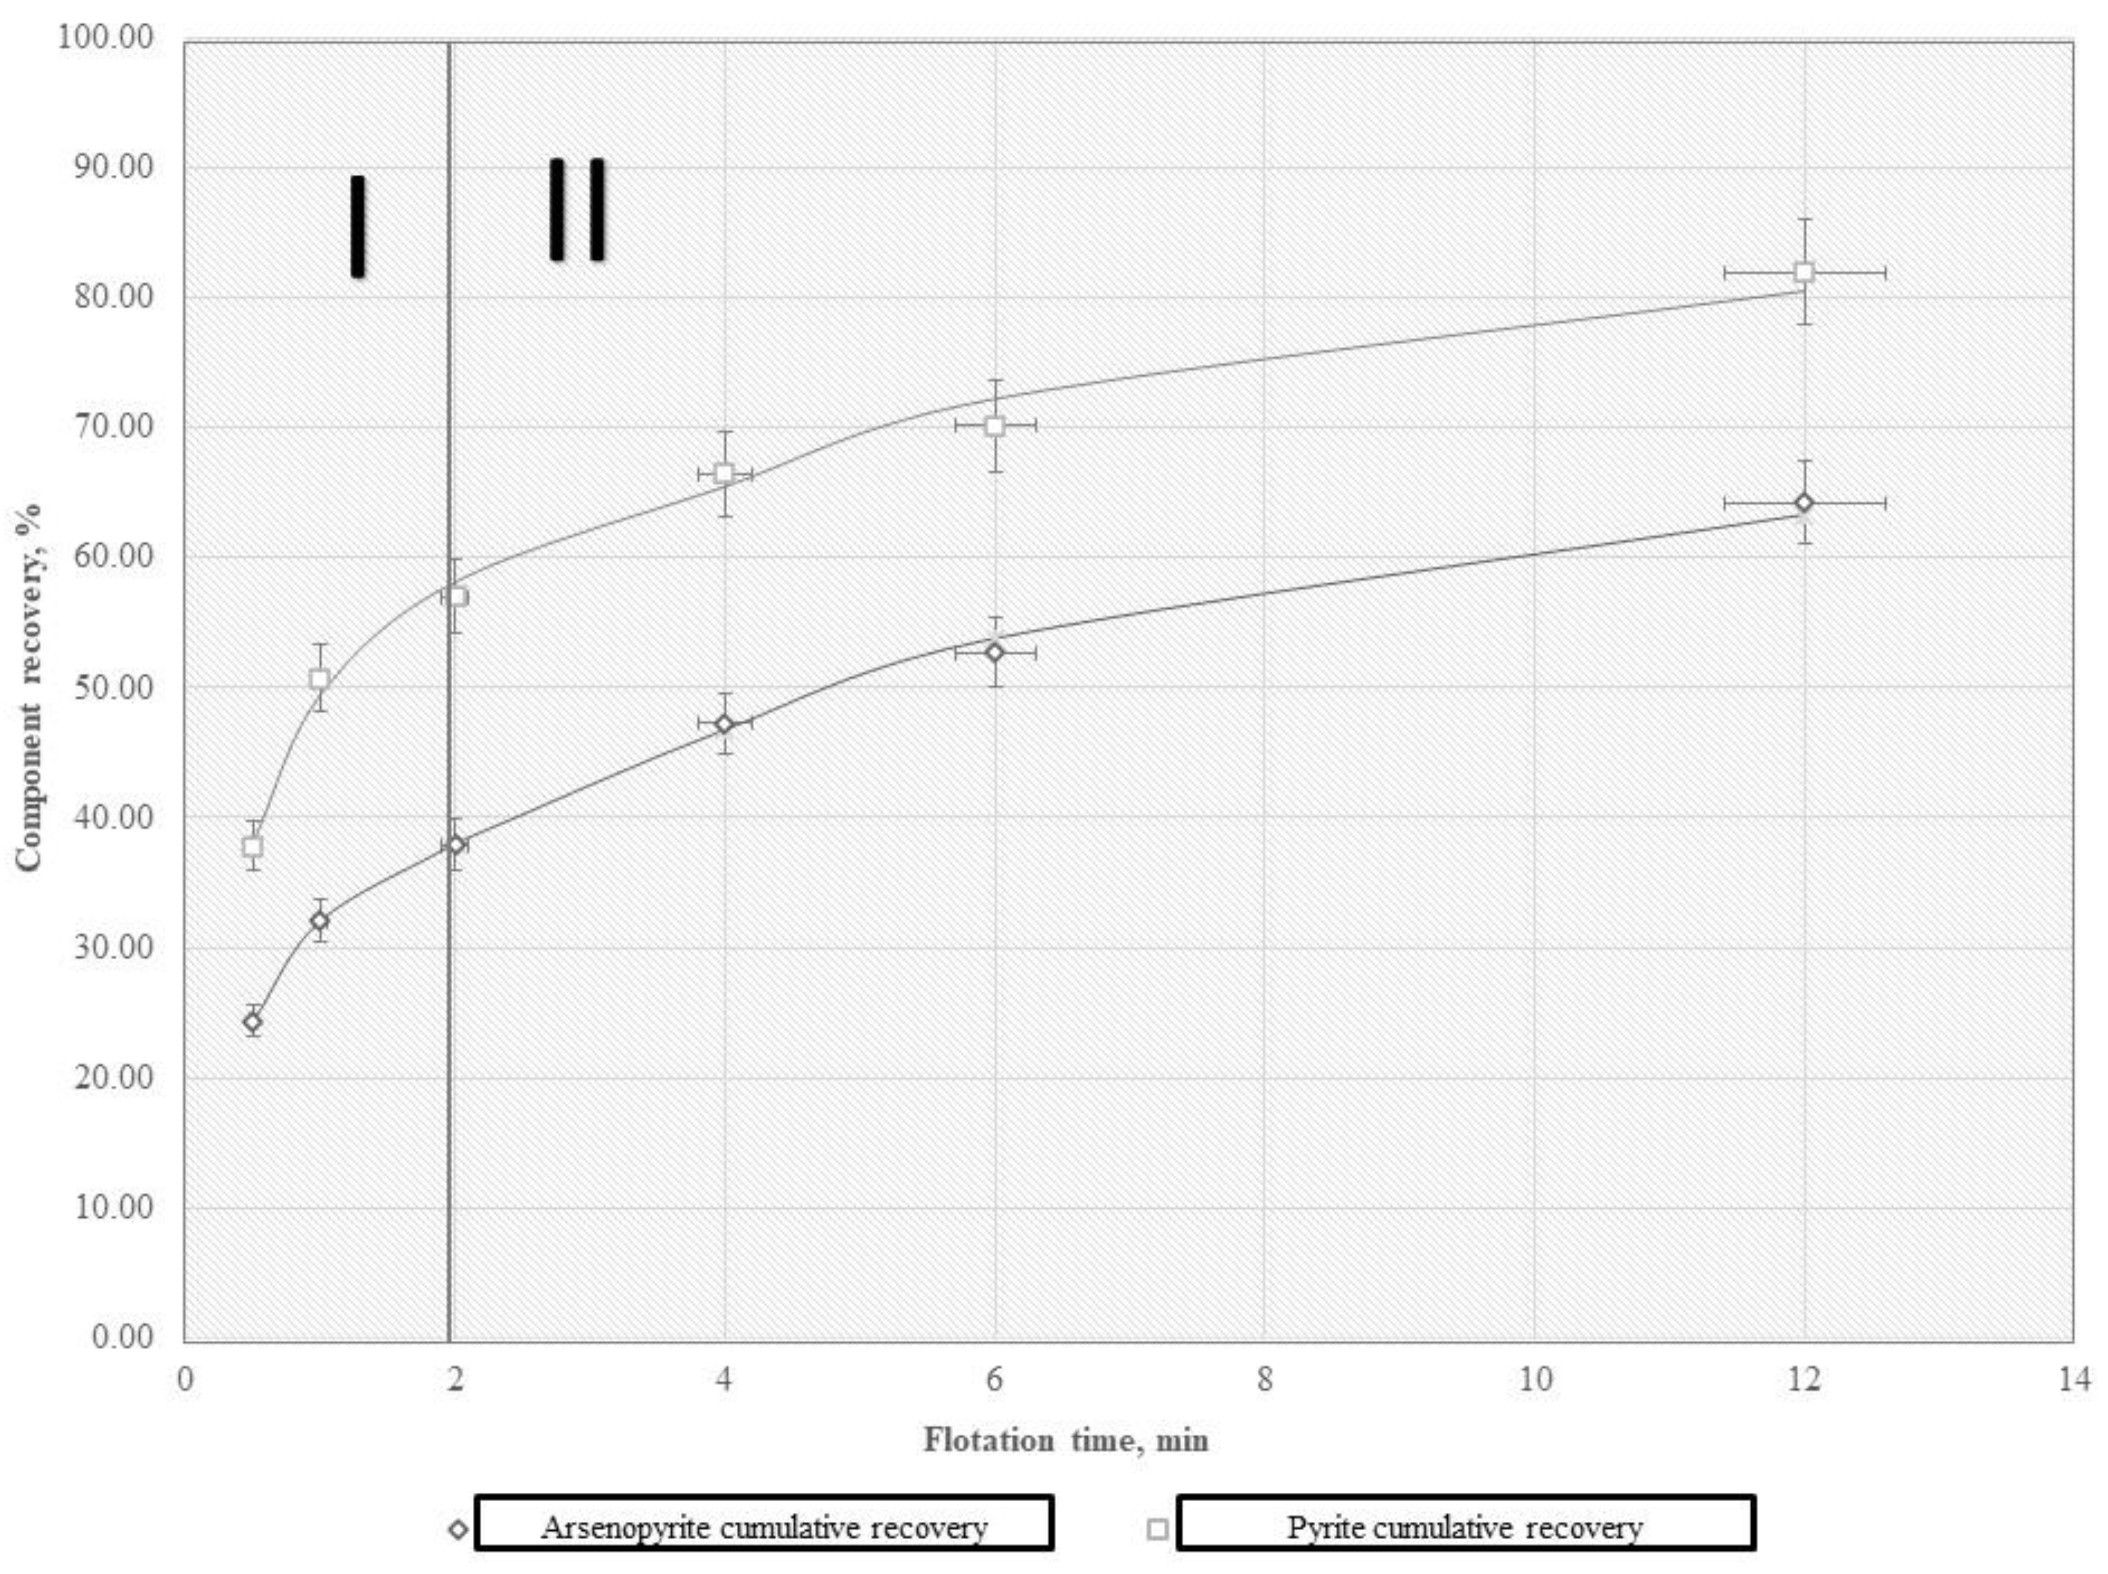
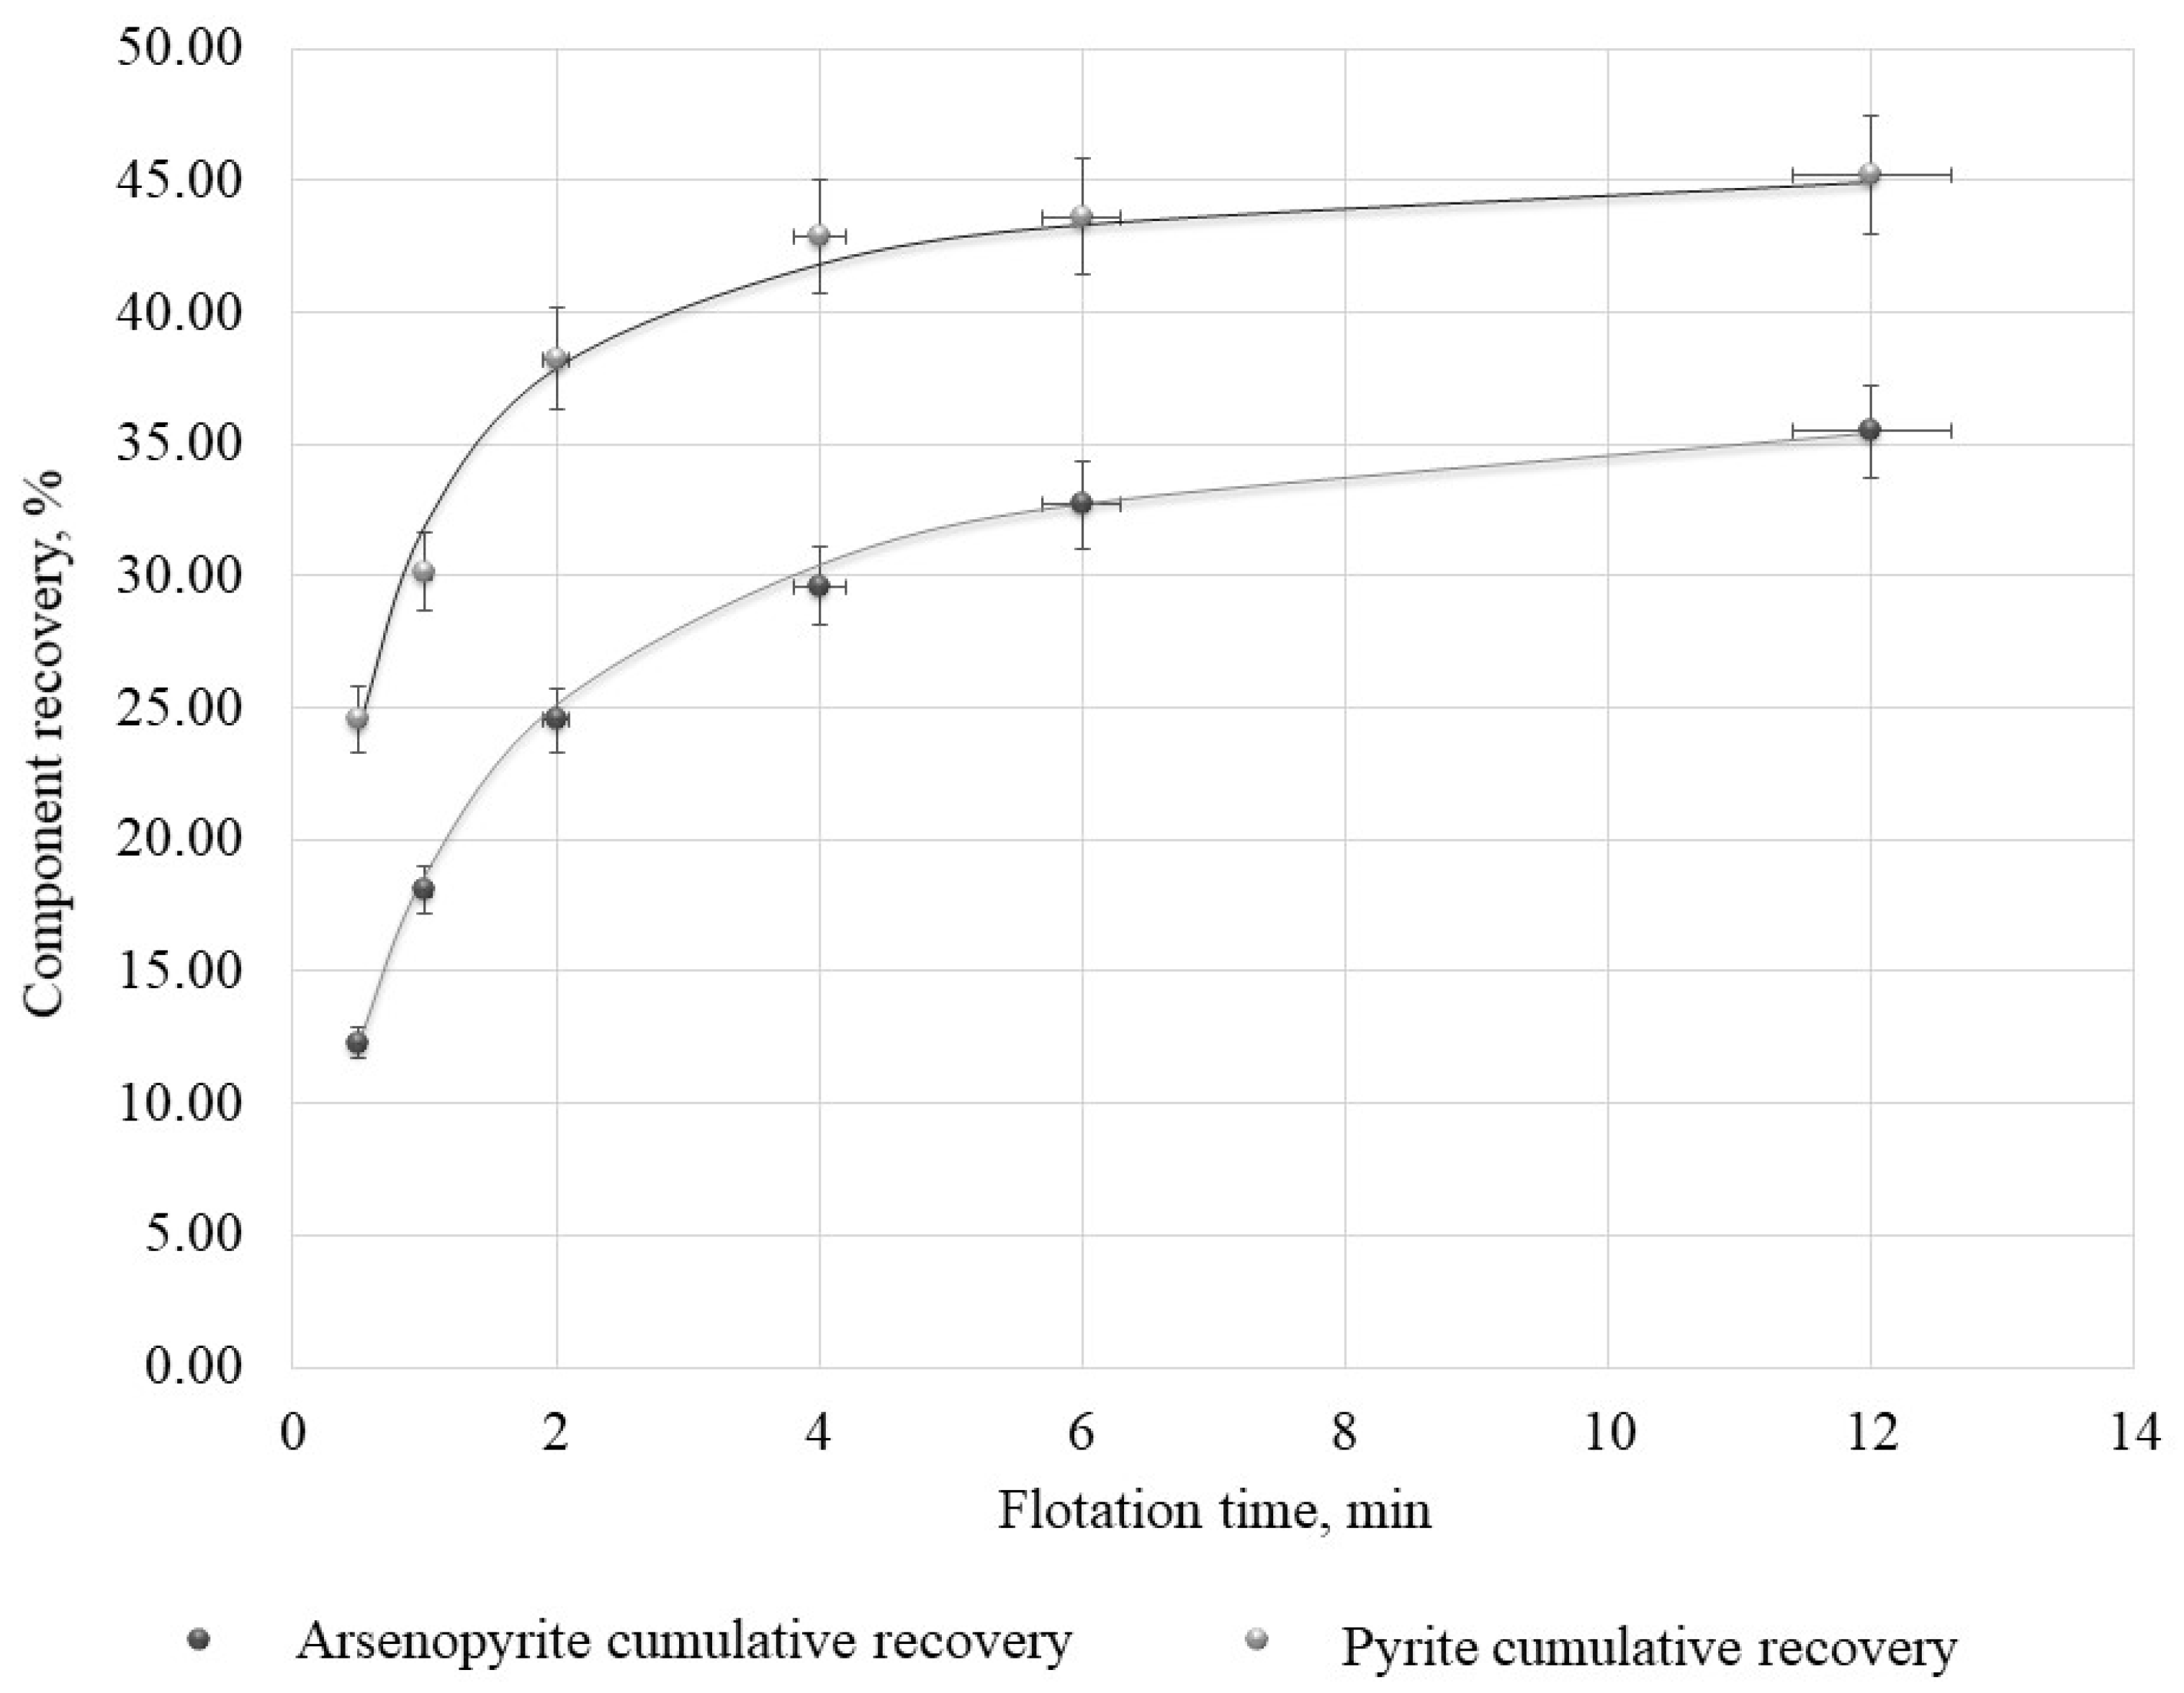
The kinetics study results of the flotation process are presented in
Table 2. A graphical interpretation is shown in
Figure 3,
Figure 4 and
Figure 5. The equation of the flotation process kinetics of the second order was used for a mathematical description of the obtained results. The equation has the form:
where:
—theoretical recovery limit,
k—flotation rate constant, min
−1,
t—flotation time, min.
On the basis of the obtained results, it was established that the maximum possible recovery of valuable components increases with the addition of sodium dibutyldithiophosphate (SBDTP) to the collectors mixture. This is likely caused by the growth of the hydrophobizing ability of the mixture, which allows us to recover mineral particles of pyrite and arsenopyrite with a lower degree of liberation into the froth product. For the second time interval, a lower value of the rate constant for arsenopyrite flotation compared to the flotation with potassium butyl xanthate (PNBX) was established. The recovery values for pyrite and arsenopyrite, established during a series of experiments of flotation without collectors, characterize the valuable component recovery in the foam product due to the mechanical removal and flotation of the maximum opened aggregates that are capable of flotation without the collector.
Based on the ratio, the values of flotation rate constants were established and the values of specific flotation rate constants for each factor were calculated. The results are presented in
Table 3.
For the dynamic simulation, a pneumomechanical flotation machine with one cell was selected. The characteristics of the flotation machine are presented in
Table 4.
The determining of the surface area bubble flux value was carried out on the basis of determining the size of bubbles in the process of air dispersion in the flotation machine chamber with the addition of a frother. The results of the calculations are presented in
Table 5.
The analysis of the results shows that the relative velocity of the rise of bubbles grows with an increasing air flow rate, which leads to an increase in the value of the specific aeration intensity. Additionally, there is a growth in the size of the bubbles, which is caused by an increase in the specific volume of air at the points of bubble formation. This leads to an increase in the capillary pressure inside the bubbles and, as a consequence, an increase in the stability of larger bubbles.
The values of the air flow rate and bubble diameters corresponding to the relative rate of bubble rise and the specific aeration intensity in laboratory experiments were established. The obtained values were taken as the initial values for calculating the component of the dependence of the flotation rate constant on the air flow rate.
Based on the systematization of the obtained data, the values of the general flotation rate constants for different conditions were calculated. The values of constants for pyrite are summarized in
Table 6.
The values of constants for arsenopyrite are summarized in
Table 7.
4.1. Simulation Results
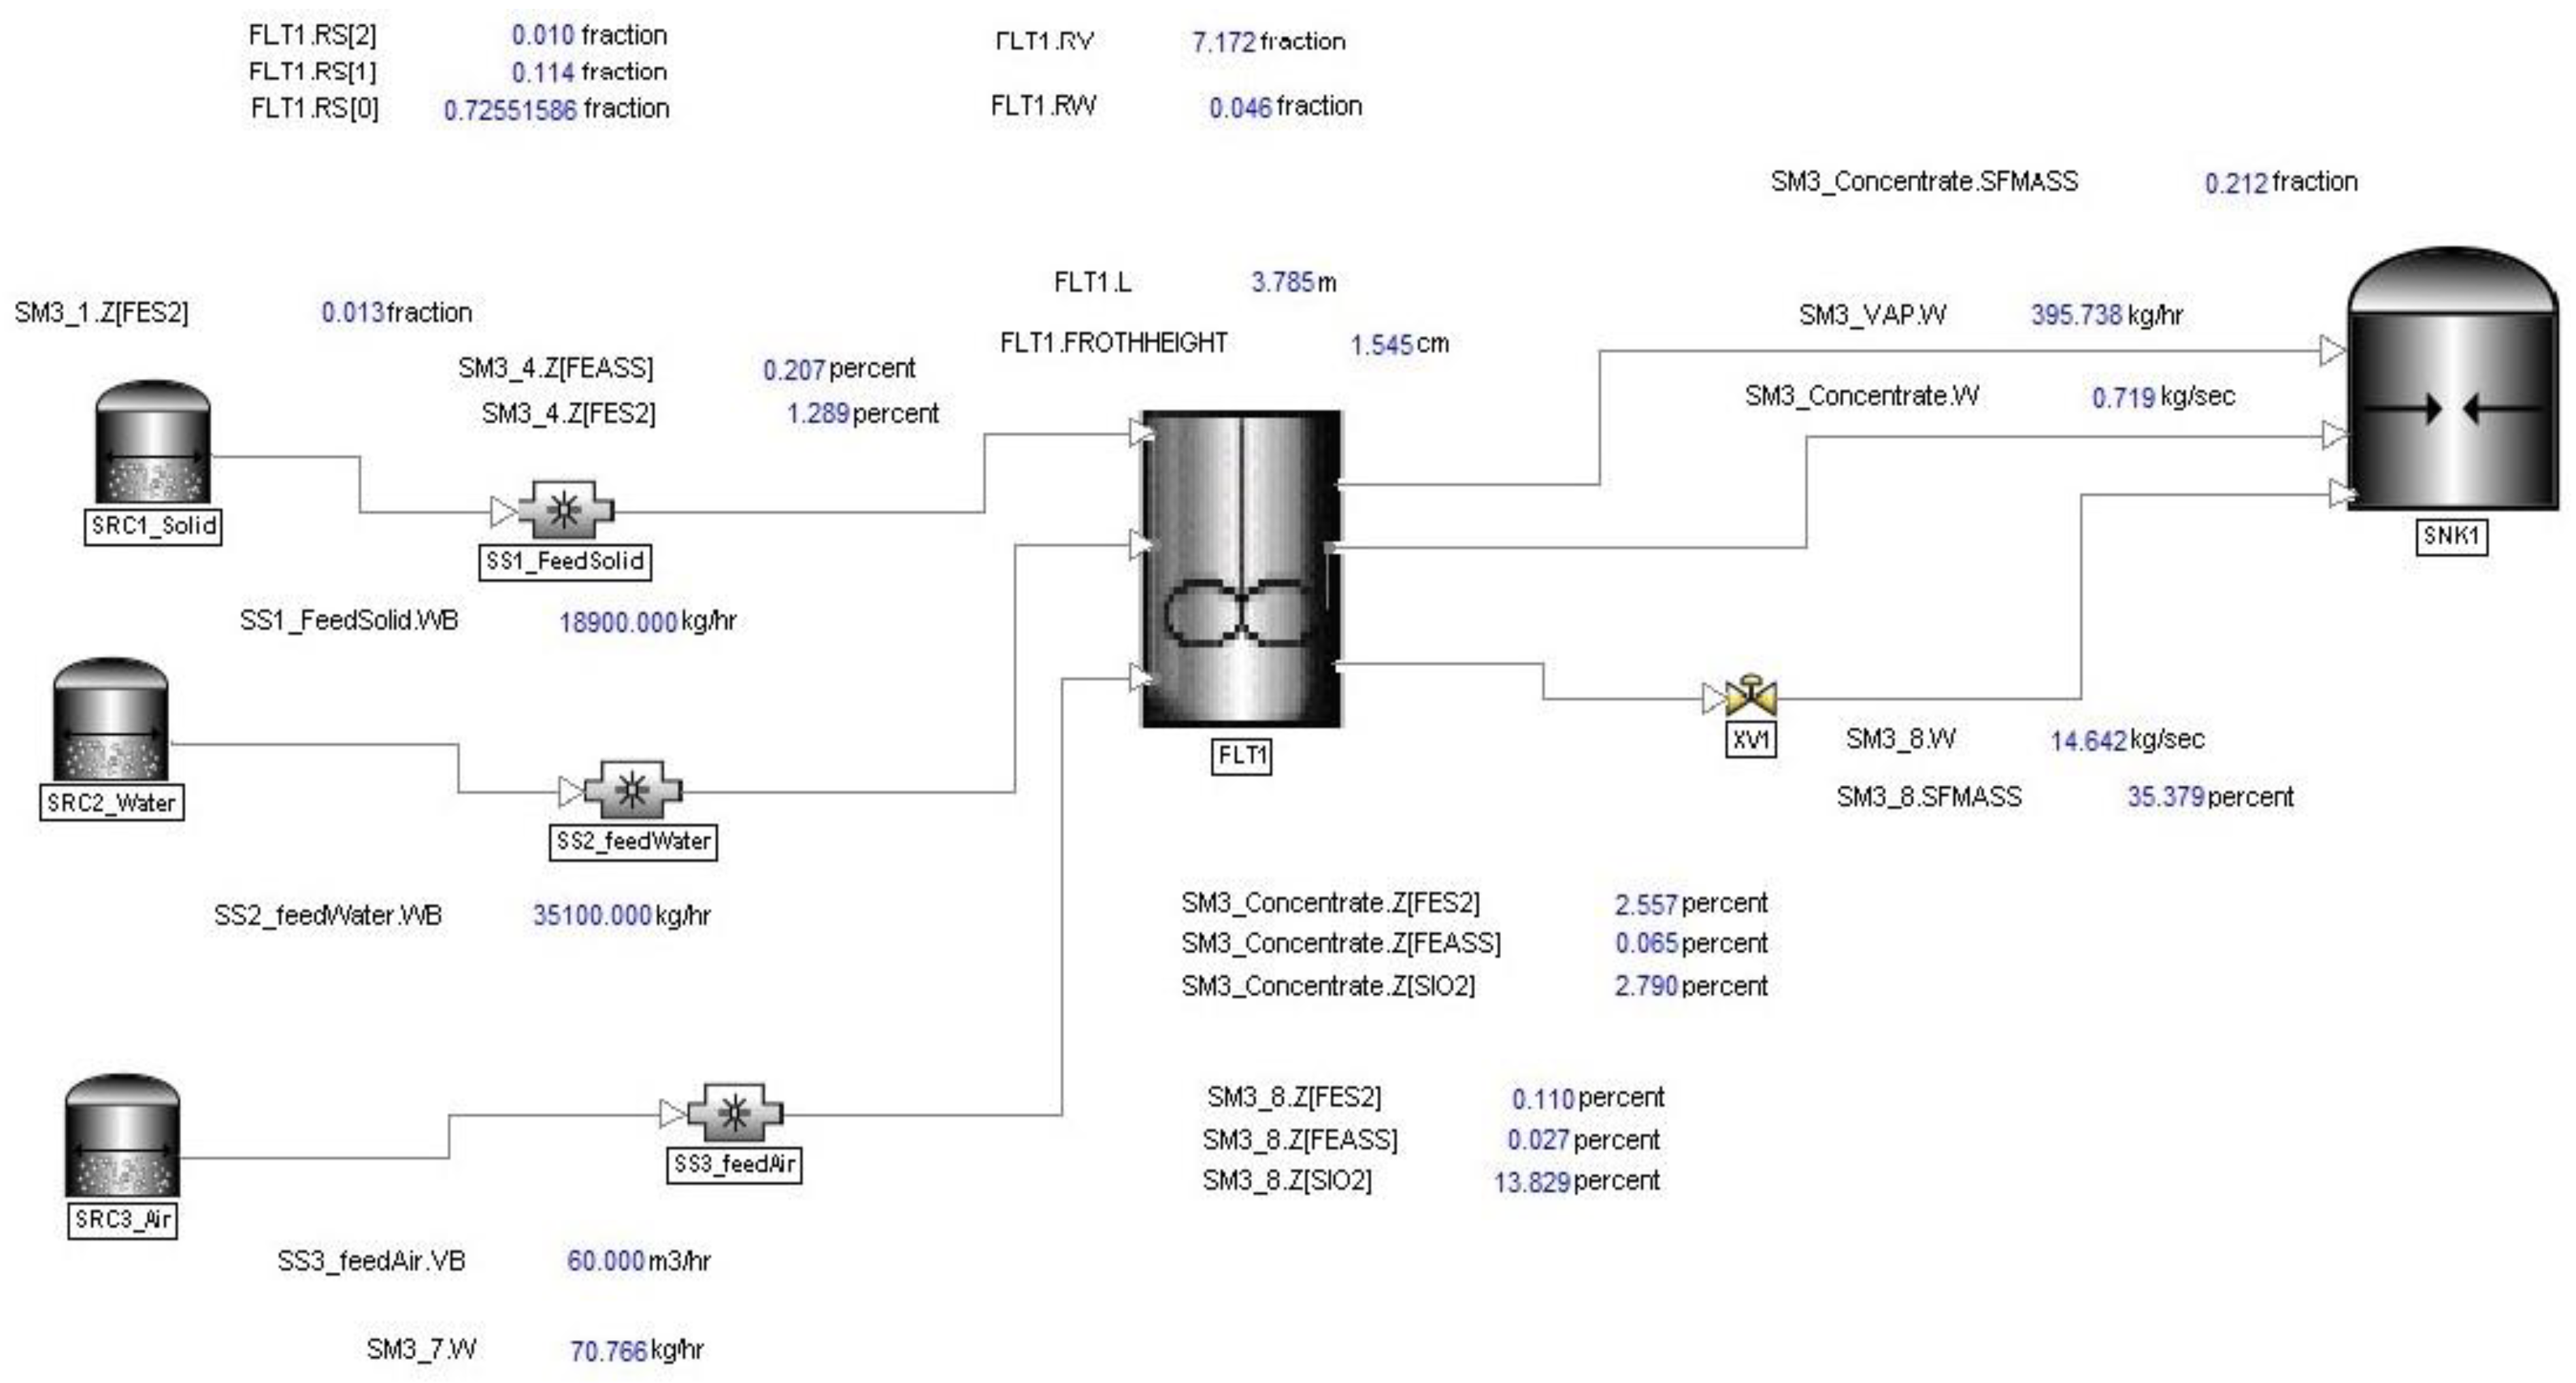
Based on the data obtained, the flotation enrichment process was simulated in the «AVEVA» software package (
Figure 6).
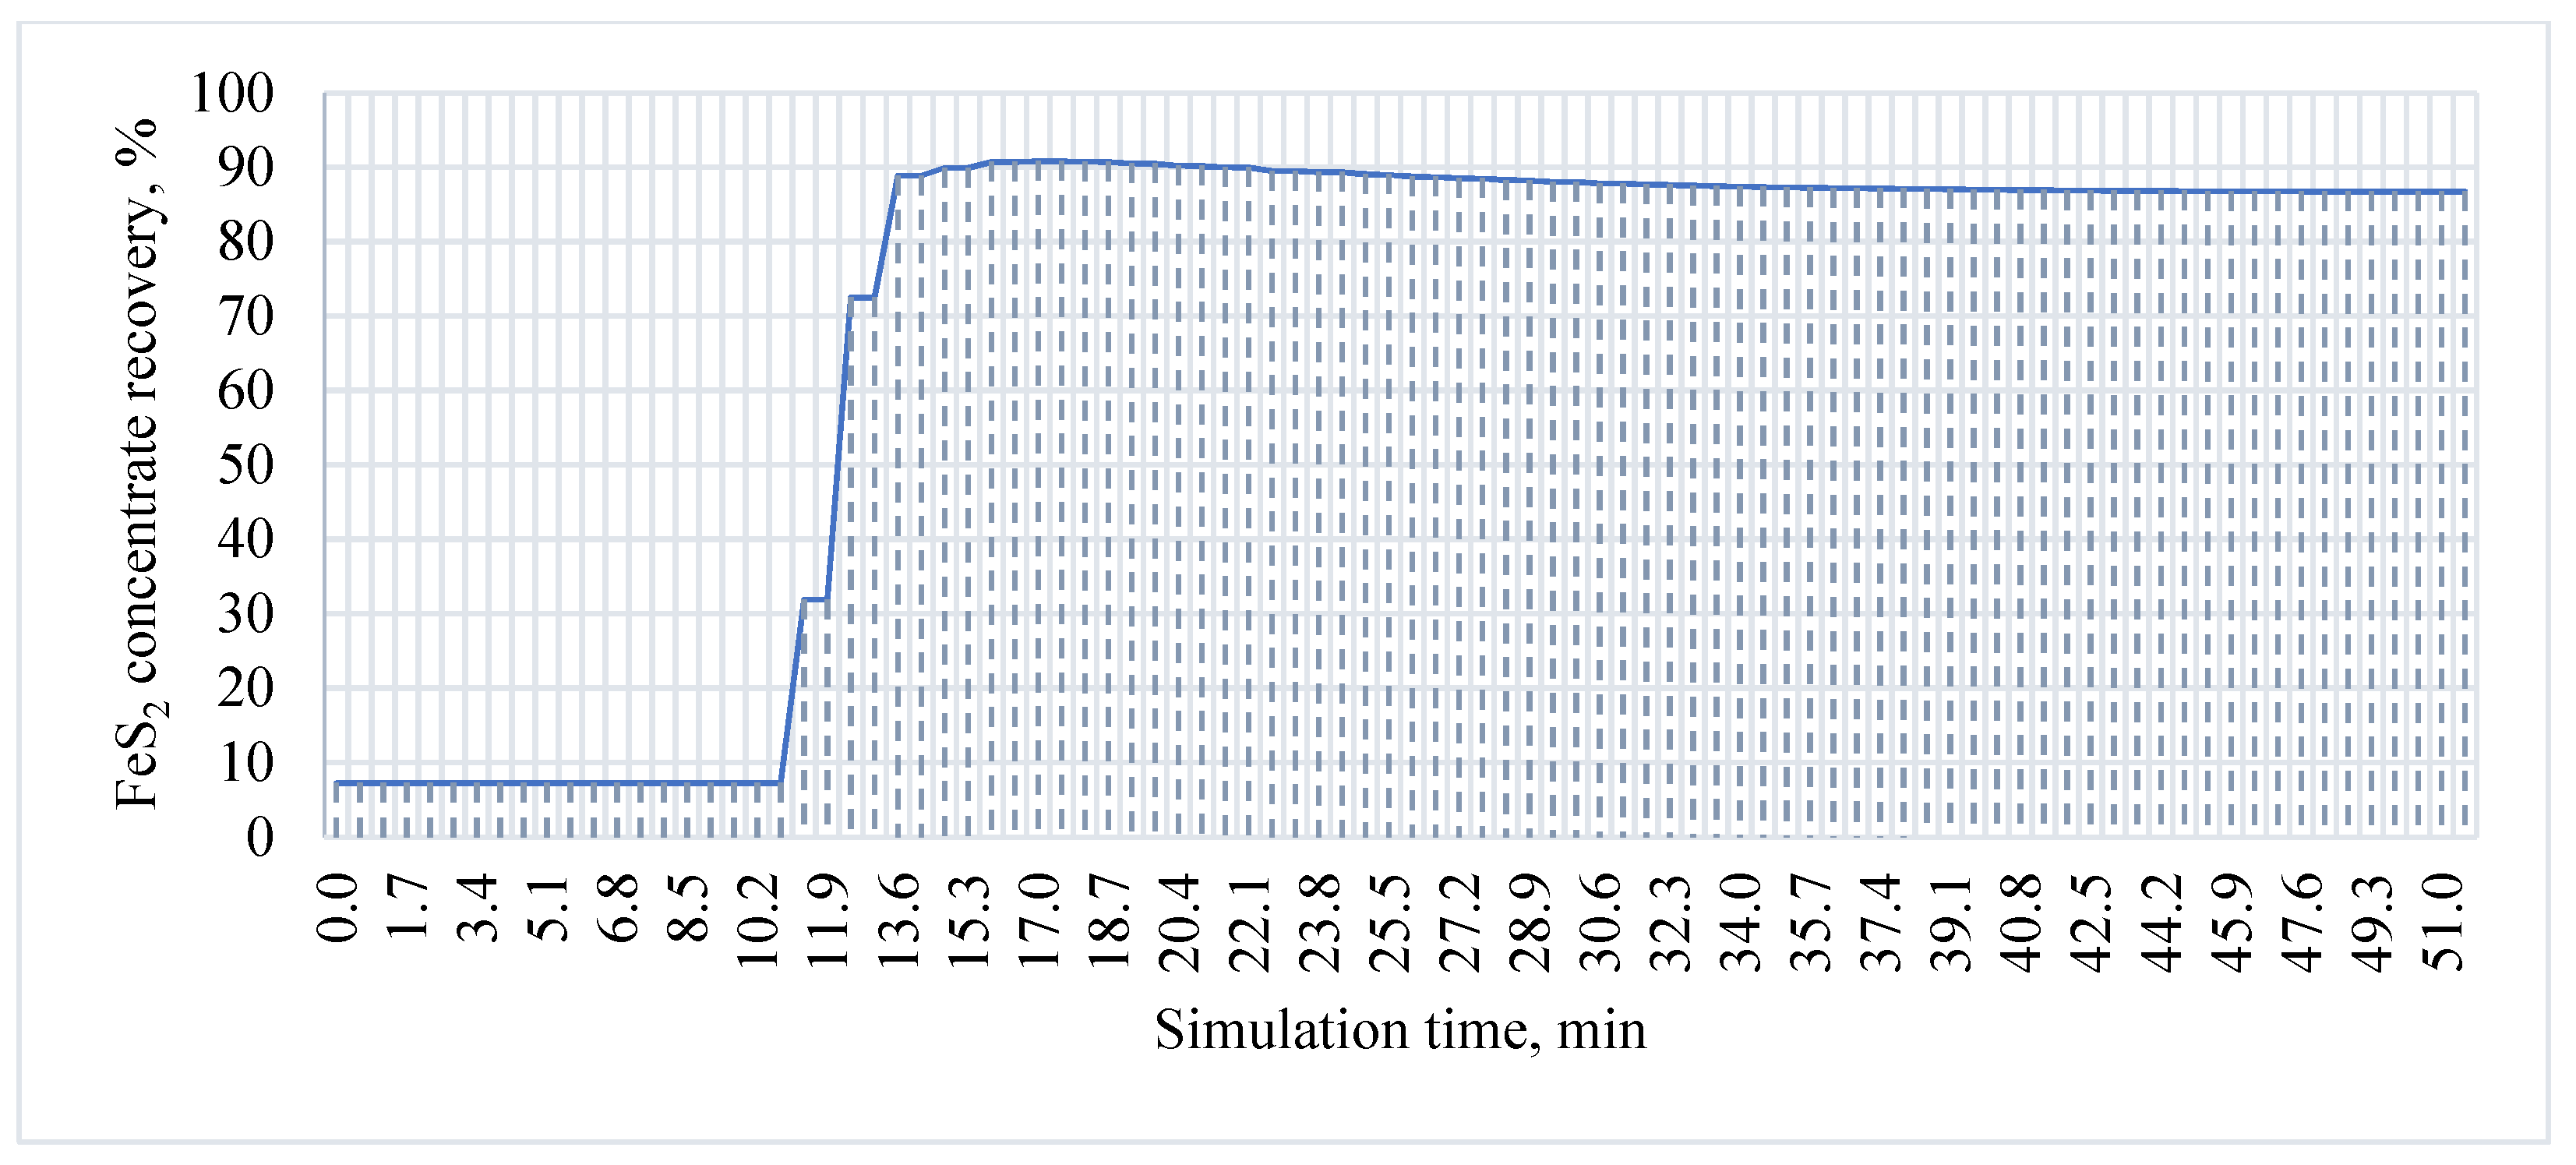
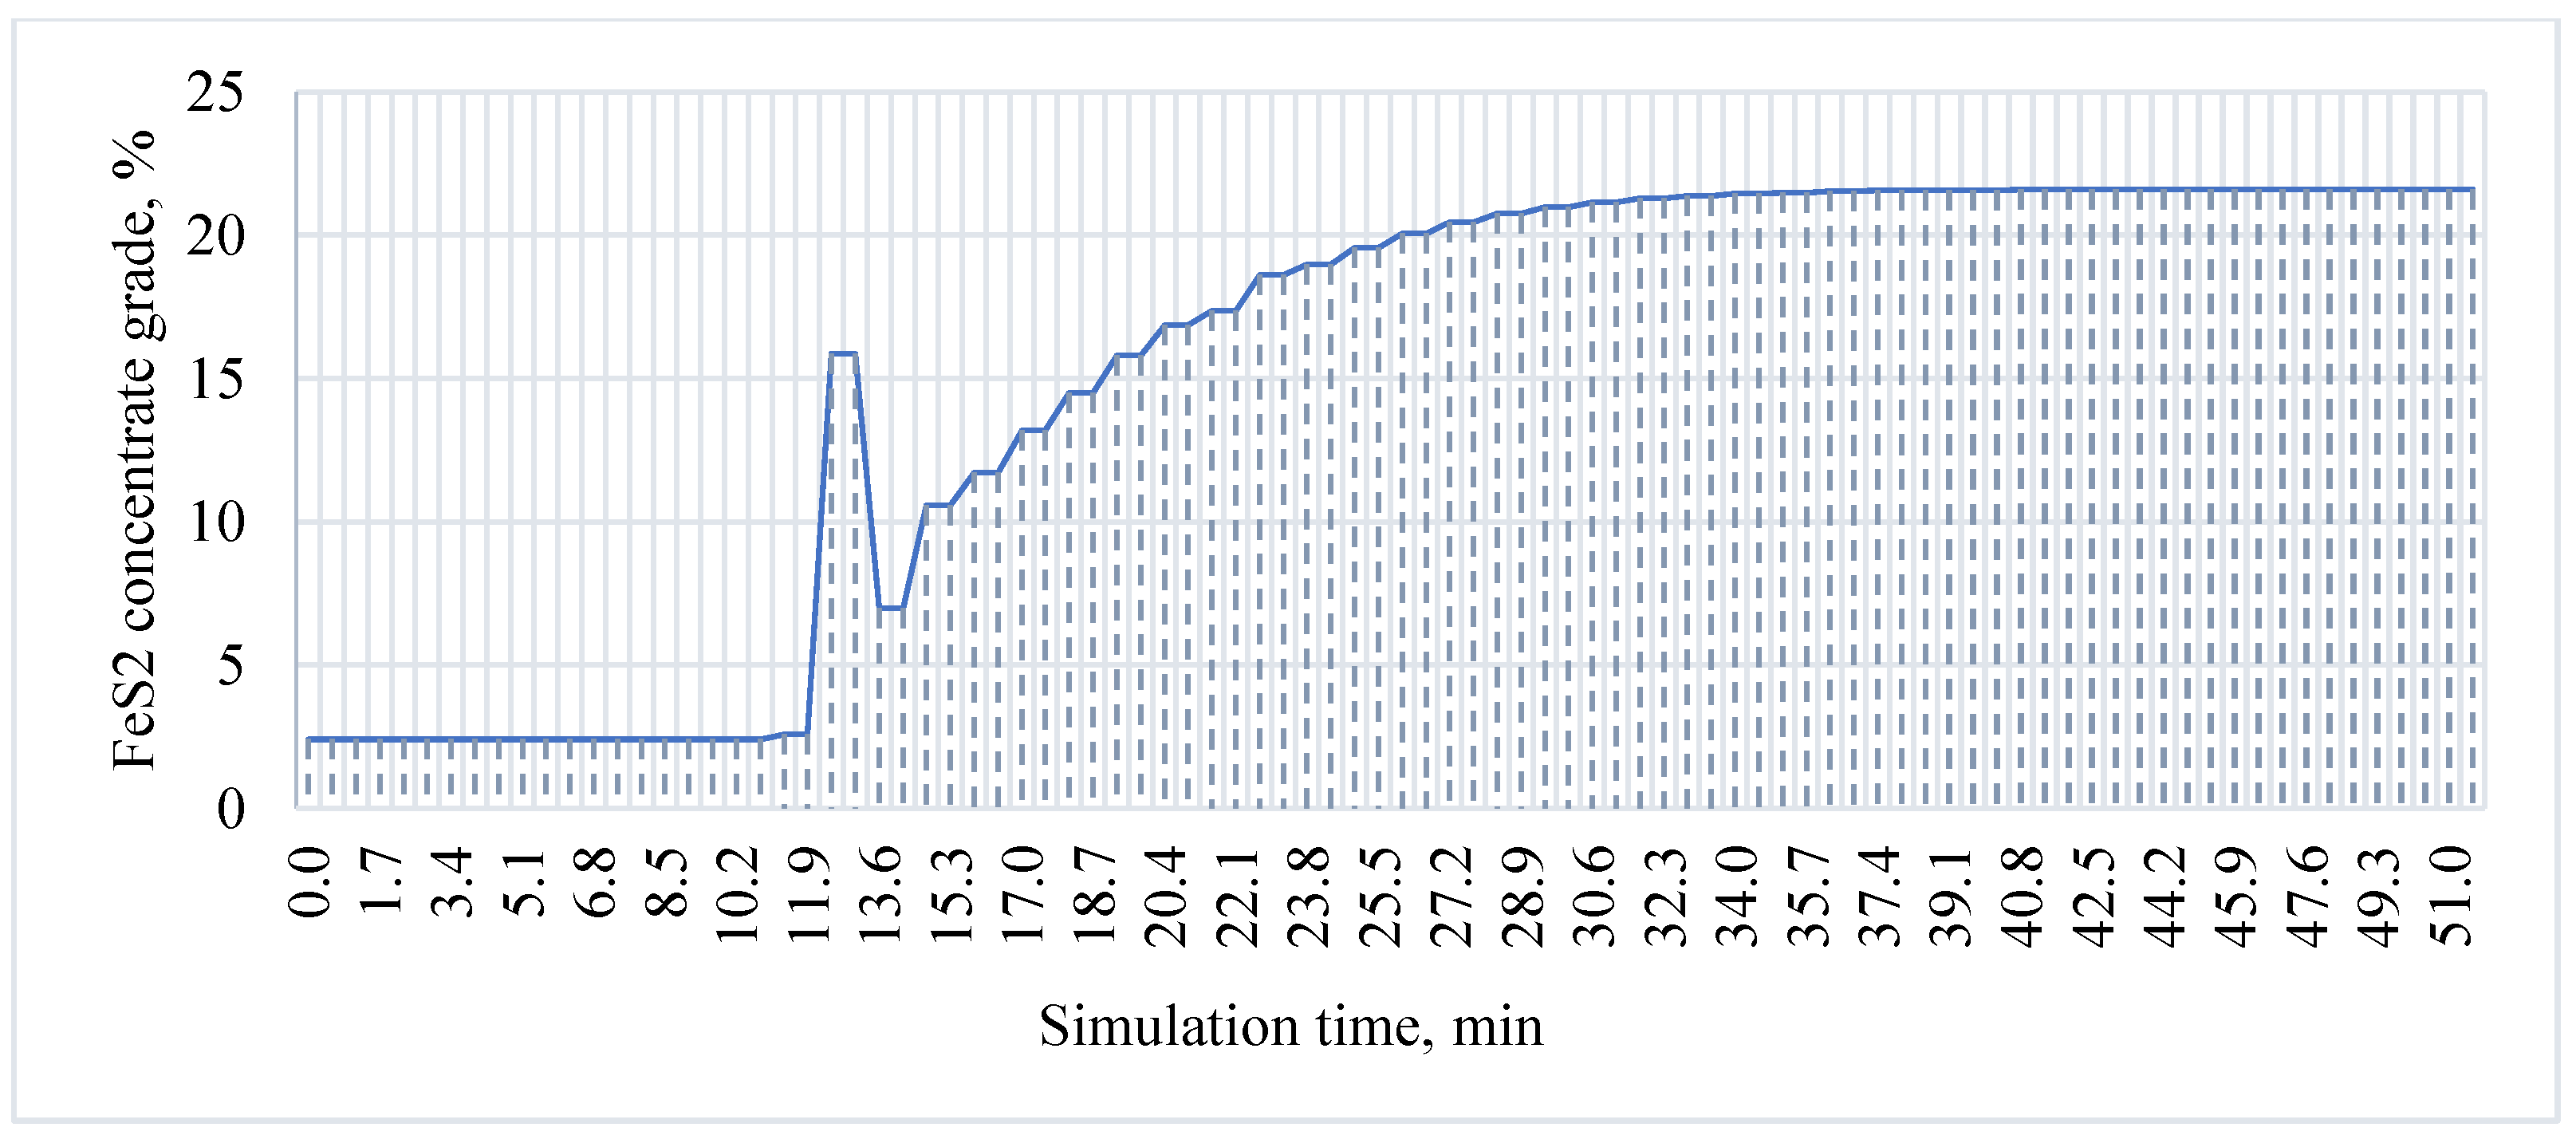
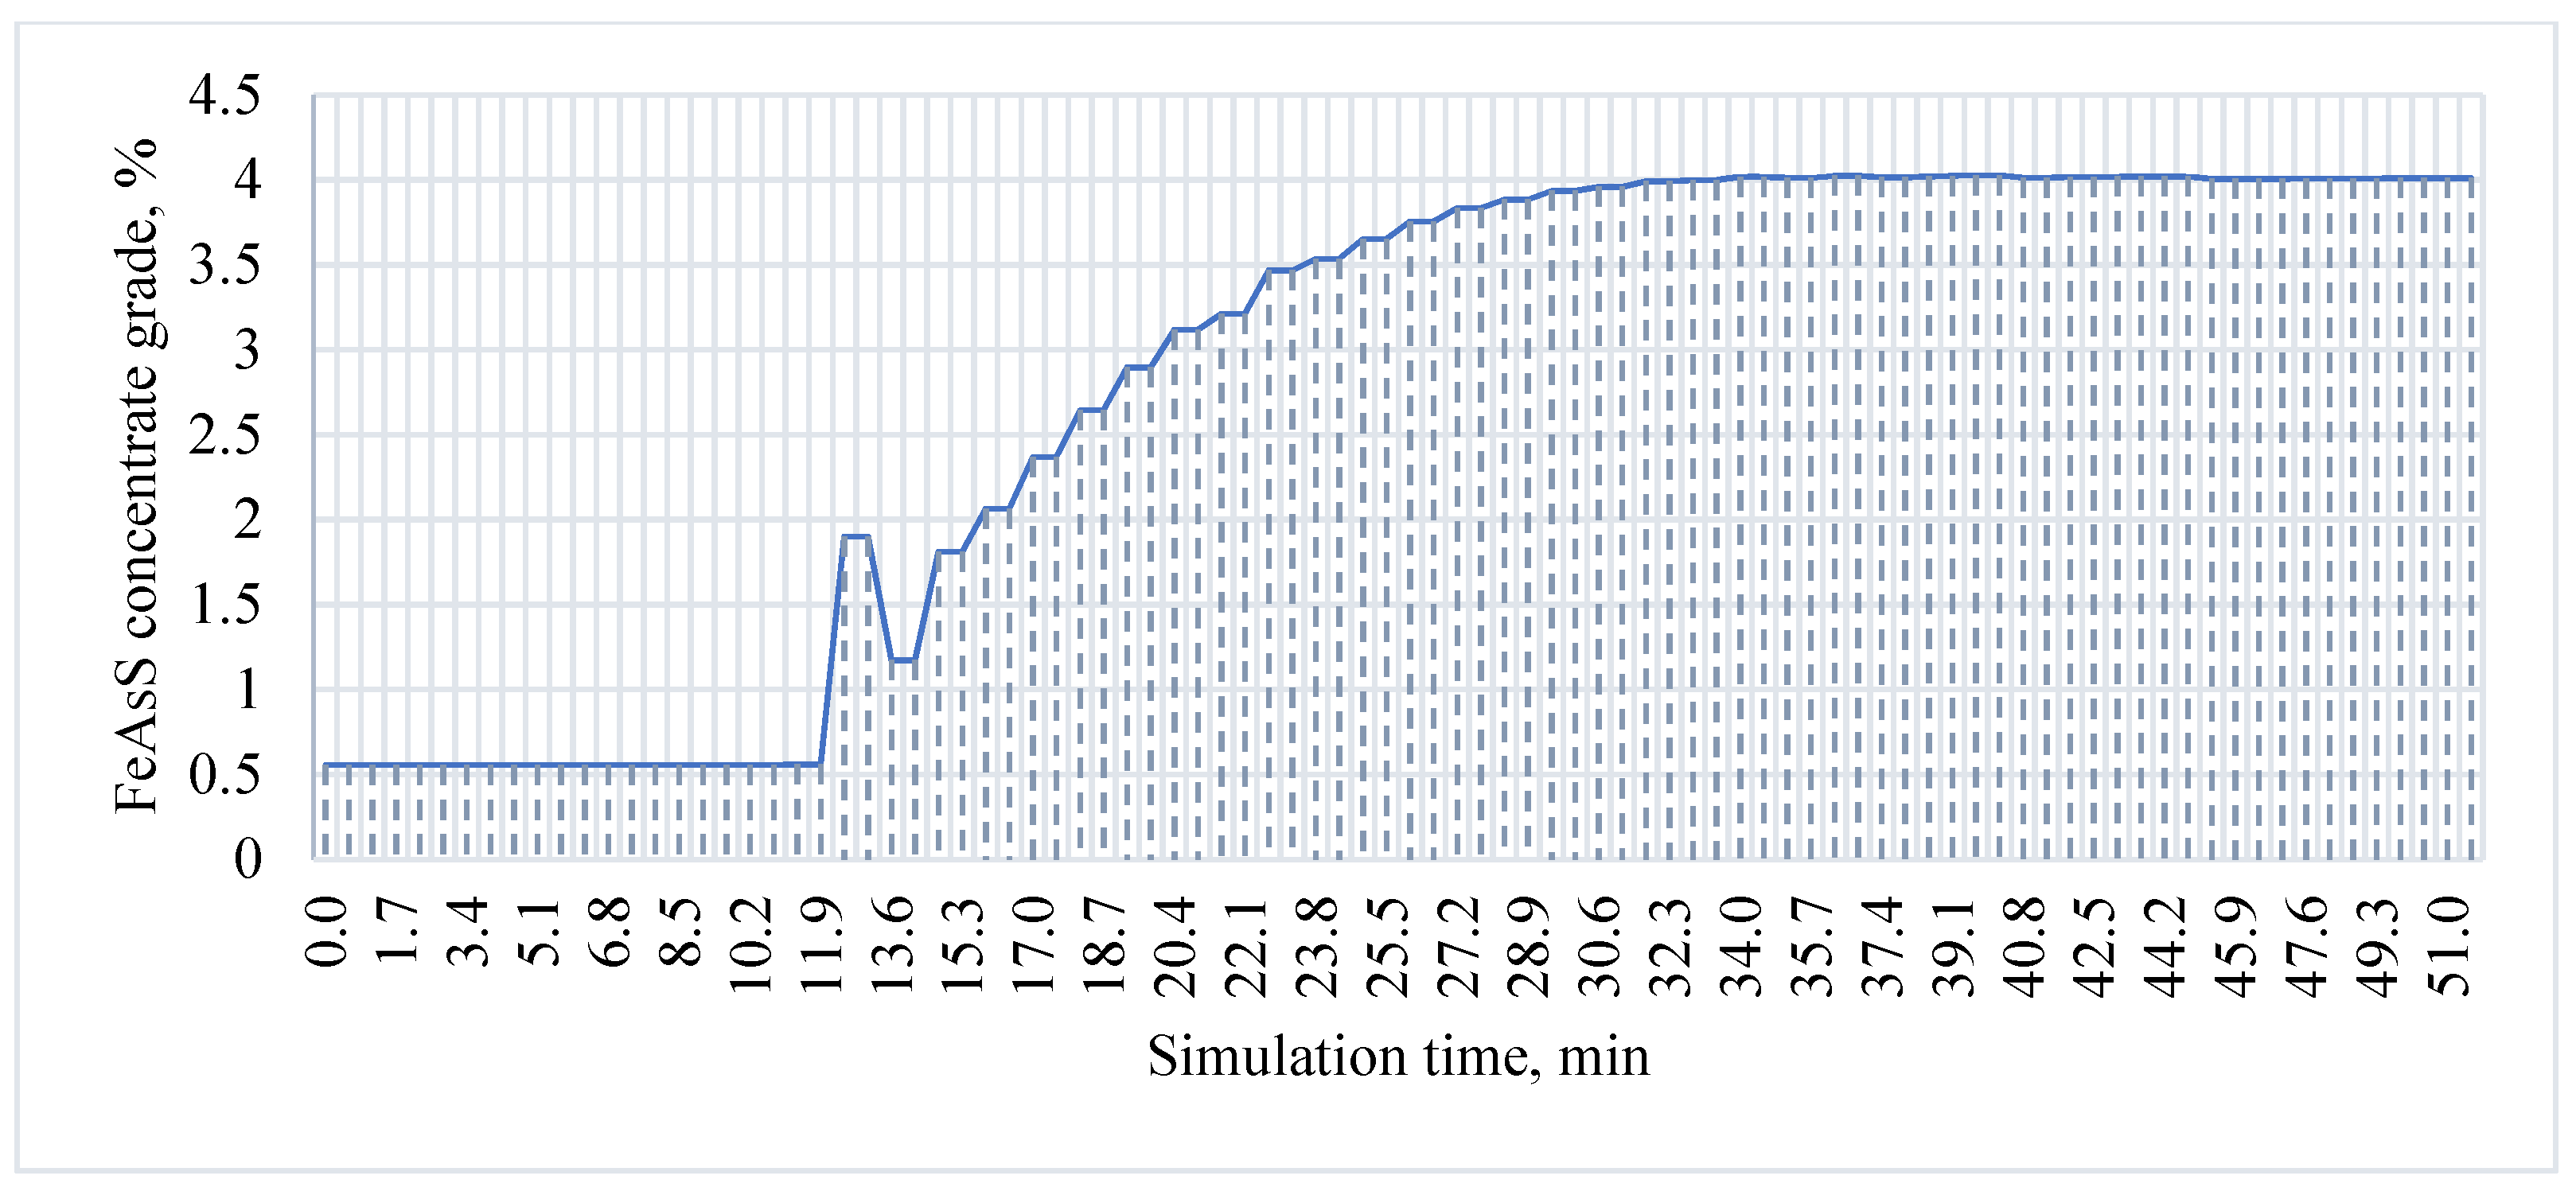
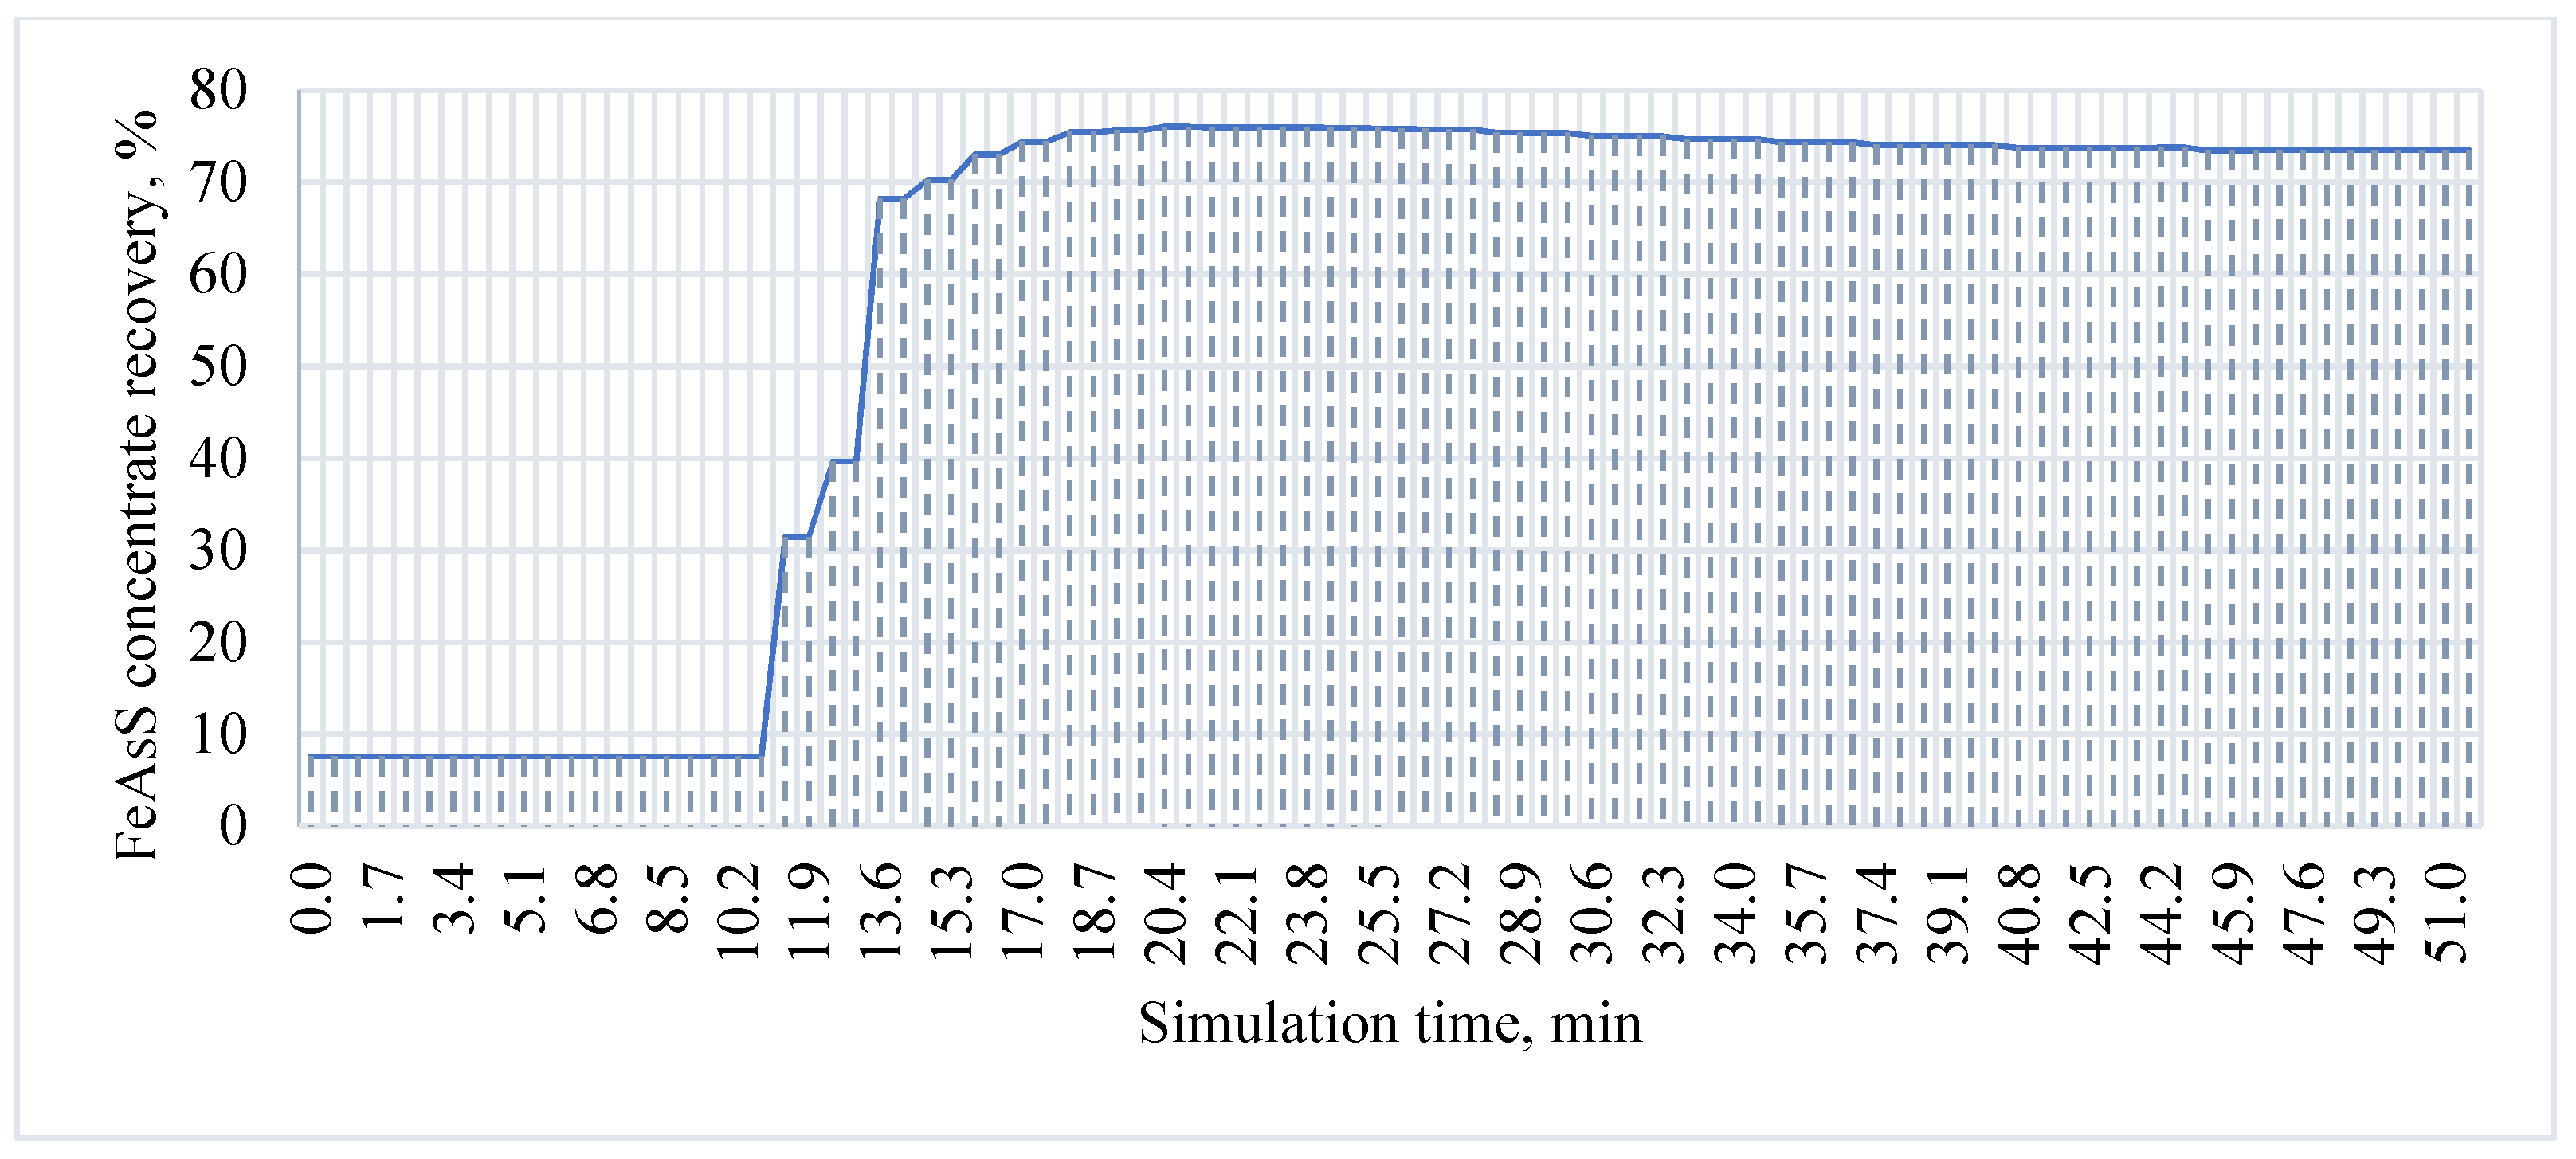
At the first stage, the simulation of the process output to the static mode of operation was performed. The main fixed parameters were the foam bed height, concentrate productivity and extraction and content of pyrite and arsenopyrite in the concentrate. A graphical interpretation of the obtained results is presented in
Figure 7,
Figure 8,
Figure 9 and
Figure 10.
The jump of technological indicators at 11.3 min is caused by the beginning of the air supply to the flotation cell and the formation of the froth layer. The contents of both components are characterized by a sharp increase at the stage from 11.3 to 13.6 min with a subsequent decrease. At the same time, the values of extractions systematically grow. This is caused by a sharp drop in the concentrate yield due to a high mineralization of the foam and its destruction. However, after the stage of the sharp decline, there is a stabilization of the foam layer and a gradual increase in the content and yield of the froth product. After the air supply, the flotation process reaches the stationary mode in 26.1 min of simulation time.
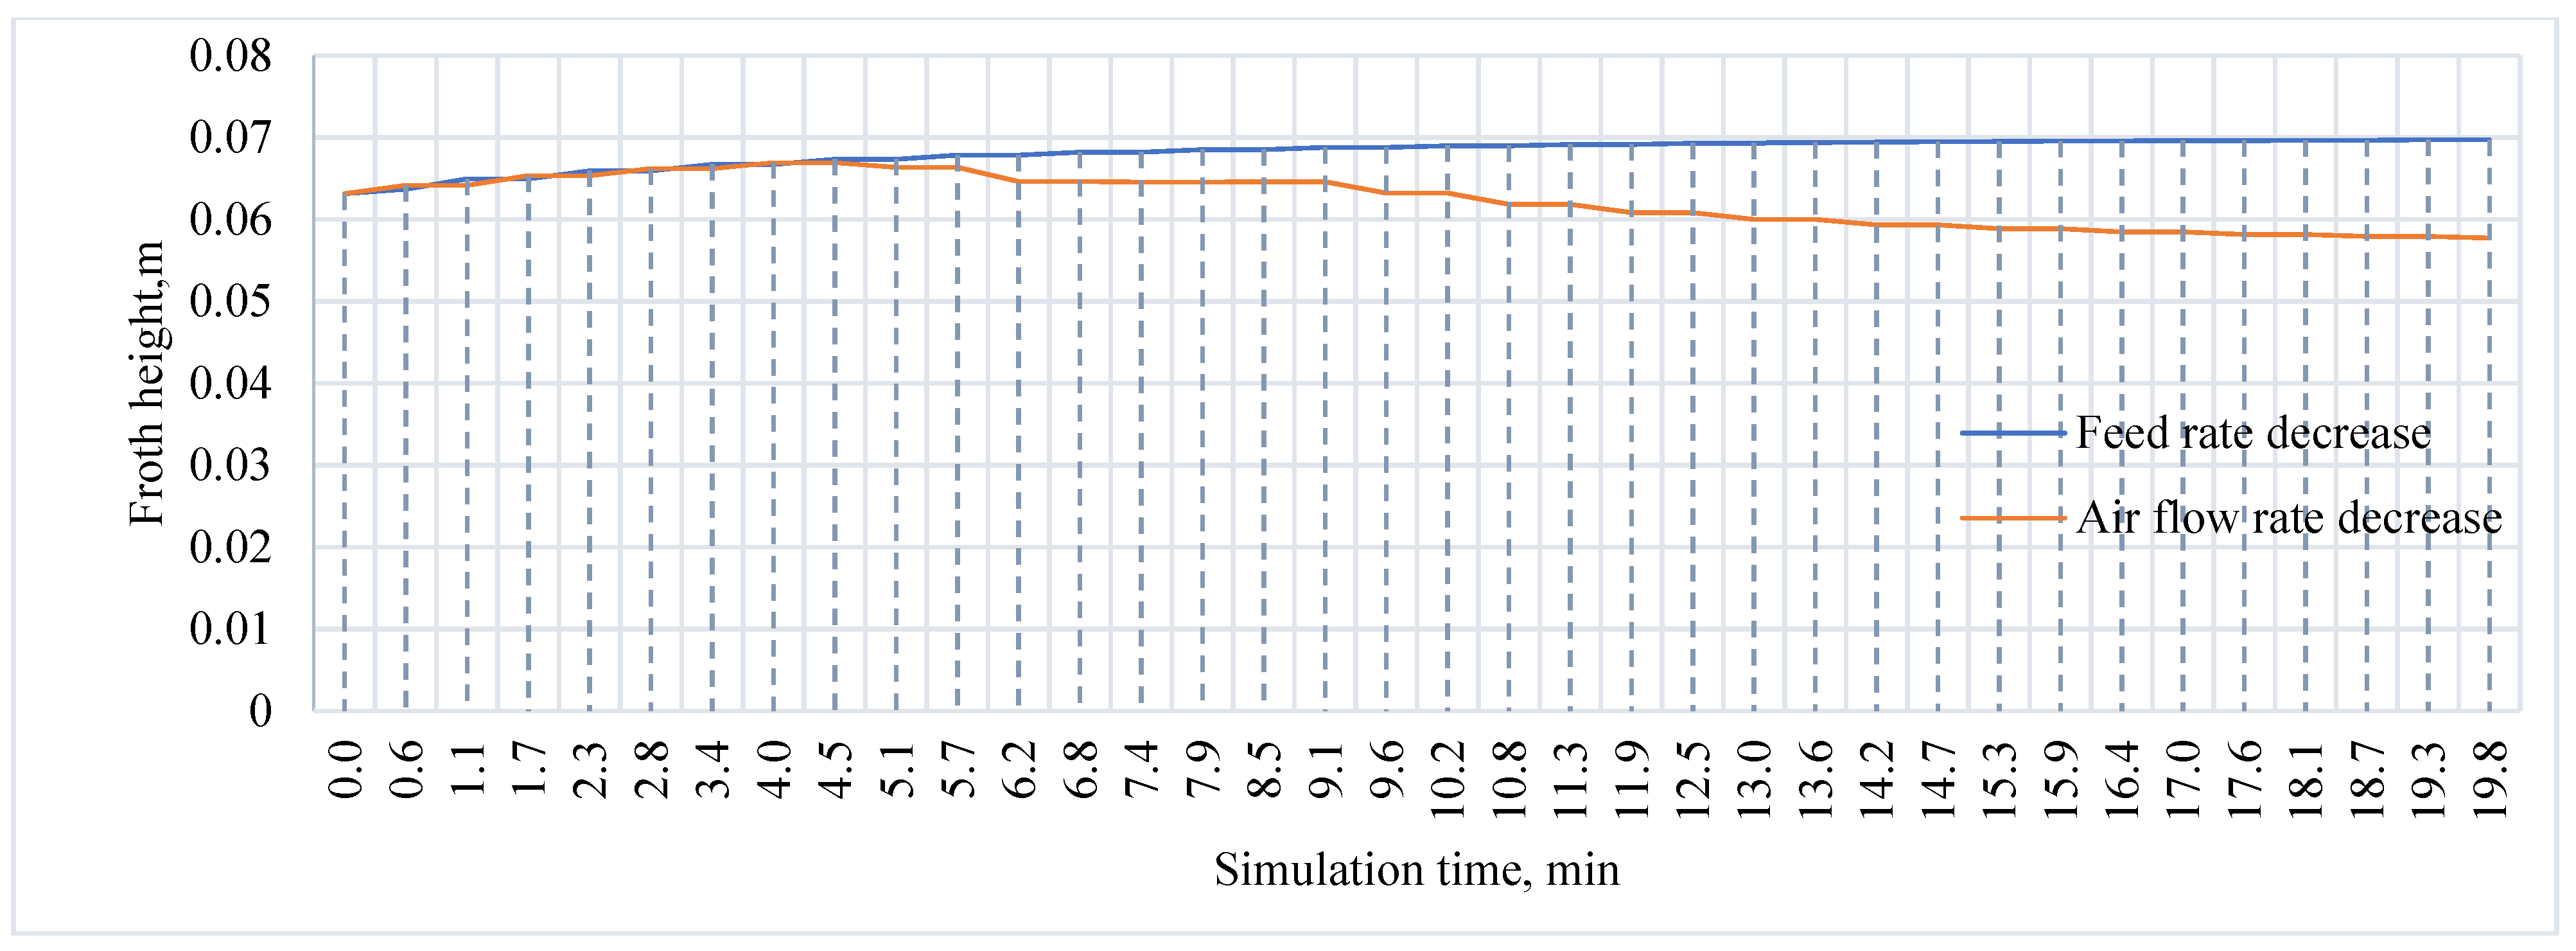
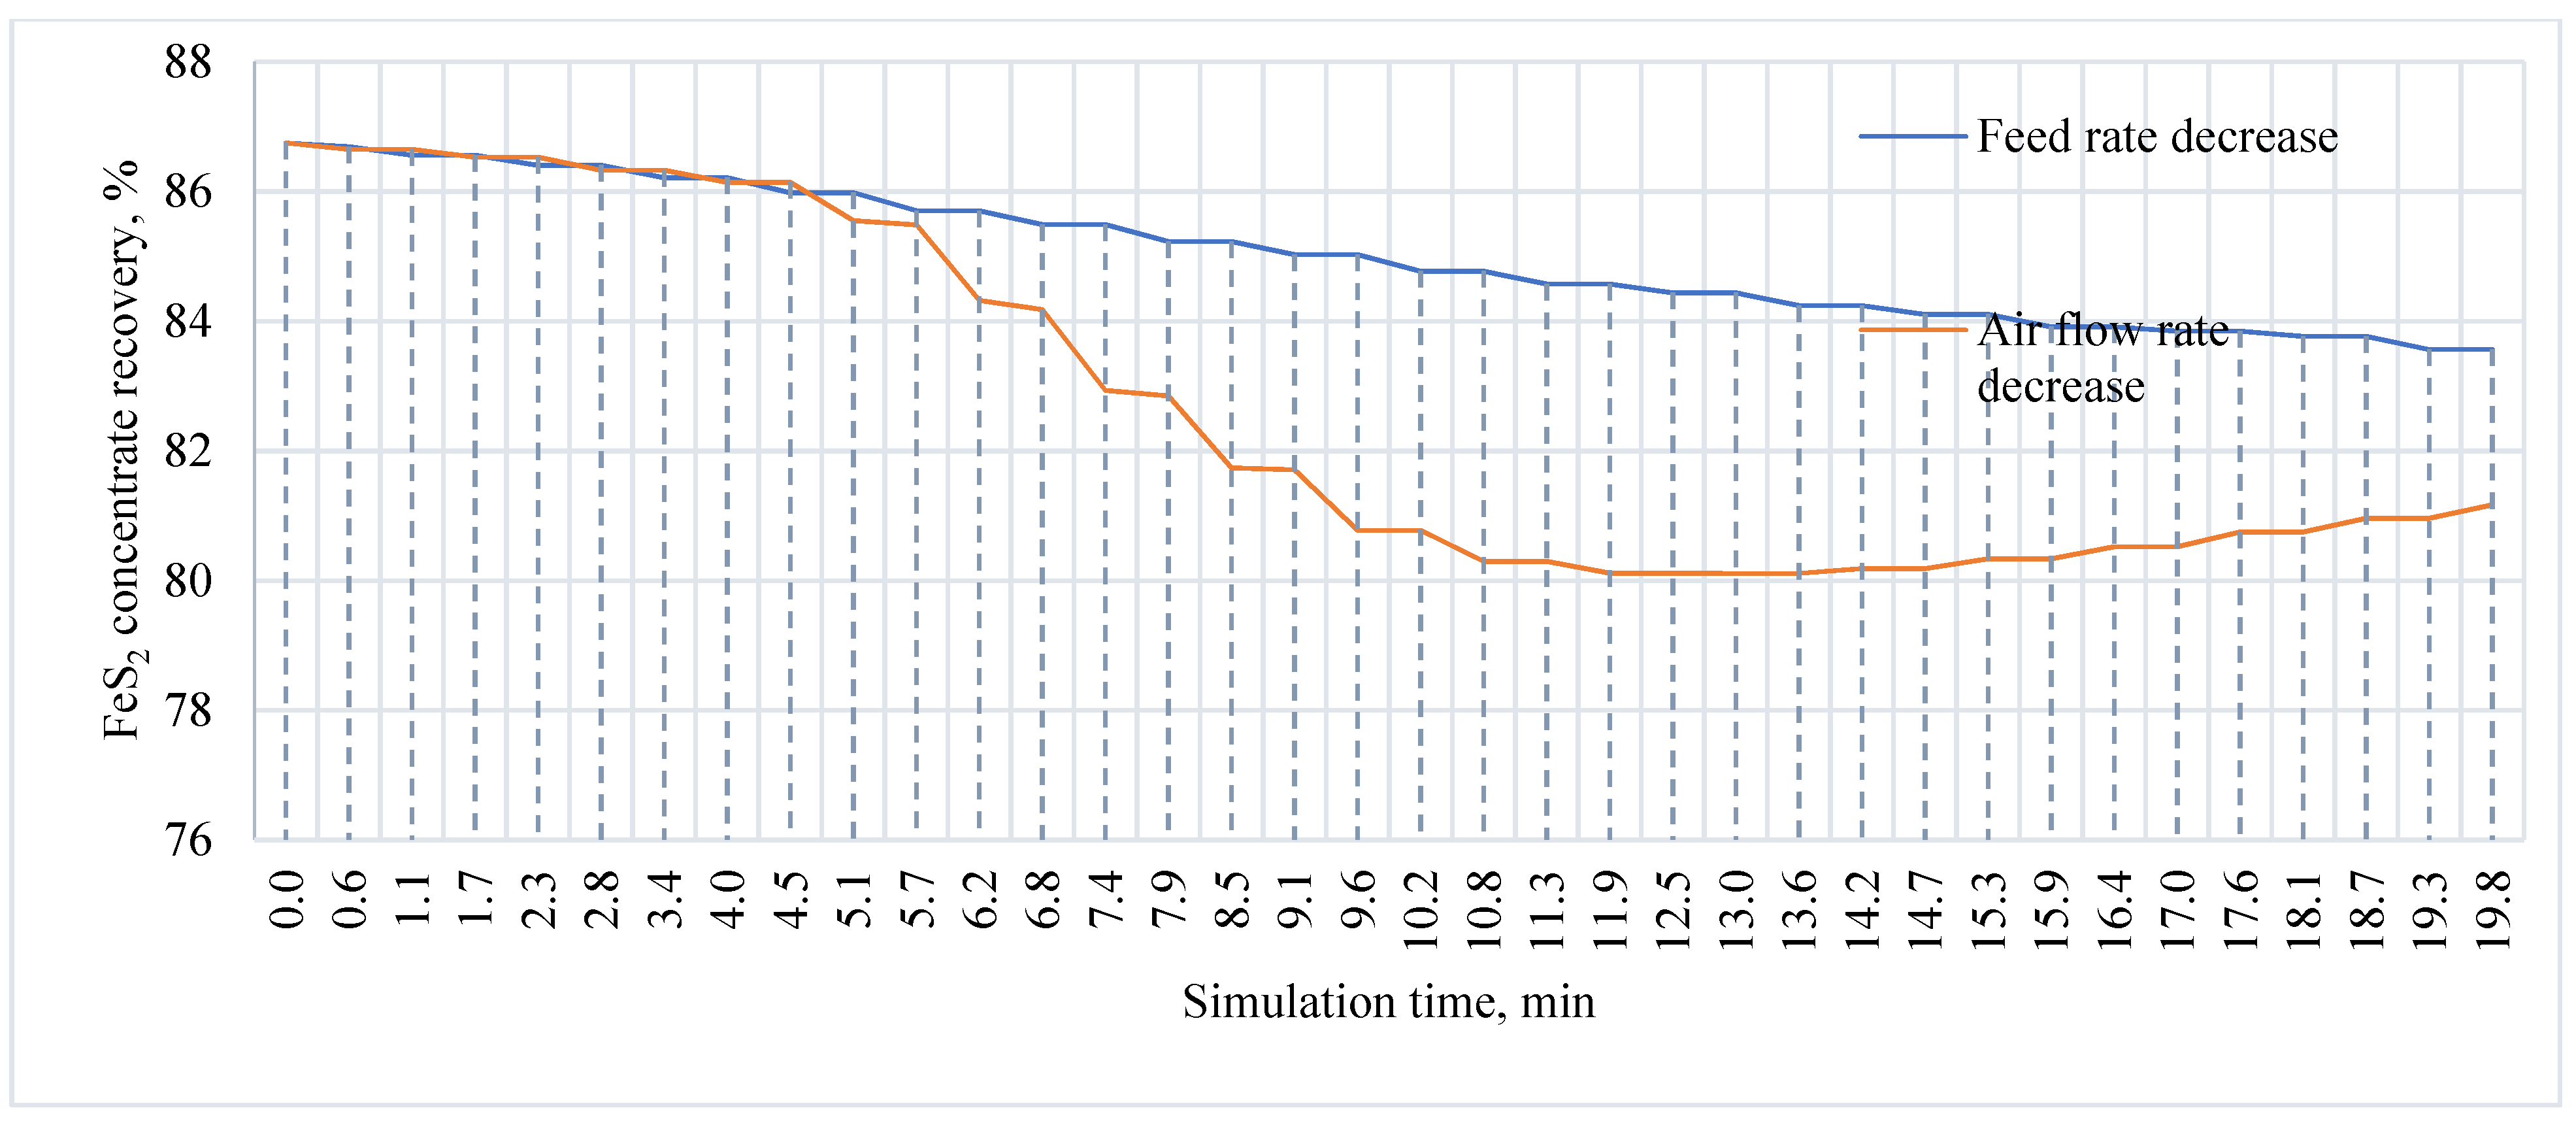
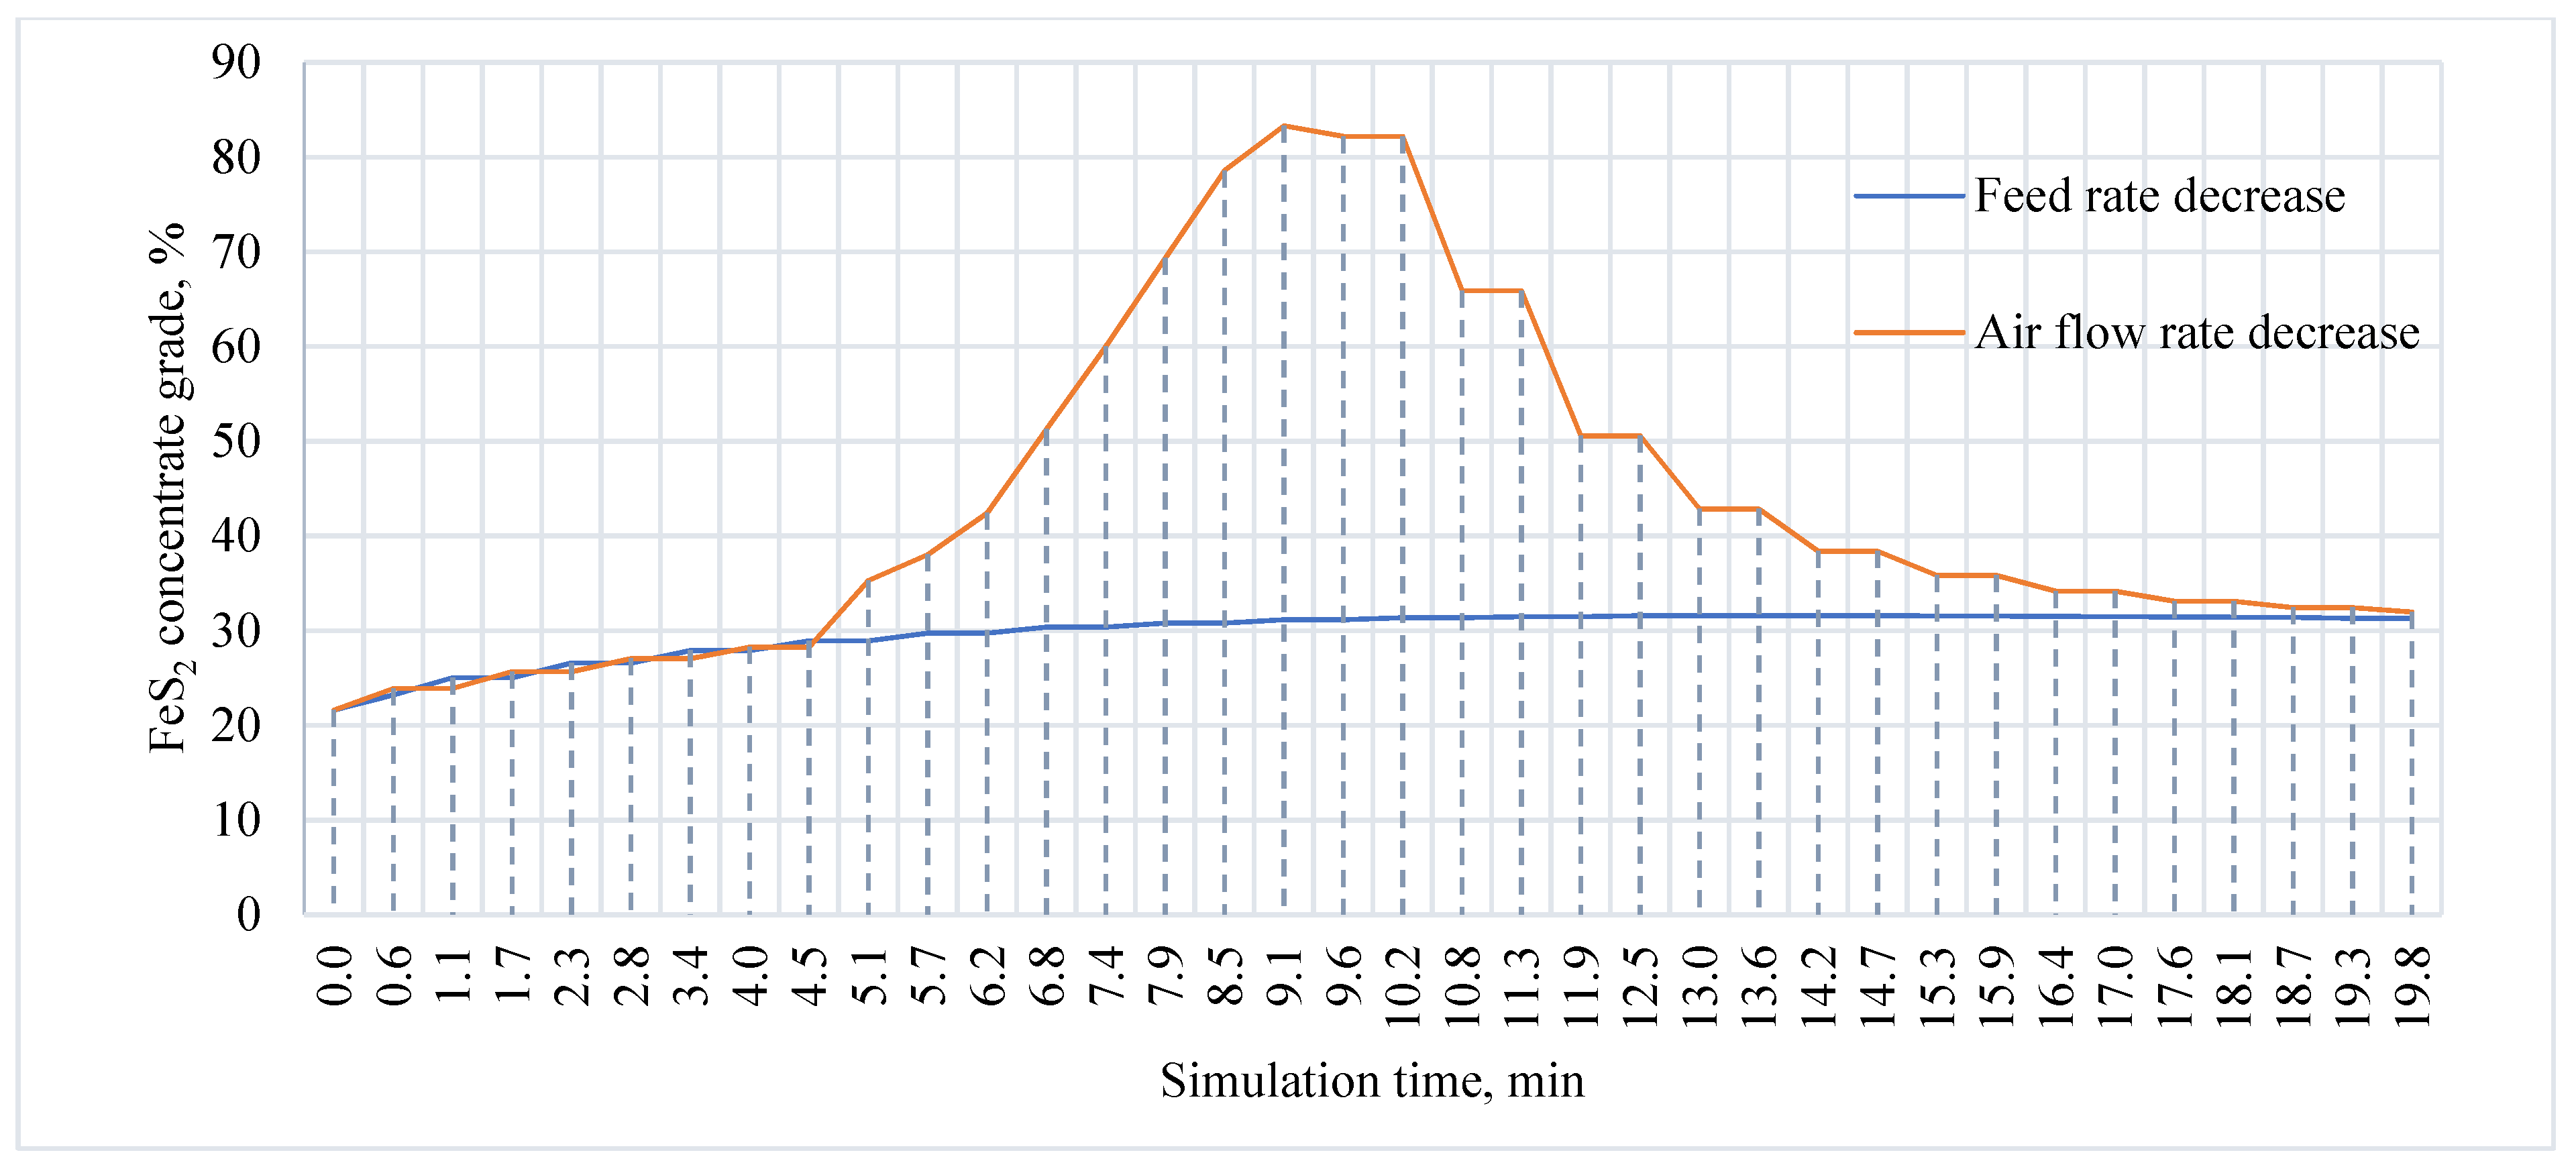
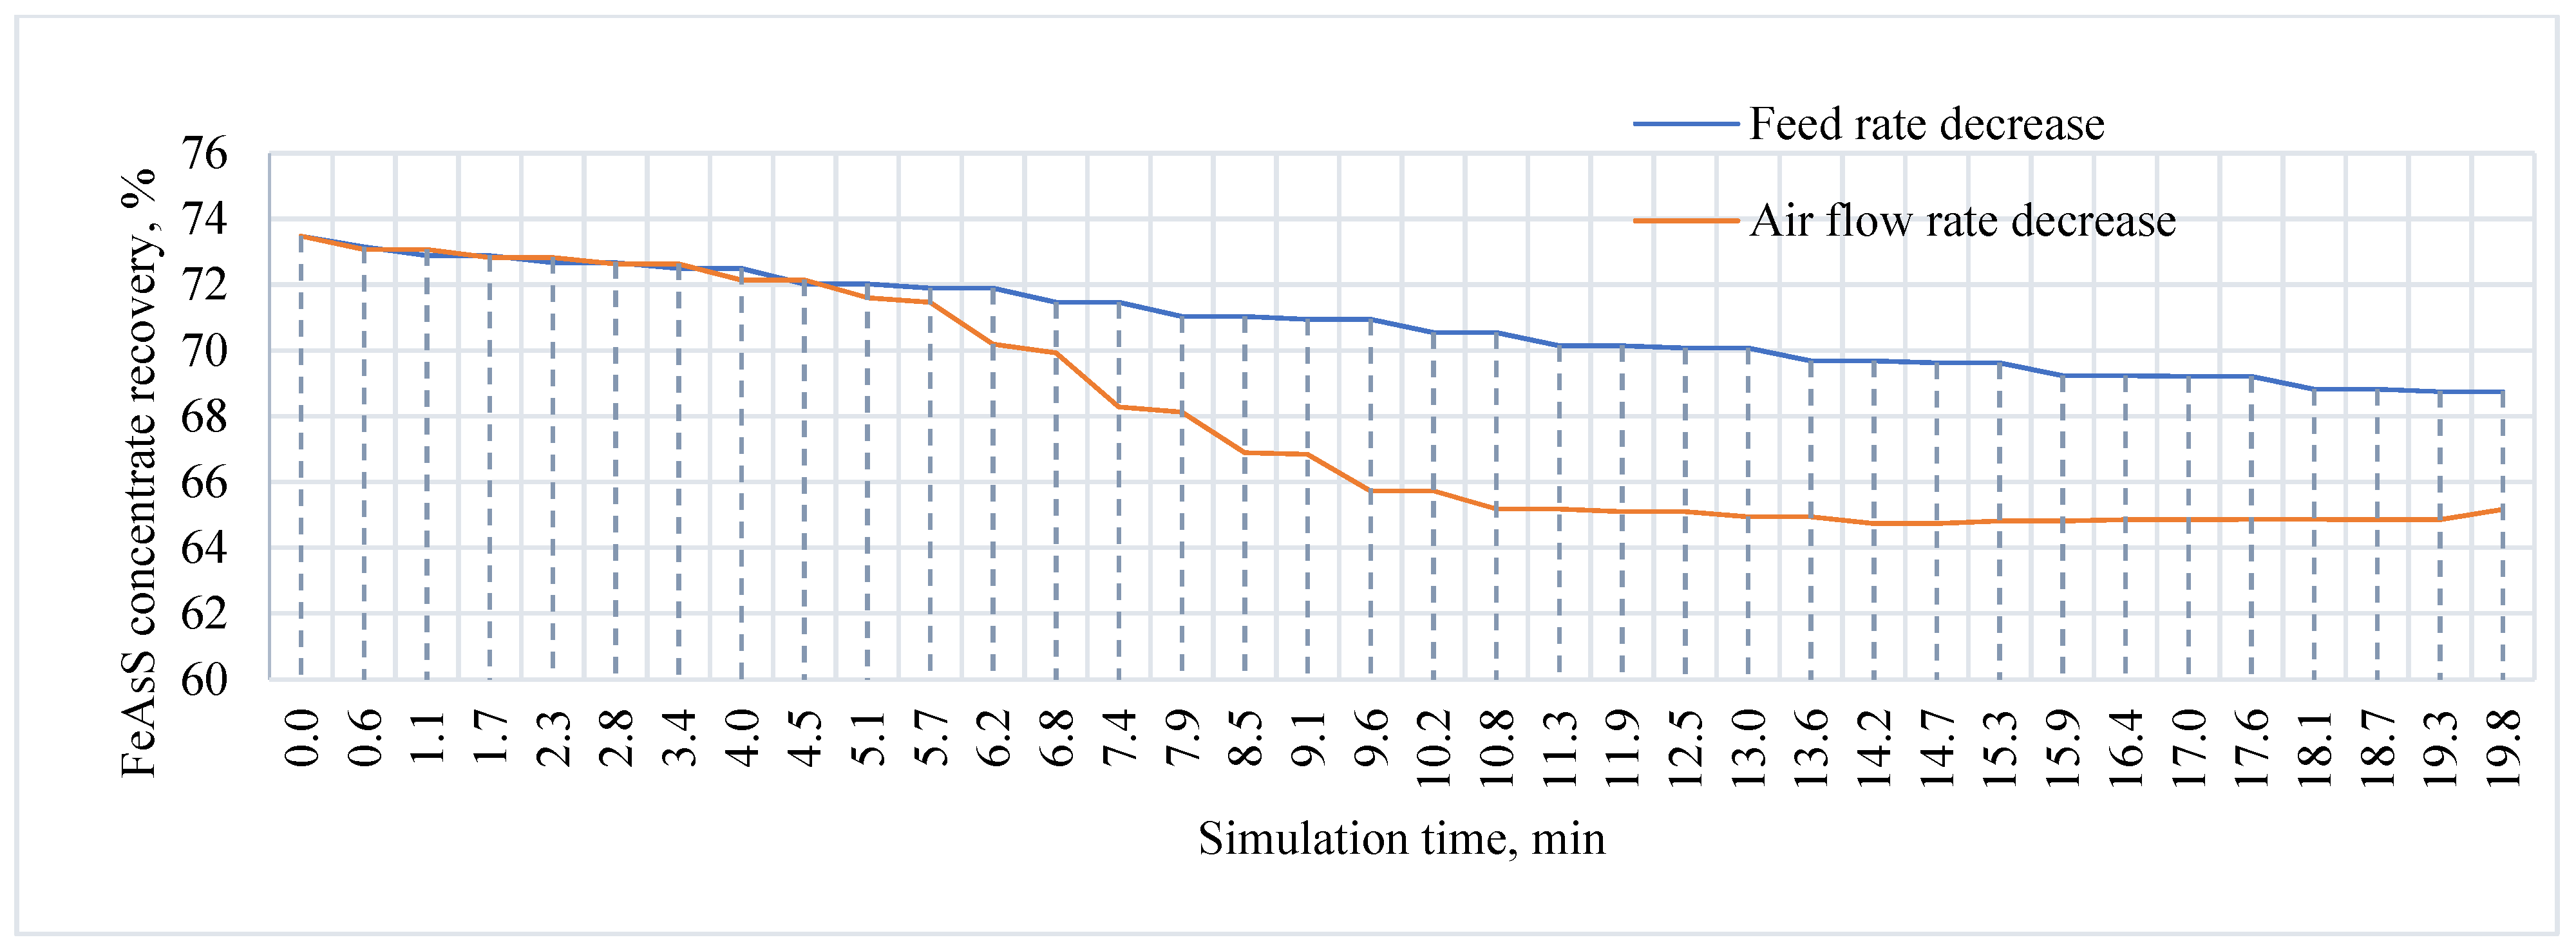
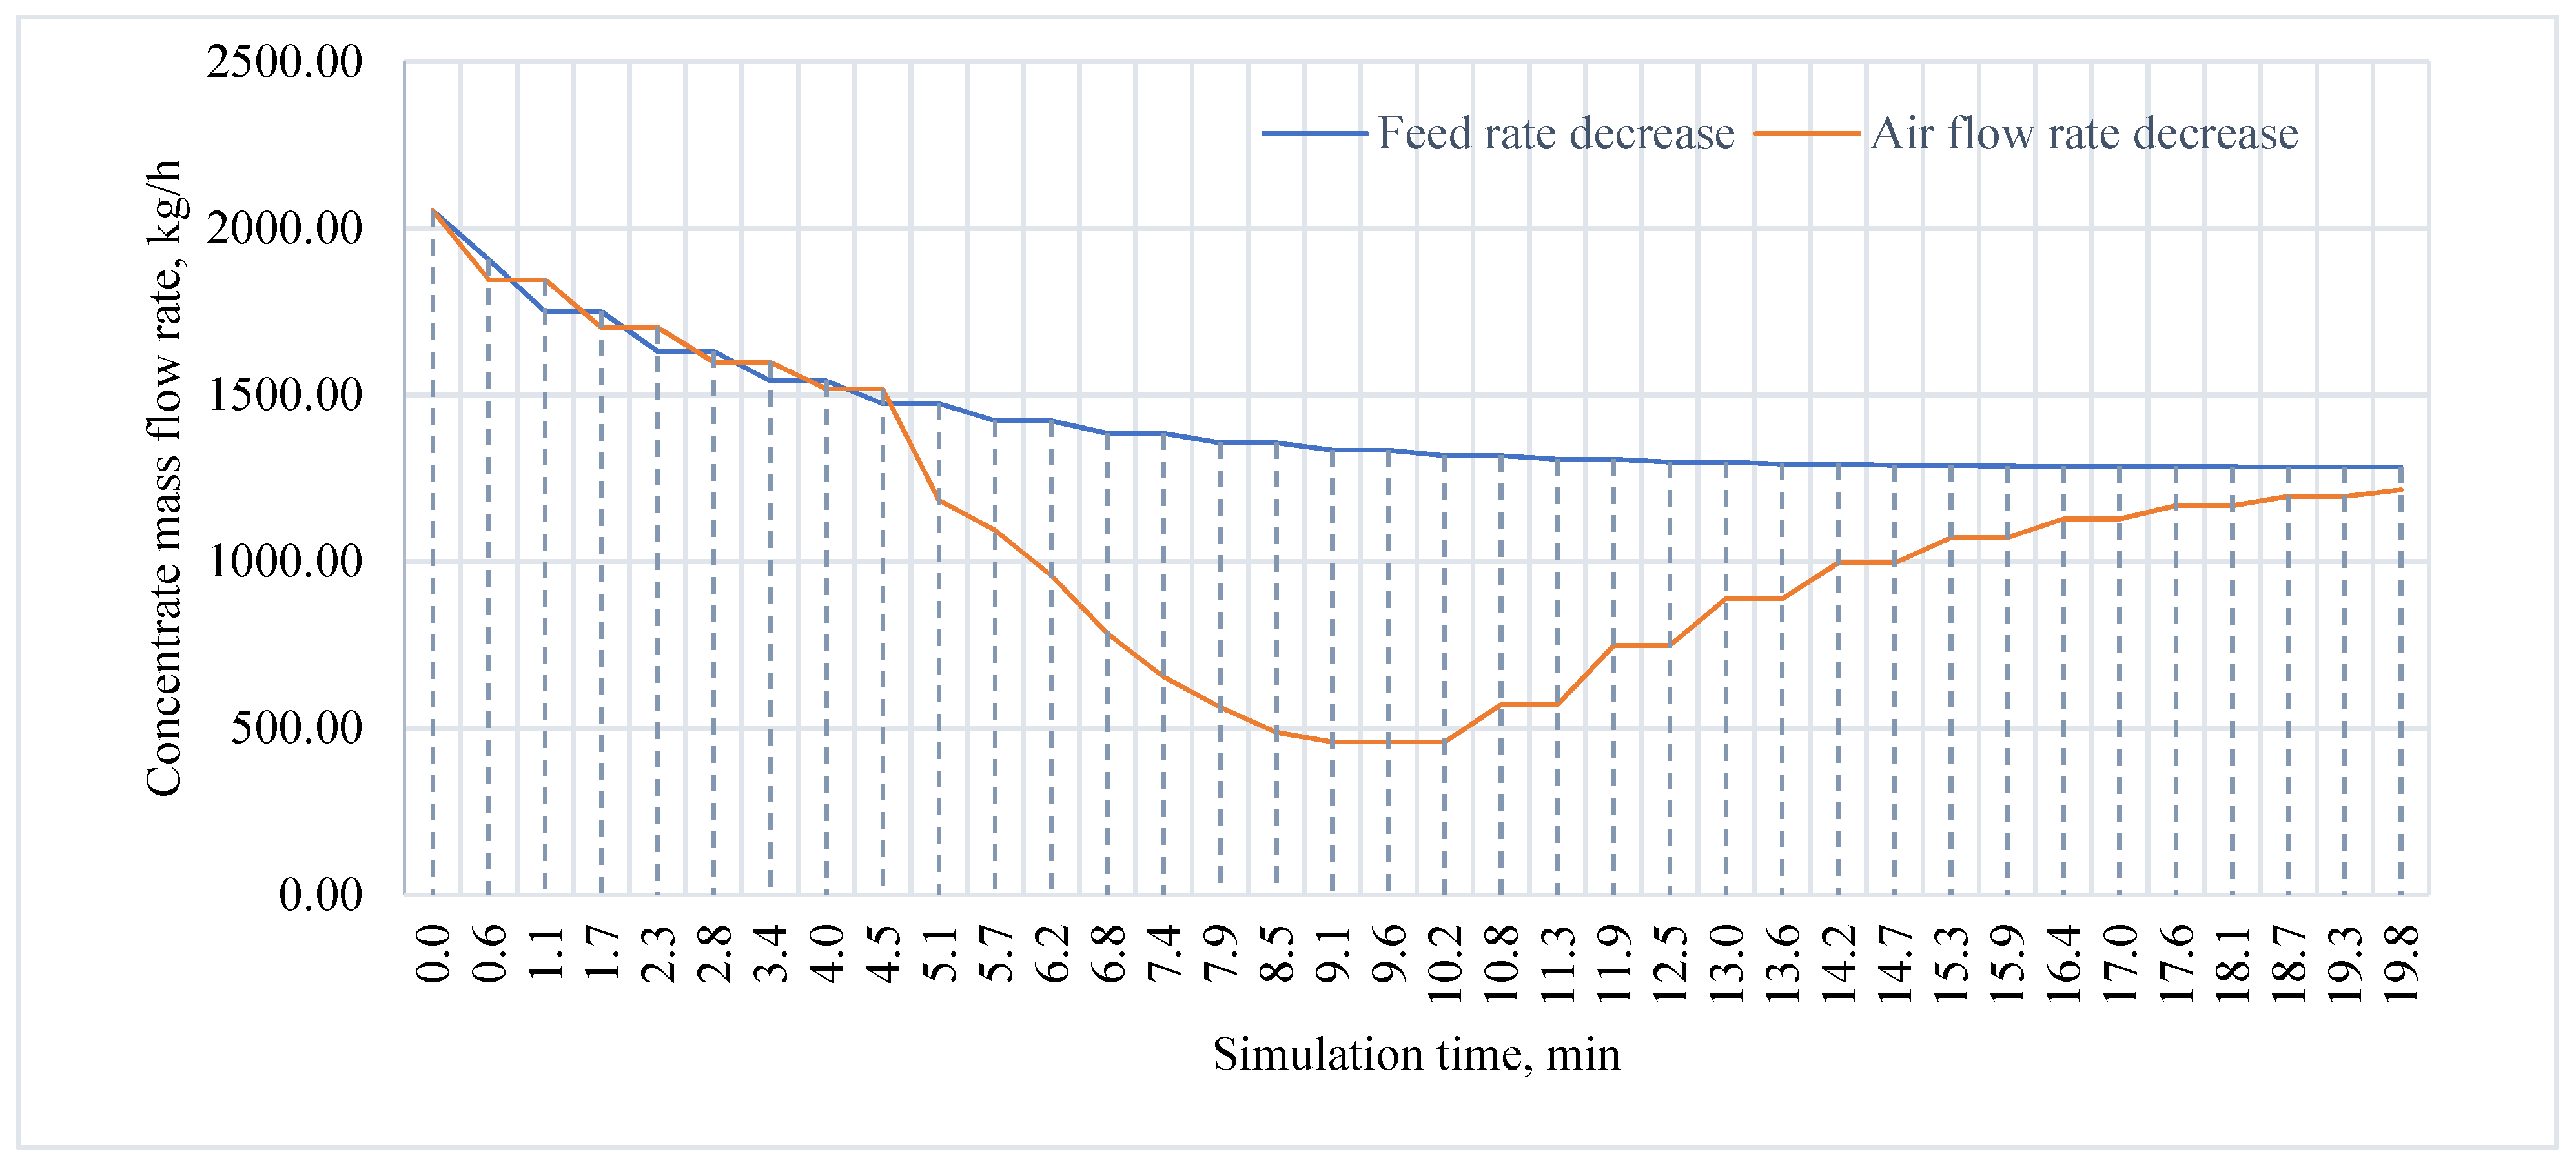
In the second stage, the effect of changes in the productivity of the flotation operation on the feed and air flow rate was evaluated. In addition, the foam height and concentrate productivity were investigated. In the simulation mode, we simulated changes in the power supply performance one by one and then simulated changes in the air flow rate. The values of changes for the supply and air flow rate were 10% of the initial values. A graphical interpretation of the obtained results is shown in
Figure 11,
Figure 12,
Figure 13,
Figure 14,
Figure 15 and
Figure 16.
Through the results of the simulation, it is established that, at an interval from 0 min till 4.5 min, the difference in the responses on the change in parameters is insignificant. At 4.5 min of the simulation, there is a sharp decrease in the foam layer height with a decrease in the air flow rate, which entails a sharp increase in the content of valuable components and a drop in their recovery to the froth. However, at the end of the simulation, the difference in the valuable component content for both investigated scenarios is insignificant, where the difference in extractions for pyrite is 2.39% and for arsenopyrite is 3.58%.
This is due to the effect of an uneven reduction in the degree of the aeration of the pulp. With a decrease in the air flow rate, there is a decrease in the stability and height of the foam layer. In the foam zone, the non-uniformity of the water content over the layer height is created, which reduces the carrying capacity of the foam. Thus, only opened clusters of valuable minerals are carried into the concentrate. However, after the water content values equalize along the height of the foam layer, the content values return to the initial ones. At the same time, reducing the air flow rate reduced the value of the height at which the foam can be stable. This is associated with the yield of the concentrate and the possible extraction of valuable components.
The obtained results should be taken into account when implementing control and automation systems for flotation processes. Reducing the power supply to the process does not lead to a violation of the stability of the process. In this case, a change in technological indicators occurs smoothly. At the same time, when changing the air flow rate, there are noticeable violations of the dynamics of the process, and it takes time to return to the steady state.
4.2. Study Results of the Dynamic Model of Flotation on the Suitability of Its Use in a Computer Simulator
Table 8 shows the results of dynamic model testing.
As can be seen from the results, most of the tests ended with the result “passed test”, which means that the developed dynamic model of flotation is suitable for use in the structure of the developed computer simulator. It should be emphasized that achieving most of the functionality is possible only when creating models of the entire chain of the production cycle. Thus, the developed model has a number of advantages over other known approaches discussed in the introduction. Compared to the approach that accurately simulates some actions (pilot or driver simulator), the proposed solution is more targeted to the needs of the industry. For the industry, the operator’s reaction is necessary as a brain activity in order to analyze different situations. The dynamic properties of the developed model showed an exact correspondence to the technological process in terms of values achieved in the process of functioning and in terms of the time of achieving these values. A clear advantage of this model is that, in the process of its use, it will take into account the inertia, which is an important factor in the control. The strengths also include the successful passing of the test in almost all communication channels that allow for the connection of digital elements today and the fast response of the model on all communication channels, as well as the acceptable speed of the solver, which allows us to simulate the real time mode on this simulator.
5. Conclusions
The development of computer simulators aimed at the application of digital technology in the industry is an important and urgent task. An important element of this computer simulator is the development of dynamic process models. These models, on the one hand, should provide accuracy; that is, when verifying the model by real production data, the model accuracy should not be less than 95%. On the other hand, an important aspect is to find so-called “islands of reality” in the functionality of dynamic models. Their development should be carried out with physical models, partially repeating those or other solutions in the industry. A prerequisite for such a simulator is a physical representation of the control and power system. This is necessary in order to be able to connect from dynamic models to real equipment and other hardware devices during training. In a number of technologies, this functionality is mandatory. For example, when developing digital twin technologies, when testing automation algorithms, information security systems, etc.
This paper shows the process of developing a dynamic simulation model of flotation in AVEVA Dynamic Simulation software, where the model verification is carried out using data from the laboratory pneumomechanical flotation machine with the bottom drive. In addition, testing of the dynamic model was conducted. It presented the readiness and feasibility of using the model in the overall structure of the simulator software complex, as well as the ability to integrate solutions of the dynamic simulation model with known systems, software and equipment of digital technology. The authors emphasize that this study is the beginning of a huge work on the development of the simulator complex. In the next stages, the authors will develop models of related processes of the enrichment chain in detail-crushing, screening, etc., will work out a model of the power supply and automation system, based on the results of testing and will perform connections of the model to real objects of the power supply and elements of the automation system. A series of experiments will be conducted in a mixed model/real objects format. In addition, the authors will design different scenarios for training: start/stop, emergencies, scenarios of inclusions of digital technologies in the structures of the developed models, scenarios of interactions of model units in different variants, etc.


