Article

Analysis of Potential Factors Influencing China’s Regional Sustainable Economic Growth

1
School of Management, Jiangsu University, Zhenjiang 212013, China
2
Research Center for Green Development and Environmental Governance, Jiangsu University, Zhenjiang 212013, China
3
Business College, Southwest University, Chongqing 400715, China
*
Author to whom correspondence should be addressed.
Appl. Sci. 2021, 11(22), 10832; https://doi.org/10.3390/app112210832
Submission received: 22 October 2021 / Revised: 9 November 2021 / Accepted: 11 November 2021 / Published: 16 November 2021
(This article belongs to the Special Issue Manufacturing Sustainability in a Circular Economy)

Abstract

:
The purpose of this article is to screen out the most important factors affecting China’s economic growth. Based on a literature review and relevant financial theoretical knowledge, China’s economic growth factors are selected from international and domestic aspects. Four methods, including least squares estimation, stepwise regression, ridge regression estimation, and Lasso regression, are used to screen and optimize 12 variables and analyze the degrees of influence empirically. The study finds that consumption levels and the development of the tertiary industry play significant roles in promoting China’s economic growth. Additionally, financial development and industrialization promote China’s economic growth, although in a gradual manner.

1. Introduction

The popularity of the new or endogenous growth theory spearheaded by [1,2] and the marvelous development of East Asian economies have accelerated in recent years. This rapid growth and development has contributed to a flood of empirical investigations using the new growth theory to explain the diverse financial advancement in East Asia. Some examples of researchers whose work significantly contributes to this critical field include [3,4]. Economic experts have used many factors to determine economic growth [5]. According one study, “no evaluation of East Asian economic growth would be comprehensive without taking China’s performance into account” [5]. The purpose of this recent study was to screen out the most salient factors among those that affect China’s economic growth. Extant studies and relevant financial theoretical knowledge have indicated that China’s economic growth factors are influenced by international and domestic aspects [6]. Additionally, different methodologies have been used to analyze various economic factors in China, which are in agreement with the methods applied in this study, including least squares estimation, stepwise regression, ridge regression estimation, and Lasso regression [7,8]
Since China’s reform and opening up of its market-based economic system, an unparalleled “Chinese miracle” of global economic development has occurred. As the world’s largest developing country, China’s economy has shifted from a rapid growth stage to an economy revolving around high-quality products. China is in a critical period of transformation revolving around optimization of its economic structure and growth. The path for and logic behind this economic growth and transformation in eastern, central, and western China have been different to the rest of the country [9]. By 2020, China has to achieve positive economic growth across its major sectors [5]. According to the International Monetary Fund, China’s current economic growth pattern gives credence to the earlier forecasts made by some researchers [5,10]. Regardless, the total GDP has reached a historic breakthrough point at up to one hundred trillion yuan annually, meaning China’s economy can be said to be “thriving” globally. Additionally, in 2020, China became one of the major economies globally to achieve positive economic growth, with a meaningful breakthrough in total GDP of one trillion RMB [11].
Under the double impact of trade protectionism and the novel coronavirus (COVID-2019) epidemic, the world’s major economies were characterized by “high debt, high interest rates, high inflation, and low growth” in 2020. In 2021, as the novel coronavirus epidemic continues, the uncertainty and downward pressure on global economic growth are increasing [12].
During the outbreak of the international financial crisis, China’s economic growth generally showed a continuous decline, after which the growth path begun to gradually shift to an L-shape [13]. Conversely, China’s economy has made world-renowned achievements in the face of the complicated and complex international situations and severe and challenging domestic reforms, development, and stability issues, especially the severe impacts of the new pneumonia epidemic.
Notwithstanding the above, some problems cannot be ignored. Due to the base effect of economic growth, with the same growth momentum, the larger the base is, the lower the speed is; the resilience of the industrial structure needs to be further improved. Moreover, the long-term reliance on the scale expansion of factor inputs to drive economic growth is no longer sustainable, as the income distribution gap between residents has widened. Therefore, it is of great practical importance and theoretical value to explore in-depth the main factors affecting China’s economic growth and the extent of their influence.
This current study is structured into six sections. Section 1 gives a brief introduction to the present study. Section 2 outlines the literature. Section 3 covers the materials and methods. Section 4 covers the results and discussion. Section 5 presents a comparative analysis of the variables selected based on the four methodologies and Section 6 outlines the conclusions of the study.

2. Literature Review

The strong driving force of the Chinese economy has played an essential role in developing the global economy. Government policies enhance growth if geared toward ensuring more market competition and maintaining innovation in products and services within an economy. Economic growth is defined as an appreciation in the value of a country’s economic goods and services, which results in increased financial gain for enterprises. Stock values increase substantially, providing businesses with extra capital to invest and employ more people. GDP has the limitation of not accounting for environmental cost. Expansionary monetary and fiscal policies could contribute to deficit spending, increased public debt, and slower economic growth.
Thus, the critical determinants of economic development, including human resources, natural resources, capital formation, and technology, are adequately harnessed to yield development. According to the economists, these policies of the various stakeholders are attributed to a series of relevant theories in comprehending the economic factors that drive economies. The most widely used economic growth theories that help explain a nation’s economic growth are the classical growth theory, endogenous growth theory, and neoclassical theories [14]. This present study was founded on these ideologies, which helped in selecting and analyzing the study indicators. According to the classical growth theory, a nation’s economic growth slows down as its population grows and resources become scarce. Such a presupposition is indeed an implicit assumption of the classical growth concept, indicating that a temporary increase in real GDP for every individual invariably leads to a rising population, limiting a country’s resources, and as a result reducing real GDP. As a consequence, the economic growth rate of the country will begin to decline [15].
Additionally, the fertility rates in most developed countries and some developing countries are at a sub-replacement state, leading to concerns about the sustainability of economic growth in these countries. However, the studies by Brander and Dowrick [16] posited that the population growth rate is positively correlated with economic growth. Xu et al. [17] constructed a generalized ridge–partial least squares regression method and selected 12 variables to analyze the factors affecting China’s economic growth from 1980 to 2000. Their research conclusions showed that population growth hindered China’s economic growth. The aging population would lead to a decline in economic development, a severe problem that China is facing [17]. However, there could be long-term coexistence between population decline and sustained economic growth [18]. In addition, well-educated elderly individuals can positively influence China’s economic growth and partly alleviate the adverse effects of population aging. Therefore, the potential positive effects of population aging cannot be ignored [19].
Studies on the relationship between population growth rate and economic development have been conducted by academics, demonstrating that the population growth rate in China has stabilized in recent years [20,21]. The long-run growth rate of output per capita can be positive regardless of whether the population growth rate is positive or negative, depending on the conditions. Sustainable economic growth can be achieved even in an economy with non-renewable resources and a declining population [22]. With the implementation of China’s family planning policy, the population growth rate has stabilized, as described earlier; hence, this study does not include population growth as an explanatory variable.
Chen and He [23] performed an investigation from 2000 to 2010 in China, using gray correlation analysis to empirically analyze the factors influencing China’s economic growth and designing a gray correlation ranking table. The empirical results showed that domestic trade development has the most significant impact on China’s economic growth. The country’s financial institutional arrangements and trade flow considerably improved economic growth [17]. There was a causal relationship between China’s economic growth and foreign trade, and both in the long-term or in the short-term, China’s import growth and export growth were important reasons for GDP growth [24]. In countries and regions such as China and India, foreign trade significantly promoted economic growth, and imports and exports were conducive to adjusting the industrial structure [25]. Based on the data for prefecture-level cities in China, the empirical test of the impacts of international trade on the regional economic growth rate showed that the effects of international trade on China’s economic growth rate were positive, and that these impacts would increase significantly over time [26]. Trade opening improved capacity utilization considerably, promoting capital deepening and economic growth [27].
In adopting the ordinary least squares method to study the relationship between trade and economic growth, the study showed that the geographic characteristics had an essential impact on trade and indirectly affected economic growth [28]. Regional differences in China over 1997–2009 were analyzed to consider the impacts of export complexity on economic performance. The study showed that financial gains were limited to ordinary export activities carried out by domestic firms. At the same time, there were no direct gains from either processing trade activities or foreign firms [29]. The interactions between trade openness, innovation, financial development, and economic growth in 27 OECD countries over the period 2001–2016 were studied using a panel vector autoregressive model. The results showed a two-way relationship between economic growth and trade [30]. By studying the relationship between the bilateral trade openness and per capita GDP of 15 Latin American countries during the 2008 financial crisis, it was found that when only Latin American countries were considered, there was a slight positive relationship between trade openness and growth relationships [31,32]. The positive shock of trade openness has a positive impact on the economic growth of most countries. Therefore, it was recommended to implement more trade liberalization policies to maximize the benefits from trade openness [33]. There is a one-way relationship between trade and economic growth. Policymakers should improve the quality of the system and the regulatory environment to obtain more benefits from trade opening [34]. This suggests that import and export trade has a significant effect on economic growth. Therefore, this article includes total import and export trade as an explanatory variable to measure China’s economic growth.
Based on a gray correlation analysis method with an input–output efficiency model of the analysis, Guo Yue [35] concluded that the investment push has made a more outstanding contribution to China’s economic growth in the past three decades. Within the context of global production networks, FDI inflows have driven China’s economic growth, with positive technology spillover effects on domestic firms [36]. The relationship between FDI and the economic development of coastal and mid-western regions was examined using OLS statistical regression methods. The empirical results concluded that FDI positively impacted China’s regional economic growth; the comparison between coastal and mid-western regions illustrated that the gradient opening policy was an essential factor in the significant difference between FDI in coastal and mid-western China [37]. An empirical analysis of the relationships between FDI, tourism, and economic growth in small economies using a panel threshold model found that FDI contributes to economic growth occurs only under certain conditions, with the scale of tourism being one of the economic pillars.
When the scale of island tourism reached a certain threshold, it brought about the expansion of local capital demands, human capital accumulation, infrastructure improvements, and industrial base formation before FDI influenced economic growth through technology spillover effects [35]. The cointegration test and VECM causality test were used to explore the associations between FDI inflows, service trade (exports and imports), and economic output. The causality results indicated two-way causal relationships between FDI and economic output and between service exports and economic output [38]. Based on a new economic growth theory framework, the impacts of foreign direct investment (FDI) and exports on economic growth in 25 economies in the CSEE region during 1990–2005 were studied using a dynamic panel approach. The study showed that FDI positively and significantly impacted economic growth [39]. It focused on the multi-criteria application of FDI and sustainability factors (CSR spending) in different developing countries to explore the impacts on sustainable economic development and decision making. The findings suggested that FDI had a significant positive effect on economic development [40,41]. FDI was a potentially important contributor to the economic growth and development of small-island developing states (SIDS) and was an important source of investment [42]. Countries’ long-term growth depends on further co-development and coordination of FDI and trade opening policies [43].
From the above, it is evident that the role and mechanism of the impacts of foreign direct investment on economic growth need to be studied in depth. Based on the endogenous economic growth model, Zhile [44] analyzed China’s economy in the new normal, pointing out that the tertiary industry is the main force driving economic growth. The analysis shows that factor inputs such as capital and labor are essential for overall Chinese economic growth. In adopting the asymmetric component ARCH model as an analytical tool, the test results showed that the stabilizing effects of urbanization and the tertiary industry on the macro economy are significant. Therefore, it is necessary to vigorously promote urbanization, develop the tertiary industry, and give full attention to the driving effects of urbanization. The tertiary industry has improved the quality of economic development [45]. A study was performed based on China’s statistical data from 2007 to 2017, studying the absolute and relative scales of the industry structure and regional structure of the tertiary industry tax revenue. The results showed that China’s tertiary industry tax contribution had comprehensively surpassed other industries and became a stable tax source for Chinese government tax revenue [46].
Another study examined the spatial patterns and economic impacts of knowledge-intensive business services (KIBS) in US metropolitan statistical areas (MSAs), suggesting that KIBS could be an economic driver in US MSAs and that urban practitioners should develop policies for KIBS to promote regional economic growth [47]. Several causal configurations of environmental factors favor the development of knowledge-intensive activities (KIAS), which is an essential component of innovation. In turn, innovation drives economic growth and regional development [48]. Manufacturing firms and knowledge-intensive business service firms were interdependent, which drove regional development [49]. The growing importance of the services sector in economic growth was found by studying the relationships between the services sector and its territorial impact and regional effects and by providing an empirical analysis of specific countries and themes, such as geographical concentration, globalization impact, foreign direct investment, and innovation [50]. Taking the service industry as the research object, an empirical general equilibrium model that considered the flow of goods and capital, consumption, and investment dynamics across sectors and economies was used to evaluate the impact of faster growth on labor productivity in the Asian service industry. Studies had found that more rapid productivity growth in the Asian service industry contributed to the sustained and balanced development of the Asian economy. However, the dynamic adjustments of various economies were not the same [51]. The underdeveloped service industry in Asia will become a new engine of economic growth in developing Asian countries [52]. As China’s economy has entered a stage of high-quality development and the industrial structure has been continuously adjusted and optimized, the role of the tertiary industry in China’s economic growth has become more prominent.
Fiscal and monetary policies are the main instruments used by the government to implement regulations and stabilize the economy. Studies on the relationship between the population growth rate and economic development have been conducted by academics, demonstrating that the population growth rate in China has stabilized in recent years [20]. Based on the theory of economic growth under the balance of payments constraint, the impact of the real exchange rate of the RMB against the US dollar on China’s economic growth since China’s accession to the WTO was examined. The study results found that the real exchange rate depreciation had a suppressive effect on China’s economic growth in the long and short terms [53]. The role of fiscal policy in promoting economic growth by regulating fiscal expenditure to regulate aggregate social demand and achieve a balance between aggregate social supply and demand was very large and long-lasting.
The role of China’s money supply in macroeconomic regulation was relatively weak; the effectiveness of both policies ultimately depended on the market mechanism and the responses of microeconomic agents [54]. Regardless of the financing method used, an increase in redistributive spending in fiscal policy reduces income inequality but does not affect economic growth [55]. The relationship between income inequality and economic growth was analyzed through fiscal policy. It was found that in the context of fiscal consolidation, the most appropriate budgetary policy strategy was to cut non-distributive spending, as this increases GDP growth while reducing income inequality [56]. A study on the effects of monetary policy shocks and economic policy uncertainty on the main macroeconomic variables and interest rate spreads indicated that the term spreads, credit spreads, monetary policy shocks, and monetary policy uncertainty had statistically significant effects on all economic and financial variables [57]. Moreover, monetary policy had a more important and more persistent real impact on economic development [52].
Numerous studies have analyzed and studied the relationship between consumption levels and economic development in China [58,59].
The scale of population consumption is a necessary condition for the sustained and stable growth of a country’s economy. At present, the contradiction of the demand structure has become a deep-seated contradiction that restricts China’s sustained and steady economic growth. Only by combining the expansion of the consumption scale with supply-side reform so that the large scale of residential consumption can be satisfied mainly through the domestic market can the country’s advantages be fully utilized [60]. The contribution of consumption to the structure of China’s economic growth under the new economic normal is growing increasingly larger [61]. China is in a transition stage from mid-industrialization to late industrialization, and consumption will become the key engine driving China’s economic growth in the future [54]. Residents’ consumption was positively correlated with economic growth, and raising the level of residents’ consumption and releasing their consumption potential were conducive to urban economic development. According to the findings of Tao et al. [62], the expansion of the internet has had a profound impact on the performance of digital financial services, which has had a substantial impact on inhabitants’ consumption. The development of e-commerce has enhanced rural households’ consumption capacity, energized consumption potency in rural areas, and bridged the gap with urban centers [63].
Moreover, the more developed the urban economy, the larger the city and the greater the positive effect of residents’ consumption on urban output [64]. From the above literature, it can be observed that resident consumption will be the main driving force of China’s economic development in the coming years.
Certain other factors also affect the growth of the economy. Financial investment in science and technology has a positive role in promoting technological progress and economic transformation. To further improve financial investment contributions to science and technology innovation, a diversified innovation support system should be established with government guidance, market subjects, and social participation [65]. Financial education expenditure has significantly improved economic growth by effectively increasing the number of years of education per capita. Therefore, in the new era of moving toward high-quality development while expanding the scale of fiscal education expenditures, the structure of budgetary education expenditure should be further optimized and the performance of fiscal education expenditure should be vigorously improved [66]. The effects of financial deepening on economic growth in countries along the Belt and Road were positive, as measured by the proportion of GDP granted by the financial sector to private sector credit.
In contrast, financial inclusion in economic growth was shown to be insignificant [67]. Based on the concept of sustainable growth, it was found that industrialization generally improves the economy but over-industrialization may lead to a downward trend as a result of the related activities causing pollution and other effects on the populace, resulting in increased government expenditure [68]. Before the reform and opening up, under the influence of the Soviet Union, China formed the economic catch-up model of prioritizing the growth of heavy industry, which became the fundamental basis for economic construction after the founding of New China. This model promoted the development of heavy industrialization in China. Although the growth rate was not low, it was accompanied by structural imbalance, lack of livelihood, large economic ups and downs, and widening of the international horizontal gap. After the reform and opening up, the modern market economic system was introduced. As a result, the theoretical paradigm of economic development and growth gradually became an essential guide for China’s financial practice and research. As a result, the Chinese economy gradually transformed from industrialization to servitization [69]. Therefore, this paper also includes fiscal science and technology expenditure, education expenditure, automation, and financialization as research variables.
After investigating the impacts of education spending on economic growth in 18 Latin American countries over the period 1970–2009, there was evidence of a co-integrated relationship between education spending and economic growth in the countries considered [70]. The dynamics of inflation have an impact on long-run economic growth. In particular, government constraints on household spending on education are crucial to the negative relationship between long-run inflation rates and economic development [71]. The impacts of education and R&D investment on regional economic growth in Korea were studied by decomposing regional growth paths into qualitative and quantitative paths to determine how regional economies grow. Simulations were conducted to assess alternative policies in terms of effectiveness and adaptability; the impact of education on growth in the rest of Korea was only 22.3% of that in the Seoul metropolitan area. Improving the regional human capital accumulation efficiency was effective in alleviating regional economic disparities [72].
Several scholars have also studied the relationship between industrialization and economic growth. China’s industrialization process was found to explain the post-reform economic growth in the research framework. The protracted industrialization program initiated at the beginning of the reform led to a rise in the capital/output ratio and a decrease in total factor productivity growth [73]. The factors that drove the acceleration of manufacturing growth in a sample of 134 developing countries between 1970 and 2014 were examined. It was shown that human capital and institutions were the contextual factors that favored manufacturing growth, as well as investment-related macroeconomic policies and the degree of openness to foreign trade and capital, most of which contributed not only to the episodic acceleration of industry but also to the sustained industrialization process, which characterized the economic growth process in some prosperous countries between 1970 and 2014 [74]. The long-term depreciation of Indonesia’s exchange rate, including capital flight, can only be stopped by promoting further development through export-oriented industrialization policies [75].
Using data from 286 cities in China during 2001–2006, the relationship between financial development and economic growth at the city level in China was studied. The study indicated that most traditional financial development indicators were positively correlated with economic growth [76]. A new methodological approach based on dynamic factor modeling techniques was constructed to determine the financial liberalization index. It was proposed that the relationship between financial liberalization and economic growth be studied. The findings suggested that although financial liberalization positively impacts economic growth in both high and low growth regimes, the impact of financial liberalization on real GDP growth in high-growth regimes is relatively more significant [77]. Studies have found that financial development drives green technology and innovation, which has improved China’s central and western regions [78]. Studying the relationships between financial development, trade opening, and economic growth in four North African countries from 1991 to 2015, it was found that trade opening seems to play a role as a supplement to financial development [79]. In determining financial development variables, trade opening is more pronounced in promoting economic growth.
Based on the summary of the existing research, this article selects the main influencing variables of China’s economic growth from two aspects: international influencing factors and domestic influencing factors. The global influencing factors include import and export trade, exchange rates, and capital internationalization. The domestic macro influencing factors include fiscal policy, monetary policy, and the domestic economic environment. The domestic economic climate is formed by the following factors: human capital, technological development, education level, consumption level, tertiary industry development, financial development, industrialization, and real estate development. In adopting provincial input–output tables for 2002 and 2007, the importance of the real estate–construction sector in the Chinese economy was investigated using hypothesis extraction. The study found that the impacts of the real estate-construction sector on total output and employment varied across regions [80]. Local governments in the United States used real estate transfer taxes to create more substantial incentives for homebuyers to undertake major remodeling projects at the time of sale. Based on 2010 housing sales data, a 2.5% energy efficiency transfer tax on home buyers would generate a net increase of approximately 3485 direct construction jobs and 5900 annual jobs in the state [81]. The growth momentum in the housing sector can be extended to a wide range of industries, particularly the financial sector, where housing plays an increasingly important role as a macroeconomic provider [82].
This study uses the total import and export of goods to reflect the import and export of trade. The exchange rate of the RMB against the US dollar reflects the current exchange rate level. China uses the amount of foreign direct investment globally to reflect the degree of capital internationalization, fiscal expenditure reflects the budgetary policy, and the currency supply in circulation reflects the monetary policy. Regarding the domestic economic environment, gross domestic product indicates domestic economic development, total retail sales of consumer goods indicate the consumption level, fiscal education expenditure indicates the education level, while fiscal science and technology expenditure indicates the science and technology development level. The value added by the tertiary industry indicates the tertiary industry development level, while the value added by the financial sector, industrial sector, and real estate industry indicate economic development, industrialization, and real estate development, respectively. Table 1 denotes the description of the variables and indicators.

3. Material and Methods

3.1. Data Acquisition

The exchange rate data were obtained from the State Administration of Foreign Exchange of China, using the exchange rate of RMB to USD on the last day of each year from 2000 to 2019. The data for 2000, 2006, and 2017 represent the exchange rate levels on December 29. The data for 2007 represent the exchange rate level on December 28 of that year. The data for 2011 and 2016 were extracted on December 30. The rest represent the exchange rate levels on December 31 of each year. Other variable data came from the website of the National Bureau of Statistics of China, and the data range was from 2000 to 2019. Because the data were all calculated using the current year’s price, all indicators other than the exchange rate used the growth rate to eliminate the influence of price factors.

3.2. Emprical Methods

The reviewed existing studies mainly showed inconsistencies in their choices of methods and models, meaning the conclusions they reached varied. In general, ordinary least squares estimation is the simplest and most widely used regression estimation method. The relationship between trade and economic growth has been studied using ordinary least squares [28]. The relationship between financial deepening and economic growth has been examined using static ordinary least squares (SOLS) and dynamic ordinary least squares (DOLS) estimation methods [83]. In adopting simple ordinary least squares, three-stage least squares, and a generalized method of moment estimation techniques, political constraints were found to have a statistically and economically significant effect on economic growth rates [84]. The impacts of renewable energy consumption on economic growth in OECD countries were analyzed by applying the ordinary least squares method with fixed effects estimation to data from 1990 to 2010 [85]. The impacts of corruption in public health on economic growth in audited cities were analyzed using ordinary least squares and quantile regression, with the sample restricted to 180 cities audited in 2009 and corruption variables constructed from the audit reports of that year. The results showed that corruption harms economic growth [86]. However, when there were more variables, whether multicollinearity or near-multicollinearity relationships among the different factor variables, the estimation results of the least squares method were subject to large errors [66]. The principal component analysis method was assumed to eliminate the multicollinearity among the selected independent variables effectively. The output elasticity of the factors affecting China’s economic growth and their pulling effect and contribution to China’s economic growth were determined using the principal component regression analysis method [87]. Nineteen variables affecting China’s economic growth were selected and empirically analyzed using the robust sparse principal component [61]. However, the prevalent component approach only considered the information contained in the independent variables in the analysis. It did not include the information for the dependent variables, resulting in loss of data [88].
In practical problem solving, modeling often involves variable selection, and the use of too many or too few model variables is not conducive to studying the issue. Commonly used methods to improve OLS include stepwise regression, ridge regression, and Lasso regression. Stepwise regression introduces a penalty for adding more coefficients based on least squares, retaining the most significant variables. Therefore, it is very likely that there will be an excessive reduction of variables [89]. RIJF [90] reviewed three basic non-linear least squares estimation methods and proposed stepwise regression to non-linear estimation. The stepwise regression method was proposed to test the interactions between variables, highlighting this regression analysis method [91]. The impact of agricultural output on economic growth was explored using the dynamics of the different technical approaches that stepwise regression can provide [92]. Additionally, the interaction effect between economic growth and environmental pollution in Wuhan in China was studied using the stepwise regression method by selecting critical indicators of economic growth and environmental pollution [93]. A stepwise regression analysis was conducted by studying domestic patents as the dependent variable with scientific, technological, and economic data from 128 countries. The study showed that domestic patents were closely related to the gross national product [94].
Ridge regression and Lasso regression have been widely used in recent years. The Ridge regression and Lasso regression methods were used to construct a future price expectation index model with reduced dimensional parameter estimation [95]. The Lasso–Lars model was also used to develop a PM2.5 concentration time series [96]. The Lasso variable selection method and multi-factor model were applied to study the construction of enhanced index funds [97]. Ridge regression is a biased estimation regression method dedicated to collinearity data analysis. In essence it is an improved OLS method. The disadvantage is that the unbiasedness of the least squares method needs to be abandoned and some information is lost. It also reduces the accuracy but can obtain more realistic regression coefficients, making it a more reliable regression method and more suitable for the fitting process of ill-conditioned data. Compared with ordinary regression, although the square value of the correlation coefficient is reduced, the significance of the regression coefficient is significantly higher than that of ordinary regression. Therefore, it is more practical for collinearity problems and ill-conditioned data [95]. It was pointed out that ridge regression is a promising alternative method for deleting related variables to reduce multicollinearity. The study found that ridge regression will give better results for some economic models (such as production functions) than other economic models [98]. The shortcomings of multiple regression were described, and ridge regression was introduced to show how to obtain biased estimates with minor mean squared errors [99]. Ridge regression and geographically weighted regression models were applied to test the impacts of geographic location, transportation, and policy on the regional economy [100]. Various methods such as ridge regression were used to forecast vital macroeconomic variables for Australia [101]. A pre-test and contraction method based on generalized ridge regression estimation was proposed, which was applied to multicollinearity and high-dimensional problems [102].
Lasso regression is a compressed estimation regression method. A more refined model can be obtained by constructing a penalty function. Compared with ridge regression, Lasso regression can better solve overfitting [95]. If the sum of the absolute values of the coefficients is less than a constant, “Lasso” minimizes the sum of the squared residuals. Due to the nature of this constraint, it tends to produce some cases where the coefficients are precisely zero, thereby enabling interpretable models to be obtained [103].
In addition, the authors of a previous study pointed out that the Lasso idea is quite general and can be applied to various statistical models. An extension to generalized regression models and tree models was briefly described in the paper [104]. Subsequently, an improved Lasso-based principal component analysis technique was proposed [105]. Finally, the adaptive Lasso estimator was used to identify the critical variables affecting economic growth [106]. It is noted that the use of the Lasso regression model solved the problems of multicollinearity and overfitting, and its ability to minimize the number of influences on the forecast also allowed more flexibility in policy design [107].
The models used for ridge regression and Lasso variable selection are highlighted. Assuming that ( x i 1 , x i 2 , , x i p ; y i ) , i = 1 , 2 , n , n is the sets of observations of the explanatory variables, and assuming that the data are standardized, note that β ^  =  ( β 1 ^ , β 2 ^ , , β p ^ ) T , while the estimate of ( β 0 ^ , β ^ ) is defined as:
( β 0 ^ , β ^ ) = argmin { i = 1 n ( y i β 0 j = 1 p β j x i j ) 2 } , s . t . j = 1 p β j 2 λ
( β 0 ^ , β ^ ) = argmin { i = 1 n ( y i β 0 j = 1 p β j x i j ) 2 } , s . t . j = 1 p | β j | λ
Equation (1) represents ridge regression and Equation (2) represents the Lasso method. Here, λ 0 is the penalty coefficient. Lasso regression and ridge regression are similar in principle but differ in the ways they construct the constraint conditions. The penalty term is not the square of the coefficient but its absolute value. Taking Lasso as an example, the least squares estimate of β j   ^   is represented by β j 0 ^ , λ 0 = j = 1 p | β j 0 ^ | . With λ λ 0 , the optimal solution in Equation (2) is β j 0 ^ ; with λ < λ 0 , part of the optimal solution in Equation (2) may be equal to 0 and the corresponding variables are deleted from the model to achieve the variable selection.
This current study intuitively compares the pros and cons of several regression methods and better fits the models of economic growth factors. This paper uses four regression estimation methods to select variables and calculate the mean square errors.

4. Results

4.1. Correlation Analysis

Correlation analysis is widely used in the economic and financial fields and is mainly used to determine the correlation between variables before establishing a model.
The results of the correlation coefficient analysis presented in Table 2 show that the correlations between the exchange rate, the growth rate of science and technology expenditure, the growth rate of real estate industry’s added value, and China’s economic growth rate are not significant, while the linear relationships between other variables and China’s economic growth rate are significant at the 5% confidence level.

4.2. Variable Selection

Based on the correlation analysis, variables were selected for the nine influencing factors with significant linear relationships.

4.3. Ordinary Least Squares Estimation

The ordinary least squares estimation expression is β ^ = ( X T X ) 1 X T y . The estimation results are shown in Table 3.
From the least squares estimation results in Table 3, it can be seen that the growth rate of import and export trade, the growth rate of total retail sales of consumer goods, the growth rate of the tertiary industry, the development of the financial sector, and the industry have significant effects on the level of China’s economic development. Here, significant values < 0.05 indicate a considerable regression effect. From the beta values, we can see that promoting international trade development, introducing foreign investment, expanding money supply in circulation, increasing the consumption level, increasing support for education, and encouraging tertiary industry development benefit China’s economic growth, while increasing fiscal spending and economic and industrial expansion is helpful to China’s economic development in long run. In this paper, covariance diagnosis is performed for nine variables.
As can be observed in Table 4, the VIF values are all greater than 3. Therefore, there is a strong covariance between these variables. As such, the least squares regression results are not satisfactory and a new estimation method is used to overcome the deficiency.

4.4. Stepwise Regression

Stepwise regression based on the AIC criterion introduces a penalty for adding more coefficients based on the least squares method. The stepwise regression is characterized by the fact that the variables retained for variable selection are those with significant effects [108].
As shown in Table 5 below, only the growth of tertiary industry, the growth of import–export trade, and the growth of total retail sales of consumer goods positively contribute to economic development. At the same time, the other variables are not yet significant for China’s economic growth.

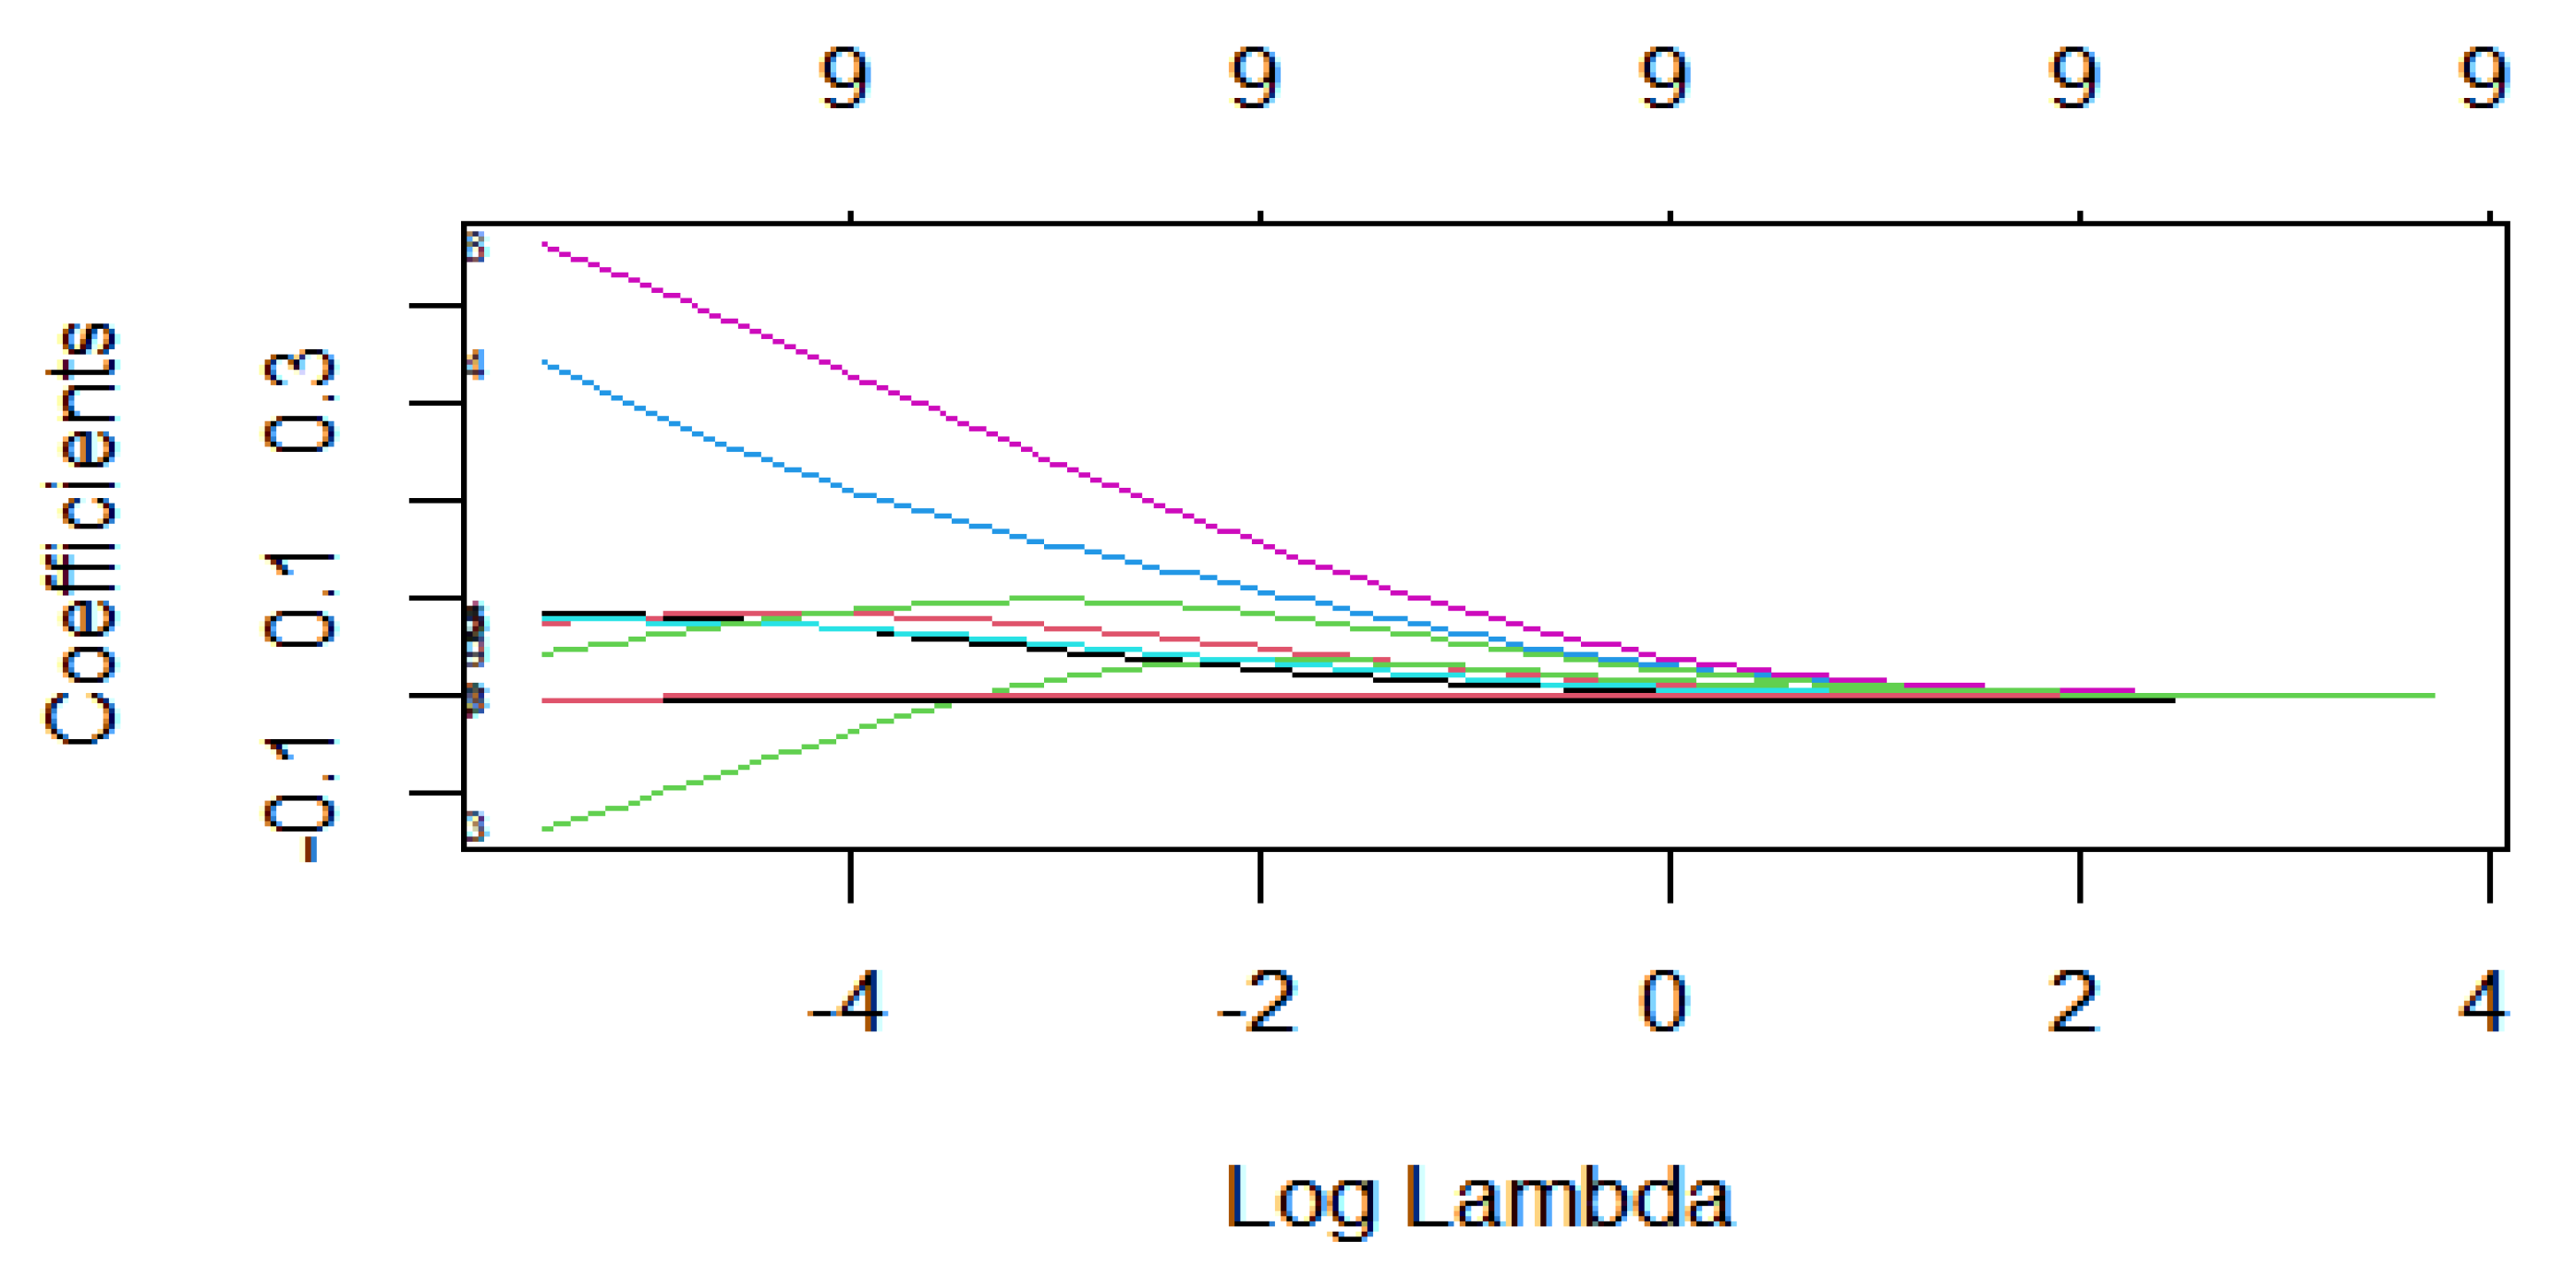
4.5. Ridge Regression

From the stepwise regression, it can be observed that only three variables have an impact on China’s economic growth, which are not in line with the actual phenomenon, and there is a problem of excessive reduction. Therefore, ridge regression modeling is adopted. The ridge regression coefficient and path diagram are shown in Figure 1.
Figure 2 demonstrates the Ridge regression coefficient. The results of the ridge regression show that the increase in the level of international trade, the expansion of the amount of foreign direct investment, the growth of money supply in circulation, the rise in the level of social consumption, the increase in the importance of the financial sector to education, and the development of the tertiary industry have positive effects on China’s economic growth. This confirms the BIC score shown in Figure 3. It can be seen that BIC = 7, representing the 7 explanatory variables with the smallest BIC values, i.e., the optimal number of explanatory variables is 7. Therefore, the overall level of social consumption has the most significant effect on China’s economic growth. In contrast, the financial industry and some other industries contribute to economic development but not as much as expected. The results demonstrate that maximum effort is required to attain the full benefits of financial development investment to contribute to economic growth.

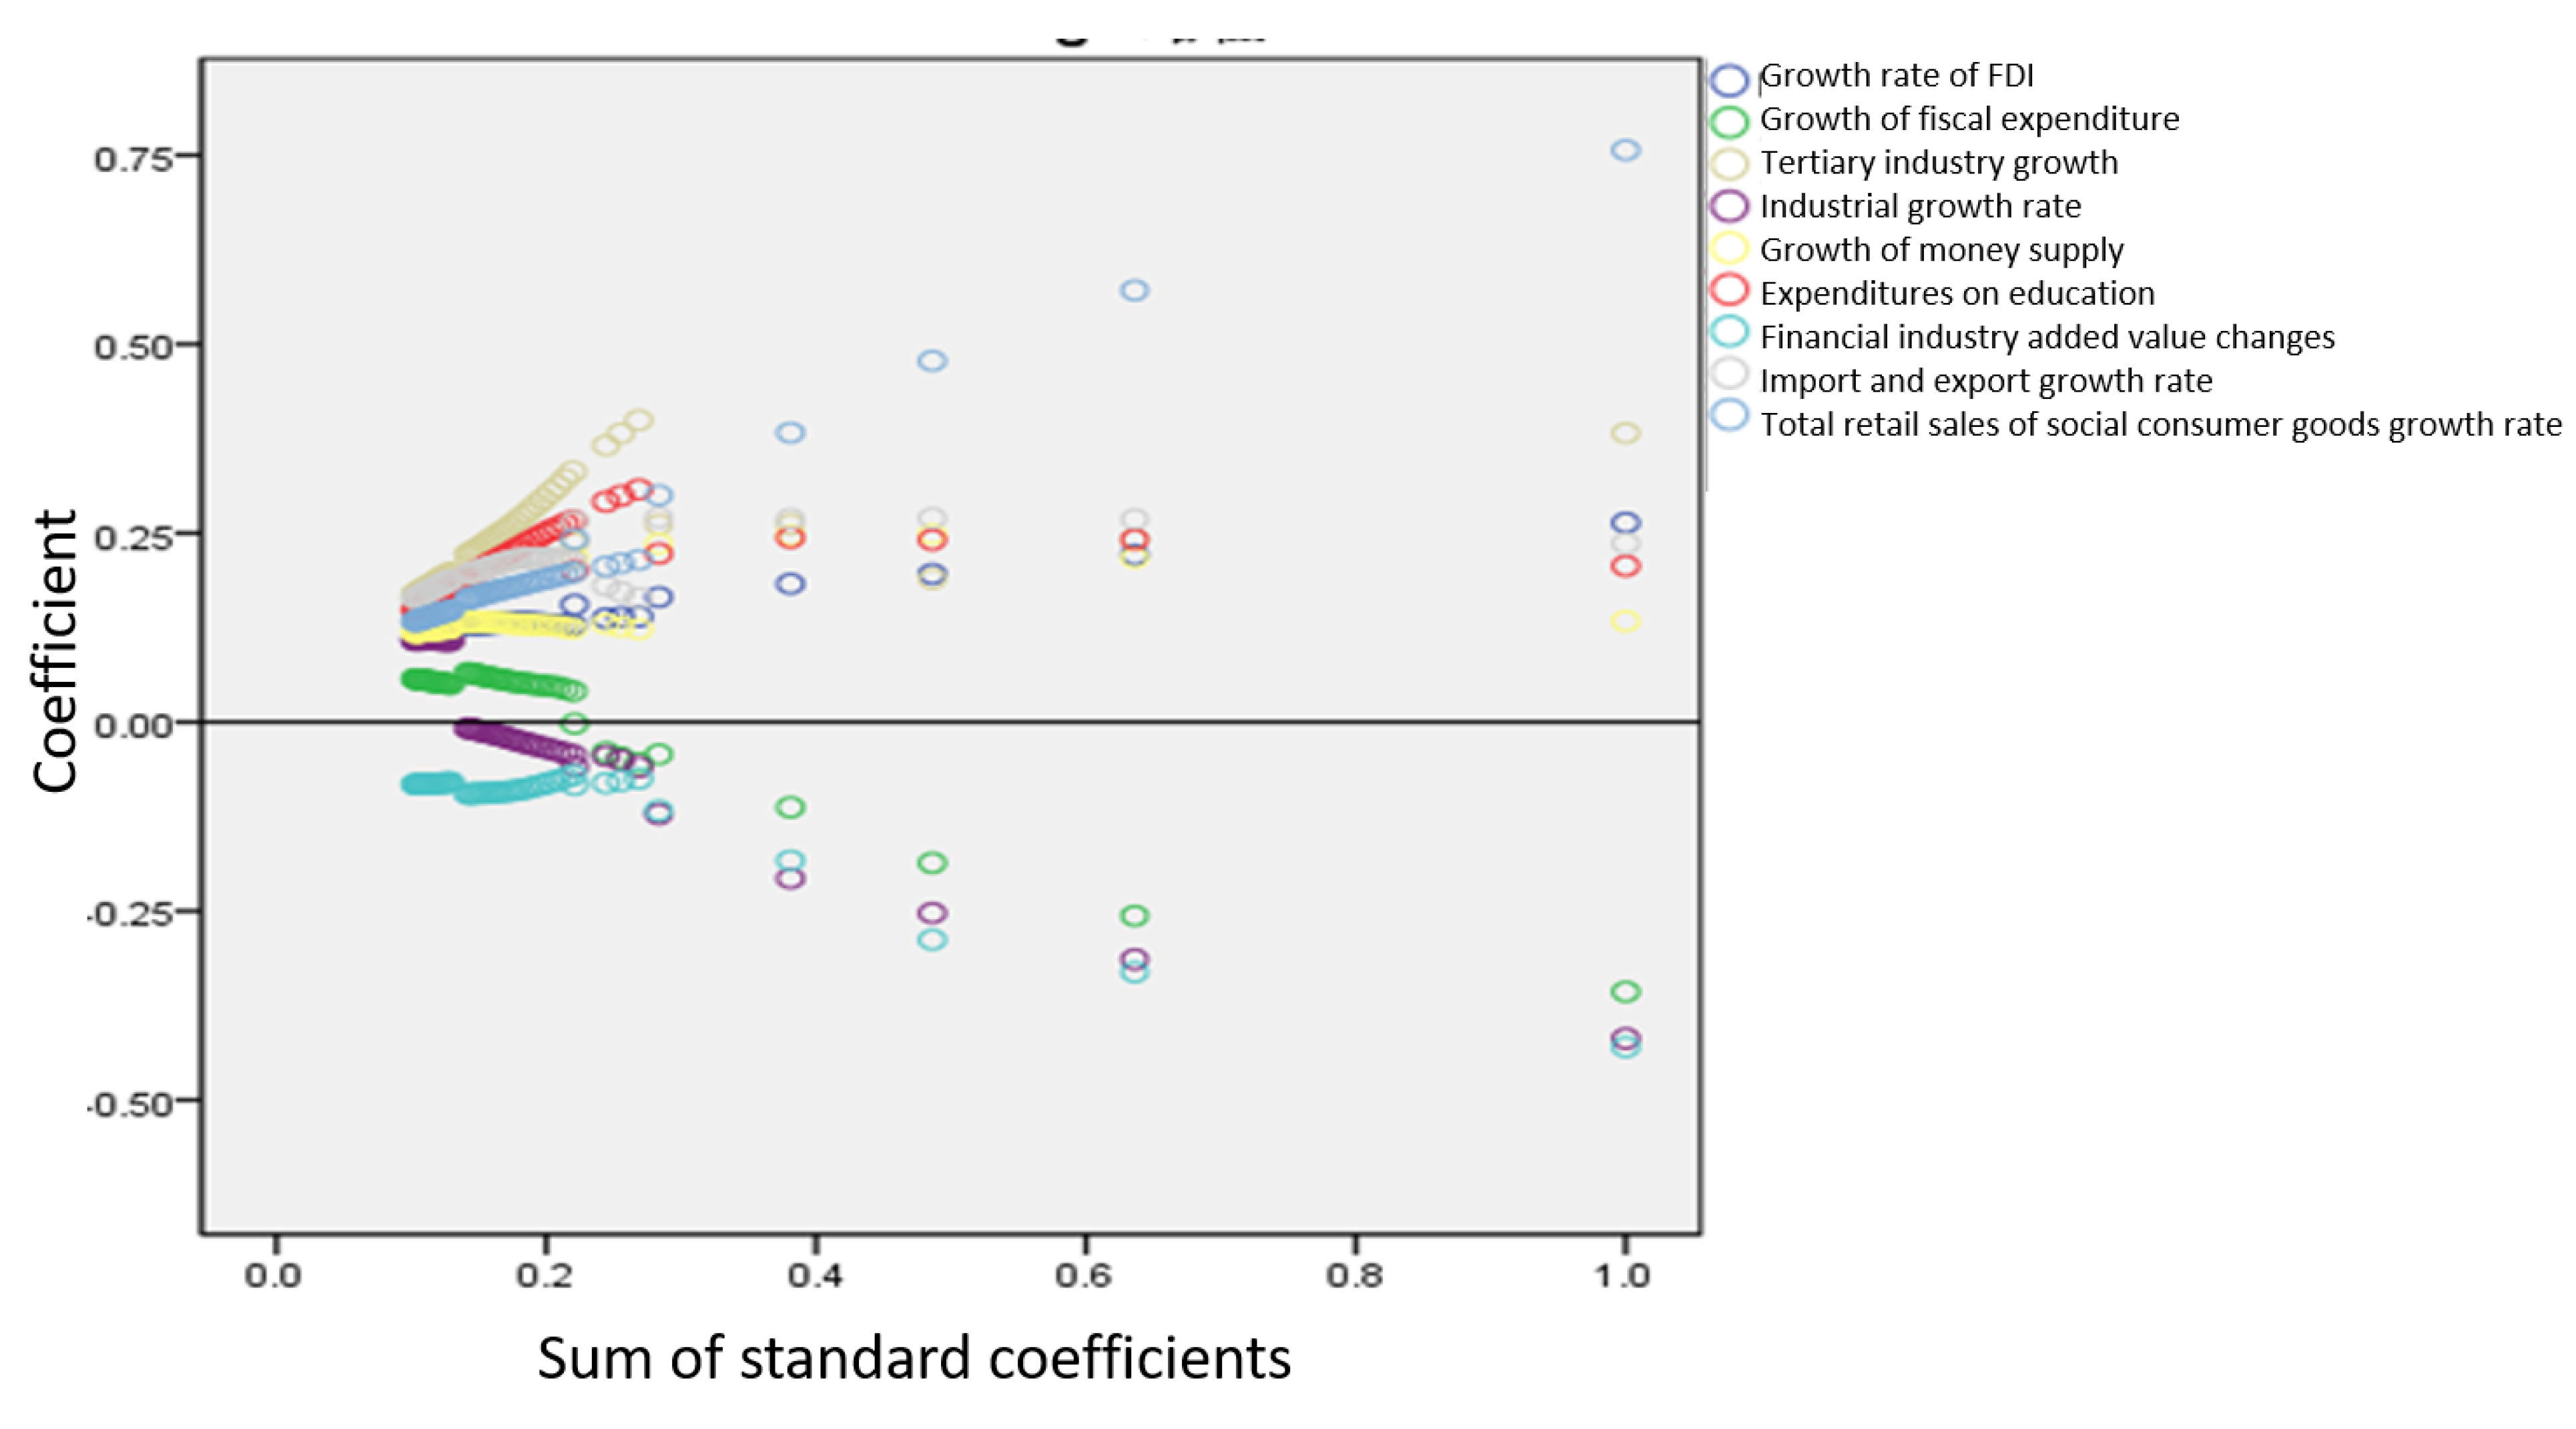
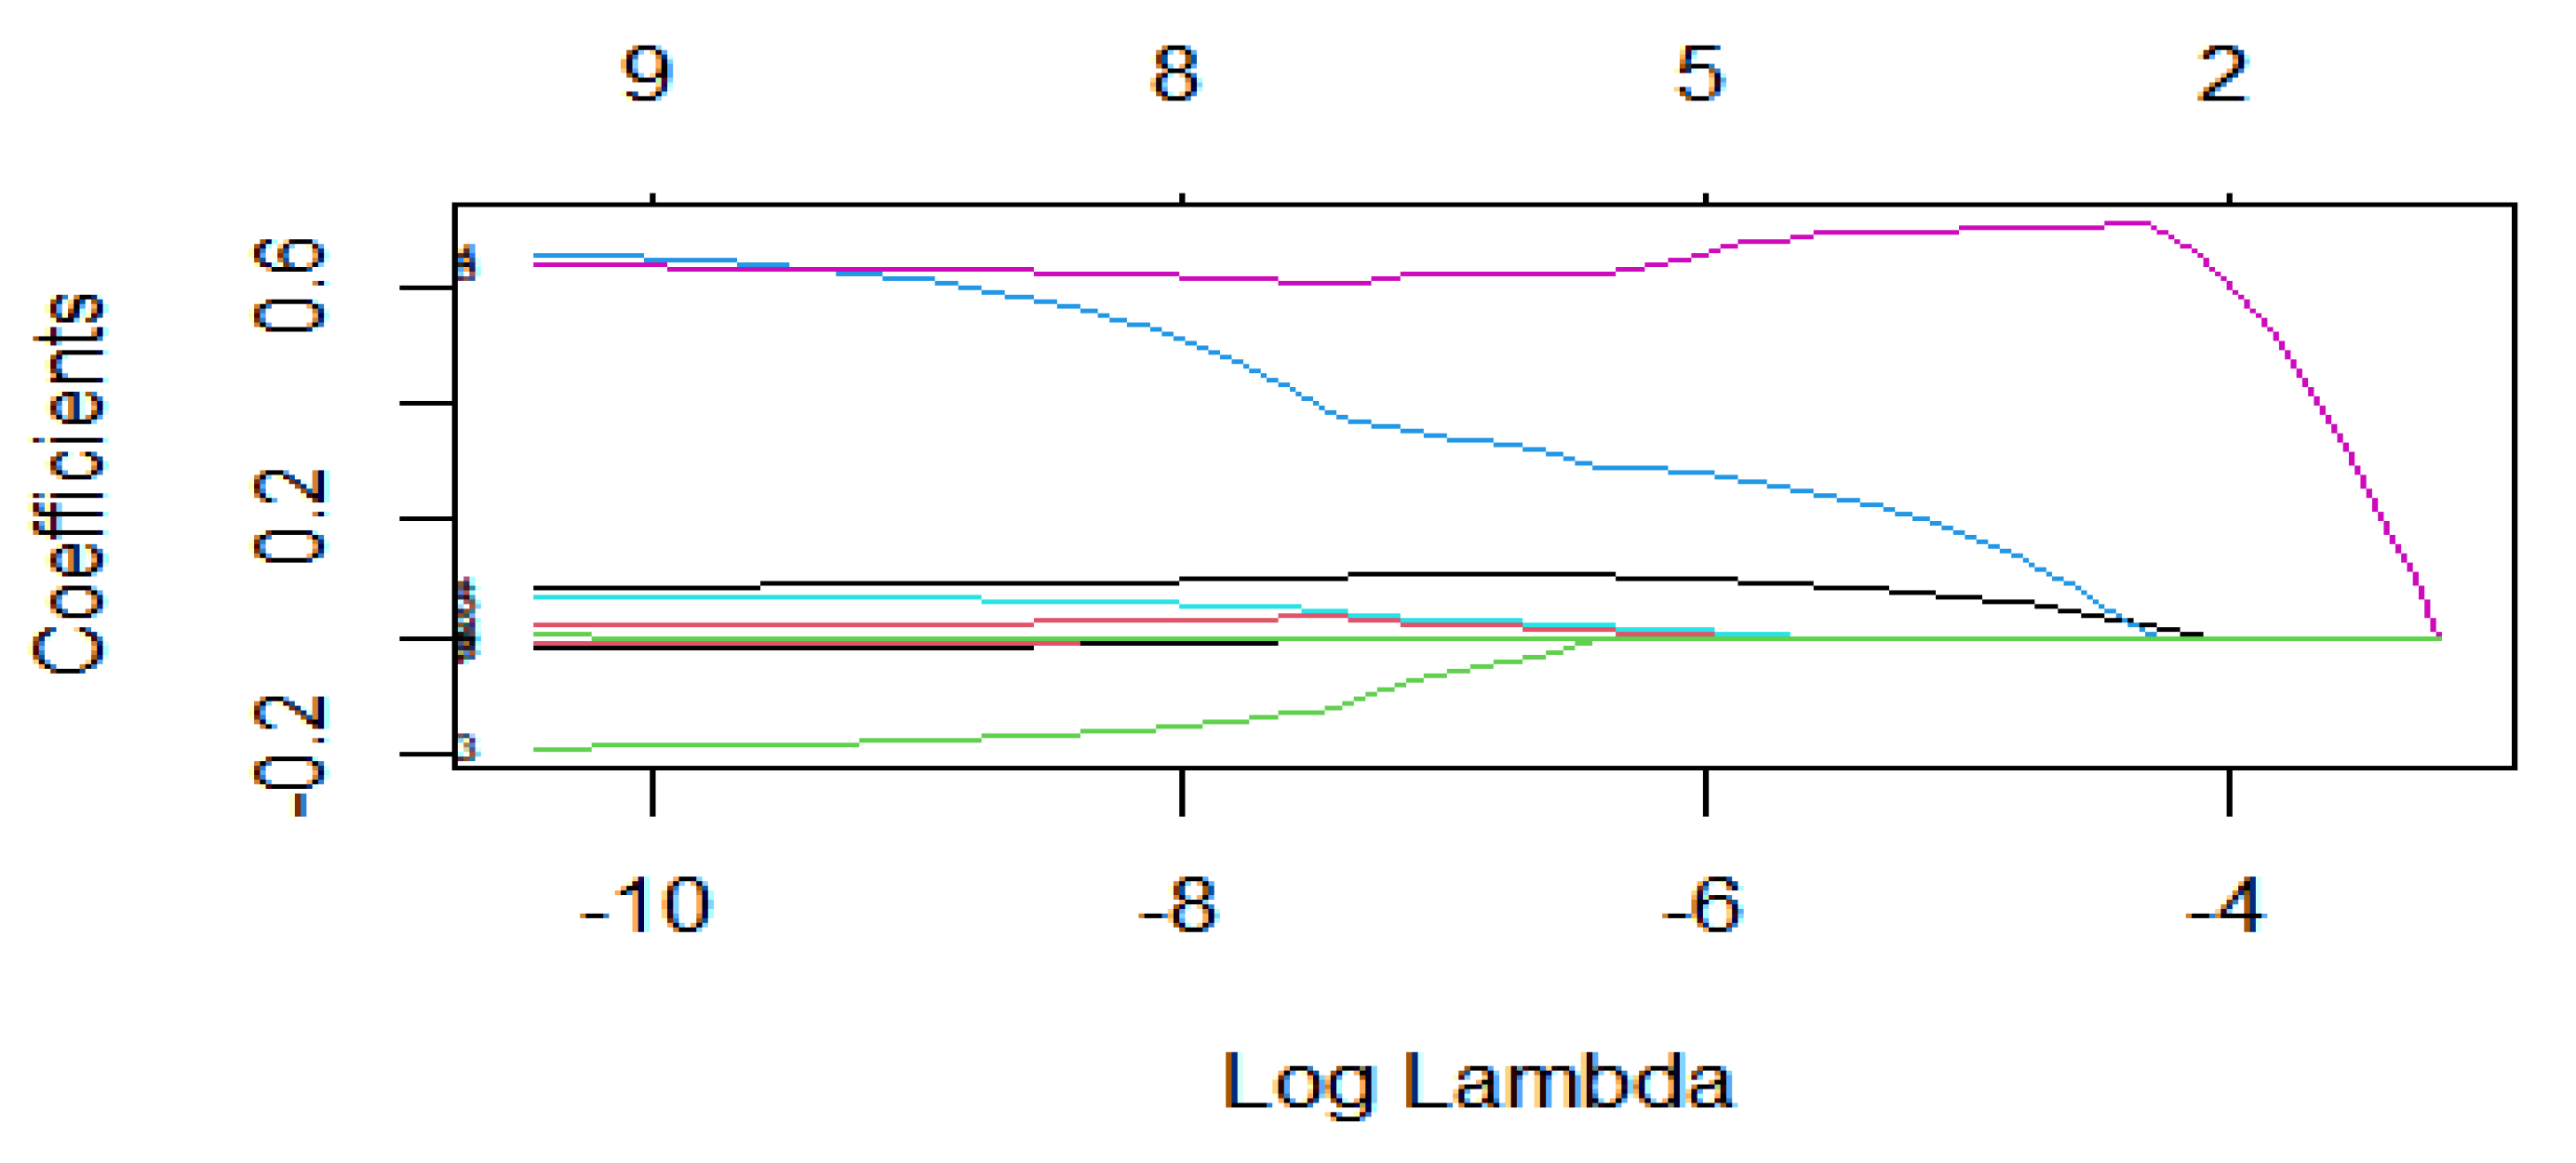
4.6. Lasso Regression

Based on ridge regression, Lasso regression was used to solve the collinearity problem [95]. The regression coefficient is shown in Figure 4.
From the Lasso regression, it can be seen that the growth of import and export trade, the increase in foreign direct investment, the growth of total retail sales of consumer goods, the increase in education expenditure, and the evolution of the tertiary industry positively contribute to China’s economic development. Among these, the effects of money supply policy and the degree of industrialization on China’s economic growth are improving at a gradual rate. As a result, the mean square error coefficient shows that the Lasso regression error is smaller and closer to the standard level.

5. Comparative Analysis of the Variables Selected Based on the Four Methods

Common to the results of least squares estimation, stepwise regression, ridge regression, and Lasso regression variable selection are the significant positive contributions of the domestic consumption level, tertiary industry, and import and export trade to China’s economic growth. Among these variables, the growth rate of total retail sales of consumer goods is the most important positive contributor to China’s economic growth, which indicates that residential consumption demand is a long-term sustainable pulling force for China’s economic development. The positive impact of the tertiary industry on China’s economic development is second only to the total retail sales of consumer goods, indicating that China’s tertiary sector has become a new economic growth area. The tertiary industry mainly includes knowledge-intensive industries and various service industries. Accelerating the development of the tertiary industry eases the pressure on natural resources and land resources, reduces environmental costs to achieve sustainable development, and helps expand employment and improve comprehensive national power. The international environment also influences domestic economic growth, and within the context of economic globalization, import and export trade can also drive China’s economic growth. Studies had shown that international trade has become one of the factors driving China’s economic growth. The volume of imports of capital and technology-intensive goods has contributed most strongly to China’s economic growth [109]. Therefore, to expand the economy, capital and technology-intensive goods need to be emphasized.
The differences in the results of the least squares estimation, stepwise regression, ridge regression, and Lasso regression variable selection are as follows. First, there is a significant difference in the degree of influence of the financial sector and industry on economic growth. Financial sector development and industrialization have a significant adverse effect on economic growth in the least squares regression estimation. Still, the impact is not substantial in the ridge regression or Lasso regression, which can be censored according to the BIC score. Second, foreign investment, fiscal expenditure, education expenditure, money supply, and the financial sector and industry have insignificant effects on the development of the domestic economy in the stepwise regression.
Comparing the variable selection results revealed that least squares regression can only be used for parameter estimation and cannot achieve variable selection. Stepwise regression suffers from variable over-censoring. Only the variables with highly significant effects are kept, and those ranging between substantial and insignificant variables are not supported, resulting in a significant bias in parameter estimation. Both ridge regression and Lasso regression can be used for variable selection without over-censoring. Comparing the mean square error values, it is clear that the Lasso regression results are closer to the standard level. Therefore, based on the above empirical study, the following regression equation can be obtained.
China’s economic growth rate = 0.32174 + 0.00882 import and export trade growth rate +0.02303 growth rate of FDI −0.18662 growth of fiscal expenditure +0.00372 growth of money supply +0.65418 total retail sales of social consumer goods growth rate +0.07189 expenditure on education +0.693368 tertiary industry growth −0.01650 financial industry added value changes −0.00703 industrial growth rate.

6. Conclusions

Firstly, the Lasso regression method has obvious advantages when there are problems such as multicollinearity among variables. Comparing ordinary least squares estimation, stepwise regression, ridge regression, and Lasso regression methods, it can also be observed that the least squares method cannot achieve variable selection criteria and the error is more prominent. The variables retained by stepwise regression are all significant, although there is excessive censoring of variables, making the estimation error larger. Lasso regression censors all insignificant variables and reduces the bias as much as possible in the variable selection.
Secondly, the consumption level plays a pivotal role in China’s economic development. The Lasso regression results show that for every 1 percentage point increase in consumption level, the domestic economy will grow by 0.6542 percentage points. In terms of demand, consumer demand makes the greatest contribution to economic growth. However, due to the COVID-19 crisis, decreased consumer demand led to a decline in GDP in the first quarter of 2020, accounting for 4.3 percentage points of the 6.8% decline in GDP. In other words, more than 60% of the decrease in GDP was driven by consumer demand for the whole year of 2020. Consumer demand represents 0.5 percentage points of the decline in GDP. From 2013 to 2019, about 60% of GDP growth on average was driven by consumer demand. Whether in the past phase of high economic growth or today’s economic shift to high-quality development, residential consumption has played a critical role in China’s financial development (Research Group of Macroeconomic Analysis and Forecast, 2021). Thus, it is necessary to further develop the fundamental effects of residential consumption on China’s economic growth and improve economic efficiency and economic development.
Thirdly, paying attention to the cultivation and development of the tertiary industry is important. The results of the Lasso regression show that each unit of growth in the tertiary sector can bring 0.63368 units of change in the size of China’s economy. Related studies have showed that the tertiary industry is a dominant force driving economic growth [44]. Starting from 2012, the share of the tertiary sector of GDP reached 45.5%, surpassing for the first time the secondary industry, which had been a pillar in the past, thereby becoming the main driving force in China’s economic development. In 2019, the share of the tertiary sector even increased to 54.3%, showing vigorous growth. Therefore, in the next phase, the role of the tertiary industry in boosting China’s economic growth needs to be fully exploited.
Fourthly, real estate market investment is weak and its contribution to economic development is not significant. In the primary stage of urbanization, the increase in and development of the real estate industry were conducive to urban and economic expansion. However, with China’s current economic development model, urbanization has shifted to a stable stage and the real estate market has become increasingly saturated. As a result, the role of real estate investment in driving China’s economy is gradually weakening; it cannot continue to vigorously support and advance the urban economy. On the other hand, a reasonable share of the real estate industry is beneficial to economic growth. Therefore, China should reduce its over-dependence on the real estate industry and scientifically assess the percentage of the real estate industry in China’s economic growth.
Fifthly, the effect of research and development expenditure on economic growth is not significant. One of the reasons may be that the role of fiscal science and technology spending has a time lag. Science and technology spending positively promotes technological progress, which can directly and indirectly influence China’s economic growth through capital formation and trade. Whether the effects are direct or indirect, they take a certain amount of time to show their impact, so there is bound to be a time lag. Related studies had found that the comprehensive effect of fiscal science and technology spending on China’s economy was most significant 8–15 years after its input, with a long time lag and a lasting impact on China’s economic growth [58]. The second reason is fact that the current assessment of the scientific research projects in China was mainly focused on relevant indicators such as patents and awards [110]. The economic and social benefits of scientific and technological achievements in terms of actual production applications have not attracted attention. Accelerating the transformation of scientific and technical achievements and applying them to social production is the only way to realize the corresponding value of scientific research expenditures. The stable development of the industry–university–research innovation alliance has facilitated the transformation of scientific and technological achievements [39]. The relevant Chinese departments can also harness these scientific and technical achievements as the basis for project assessments and to urge inventors and users of science and technology to focus on the social and economic benefits of such scientific and technological achievements.
Sixth, the Lasso regression results indicate that both the financial sector and industry do not yield the maximum gains anticipated in terms of China’s economic growth. A related analysis showed that financial development had a significant hindering effect on economic growth in western China and that financial system reform was urgently needed [66]. Additionally, other scholars have shown that deepening the financial system reform and promoting a direct financing market and small and medium-sized financial institutions could promote China’s economic growth [111].
Finally, the rise of manufacturing has undeniably brought about an unprecedented increase in China’s economic growth, although it has also inadvertently increased the cost of environmental management in China. Since 2009, China has been ranked first in the world in terms of carbon emissions. China’s leaders have announced their willingness to take on more environmental obligations, and by 2030 China’s carbon emissions intensity will be 60–65% lower than in 2005 in order to achieve carbon neutrality by 2060. Therefore, China should actively design new green and low-carbon economic growth strategies, promote green energy, and innovate low-carbon technologies. The above can be achieved through a series of measures, such as adjusting the industrial structure, optimizing the energy structure, saving energy and improving energy efficiency, promoting carbon market construction, and increasing forest carbon sinks to achieve green growth and the sustainable development of China’s economy, in turn contributing to the global green and low-carbon transition.

Author Contributions

Conceptualization, M.L.; methodology, M.L., H.S., F.O.A., H.S.u.d.K., M.H. and A.J., formal analysis, M.L., H.S., F.O.A., H.S.u.d.K. and M.H., investigation, M.L., writing—original draft preparation, M.L., H.S., F.O.A., H.S.u.d.K., M.H. and A.J., writing—review and editing, M.L., H.S., F.O.A., H.S.u.d.K., M.H. and A.J. All authors have read and agreed to the published version of the manuscript.

Funding

This study was financed by the Social Science Funding Project of Jiangsu Province (No. 18GLB024).

Institutional Review Board Statement

Not Applicable.

Informed Consent Statement

Not Applicable.

Data Availability Statement

The data presented in this study are available on request from the corresponding author.

Acknowledgments

This study was supported by Key Research Base of Universities in Jiangsu Province for Philosophy and Social Science “Research Center for Green Development and Environmental Governance”.

Conflicts of Interest

The authors declare no conflict of interest in this study. The founders did not play any role in the preparation or writing of this manuscript.

References

  1. Lucas, R.E.J. On the mechanics of economic development. J. Monet. Econ. 1988, 22, 3–42. [Google Scholar] [CrossRef]
  2. Romer, P.M. The origins of endogenous growth. J. Econ. Perspect. 1994, 8, 3–22. [Google Scholar] [CrossRef] [Green Version]
  3. Kim, J.-I.; Lau, L.J. The sources of economic growth of the East Asian newly industrialized countries. J. Jpn. Int. Econ. 1994, 8, 235–271. [Google Scholar] [CrossRef]
  4. Grossman, G.M.; Krueger, A.B. Economic growth and the environment. Q. J. Econ. 1995, 110, 353–377. [Google Scholar] [CrossRef] [Green Version]
  5. Wu, Y. Is China’s economic growth sustainable? A productivity analysis. China Econ. Rev. 2000, 11, 278–296. [Google Scholar] [CrossRef]
  6. Frolova, E.E.; Polyakova, T.A.; Dudin, M.N.; Rusakova, E.P.; Kucherenko, P.A. Information security of Russia in the digital economy: The economic and legal aspects. J. Adv. Res. L. Econ. 2018, 9, 89. [Google Scholar] [CrossRef]
  7. Fani, H.; Jiang, E.; Bagheri, E.; Al-Obeidat, F.; Du, W.; Kargar, M. User community detection via embedding of social network structure and temporal content. Inf. Process. Manag. 2020, 57, 102056. [Google Scholar] [CrossRef]
  8. Chen, J.; Zheng, H.; Wei, L.; Wan, Z.; Ren, R.; Li, J.; Li, H.; Bian, W.; Gao, M.; Bai, Y. Factor diagnosis and future governance of dangerous goods accidents in China’s ports. Environ. Pollut. 2019, 257, 113582. [Google Scholar] [CrossRef] [PubMed]
  9. Wang, X.; Du, X. Affecting Factors and Path Selection of Transformation of Economic Growth Pattern in China. J. Beijing Inst. Technol. 2018, 6, 104–111. [Google Scholar] [CrossRef]
  10. Larionova, M. The G20, BRICS and APEC in the System of International Institutions: A Piece of Good News for Global Governance. Vestn. Mezhdunarodnykh Organ. Int. Organ. Res. J. 2018, 13, 7–33. [Google Scholar] [CrossRef]
  11. Wu, Y.; Tam, V.W.; Shuai, C.; Shen, L.; Zhang, Y.; Liao, S. Decoupling China’s economic growth from carbon emissions: Empirical studies from 30 Chinese provinces (2001–2015). Sci. Total Environ. 2019, 656, 576–588. [Google Scholar] [CrossRef] [PubMed]
  12. Bank, W. The Human Capital Index 2020 Update: Human Capital in the Time of COVID-19; The World Bank: Washington, DC, USA, 2021. [Google Scholar]
  13. Higgins, P.; Zha, T.; Zhong, W. Forecasting China’s economic growth and inflation. China Econ. Rev. 2016, 41, 46–61. [Google Scholar] [CrossRef] [Green Version]
  14. Gillan, S.L.; Koch, A.; Starks, L.T. Firms and social responsibility: A review of ESG and CSR research in corporate finance. J. Corp. Financ. 2021, 66, 101889. [Google Scholar] [CrossRef]
  15. Pratt, S. The challenge of betel nut consumption to economic development: A case of Honiara, Solomon Islands. Asia-Pac. Dev. J. 2015, 21, 103–120. [Google Scholar] [CrossRef]
  16. Brander, J.A.; Dowrick, S. The role of fertility and population in economic growth. J. Popul. Econ. 1994, 7, 1–25. [Google Scholar] [CrossRef]
  17. Xu, H.; Lai, M.; Qi, P. Openness, human capital and total factor productivity: Evidence from China. J. Chin. Econ. Bus. Stud. 2008, 6, 279–289. [Google Scholar] [CrossRef]
  18. Elgin, C.; Tumen, S. Can sustained economic growth and declining population coexist? Econ. Model. 2012, 29, 1899–1908. [Google Scholar] [CrossRef]
  19. Xu, Z.X.; Ding, R.Z. Measurement, Prediction and Path Selection of the Quality of Interprovincial Economic Development in China in the New Era. Political Econ. Rev. 2020, 172–194. [Google Scholar]
  20. Sibe, J.P.; Chiatchoua, C.; Megne, M.N. The long run relationship between population growth and economic growth: A panel data analysis of 30 of the most populated countries of the world. Análisis Económico 2016, 31, 205–218. [Google Scholar]
  21. De Jong, M.; Stout, H.; Sun, L. Seeing the People’s Republic of China through the Eyes of Montesquieu: Why Sino-European Collaboration on Eco City Development Suffers from European Misinterpretations of “Good Governance”. Sustainability 2017, 9, 151. [Google Scholar] [CrossRef] [Green Version]
  22. Sasaki, H.; Mino, K. Effects of Exhaustible Resources and Declining Population on Economic Growth with Hotelling’s Rule; 2021. Available online: https://mpra.ub.uni-muenchen.de/107787/ (accessed on 11 November 2021).
  23. Chen, Y.; He, H. Post project evaluation study on distribution network construction. Heilongjiang Electr. Power 2013, 01. [Google Scholar]
  24. Yang, X.Q.; Xiong, Q.Q.; Jiang, H. A Cointegration Analysis on the Relationship between Foreign Trade and Economic Growth in GuangDong Province. J. South China Agric. Univ. 2005, 2. [Google Scholar]
  25. Huang, Q.B.; Fan, H.M. Foreign Trade, Economic Growth and Upgrading of Industrial Structure:an Empirical Test Based on China, India, and Asian “Four Little Dragons”. J. Int. Trade 2010, 2, 38–44. [Google Scholar] [CrossRef]
  26. Peng, G.Z.W.; Li, G. Influence of International Trade on Regional Economic Growth Rate—Empirical Analysis Based on the Data of Prefecture-level Cities in China. Inq. Into Econ. Issues 2020, 10, 158–169. [Google Scholar]
  27. Tongbin, Z.; Liu, F. Trade Openness and Motive Force of Economic Growth-Reexamination Based on the Channels of Capacity Utilization and Capital Deepening. J. Int. Trade 2018. [Google Scholar] [CrossRef]
  28. Frankel, J.A.; Romer, D.H. Does trade cause growth? Am. Econ. Rev. 1999, 89, 379–399. [Google Scholar] [CrossRef] [Green Version]
  29. Jarreau, J.; Poncet, S. Export sophistication and economic growth: Evidence from China. J. Dev. Econ. 2012, 97, 281–292. [Google Scholar] [CrossRef] [Green Version]
  30. Belazreg, W.; Mtar, K. Modelling the causal linkages between trade openness, innovation, financial development and economic growth in OECD Countries. Appl. Econ. Lett. 2020, 27, 5–8. [Google Scholar] [CrossRef]
  31. Benita, F.; Bansal, G.; Tunçer, B. Public spaces and happiness: Evidence from a large-scale field experiment. Health Place 2019, 56, 9–18. [Google Scholar] [CrossRef]
  32. Šlander, S.; Ogorevc, M. Transport Infrastructure and Economic Growth: From Diminishing Returns to International Trade. Lex Localis-J. Local Self-Gov. 2019, 17, 17. [Google Scholar] [CrossRef]
  33. Ampofo, G.K.M.; Cheng, J.; Asante, D.A.; Bosah, P. Total natural resource rents, trade openness and economic growth in the top mineral-rich countries: New evidence from nonlinear and asymmetric analysis. Resour. Policy 2020, 68, 101710. [Google Scholar] [CrossRef]
  34. Mtar, K.; Belazreg, W. Causal nexus between innovation, financial development, and economic growth: The case of OECD countries. J. Knowl. Econ. 2021, 12, 310–341. [Google Scholar] [CrossRef]
  35. Guo, Y.H.Y.; Huang, Y.; Yang, Y.; Liu, S.; Wang, C.; Huang, X. Impact of foreign direct investment on Small Island States’ economic growth: An analysis based on the threshold effect of tourism. Resour. Sci. 2020, 42, 2132–2144. [Google Scholar] [CrossRef]
  36. Qiu, B.Y.W.; Yang, S. A Research on the Relationship between Enterprises’ Innovation and Economic Growth within the Global Production Network-A Summary of “the Symposium on the FDI, the Enterprises’ Internationalization and China’s Industrial Development”. Manag. World 2007, 12, 136–139. [Google Scholar] [CrossRef]
  37. Xiaohui, Z. An Empirical Study on the Impact of FDI on China’s Regional Economic Development. Mod. Manag. 2014, 1003–1154. [Google Scholar] [CrossRef]
  38. Dash, R.K.; Parida, P.C. FDI services trade and economic growth in India: Empirical evidence on causal links. Empir. Econ. 2013, 45, 217–238. [Google Scholar] [CrossRef]
  39. Zhang, G.; Zhang, M.-N. The Stability of Industry-University-Research Innovation Alliance Based on Evolutionary Game. Oper. Res. Manag. Sci. 2020, 29, 67–73. [Google Scholar] [CrossRef]
  40. Moore, C.; Mayer, D.M.; Chiang, F.F.T.; Crossley, C.; Karlesky, M.J.; Birtch, T.A. Leaders Matter Morally: The Role of Ethical Leadership in Shaping Employee Moral Cognition and Misconduct. J. Appl. Psychol. 2019, 104, 123–145. [Google Scholar] [CrossRef]
  41. Veselinovic, D. Problems of (Future) Financing the Local and Regional Economic Development. Lex Localis 2013, 11, 811. [Google Scholar] [CrossRef]
  42. Elkomy, S.; Ingham, H.; Read, R. Economic and political determinants of the effects of FDI on growth in transition and developing countries. Thunderbird Int. Bus. Rev. 2016, 58, 347–362. [Google Scholar] [CrossRef] [Green Version]
  43. Arvin, M.B.; Pradhan, R.P.; Nair, M. Uncovering interlinks among ICT connectivity and penetration, trade openness, foreign direct investment, and economic growth: The case of the G-20 countries. Telemat. Inform. 2021, 60, 101567. [Google Scholar] [CrossRef]
  44. Zhile, S. An Empirical Study of the Factors Influencing Economic Growth in China. Stat. Decis. 2016, 13, 113–116. [Google Scholar] [CrossRef]
  45. Suxia, S. An Empirical Test of Urbanization, Tertiary Sector and Macroeconomic Stability. Stat. Decis. 2013, 10, 118–120. [Google Scholar] [CrossRef]
  46. Hui, L. Research on Tax Contribution of China’s Tertiary Industry. Tax. Econ. 2020, 2, 97–105. [Google Scholar]
  47. Yum, S. The interaction between knowledge-intensive business services and urban economy. Ann. Reg. Sci. 2019, 63, 53–83. [Google Scholar] [CrossRef]
  48. Domenech, J.; Escamilla, R.; Roig-Tierno, N. Explaining knowledge-intensive activities from a regional perspective. J. Bus. Res. 2016, 69, 1301–1306. [Google Scholar] [CrossRef]
  49. Lafuente, E.; Vaillant, Y.; Vendrell-Herrero, F. Territorial servitization: Exploring the virtuous circle connecting knowledge-intensive services and new manufacturing businesses. Int. J. Prod. Econ. 2017, 192, 19–28. [Google Scholar] [CrossRef] [Green Version]
  50. Cuadrado-Roura, J.R.; Maroto-Sanchez, A. Unbalanced Regional Impact of the Crisis in Spain. An Explorative Analysis through Structural Changes, Sectorial Specialization and Productivity. 2014. Available online: https://ideas.repec.org/p/wiw/wiwrsa/ersa14p322.html (accessed on 11 November 2021).
  51. Lee, J.-W.; McKibbin, W.J. Service sector productivity and economic growth in Asia. Econ. Model. 2018, 74, 247–263. [Google Scholar] [CrossRef] [Green Version]
  52. Wood, J.; Oh, J.; Park, J.; Kim, W. The relationship between work engagement and work-life balance in organizations: A review of the empirical research. Hum. Resour. Dev. Rev. 2020, 19, 240–262. [Google Scholar] [CrossRef]
  53. Wang, X.; Yang, X.; Zhou, X. The effect of Real Exchange Rate of RMB to US Dollar on China’s economic growth: Based on the Mediating Effect of the Balance of Payments. World Econ. Stud. 2020, 9, 52–64. [Google Scholar] [CrossRef]
  54. Ding-xiang, M. Cointegration Analysis on the Relationship between Monetary Policy, Fiscal Policy and Economic Growth in China. 2006. Available online: https://journals.sagepub.com/doi/full/10.1177/2277978720906066 (accessed on 11 November 2021).
  55. Gunasinghe, C.; Selvanathan, E.; Naranpanawa, A.; Forster, J. The impact of fiscal shocks on real GDP and income inequality: What do Australian data say? J. Policy Model. 2020, 42, 250–270. [Google Scholar] [CrossRef]
  56. Redding, S.J.; Rossi-Hansberg, E. Quantitative spatial economics. Annu. Rev. Econ. 2017, 9, 21–58. [Google Scholar] [CrossRef] [Green Version]
  57. Nsafoah, D.; Serletis, A. Monetary Policy and Interest Rate Spreads. Open Econ. Rev. 2020, 31, 707–727. [Google Scholar] [CrossRef]
  58. Donglin, X.; Yunnan, G. The Dynamic Analysis on the Economic, Growth Time Lag Effect of the R&D Investment. J. Zhongnan Univ. Econ. Law 2007, 6, 36–43. [Google Scholar]
  59. Lei, W.; Liu, L.; Hafeez, M.; Sohail, S. Do economic policy uncertainty and financial development influence the renewable energy consumption levels in China? Environ. Sci. Pollut. Res. 2021, 1–10. [Google Scholar] [CrossRef] [PubMed]
  60. Ouyang, Y.F.Y.; Wang, S. The Scale Effect and Evolution Mechanism of Resident Consumption. Econ. Res. J. 2016, 51, 56–68. [Google Scholar]
  61. Xu, J.L.W. Statistical Test on Change of Residents’ Consumption Willingness Under New Normal of Economy. Stat. Decis. 2019, 35, 95–98. [Google Scholar] [CrossRef]
  62. Tao, F.; Zhang, Y.; Cheng, Y.; Ren, J.; Wang, D.; Qi, Q.; Li, P. Digital twin and blockchain enhanced smart manufacturing service collaboration and management. J. Manuf. Syst. 2020. [Google Scholar] [CrossRef]
  63. Qiao, H.; Zheng, F.; Jiang, H.; Dong, K. The greenhouse effect of the agriculture-economic growth-renewable energy nexus: Evidence from G20 countries. Sci. Total Environ. 2019, 671, 722–731. [Google Scholar] [CrossRef]
  64. Cui, G.; Gao, T. Real Estate Investment, Resident Consumption And Urban Economic Growth. Syst. Eng. Theory Pract. 2020, 40. [Google Scholar] [CrossRef]
  65. Yang, L.X.J.; Zhang, N. Dynamics Estimates on the Contribution Rate of Fiscal Expenditure on Science and Technology to Provincial Regional Technology Innovation. Fisc. Sci. 2020, 49, 121–130. [Google Scholar] [CrossRef]
  66. Liu, J.Q.; Ru, S.F. Research on Factors of Economic Growth and Path Selection for High-Quality Development of Western China. Inq. Into Econ. Issues 2019, 9, 82–90. [Google Scholar]
  67. Yang, Q.G.Y. A Study of the Relationship between Financial Development and Economic Growth in the “Belt and Road” Countries. J. Xiamen Univ. Arts Soc. Sci. 2020, 3, 79–91. [Google Scholar] [CrossRef]
  68. Jun, Z. Capital Formation, Industrialization and Economic Growth: Understanding China’s Economic Reform. Econ. Res. J. 2002, 6, 3–13. [Google Scholar]
  69. Cai, Z.; Hong, H.; Wang, S. Econometric modeling and economic forecasting. J. Manag. Sci. Eng. 2018, 3, 179–182. [Google Scholar] [CrossRef]
  70. Kiran, B.; Kumar, R.; Deshmukh, D. Perspectives of microalgal biofuels as a renewable source of energy. Energy Convers. Manag. 2014, 88, 1228–1244. [Google Scholar] [CrossRef]
  71. Ferreira-Lopes, A.; Linhares, P.; Martins, L.F.; Sequeira, T.N. Quantitative easing and economic growth in Japan: A meta-analysis. J. Econ. Surv. 2021. [Google Scholar] [CrossRef]
  72. Woo, Y.; Kim, E.; Lim, J. The impact of education and R&D investment on regional economic growth. Sustainability 2017, 9, 676. [Google Scholar]
  73. Hamermesh, D.S.; Meng, X.; Zhang, J. Dress for success—does primping pay? Labour Econ. 2002, 9, 361–373. [Google Scholar] [CrossRef]
  74. Haraguchi, N.; Martorano, B.; Sanfilippo, M. What factors drive successful industrialization? Evidence and implications for developing countries. Struct. Chang. Econ. Dyn. 2019, 49, 266–276. [Google Scholar] [CrossRef]
  75. Lim, C.Y. Economic Growth And Exchange Rate: A New Road Ahead For Indonesia. Singap. Econ. Rev. 2015, 60, 1550010. [Google Scholar] [CrossRef]
  76. Zhang, J.; Wang, L.; Wang, S. Financial development and economic growth: Recent evidence from China. J. Comp. Econ. 2012, 40, 393–412. [Google Scholar]
  77. Rahman, A.; Khan, M.A.; Charfeddine, L. Regime-specific impact of financial reforms on economic growth in Pakistan. J. Policy Model. 2020, 43, 161–182. [Google Scholar] [CrossRef]
  78. Hsu, C.-C.; Quang-Thanh, N.; Chien, F.; Li, L.; Mohsin, M. Evaluating green innovation and performance of financial development: Mediating concerns of environmental regulation. Environ. Sci. Pollut. Res. 2021, 1–12. [Google Scholar] [CrossRef]
  79. Sghaier, I.M. Remittances and Economic Growth in MENA Countries: The Role of Financial Development. Econ. Altern. 2021, 43–59. [Google Scholar]
  80. Ren, H.; Folmer, H.; Van der Vlist, A.J. What role does the real estate–construction sector play in China’s regional economy? Ann. Reg. Sci. 2014, 52, 839–857. [Google Scholar] [CrossRef]
  81. Lester, T.W. Dedicating new real estate transfer taxes for energy efficiency: A revenue option for scaling up Green Retrofit Programs. Energy Policy 2013, 62, 809–820. [Google Scholar] [CrossRef]
  82. Han, Y.; Zhang, H.; Zhao, Y. Structural Evolution of Real Estate Industry in China: 2002–2017. Struct. Chang. Econ. Dyn. 2021, 57, 45–56. [Google Scholar] [CrossRef]
  83. Akinboade, O.A. The relationship between financial deepening and economic growth in Tanzania. J. Int. Dev. J. Dev. Stud. Assoc. 2000, 12, 939–950. [Google Scholar] [CrossRef]
  84. Henisz, W.J.; Mansfield, E.D.; Von Glinow, M.A. Conflict, Security, and Political Risk: International Business in Challenging Times; Springer: Berlin/Heidelberg, Germany, 2010. [Google Scholar]
  85. Samy, M.; Barakat, S.; Ramadan, H. Techno-economic analysis for rustic electrification in Egypt using multi-source renewable energy based on PV/wind/FC. Int. J. Hydrogen Energy 2020, 45, 11471–11483. [Google Scholar] [CrossRef]
  86. Machoski, E.; de Araujo, J.M. Corruption in public health and its effects on the economic growth of Brazilian municipalities. Eur. J. Health Econ. 2020, 21. [Google Scholar] [CrossRef]
  87. Fan, Q.; Sun, X. An Empirical Study Of The Factors Influencing Economic Growth In China Based On Principal Component Regression. Stat. Decis. 2012, 17, 144–146. [Google Scholar] [CrossRef]
  88. Ran-ran, W. Mechanism Analysis of Foreign Trade Structure Transformation to the Promotion of the Economic Growth Pattern Transformation. J. Shandong Inst. Bus. Technol. 2009, 1. [Google Scholar]
  89. Jinhua, Z. An Empirical Study of the Factors Influencing Economic Growth in Shanghai Based on the Lasso Method. Stat. Decis. 2013, 01, 154–156. [Google Scholar]
  90. Jennrich, R.I.; Sampson, P.F. Application of Stepwise Regression to Non-Linear Estimation. Technometrics 1968, 10, 63–72. [Google Scholar] [CrossRef]
  91. Cronbach, L.J. Statistical tests for moderator variables: Flaws in analyses recently proposed. Psychol. Bull. 1987, 102, 414–417. [Google Scholar] [CrossRef]
  92. Okunlola, F.A.; Osuma, G.O.; Omankhanlen, E.A. Agricultural finance and economic growth: Evidence from Nigeria. Bus. Theory Pract. 2019, 20, 467–475. [Google Scholar] [CrossRef] [Green Version]
  93. Rao, C.; Yan, B. Study on the interactive influence between economic growth and environmental pollution. Environ. Sci. Pollut. Res. 2020, 27, 39442–39465. [Google Scholar] [CrossRef]
  94. Frame, J. Modelling national technological capacity with patent indicators. Scientometrics 1991, 22, 327–339. [Google Scholar] [CrossRef]
  95. Zhou, Y.; Wen, Y.; Yang, J. Study on Influencing Factors of Future Price Expectation Index of Urban Residents. Stat. Decis. 2020, 36. [Google Scholar] [CrossRef]
  96. Weng, K.; Liu, M.; Liu, Q. An Integrated Prediction Model of PM2.5 Concentration based on TPE-XGBOOST and LassoLars. Syst. Eng. Theory Pract. 2020, 40, 748–760. [Google Scholar] [CrossRef]
  97. Gu, Z.-T.S.Z.; Song, Z.F.; Li, Y. Study on the Construction of Enhanced Index Fund Based on LASSO Variable Selection and Multi-factor Model. J. Appl. Stat. Manag. 2020, 39, 417–428. [Google Scholar] [CrossRef]
  98. Brown, W.G.; Beattie, B.R. Improving estimates of economic parameters by use of ridge regression with production function applications. Am. J. Agric. Econ. 1975, 57, 21–32. [Google Scholar] [CrossRef]
  99. Hoerl, A.E.; Kennard, R. Ridge regression: Biased estimation for nonorthogonal problem. Technometrics 2000, 42, 80–86. [Google Scholar] [CrossRef]
  100. Hao, Y.; Zheng, S.; Zhao, M.; Wu, H.; Guo, Y.; Li, Y. Reexamining the relationships among urbanization, industrial structure, and environmental pollution in China—New evidence using the dynamic threshold panel model. Energy Rep. 2020, 6, 28–39. [Google Scholar] [CrossRef]
  101. Panagiotelis, A.; Athanasopoulos, G.; Hyndman, R.J.; Jiang, B.; Vahid, F. Macroeconomic forecasting for Australia using a large number of predictors. Int. J. Forecast. 2019, 35, 616–633. [Google Scholar] [CrossRef] [Green Version]
  102. Yüzbaşı, B.; Ahmed, S.E.; Aydın, D. Ridge-type pretest and shrinkage estimations in partially linear models. Stat. Pap. 2020, 61, 869–898. [Google Scholar] [CrossRef]
  103. Chan-Lau, M.J.A. Lasso Regressions and Forecasting Models in Applied Stress Testing; International Monetary Fund: Washington, DC, USA, 2017. [Google Scholar]
  104. Tibshirani, R. Regression shrinkage and selection via the lasso: A retrospective. J. R. Stat. Soc. Ser. B (Stat. Methodol.) 2011, 73, 273–282. [Google Scholar] [CrossRef]
  105. Rodríguez-Puebla, C.; Encinas, A.H.; García-Casado, L.A.; Nieto, S. Trends in warm days and cold nights over the Iberian Peninsula: Relationships to large-scale variables. Clim. Chang. 2010, 100, 667–684. [Google Scholar] [CrossRef]
  106. Schneider, U.; Wagner, M. Catching growth determinants with the adaptive lasso. Ger. Econ. Rev. 2012, 13, 71–85. [Google Scholar] [CrossRef] [Green Version]
  107. Cheung, A.; Hennebry-Leung, M. Exploring an ESL teachers’ beliefs and practices of teaching literary texts: A case study in Hong Kong. Lang. Teach. Res. 2020, 1362168820933447. [Google Scholar] [CrossRef]
  108. Bai, L.; Hu, J.W.; Ji, J.; Si, H. An Empirical Study on Deconstructing Economic Growth Dynamics Based on Industrial Electricity Big Data Backwards-Jiangsu Province as an Example. Acad. Bimest. 2020, 1150–1158. [Google Scholar] [CrossRef]
  109. Chu, J.; Zhu, H.L. Co-integration Test of the Relationship Between International Trade and Economic Growth in China. Stat. Decis. 2020, 36, 116–120. [Google Scholar] [CrossRef]
  110. Zhang, H.; Huo, G.q.; Wang, M.; Wu, Z. Strategic Performance Evaluation of Transformation of Scientific and Technology Achievements: An Empirical Study Based on National Progress Prize in Scientific. Sci. Sci. Manag. S. T 2020, 41, 7–25. [Google Scholar]
  111. Zeng, G.; Ma, Y.-J. The Influences of Financial Structure in Economic Growth of the East, Middle and West Regions: Empirical Analysis Based on China’s Province Panel Data. Econ. Probl. 2017, 9, 34–40. [Google Scholar] [CrossRef]
Figure 1. Path diagram of ridge regression.
Applsci 11 10832 g001
Figure 2. Ridge regression coefficient.
Applsci 11 10832 g002
Figure 3. BIC scores.
Applsci 11 10832 g003
Figure 4. Lasso regression coefficient.
Applsci 11 10832 g004
Table 1. Description of variables and indicators.
Variable ClassificationVariable NameMeaningData Source
Explained variableChina’s economic growth rateEconomic growth levelGDP
Explanatory variablesImport and export growth rateInternational trade development levelTotal import and export of goods
Exchange rateExchange rate levelExchange rate of RMB to US dollar
The growth rate of FDIThe level of capital nationalizationAmount of world FDI utilized by China
The growth of fiscal expenditureFiscal policyFiscal expenditure over the years
The growth of money supplyMonetary PolicyThe amount of money in circulation in a country
The total retail sales of social consumer goods growth rateConsumption levelTotal retail sales of consumer goods
Expenditure on educationEducational levelFinancial expenditures for education
The growth rate of expenditure on science and technologyScience and technology levelFinancial spending on science and technology
Tertiary industry growthTertiary industry development levelAdded value of tertiary industry
The financial industry added value changesFinancial development levelAdded value of the financial industry
Industrial growth rateDegree of industrializationAdded value of financial industry
The real estate industry added valueReal estate industry development levelAdded value of real estate industry
Table 2. Correlation coefficient.
China’s Economic Growth Rate
VariablesCorrelation Coefficientp-ValueVariablesCorrelation Coefficientp-Value
Import and export growth rate0.567 **0.009Expenditure on education0.721 **0.000
Exchange Rates0.1810.444The growth rate of expenditure on science and technology0.1110.640
The growth rate of FDI0.629 **0.003Tertiary industry growth0.906 **0.000
The growth of fiscal expenditure0.614 **0.004Financial industry added value changes−0.506 *0.023
The growth of money supply0.682 **0.001Industrial growth rate0.689 **0.001
The total retail sales of social consumer goods growth rate0.743 **0.000Real estate industry added value−0.4180.067
Note: ** indicates a significant correlation at the 0.01 level (two-sided); * indicates a significant correlation at the 0.05 level (two-sided).
Table 3. Least squares regression coefficient.
BetaTSig.
Constant term 2.5330.030
Import and export growth rate0.2752.7530.020
Growth rate of FDI0.0380.3960.701
The growth of fiscal expenditure−0.238−1.7680.108
The growth of money supply0.0050.0540.958
The total retail sales of social consumer goods growth rate0.5784.2410.002
Expenditures on education0.2011.6680.126
Tertiary industry growth0.5193.6420.005
Financial industry added value changes−0.539−2.8250.018
Industrial growth rate−0.550−2.3480.041
Table 4. Collinearity diagnosis.
VariablesCollinearity Statistics
Tolerable ErrorVIF
Import and export growth rate0.2553.921
The growth rate of FDI0.2803.577
The growth of fiscal expenditure0.1407.142
The growth of money supply0.2853.508
Total retail sales of social consumer goods growth rate0.1377.313
Expenditures on education0.1745.739
Tertiary industry growth0.1258.010
Financial industry added value changes0.07014.369
Industrial growth rate0.04621.658
Table 5. Comparison of regression coefficients.
Least Squares MethodStepwise Regression CoefficientRidge Regression CoefficientLasso Regression Coefficient
Intercept −0.0340.057220.32174
Import and export growth rate0.2750.1160.088240.08820
Growth rate of FDI0.03800.077010.02303
The growth of fiscal expenditure−0.2380−0.13236−0.18662
The growth of money supply0.00500.047120.00372
The total retail sales of social consumer goods growth rate0.5780.3480.3460940.65418
Expenditures on education0.20100.079510.07189
Tertiary industry growth0.5190.6860.464810.63368
Financial industry added value changes −0.5390−0.00432−0.01650
Industrial growth rate−0.5500−0.00077−0.00703
Error 0.00015312140.000051017S53
Publisher’s Note: MDPI stays neutral with regard to jurisdictional claims in published maps and institutional affiliations.

