
The Melt Enthalpy of Pu6Fe


Abstract
:1. Introduction
2. Original Analysis
3. Reanalysis
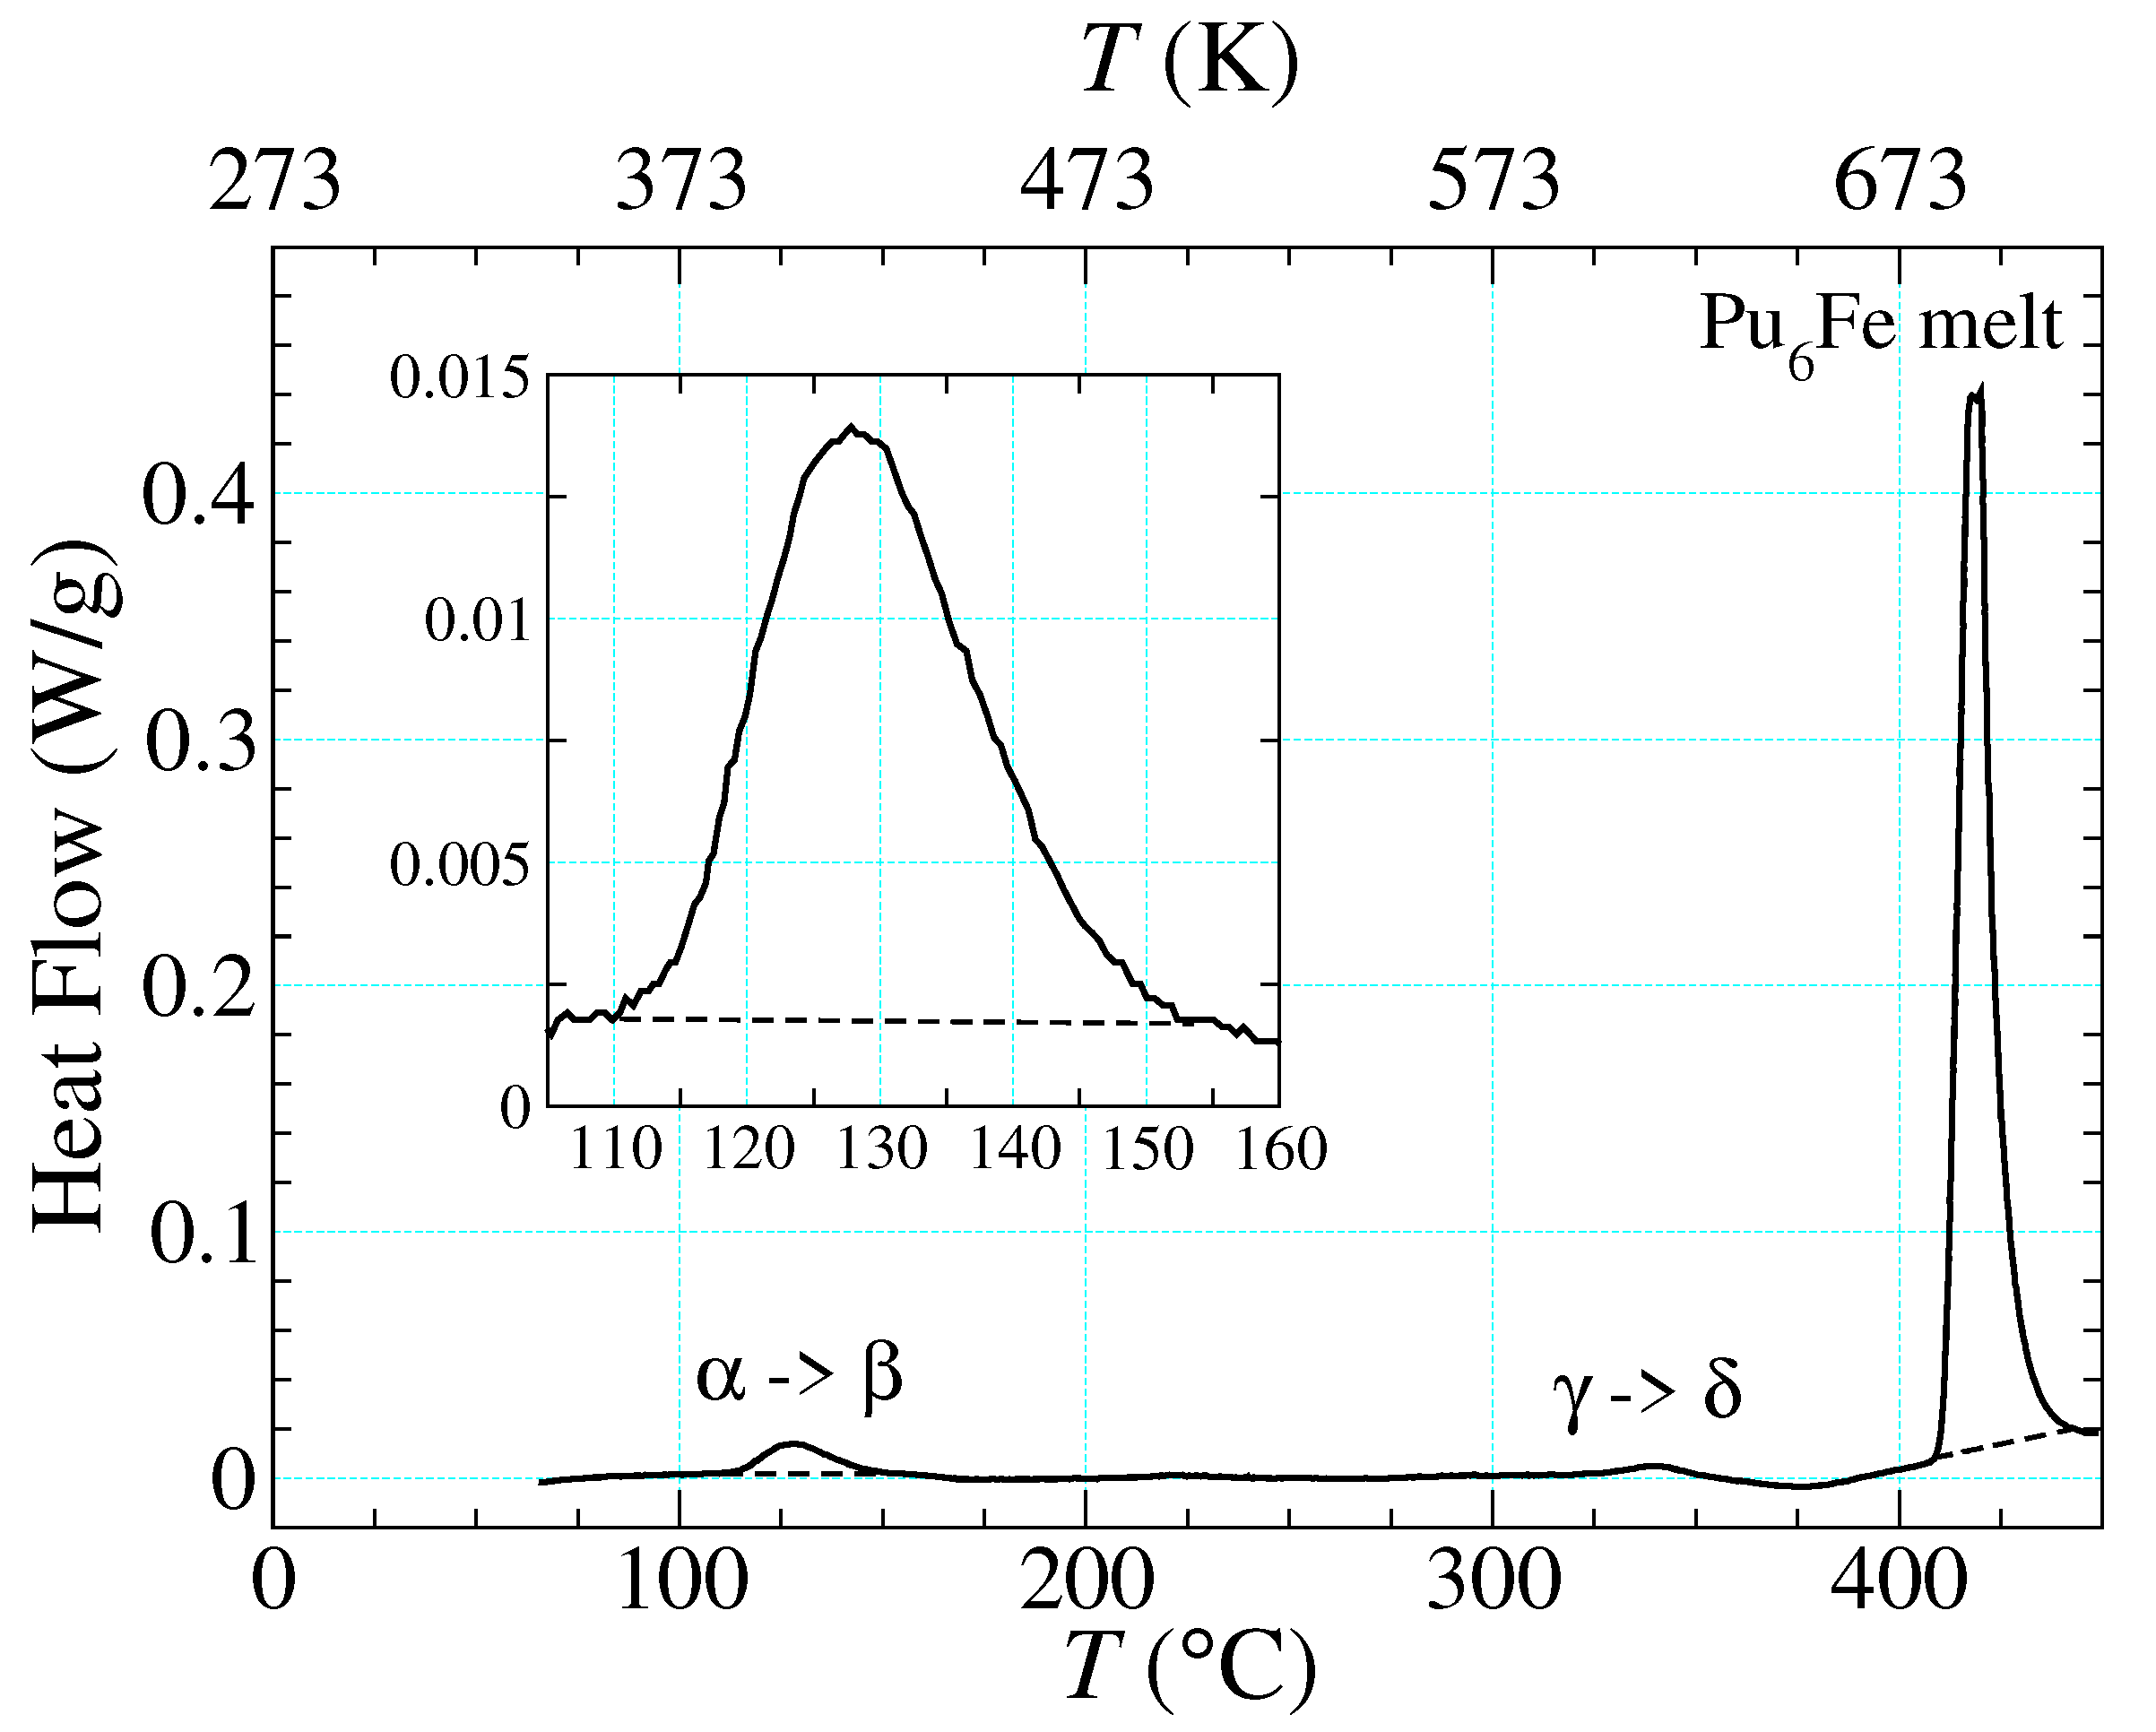
3.1. Composition and Heat Flow
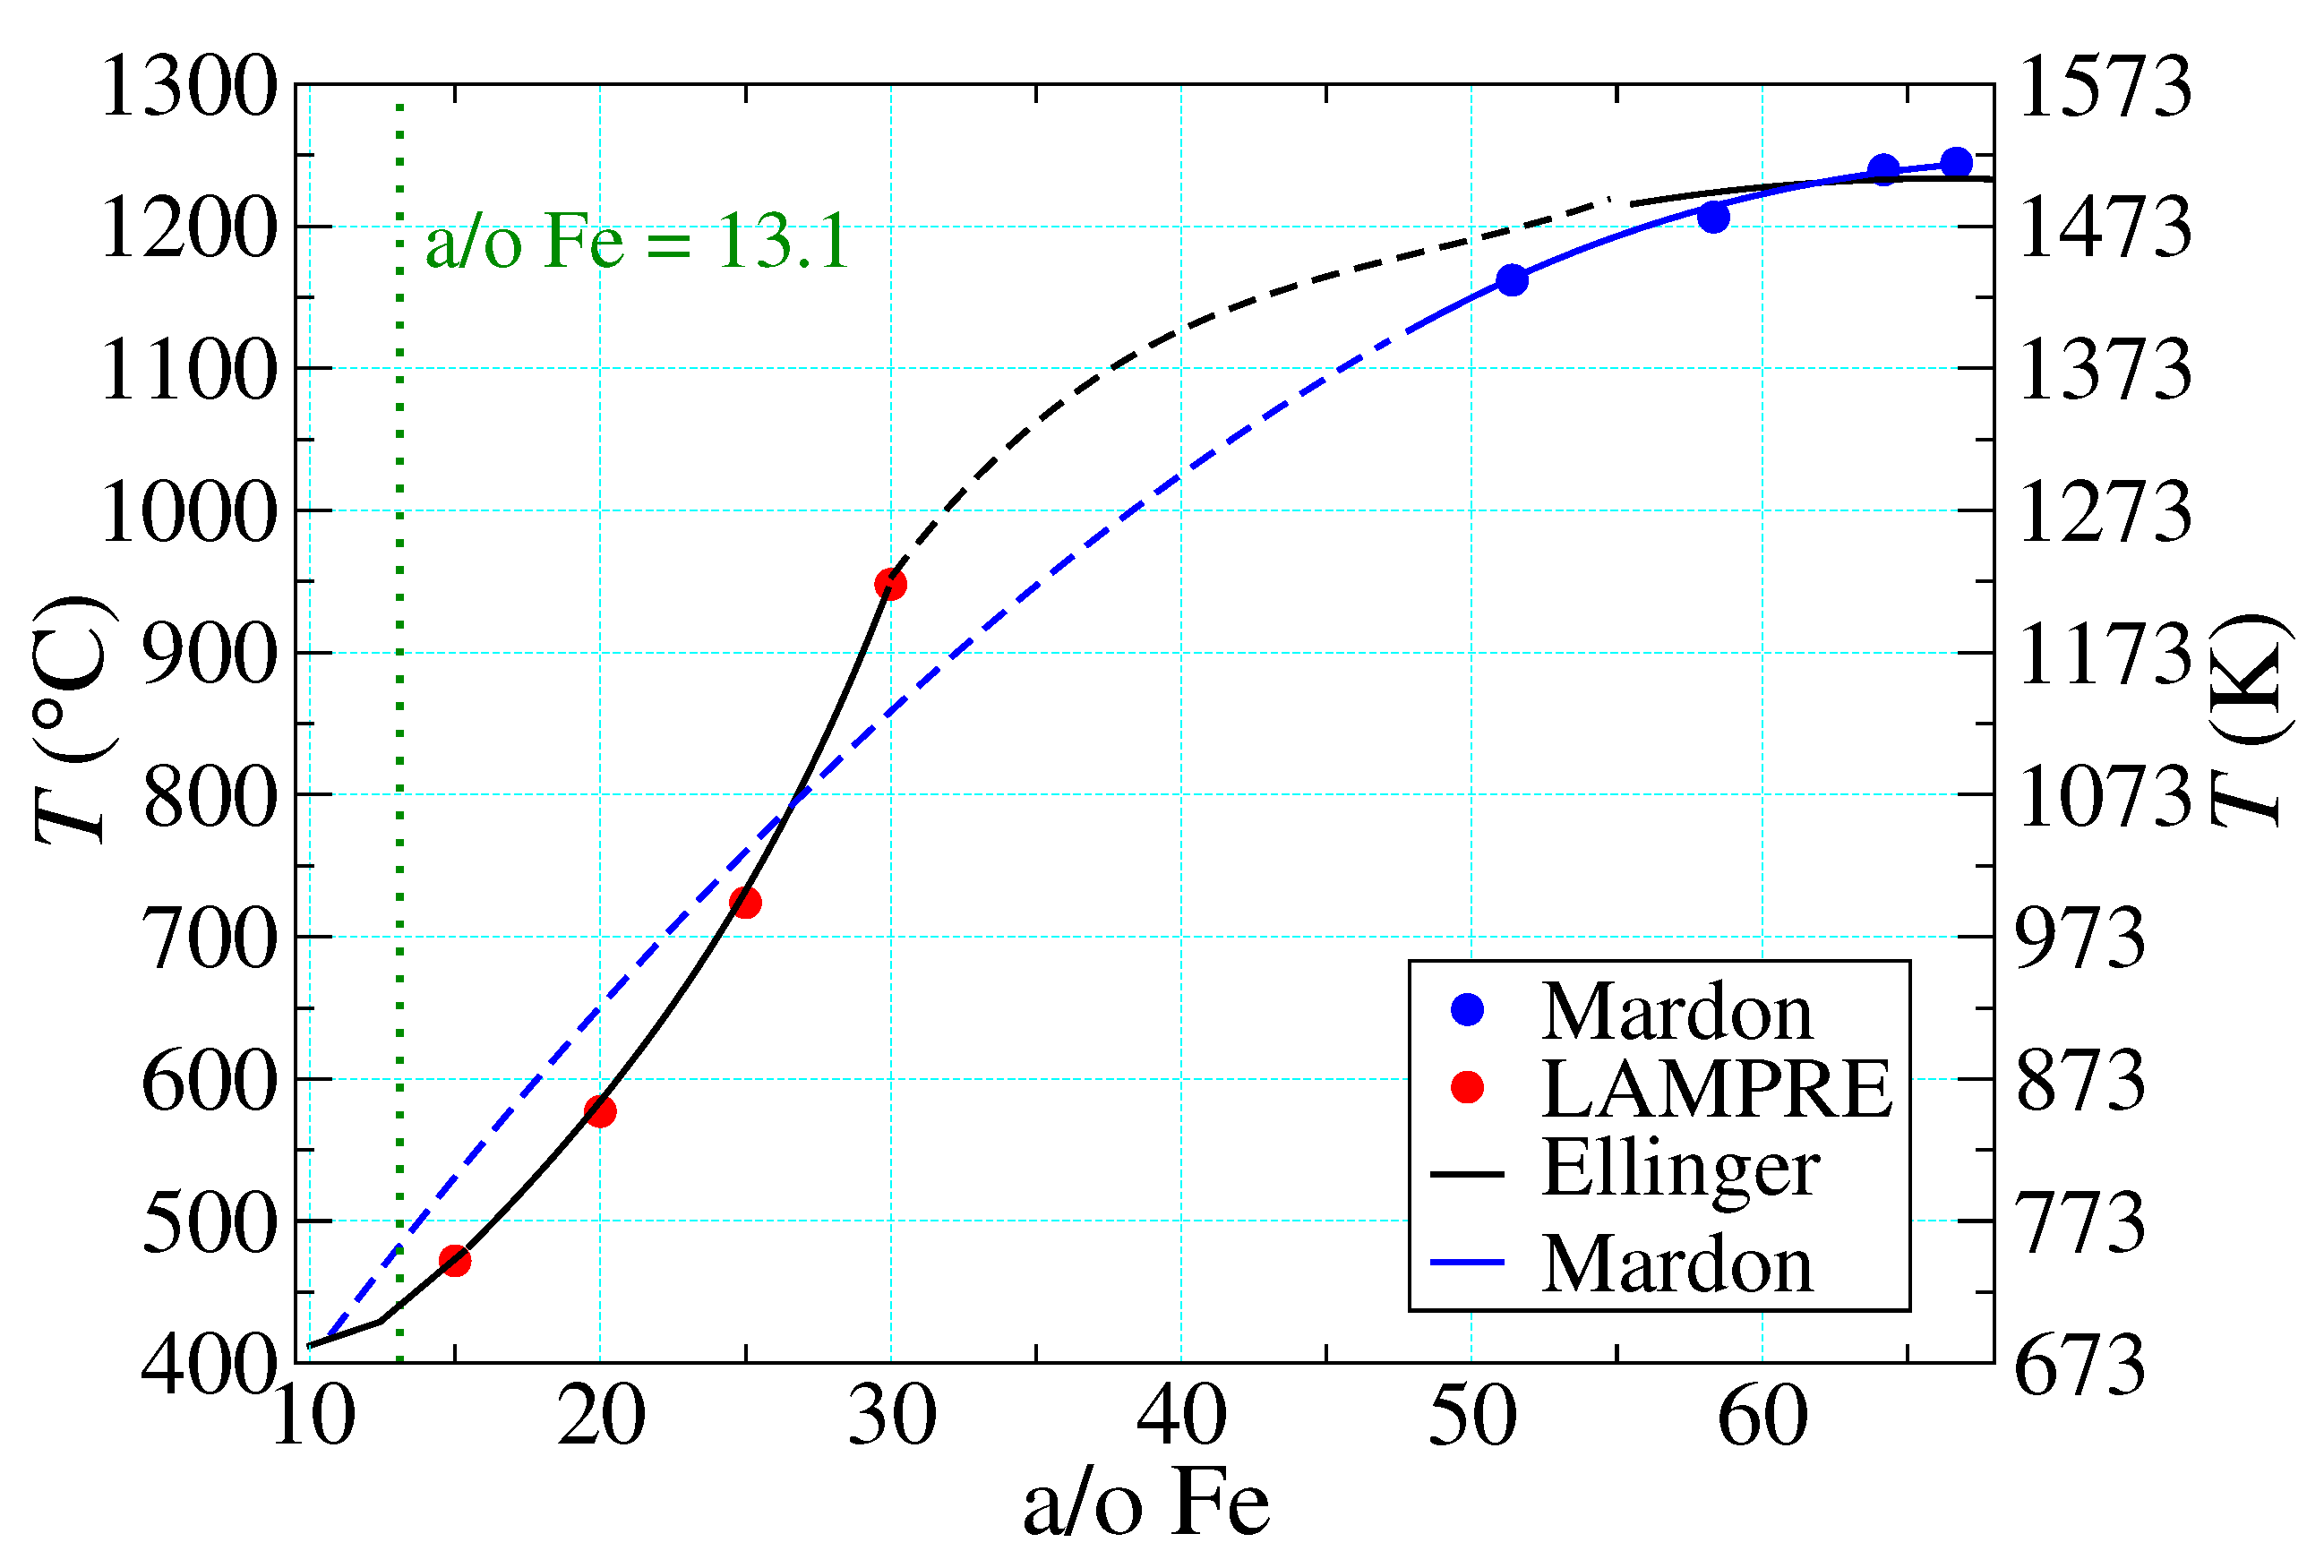
3.2. Phase Diagram
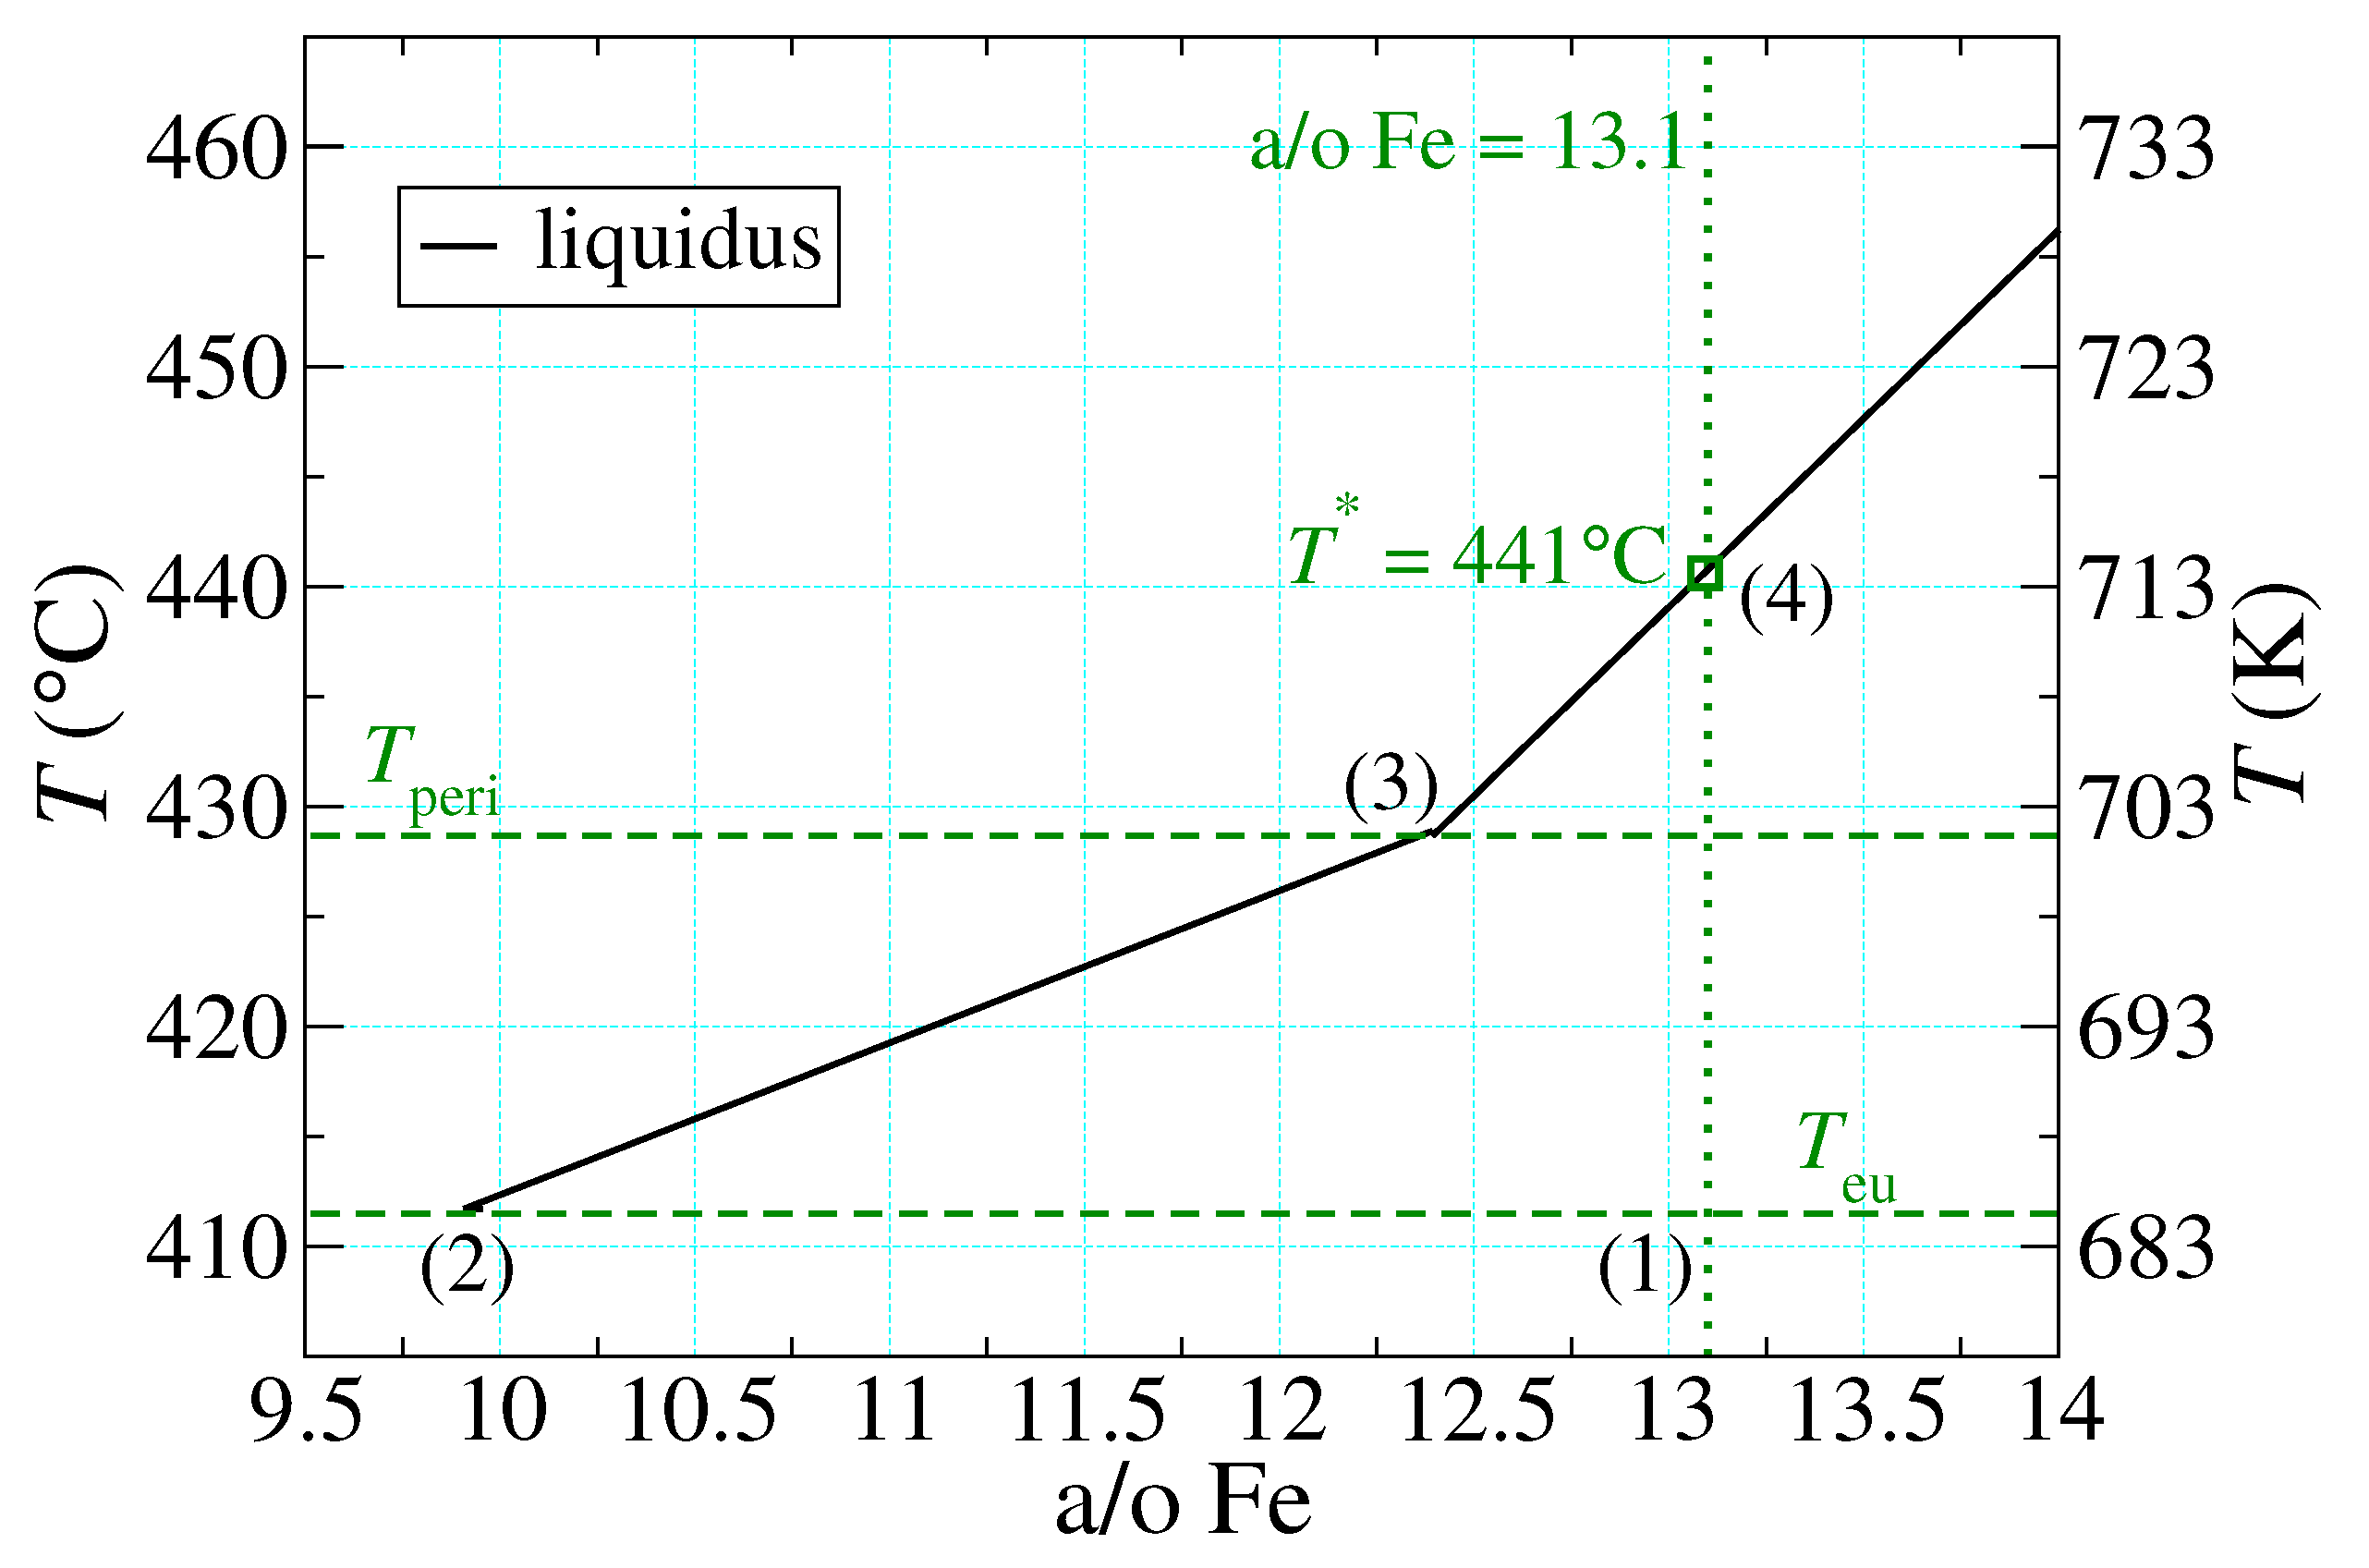
- {1}
- The properties of “supercooled” liquid Pu and Fe are the same as those of the normal liquids, which do not form until temperatures much higher than those of the PuFe liquidus curve are reached. In particular, their thermal response is governed by the same (constant) specific heats characteristic of the normal liquids.
- {2}
- Liquid Pu and liquid Fe mix ideally, as described by Equation (11) below.
- {3}
- Once all of the excess Pu has melted at , the remaining PuFe melts linearly in T. This is described by Equation (10) below.
3.3. Materials, Conventions, and Data Sources

| Quantity | C/K | Source |
|---|---|---|
| 411.5/684.5 | Reference [3] | |
| 428/701 | Reference [5] | |
| 127/400 | Reference [14] | |
| 213/486 | Reference [14] | |
| 323/596 | Reference [14] | |
| 468/741 | Reference [9,14] | |
| 486/759 | Reference [9,14] | |
| 640/913 | Reference [9] | |
| 1536/1809 | Reference [15] | |
| 1134/1407 | Reference [9] | |
| 827/1100 | Reference [16] |
| Quantity | J/mol/K | Source |
|---|---|---|
| 17.619 + 45.552T | Reference [9] | |
| 27.416 + 13.060T | Reference [9] | |
| 22.023 + 22.959T | Reference [9] | |
| 28.4781 + 0.010807T | Reference [9] | |
| 35.56 | Reference [9] | |
| 33.72 | Reference [9] | |
| 42.80 | Reference [9] | |
| 46.024 | Reference [15] | |
| 54.46 | Reference [9] | |
| 99.823 | Reference [15] | |
| ) | 8344 | this work |
| Quantity | kJ/mol | Source |
|---|---|---|
| 2.766 | Reference [9] | |
| 111.65 (15.95) | Reference [16], this work | |
| 8.470 | Reference [9] | |
| 3.706 | Reference [9] | |
| 0.478 | Reference [9] | |
| 0.713 | Reference [9] | |
| 0.065 | Reference [9] | |
| 1.711 | Reference [9] |
3.4. Evaluating
3.5. Liquid Heating Contribution
3.5.1. Liquid Composition
3.5.2. Ideal Mixing
4. Results and Discussion
4.1. Corrected Result
4.2. Consistency
4.3. Uncertainty Estimates
5. Summary and Conclusions
Author Contributions
Funding
Institutional Review Board Statement
Informed Consent Statement
Acknowledgments
Conflicts of Interest
Abbreviations
| CALPHAD | Calculation of Phase Diagrams |
| DSC | Differential Scanning Calorimetry |
| LAMPRE | Los Alamos Molten Plutonium Reactor |
| NIST-JANAF | National Institute of Standards and Technology—Joint Army-Navy-Air Force |
| STR | Schwartz, Tobash, and Richmond (authors of Reference [3]) |
References
- Hecker, S. Plutonium and Its Alloys: From atoms to microstructure. Los Alamos Sci. 2000, 26, 290–335. [Google Scholar]
- Moore, K.; Wall, M.; Schwartz, A. Experimental verification of the existence and structure of ζ Pu6Fe in a Pu-Ga alloy. J. Nucl. Mater. 2002, 306, 213–217. [Google Scholar] [CrossRef]
- Schwartz, D.S.; Tobash, P.H.; Richmond, S. Thermal Analysis of Pu6Fe Synthesized from Hydride Precursor. MRS Proc. 2014, 1683. [Google Scholar] [CrossRef]
- Konobeevsky, S.T. Equilibrium Diagrams of Certain Systems of Plutonium. In Proceedings of a Conference on Peaceful Uses of Atomic Energy; English Language Edition; Consultants Bureau, Inc.: New York, NY, USA, 1955; p. 211. [Google Scholar]
- Mardon, P.G.; Haines, H.R.; Pearce, J.H.; Waldron, M.B. The Plutonium-Iron System. J. Inst. Met. 1957, 86, 166–171. [Google Scholar]
- Schonfeld, F.W. Plutonium Phase Diagrams Studied at Los Alamos. In The Metal Plutonium; Coffinberry, A.S., Miner, W.N., Eds.; The University of Chicago Press: Chicago, IL, USA, 1961; pp. 240–254. [Google Scholar]
- Ellinger, F.H.; Miner, W.N.; O’Boyle, D.R.; Schonfeld, F.W. Constitution of Plutonium Alloys; Technical Report LA-3870; Los Alamos Scientific Laboratory: Los Alamos, NM, USA, 1968. [Google Scholar]
- Moore, E.E.; Turchi, P.E.; Landa, A.; Sönderlind, P.; Oudot, B.; Belof, J.L.; Stout, S.A.; Perron, A. Development of a CALPHAD Thermodynamic Database for Pu-U-Fe-Ga Alloys. Appl. Sci. 2019, 9, 5040. [Google Scholar] [CrossRef] [Green Version]
- Konings, R.J.M.; Beneš, O. The Thermodynamic Properties of the f-Elements and Their Compounds. I. The Lanthanide and Actinide Metals. J. Phys. Chem. Ref. Data 2010, 39, 043102. [Google Scholar] [CrossRef]
- Land, C. Quarterly Status Report on Plutonium Reactor Fuel Development for Period Ending Februray 20; Technical Report LA-03057; Los Alamos Scientific Laboratory: Los Alamos, NM, USA, 1964. [Google Scholar]
- Reisman, A. Phase Equilibria. In Physical Chemistry; Elsevier: Amsterdam, The Netherlands, 1970; Chapter 13; Volume 19. [Google Scholar] [CrossRef]
- Callen, H.B. Thermodynamics and an Introduction to Thermostatistics, 2nd ed.; John Wiley & Sons: New York, NY, USA, 1985; Chapter 5. [Google Scholar]
- Freibert, F.F.; Hernandez, S.C.; Migliori, A. Thermophysical Properties of Plutonium Metal and its Alloys. In Plutonium Handbook; American Nuclear Society: La Grange Park, IL, USA, 2019; Chapter 9; Volume 2, pp. 641–752. [Google Scholar]
- Zocco, T.; Schwartz, D.; Park, J. Investigation of plutonium allotropic phase transformations through differential scanning calorimetry. J. Nucl. Mater. 2006, 353, 119–126. [Google Scholar] [CrossRef]
- Chase, M.W.J. NIST-JANAF Thermochemical Tables, 4th ed.; American Institute of Physics: New York, NY, USA, 1998. [Google Scholar]
- Rai, A.K.; Raju, S.; Vijayalakshmi, M. A calorimetric study of high temperature phase stability in Fe–U alloys. J. Nucl. Mater. 2013, 432, 520–528. [Google Scholar] [CrossRef]
- Available online: https://docs.scipy.org/doc/scipy-0.14.0/reference/generated/scipy.integrate.simps.html (accessed on 1 October 2021).
- Taylor, J.R. An Introduction to Error Analysis: The Study of Uncertainties in Physical Measurements, 2nd ed.; University Science Books: Sausalito, CA, USA, 1997; Chapter 3. [Google Scholar]
- Rowlinson, J.S.; Swinton, F.L. Chapter 4—The thermodynamics of liquid mixtures. In Liquids and Liquid Mixtures, 3rd ed.; Rowlinson, J.S., Swinton, F.L., Eds.; Butterworths Monographs in Chemistry; Butterworth-Heinemann: Oxford, UK, 1982; pp. 86–131. [Google Scholar] [CrossRef]
- Marx, D.; Hutter, J. Ab Initio Molecular Dynamics: Basic Theory and Advanced Methods; Cambridge University Press: Cambridge, UK, 2009. [Google Scholar] [CrossRef]
- Frenkel, D.; Smit, B. Chapter 7—Free Energy Calculations. In Understanding Molecular Simulation, 2nd ed.; Frenkel, D., Smit, B., Eds.; Academic Press: San Diego, CA, USA, 2002; pp. 167–200. [Google Scholar] [CrossRef] [Green Version]
- Desjarlais, M.P. First-principles calculation of entropy for liquid metals. Phys. Rev. E 2013, 88, 062145. [Google Scholar] [CrossRef] [PubMed] [Green Version]
| (1/K) | Domain | |
|---|---|---|
| 14.5 | ||
| 5.85 |
°C/K | kJ/mol J/g | J | J | kJ/mol J/g kJ/(mol atoms) | R |
|---|---|---|---|---|---|
| 2.05 | 36.3 | ||||
| 441/714 | 8.58 | 0.0234 | 0.115 | 24.4 | 2.50 |
| 5.19 |
| (%) | (%) |
|---|---|
| 0 | 4 |
| 5 | 6 |
| 10 | 11 |
| 25 | 25 |
Publisher’s Note: MDPI stays neutral with regard to jurisdictional claims in published maps and institutional affiliations. |
© 2021 by the authors. Licensee MDPI, Basel, Switzerland. This article is an open access article distributed under the terms and conditions of the Creative Commons Attribution (CC BY) license (https://creativecommons.org/licenses/by/4.0/).
Share and Cite
Coe, J.D.; Anderson, W.W.; Tobash, P.H. The Melt Enthalpy of Pu6Fe. Appl. Sci. 2021, 11, 10800. https://doi.org/10.3390/app112210800
Coe JD, Anderson WW, Tobash PH. The Melt Enthalpy of Pu6Fe. Applied Sciences. 2021; 11(22):10800. https://doi.org/10.3390/app112210800
Chicago/Turabian StyleCoe, Joshua D., William W. Anderson, and Paul H. Tobash. 2021. "The Melt Enthalpy of Pu6Fe" Applied Sciences 11, no. 22: 10800. https://doi.org/10.3390/app112210800
APA StyleCoe, J. D., Anderson, W. W., & Tobash, P. H. (2021). The Melt Enthalpy of Pu6Fe. Applied Sciences, 11(22), 10800. https://doi.org/10.3390/app112210800