
Experimental Investigation of Vertical Density Profile of Medium Density Fiberboard in Hot Press


 ,
, 
Abstract
:1. Introduction
- Single daylight press.
- Multi-opening press.
- Continues line press.
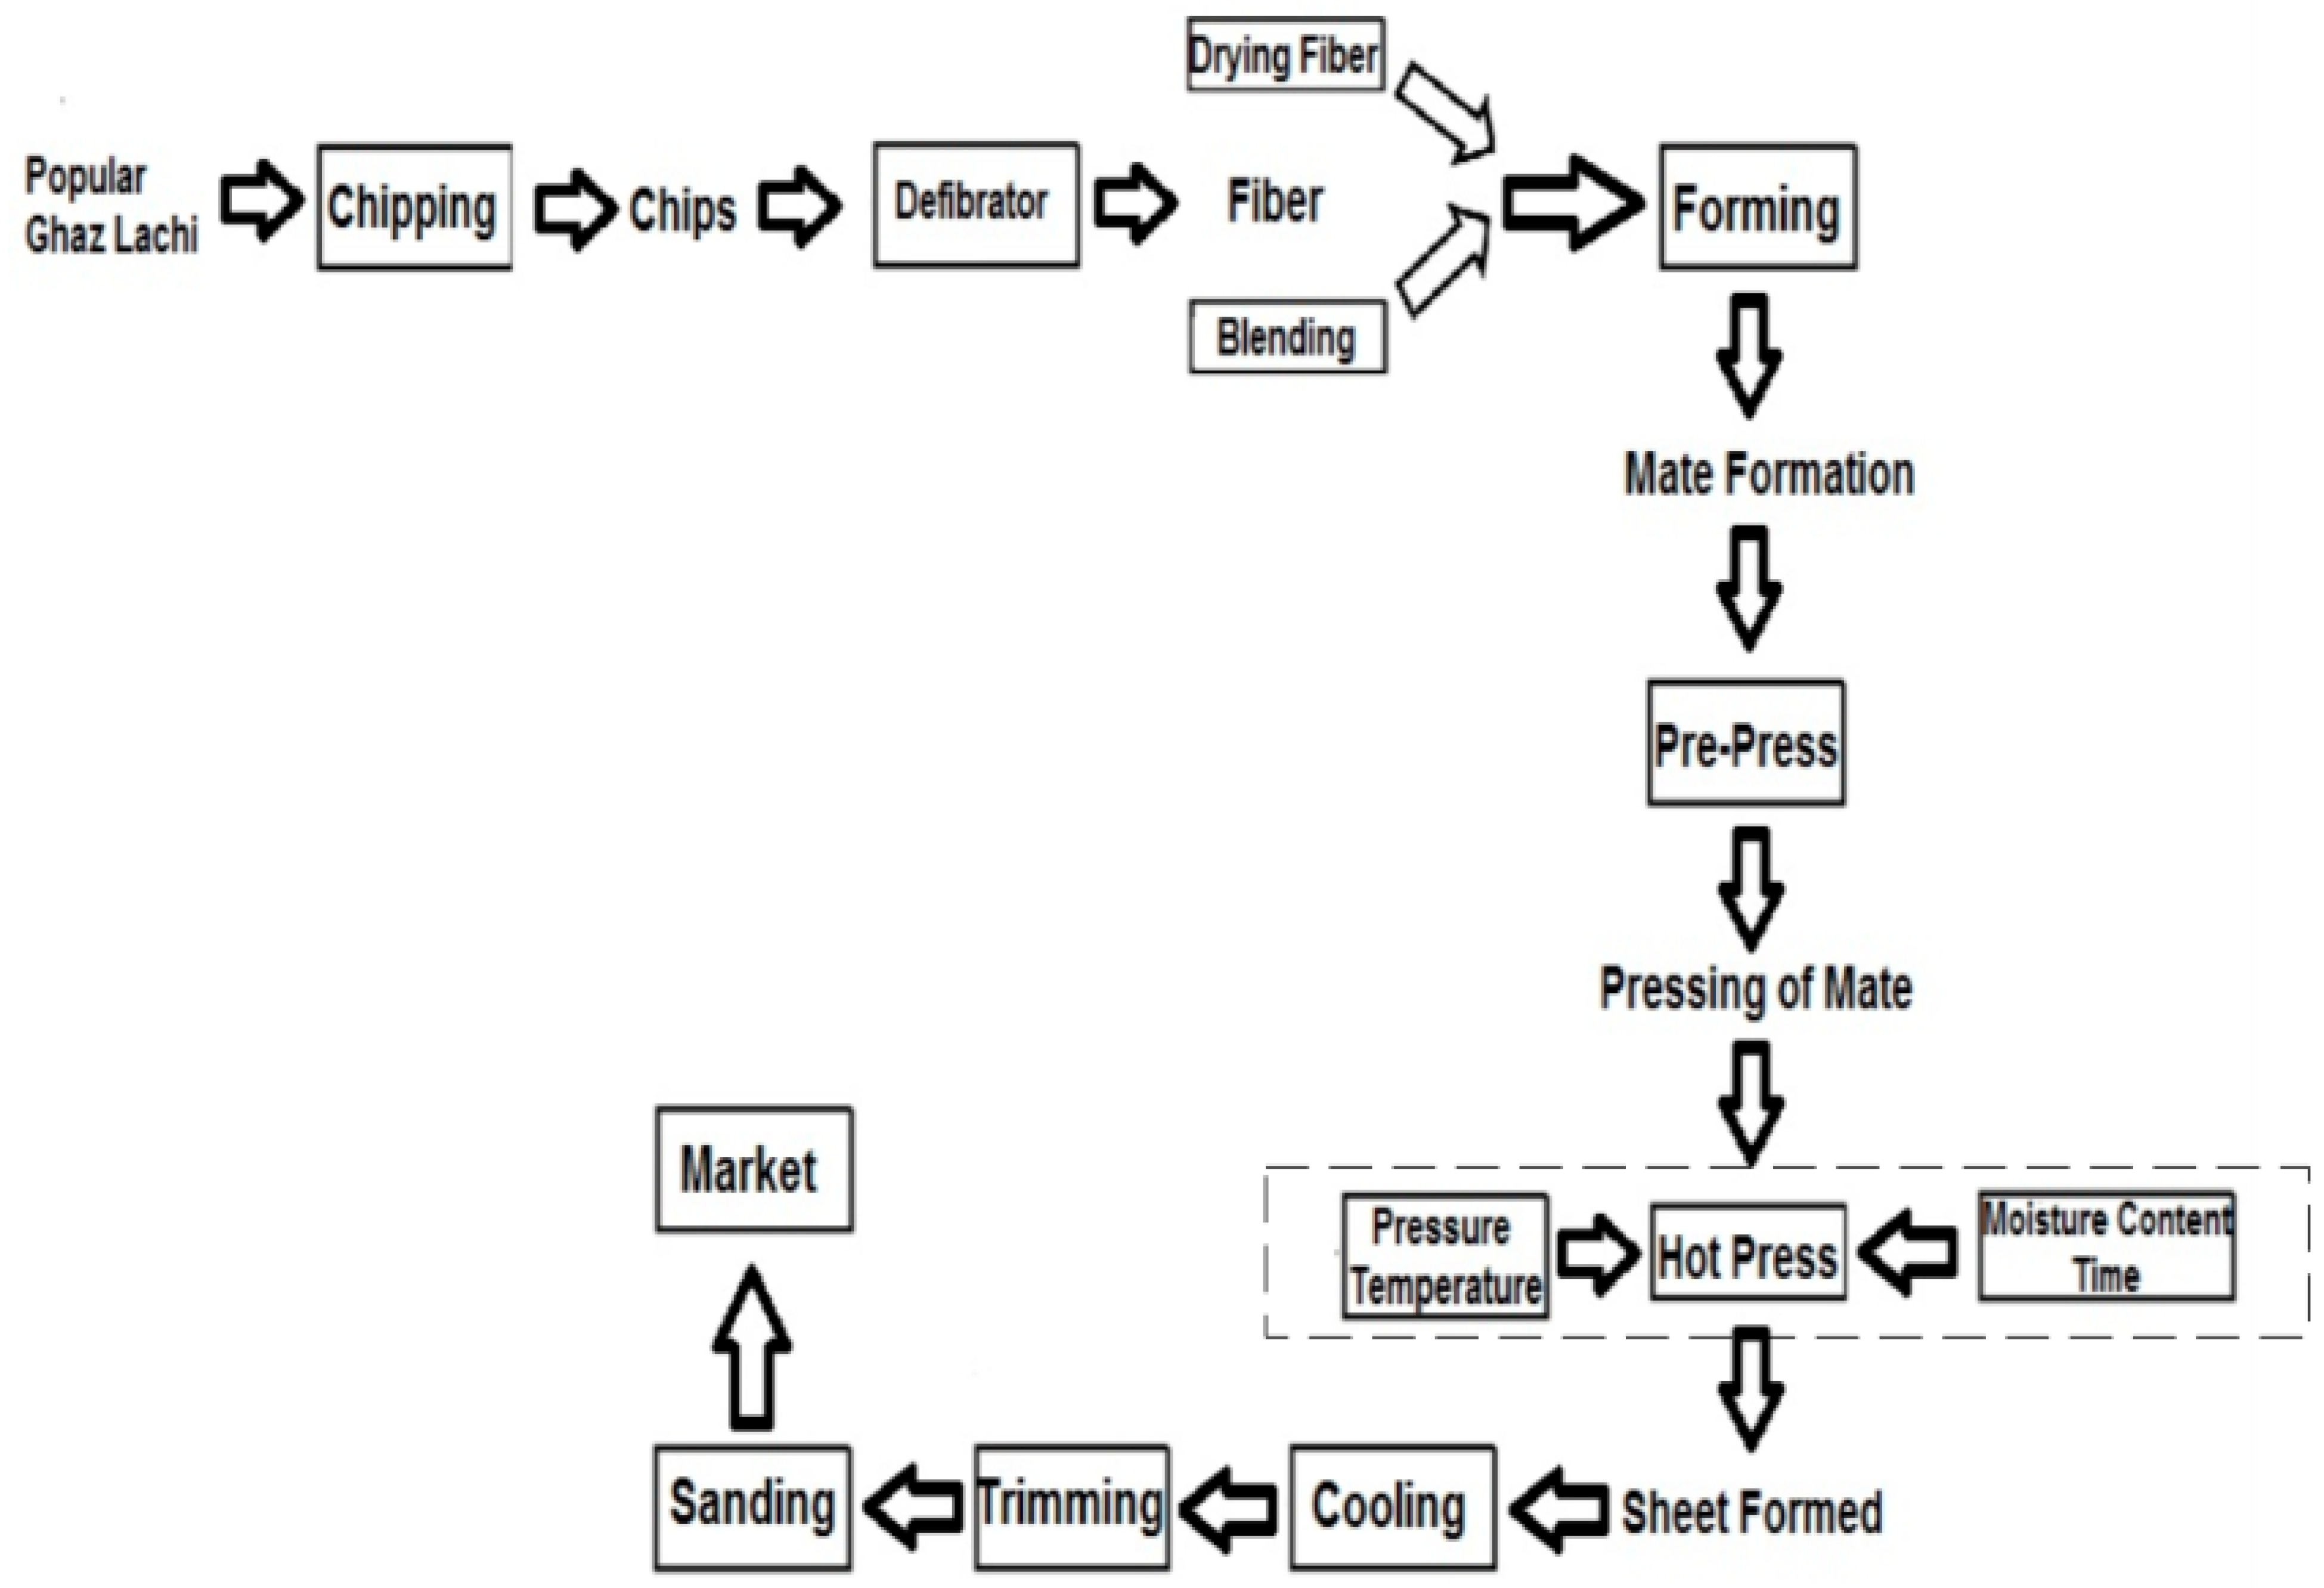
2. Materials and Methods
2.1. Density Profile Test
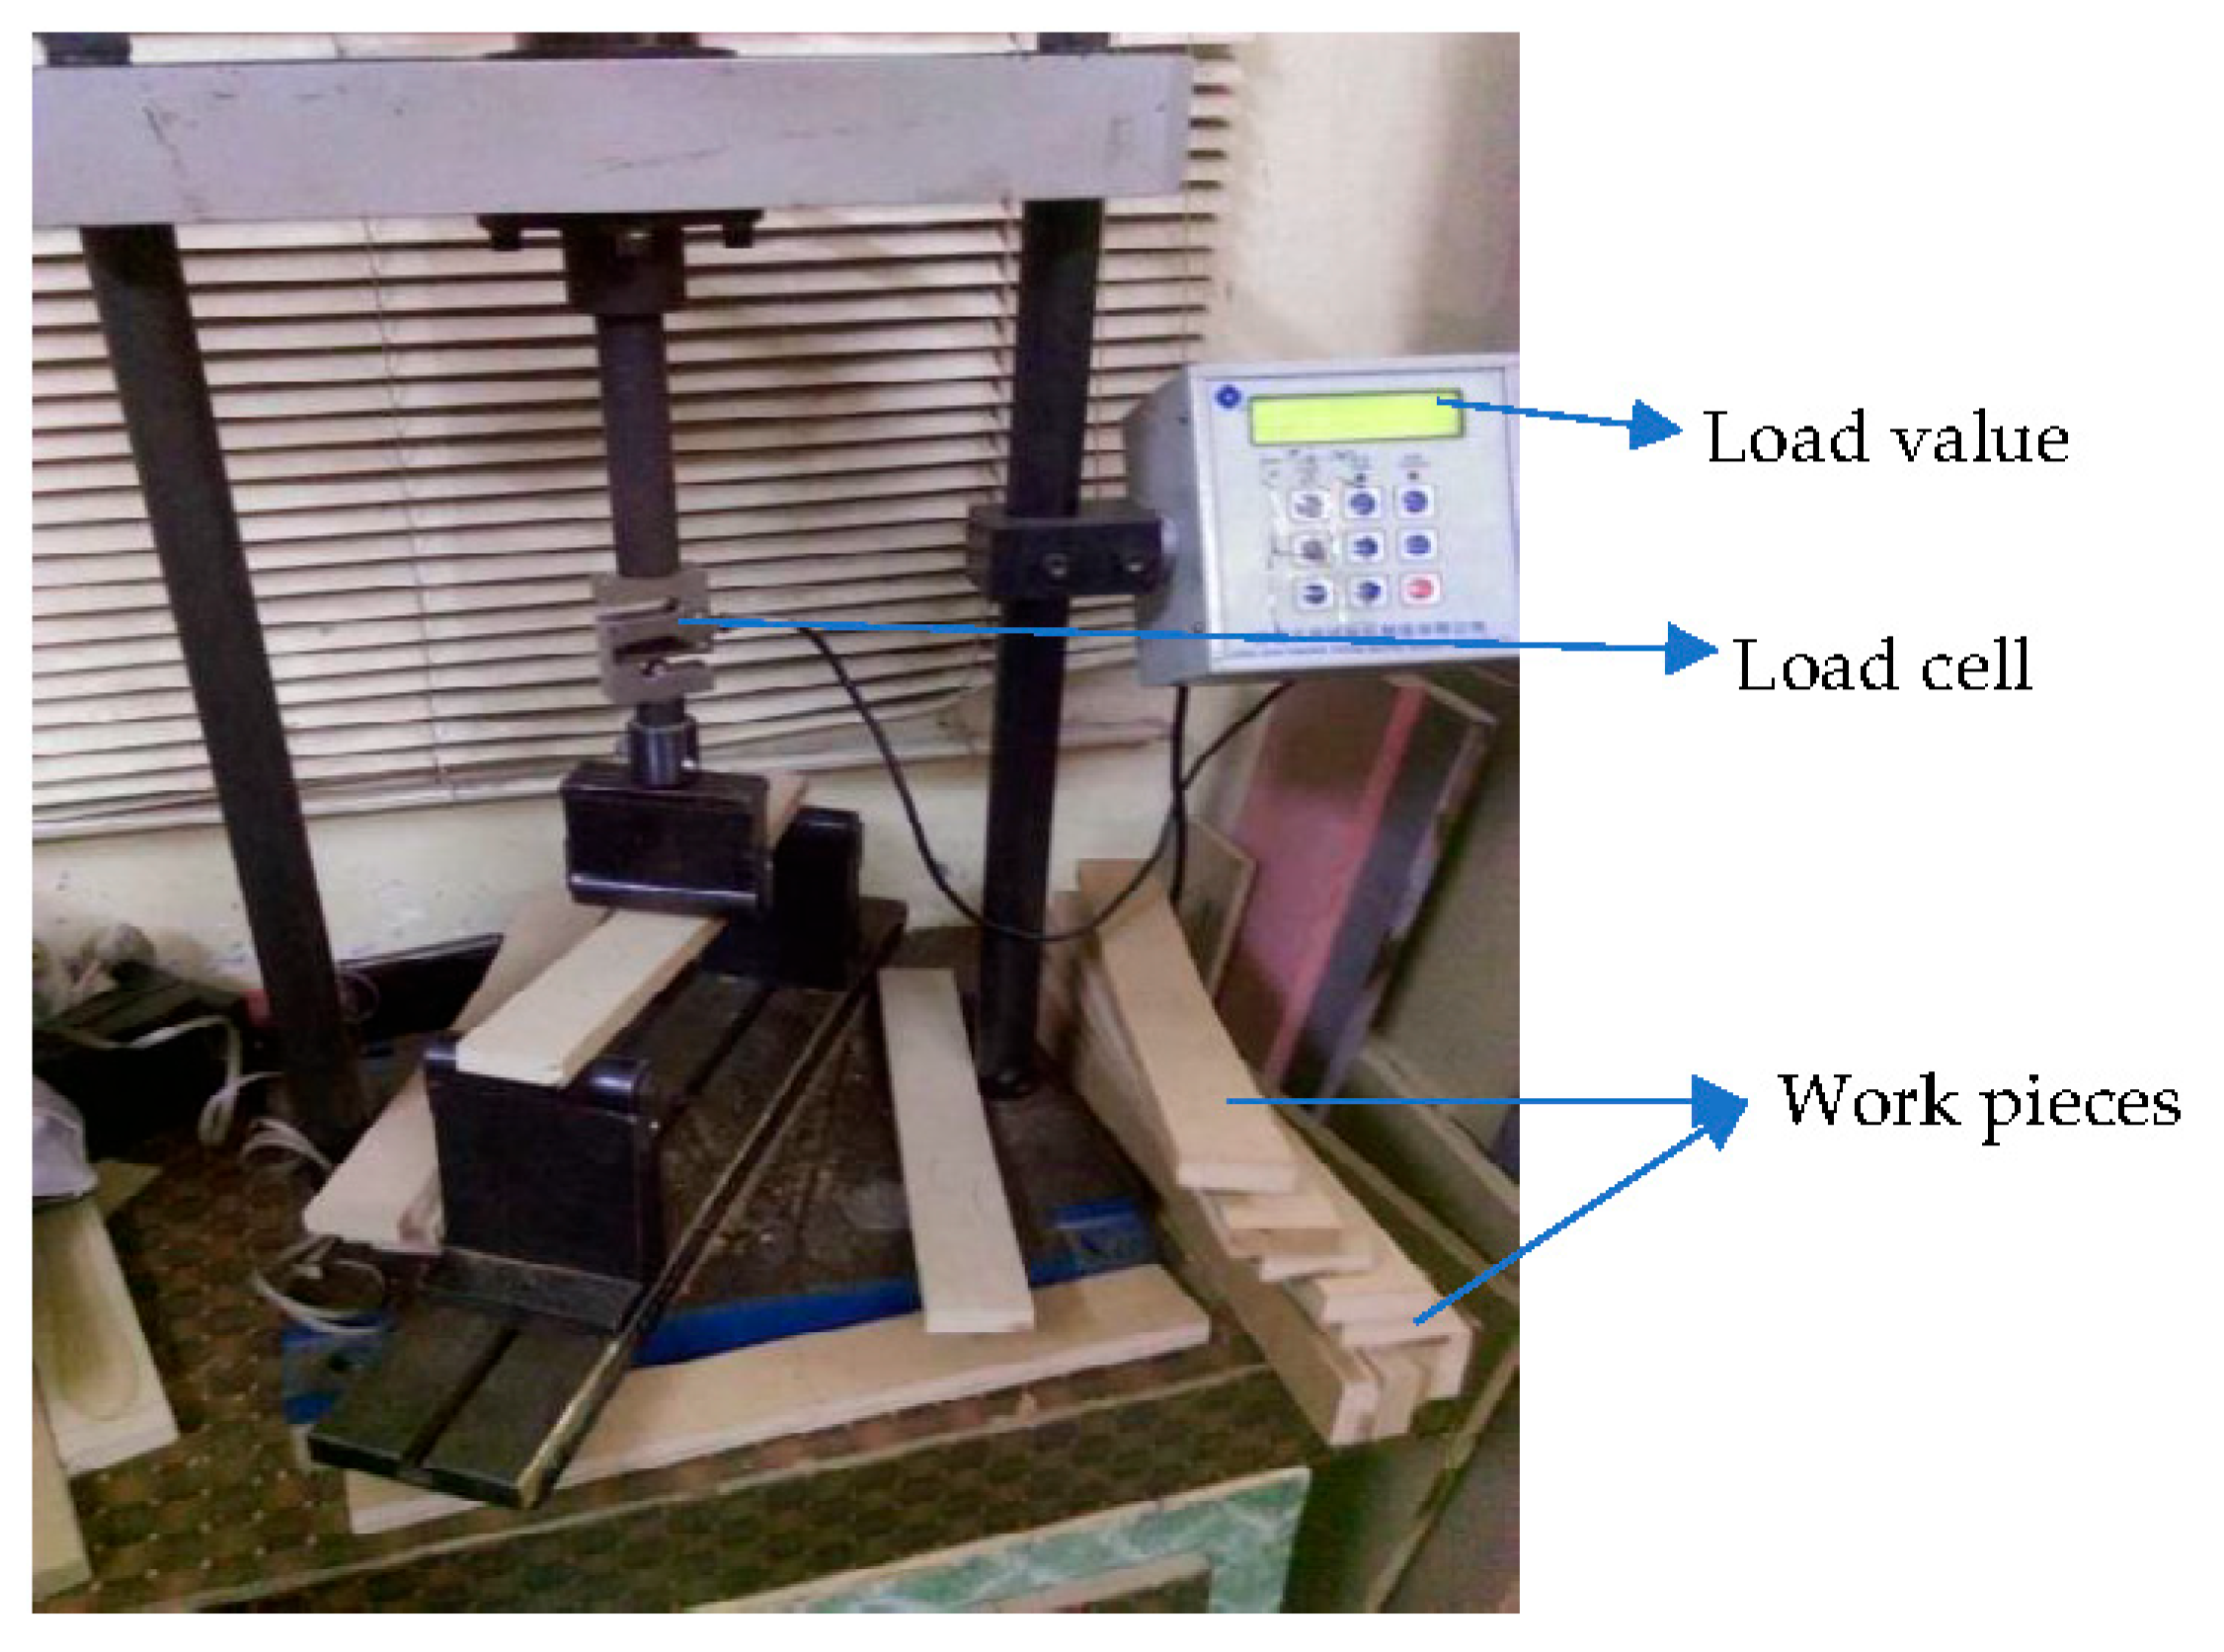
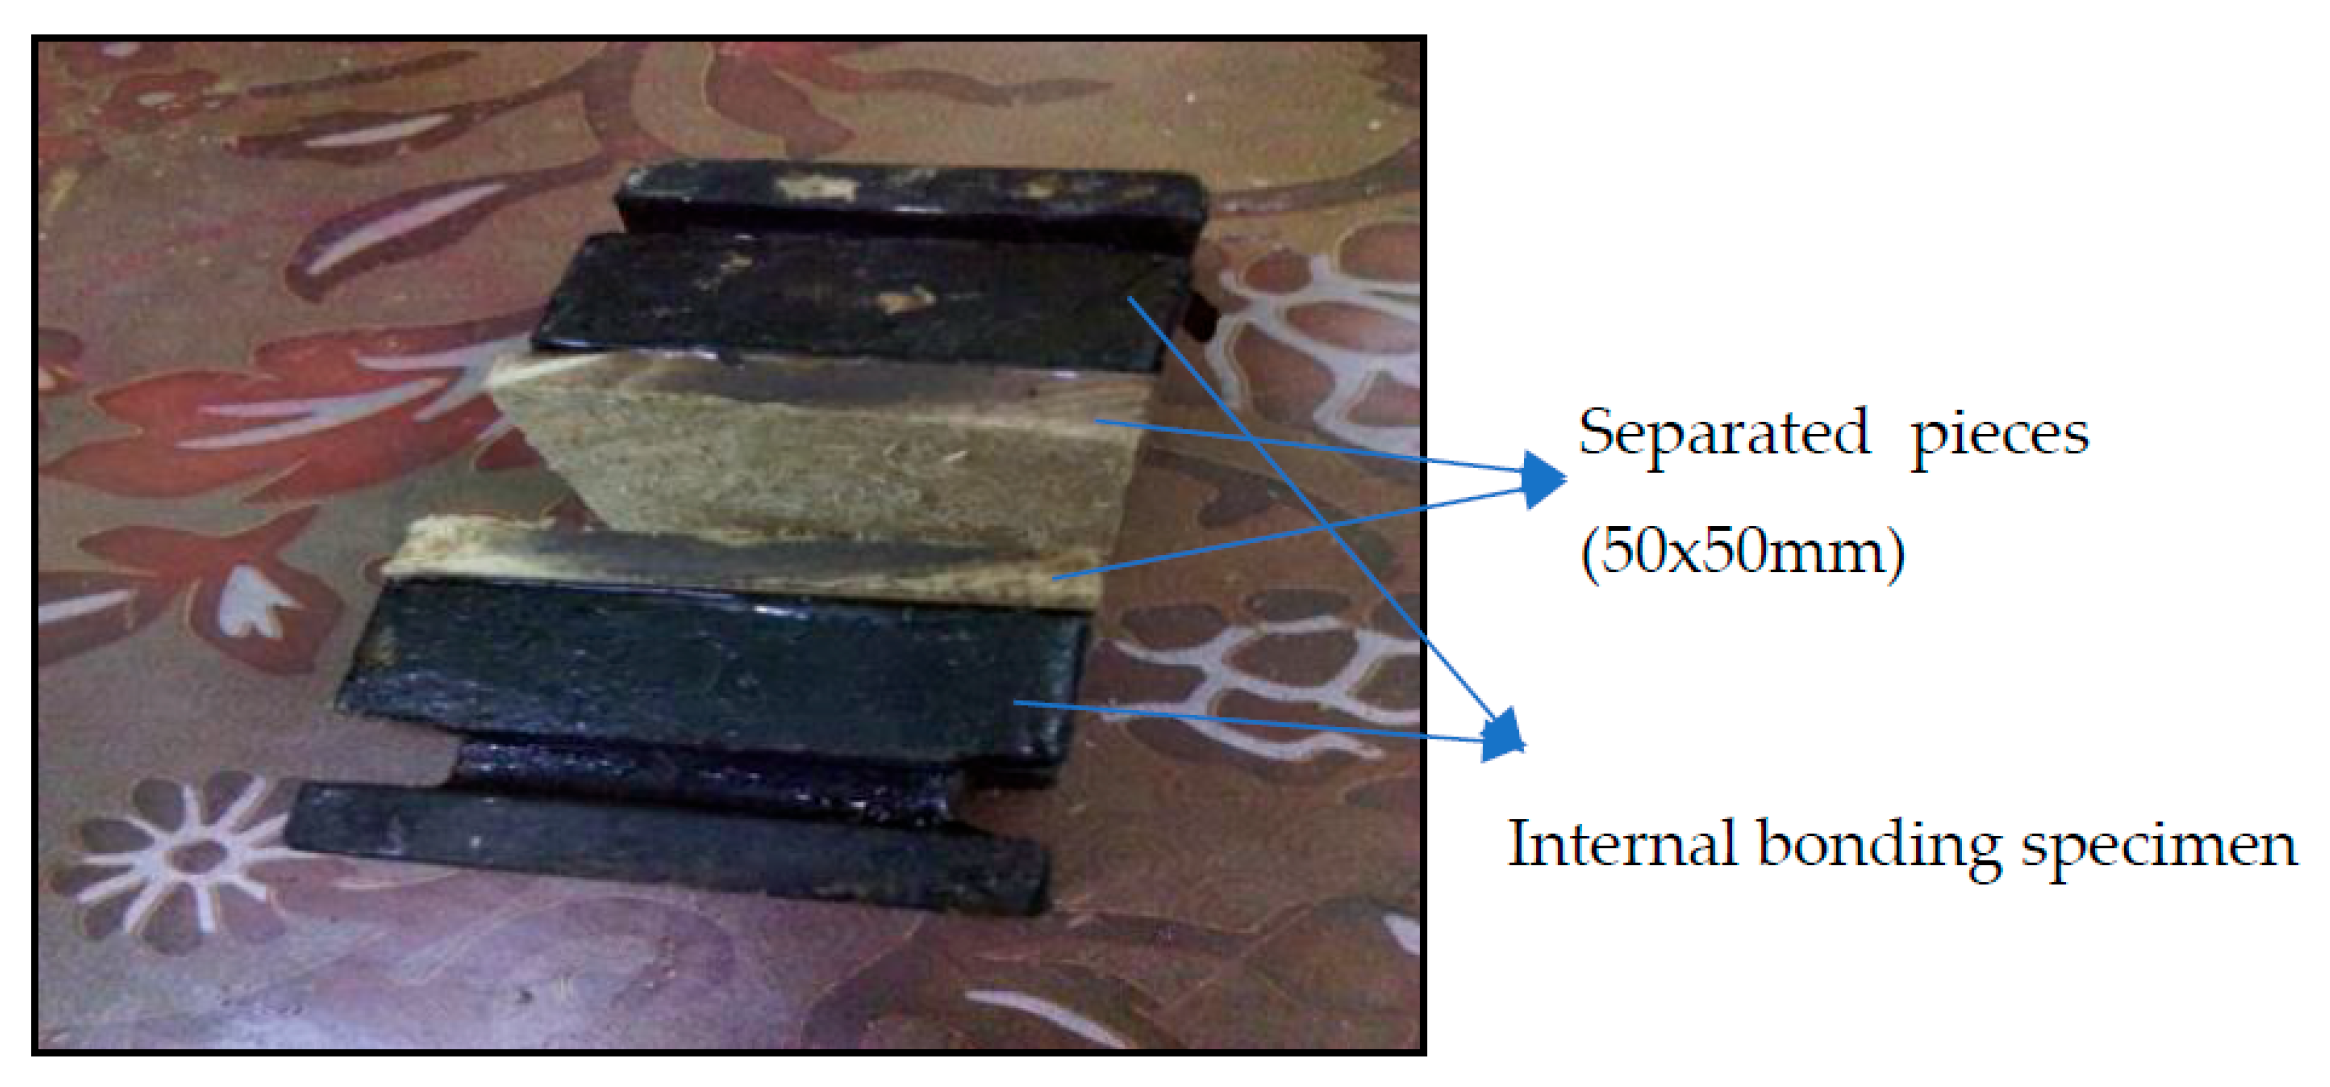
2.2. Bending and Internal Bonding Test
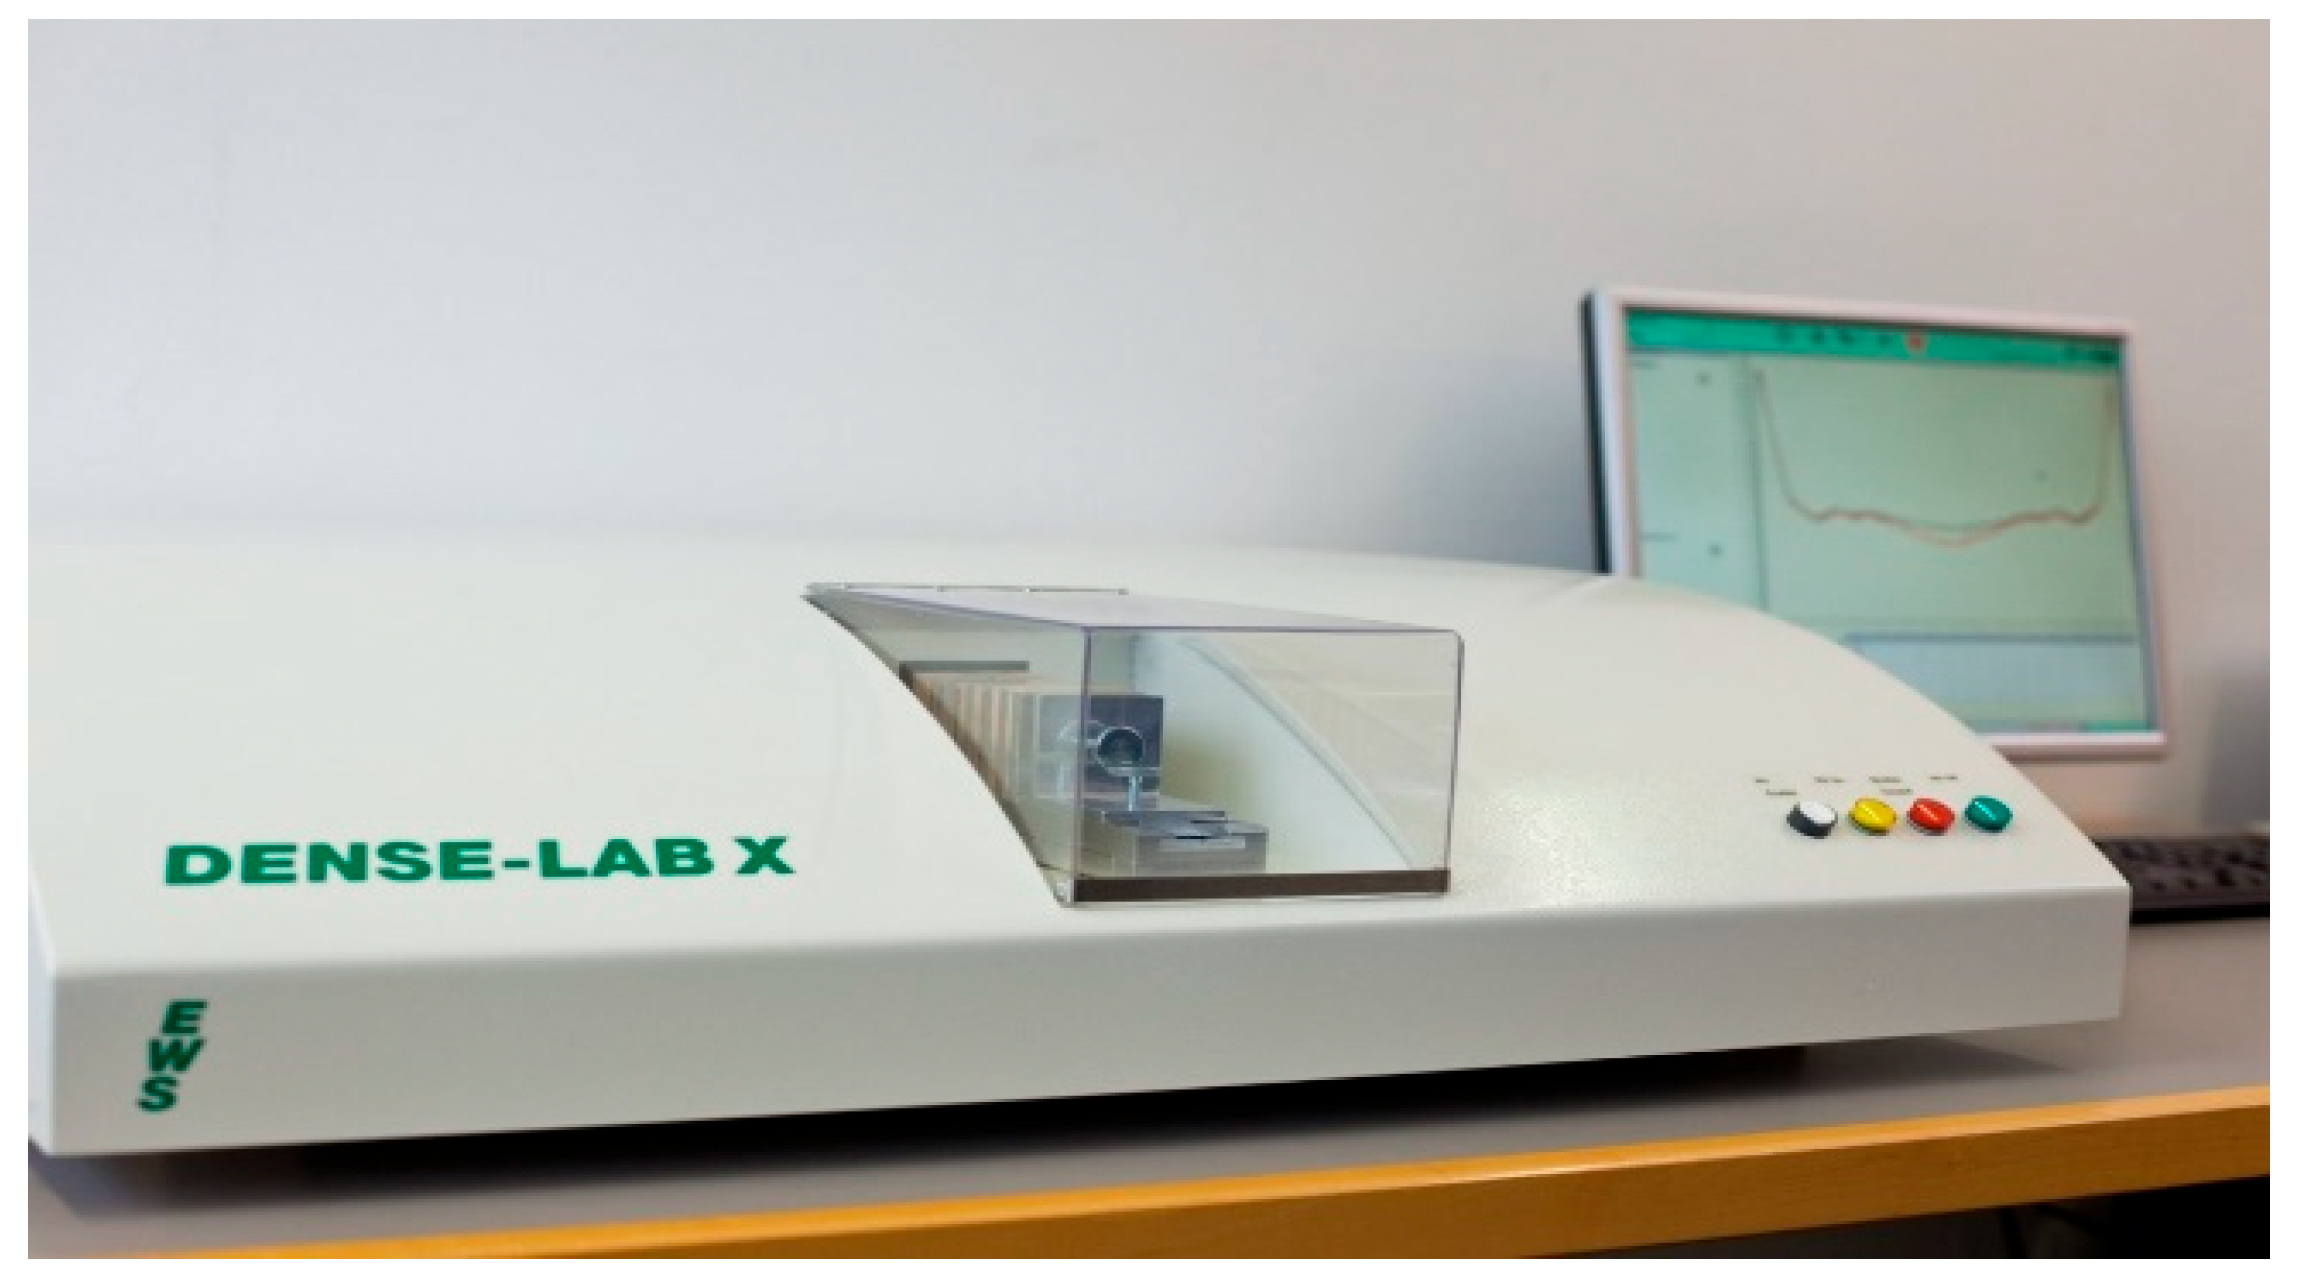
2.3. Vertical Density Profile or X-ray Graph
2.4. ISO and ASTM Standards for Statistical Testing Methods
3. Results and Discussions
3.1. Experiment No. 1
3.2. Experiment No. 2
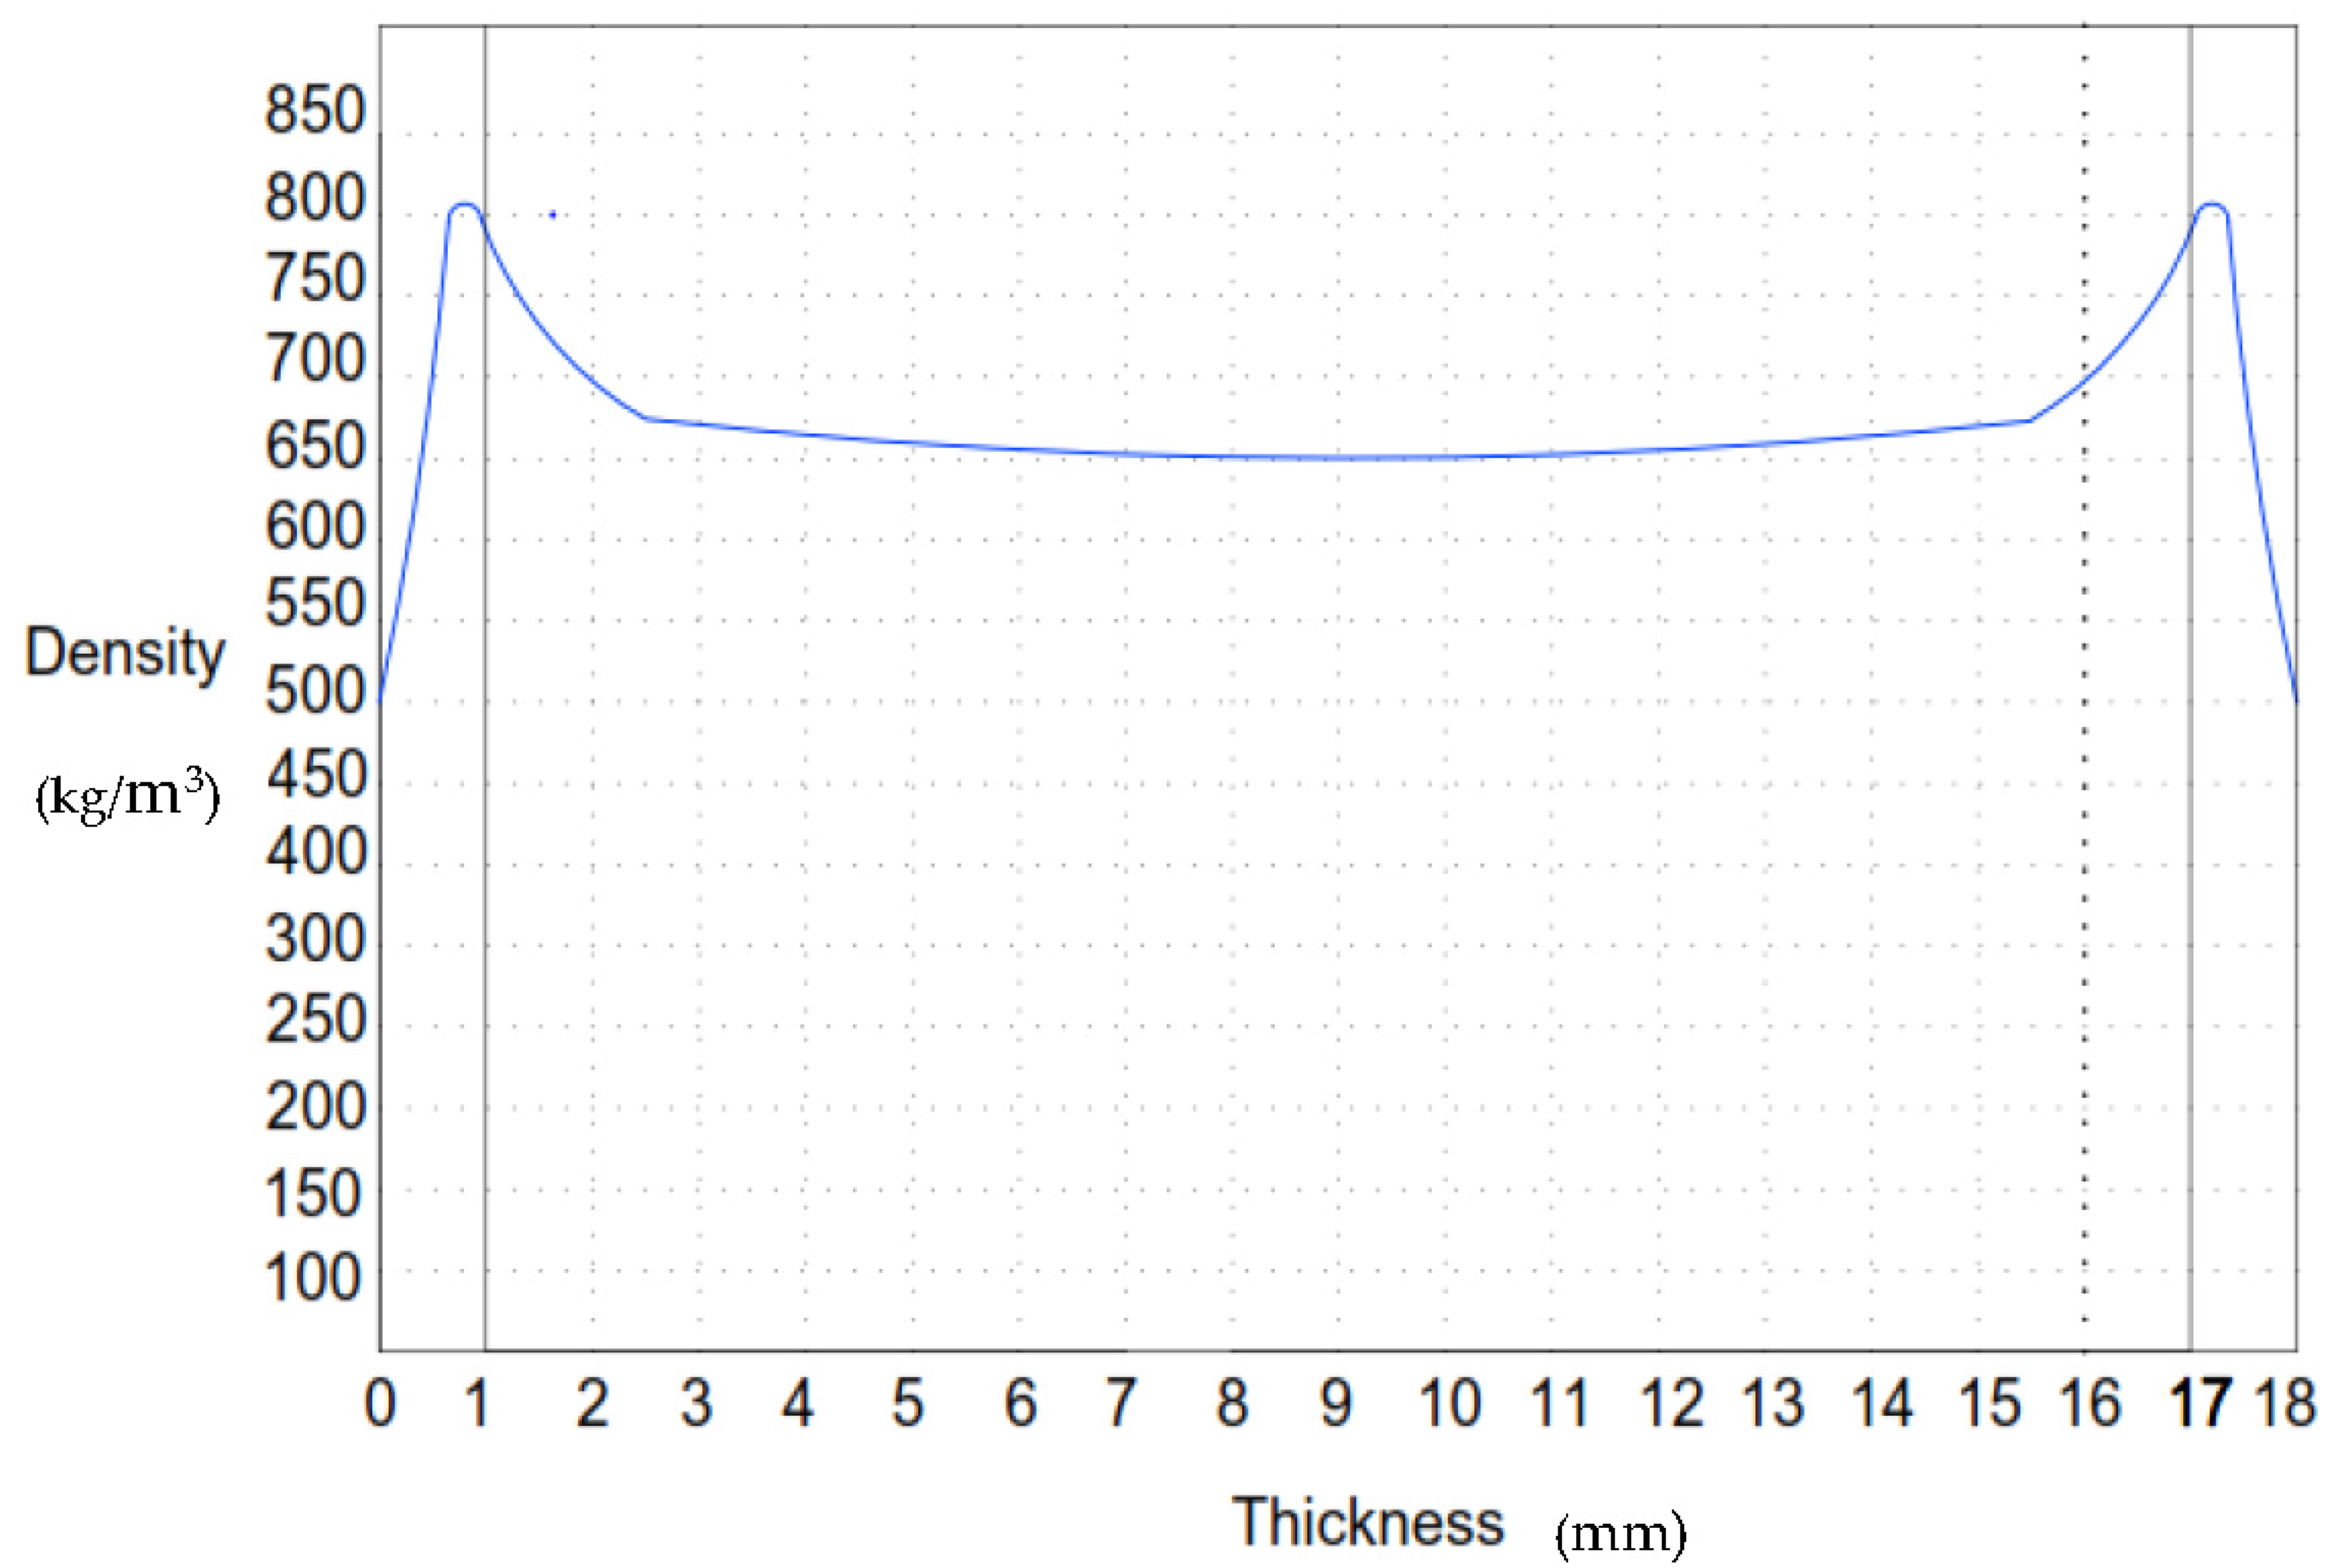
3.3. Experiment No. 3
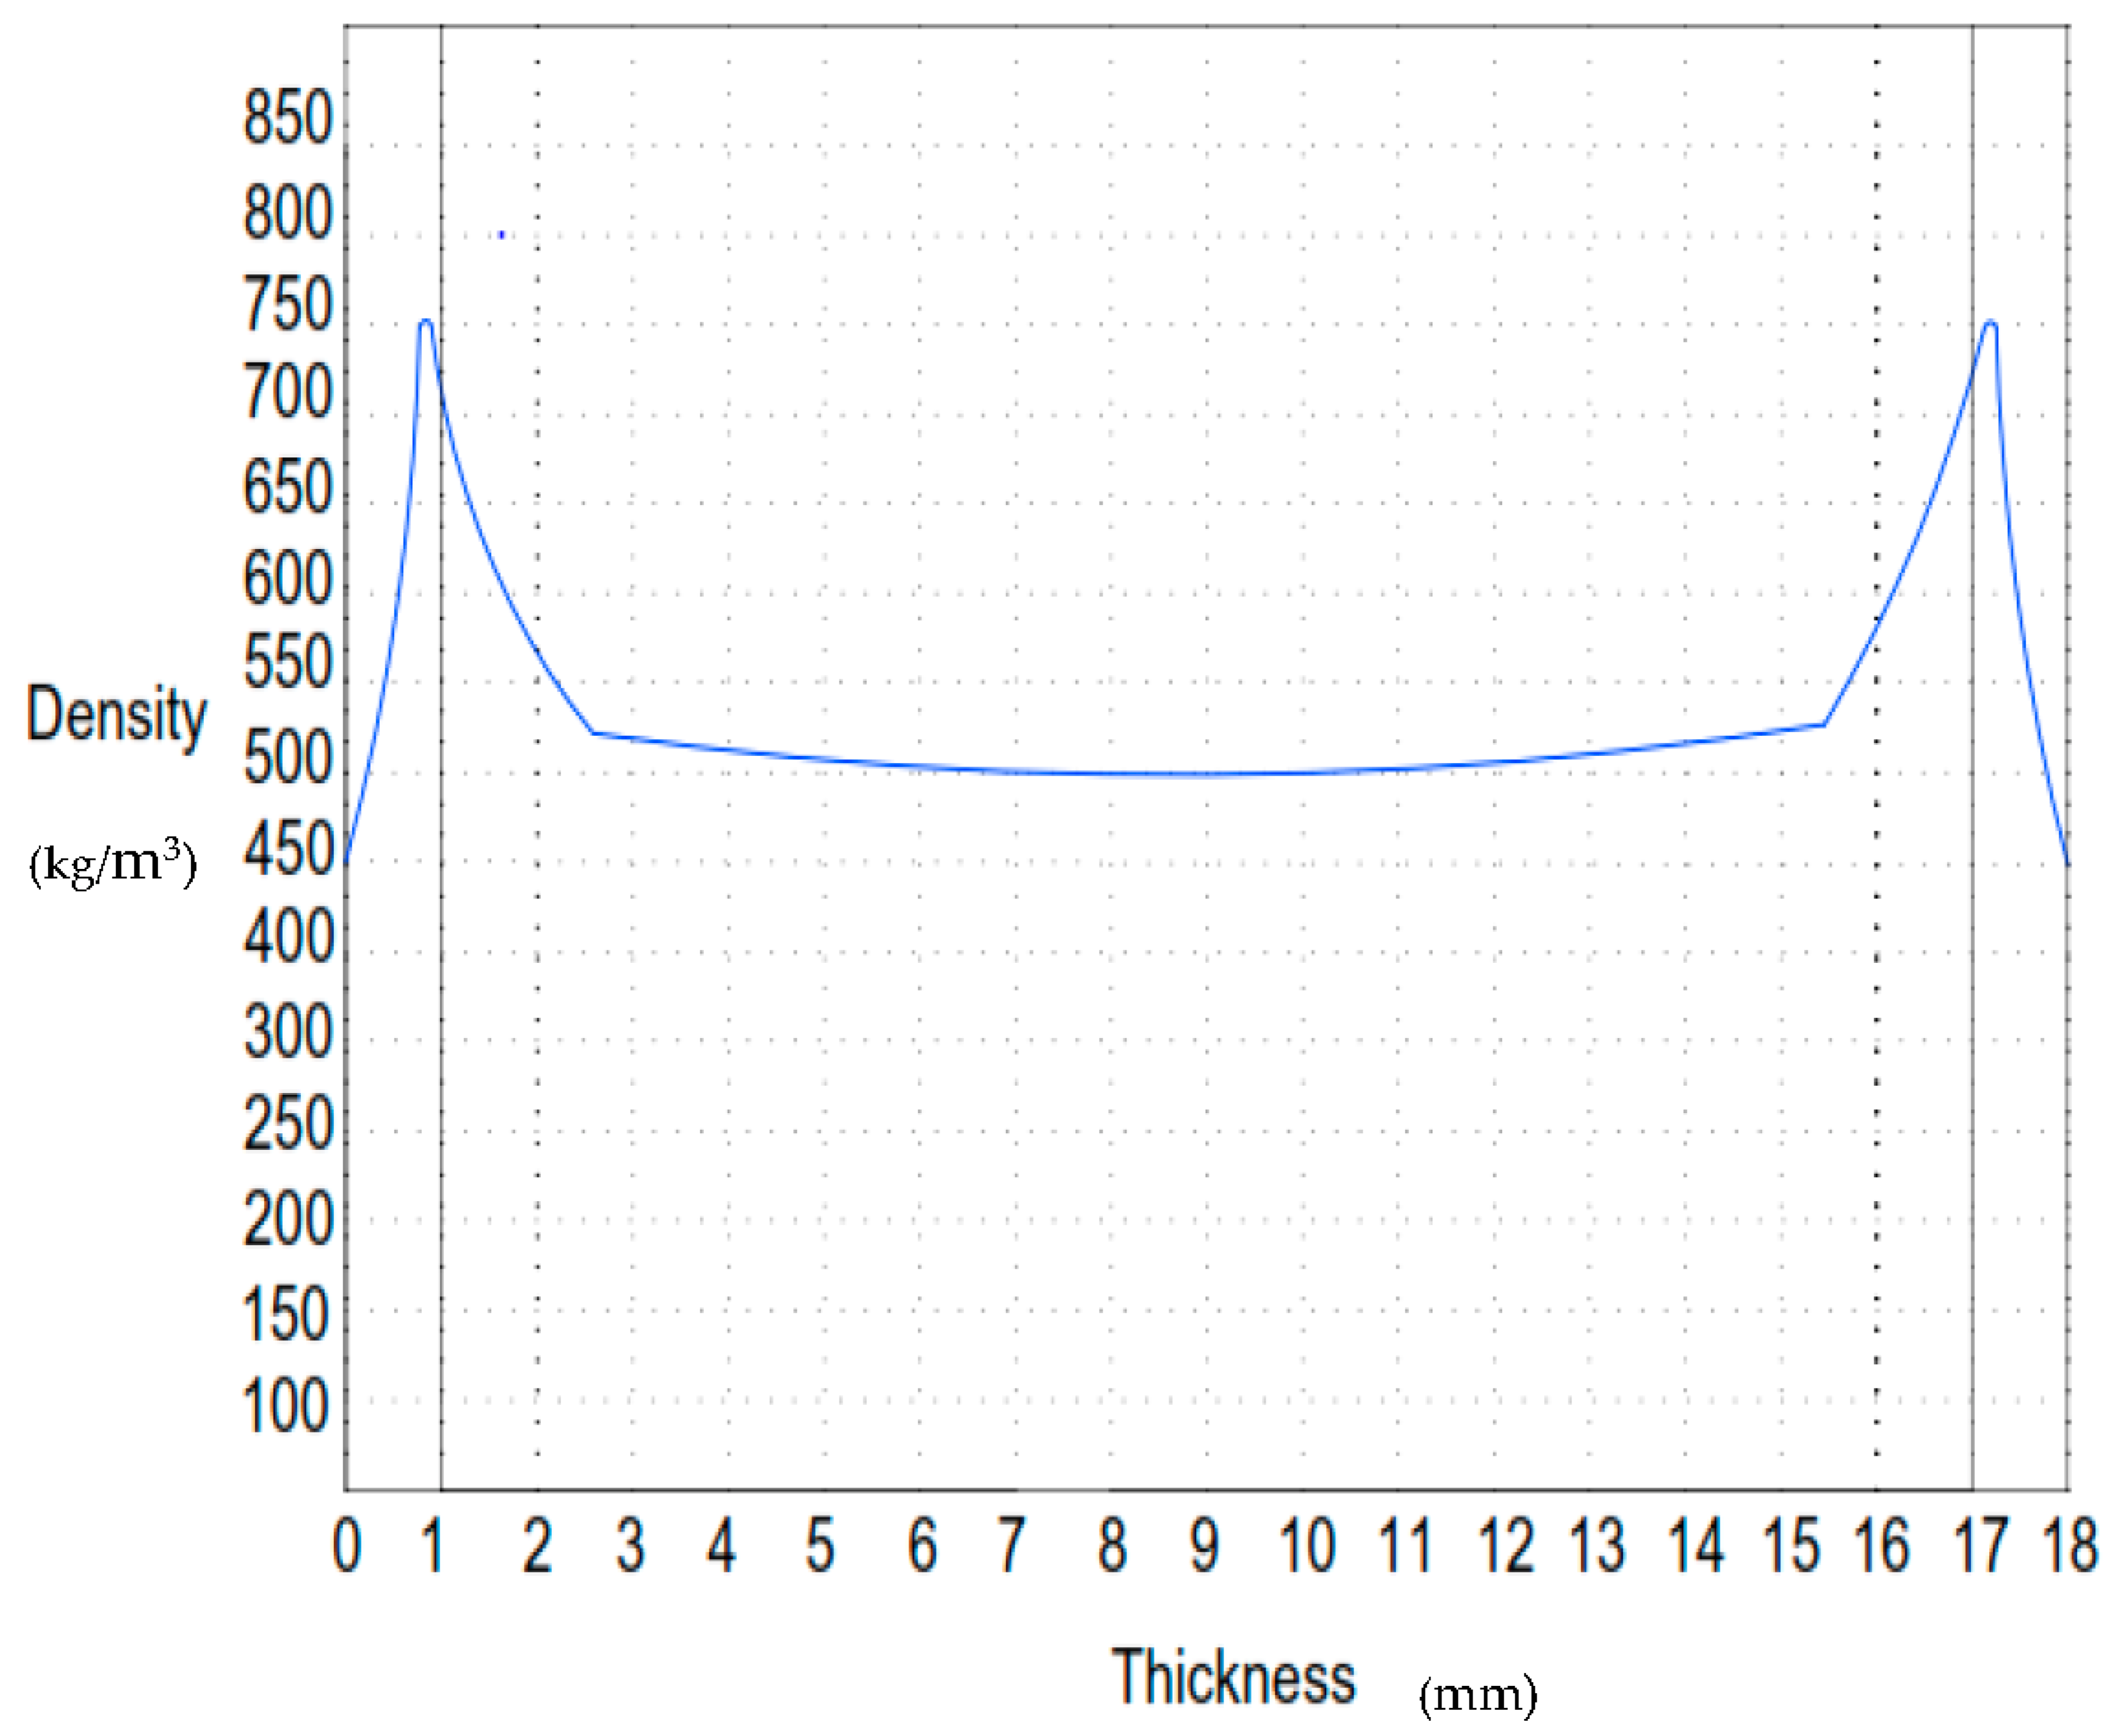
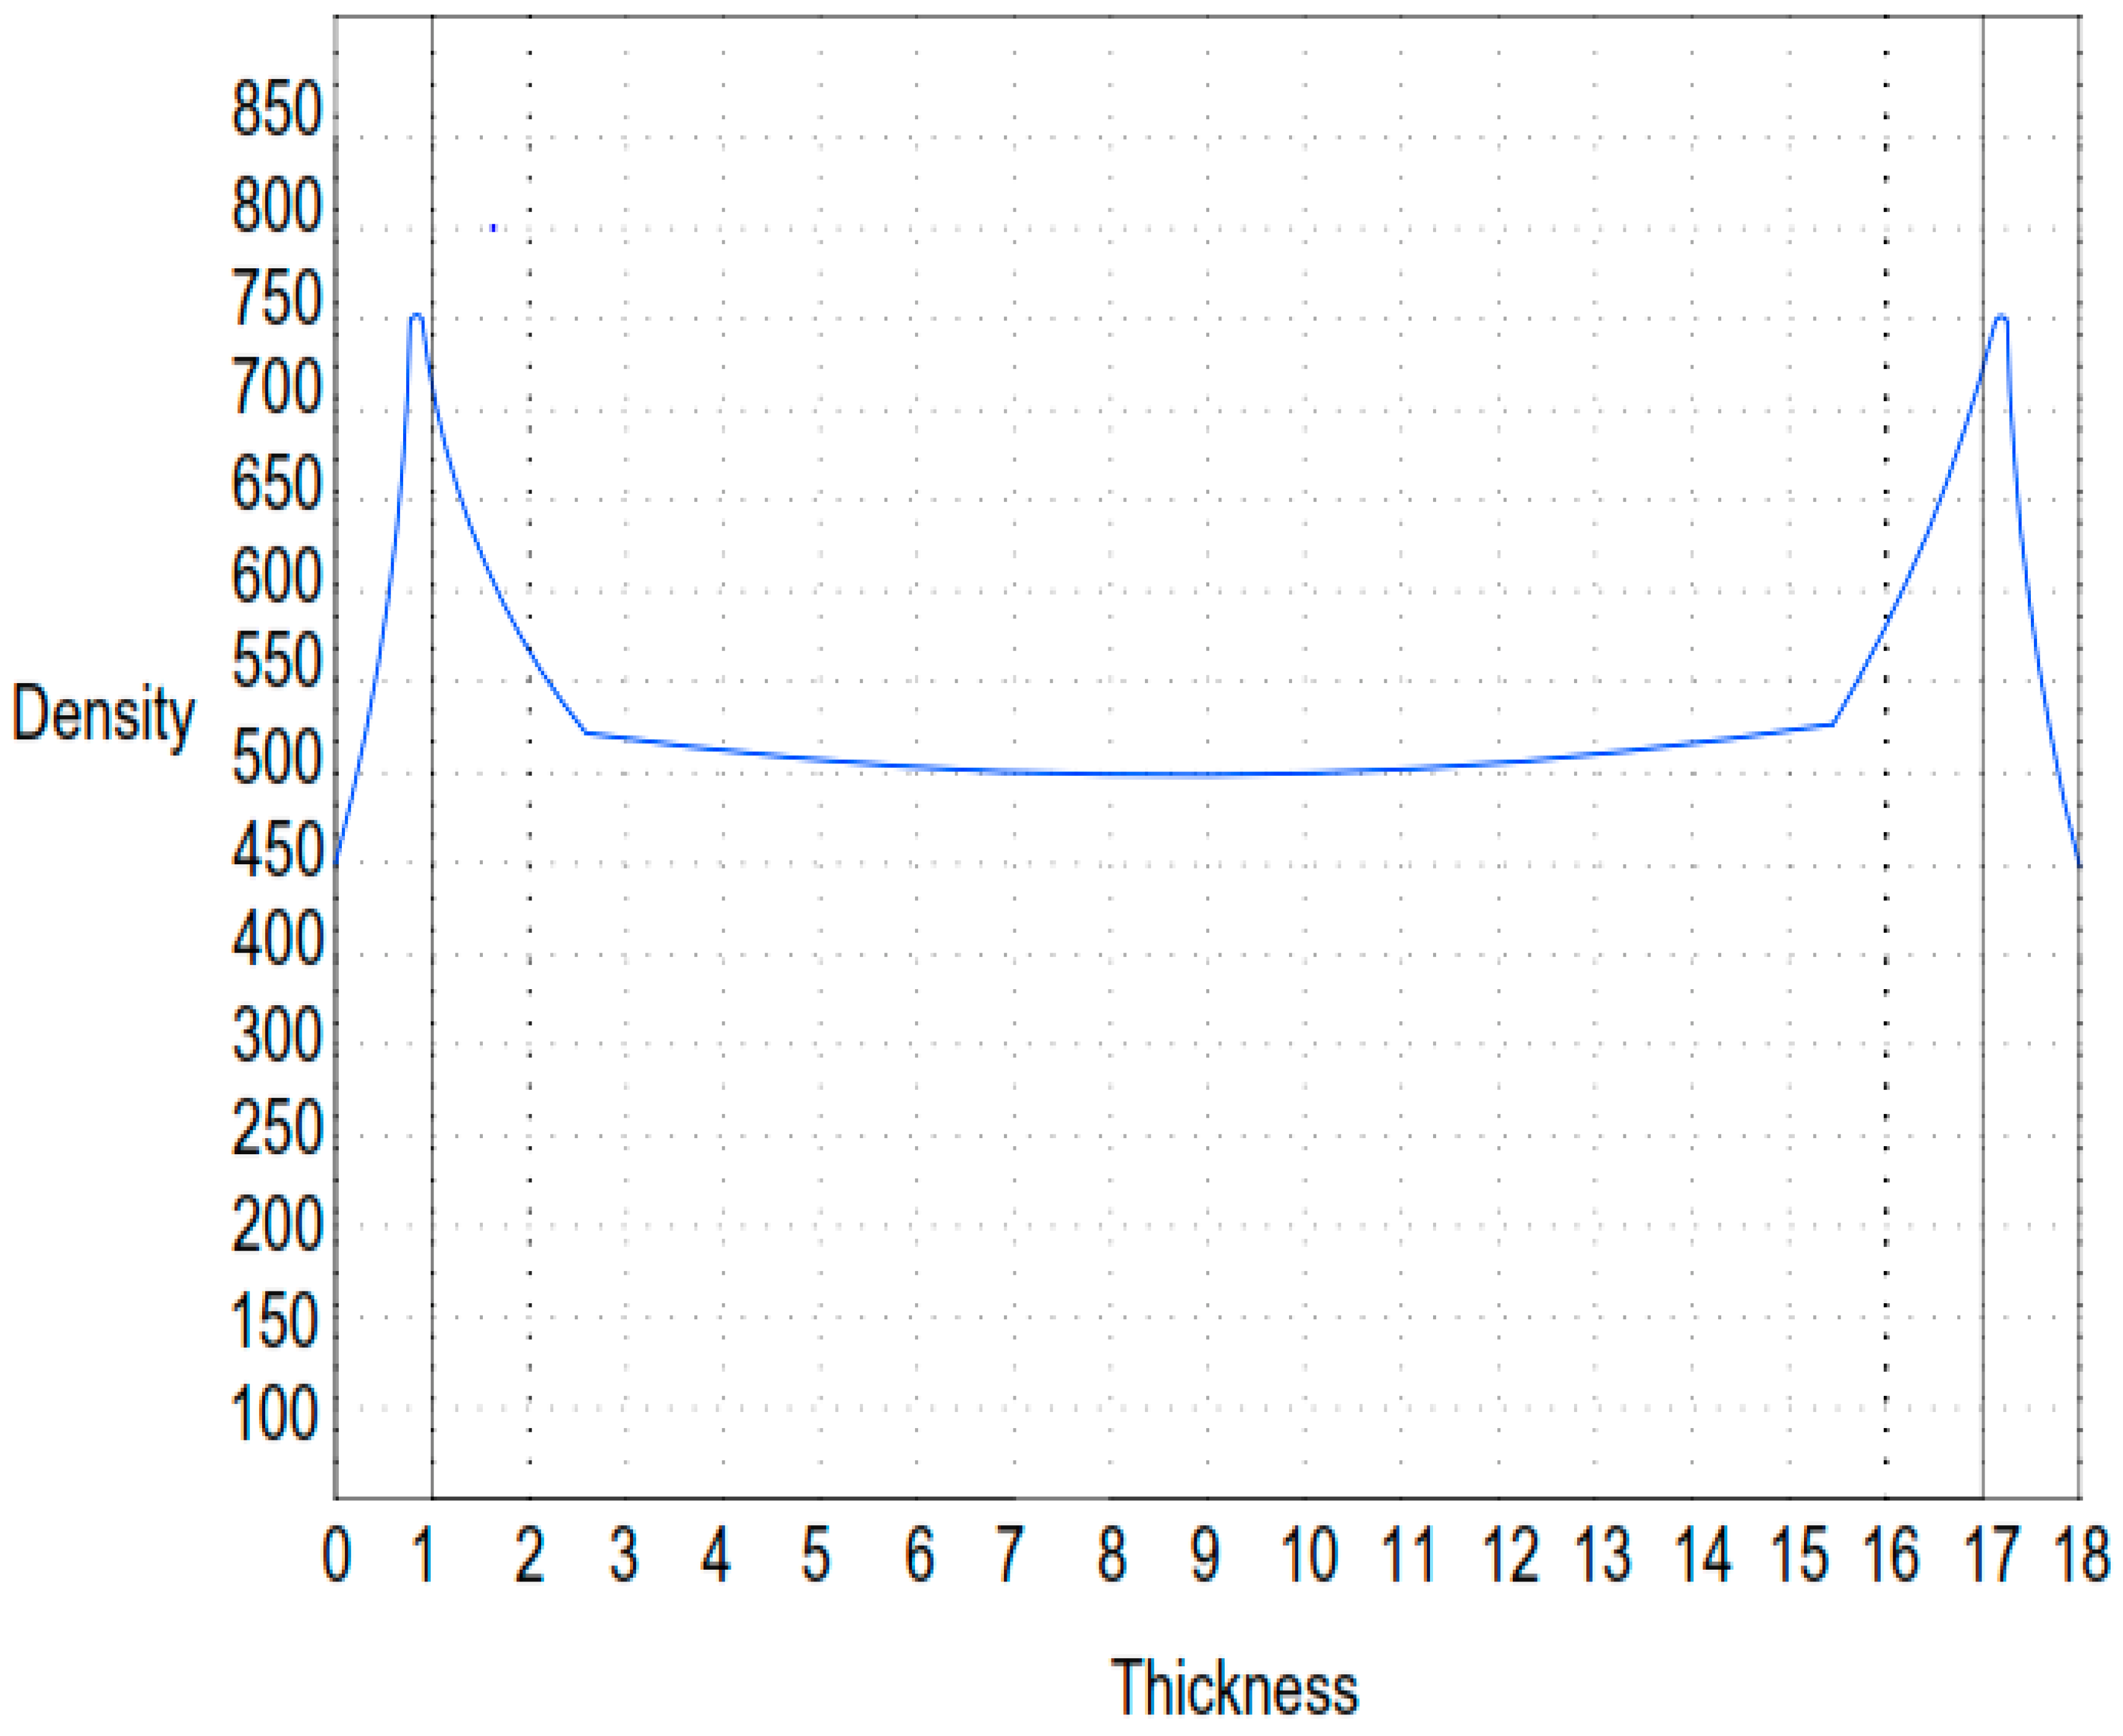
3.4. Experiment No. 4
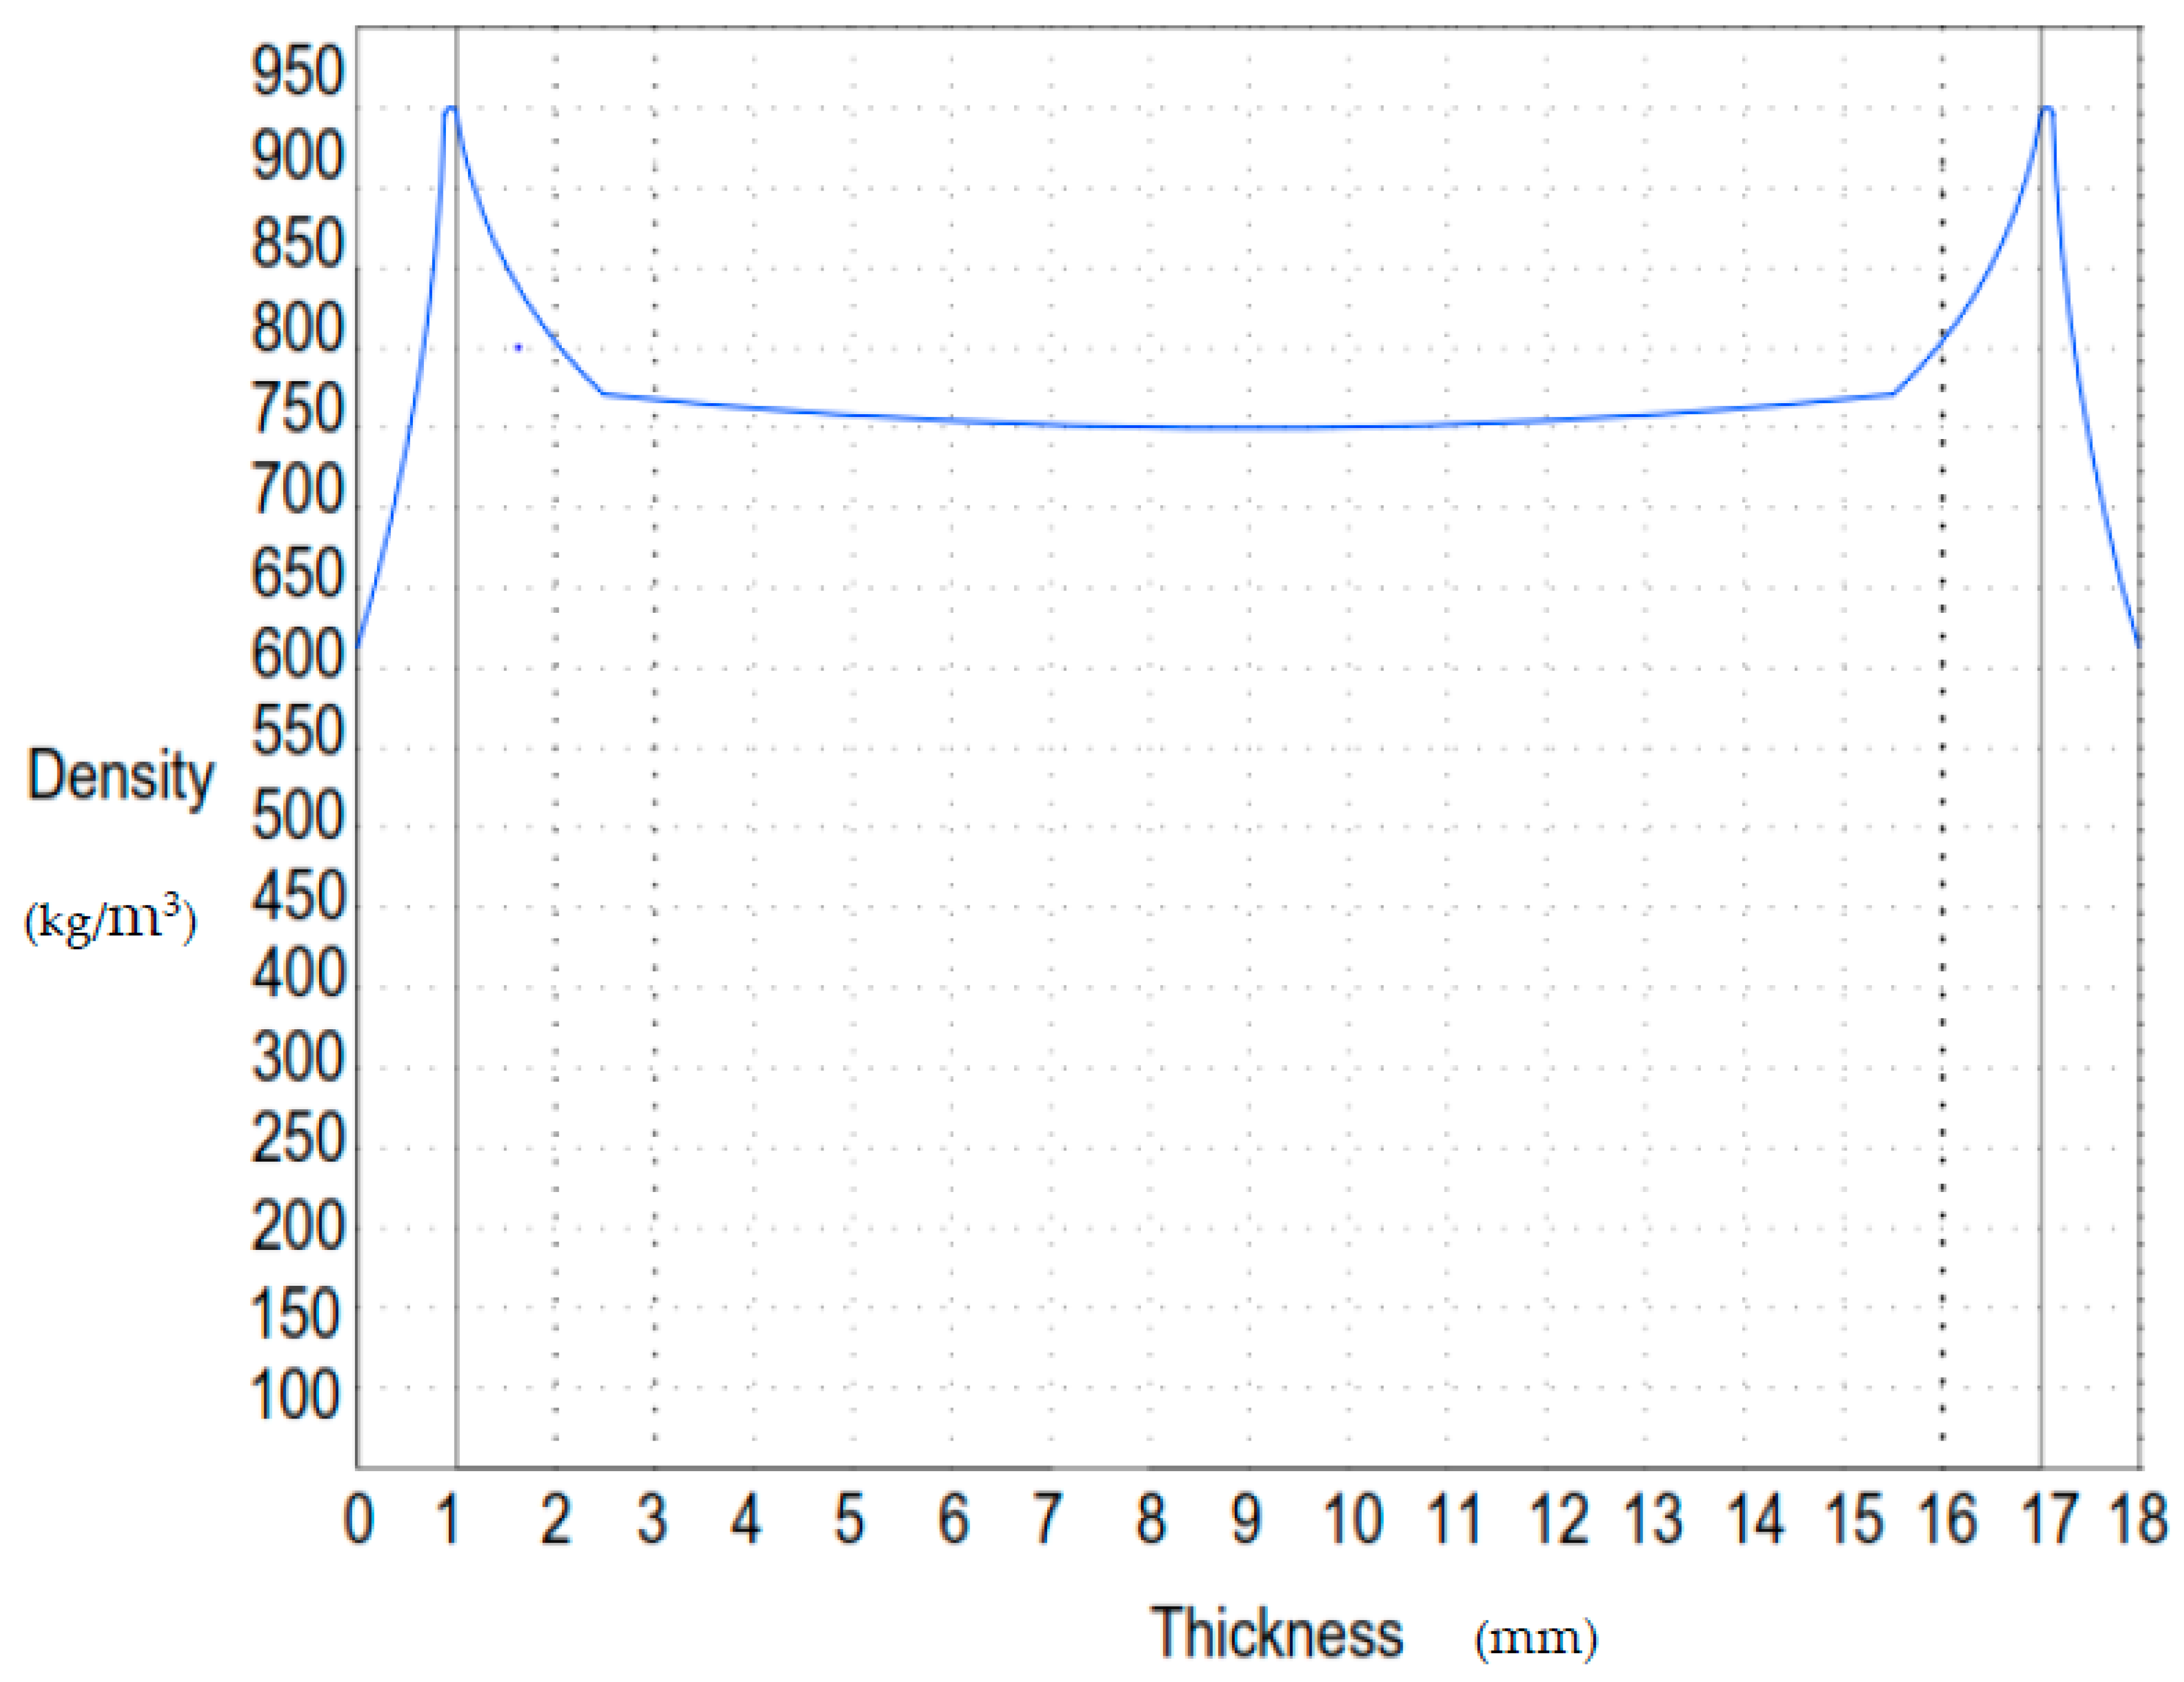
3.5. Experiment No. 5
4. Comparative Analysis
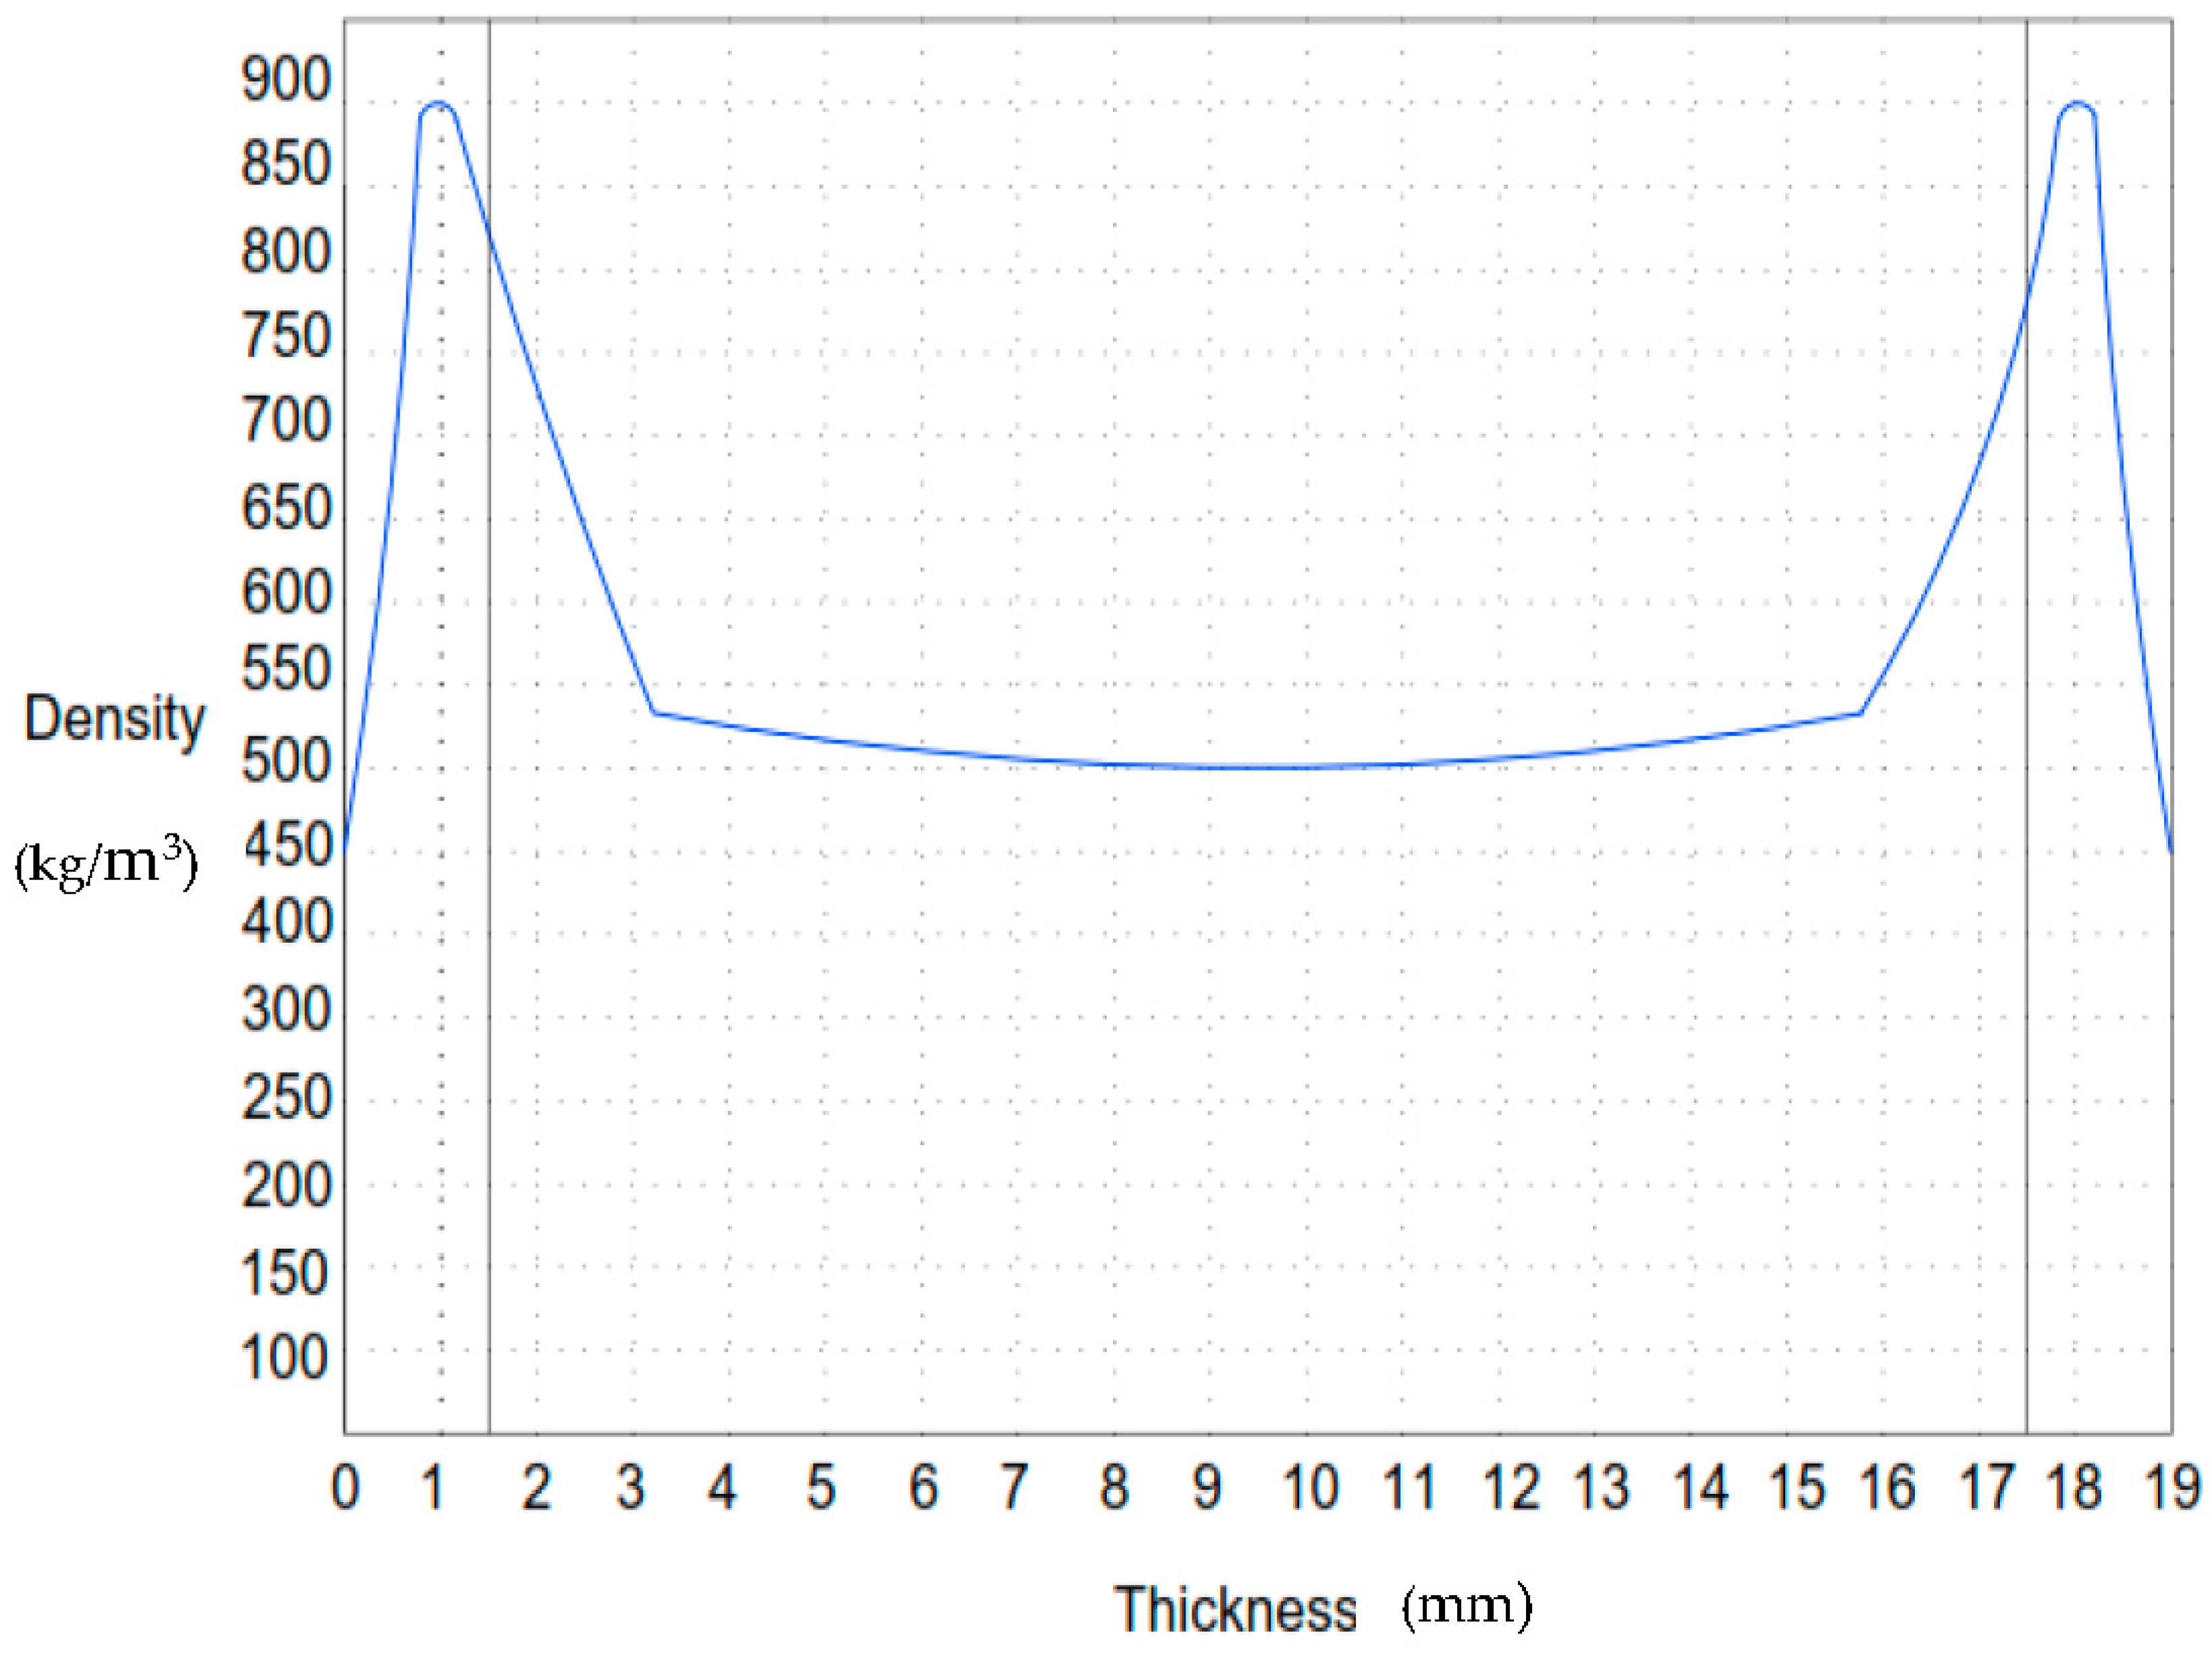
4.1. Vertical Density Profile
4.2. Density Profile
4.3. Internal Bonding and Strength of the Sheet
5. Conclusions
Author Contributions
Funding
Acknowledgments
Conflicts of Interest
References
- Ashori, A.; Nourbakhsh, A.; Karegarfard, A. Properties of medium density fiber board based on bagasse fibers. J. Compos. Mater. 2009, 43, 1927–1934. [Google Scholar] [CrossRef]
- Ayrilmis, N.; Jarusombuti, S.; Fueangvivat, V.; Bauchongkol, P. Effects of thermal treatment of rubber wood fiber on physical and mechanical properties of MDF. J. Trop. For. Sci. 2011, 23, 10–16. [Google Scholar]
- Halvarson, S.B.; Edlund, H.; Norgen, M. Wheat straw as raw material for manufacture of straw MDF. BioResources 2010, 5, 1215–1231. [Google Scholar]
- Ibrahim, Z.; Aziz, A.A.; Ramli, R.; Wanhassan, W.H.; Zainal, N.H. MPOB TT No. 493.Optimum parameters for the production of MDF using 100% oil palm trunks. MPOB Inf. Ser. 2006, 566. [Google Scholar]
- Büyüksarı, Ü.; Hiziroglu, S.; Akkilic, H.; Ayrilmis, N. Mechanical and physical properties of MDF panels laminated with thermally compressed veneer. Compos. Part B Eng. 2012, 43, 110–114. [Google Scholar] [CrossRef]
- Kargafard, A.; Nourbakhsh, A.; Hosseinkhani, H. Investigation of MDF properties produced from horn beam wood. J. Pajouhesh-Va-Sazandegi 2007, 20, 25–31. [Google Scholar]
- Nigro, N.; Storti, M. Hot pressing process modeling for MDF. Int. J. Math. Math. Sci. 2001, 26, 713–729. [Google Scholar] [CrossRef] [Green Version]
- Kargarfard, A.; Latibari, A.J. Performance of corn and cotton stalks for MDF production. BioResources 2011, 6, 1147–1157. [Google Scholar]
- Shupe, F.; Hse, C.Y.; Lee, S. Mechanical and physical properties of agro-based fiberboard. HolzAlsRoh-Ind Werkst. 2006, 64, 74–79. [Google Scholar]
- Zhiyong, C.; Muehl, H.J.; Winandy, J.E. Effect of pressing scheduling on formation of vertical density profile for MDF Panels. In Proceedings of the 40th International Wood Composites Symposium, Seattle, WA, USA, 11–12 April 2006. [Google Scholar]
- Winandy, J.E.; Krzysik, A.M. Thermal degradation of wood fiber during hot pressing of MDF composites. Wood Fiber Sci. 2007, 39, 450–461. [Google Scholar]
- Kargarfard, A.; Jahan-Latibari, A. The effect of press temperature on properties of MDF produced from eucalyptus fibers. Int. J. Lignocellul. Prod. 2014, 1, 142–150. [Google Scholar]
- Groom, L.H.; Mott, L.; Shaler, S. Relationship between fibers furnish properties and performance of structure of MDF. In Proceedings of the 33rd International Particleboard/Composite Materials Symposioum, Pullman, WA, USA, 13–15 April 1999. [Google Scholar]
- Wang, S.; Young, T.M.; Helton, C.; Winistorfer, P.M. Step-closing pressing of medium density fiberboardPart 2. Influences on panel performance and layer characteristics. Eur. J. Wood Wood Prod. 2011, 59, 311–318. [Google Scholar] [CrossRef]
- Ayrilmis, N.; Candan, Z.; Akbulut, T.; Balkiz, O. Effect of sanding on surface properties of MDF. Drv. Ind. Znan. Časopis Pitanja Drv. Tehnol. 2010, 61, 175–181. [Google Scholar]
- Woodson, G.E. Density profile and fiber alignment in fiber board from three southern hardwoods. For. Prod. J. 2011, 27, 29–34. [Google Scholar]
- Gupta, A.; Jordan, P.J.; Pang, S. Modeling of development of vertical density profile of MDF during hot press. In Proceedings of the CHEMECA 2006, Auckland, New Zealand, 17–20 September 2006. [Google Scholar]
- Hu, Y.A.; He, M.; Semple, K.; Chen, M.; Pineda, H.; Zhou, C.; Dai, C. Characterizing mat formation of bamboo fiber composite: Horizontal density distribution. Materials 2021, 14, 1198. [Google Scholar] [CrossRef]
- Camlibel, O.; Akgül, M. Mechanical and physical properties of medium density fiberboard with calcite additive. Wood Res. 2020, 65, 231–244. [Google Scholar] [CrossRef]
- Nguyen, D.V.; Nguyen, T.T.H.; Kubota, S.; Suzuki, S. Effect of size and type of raw material on temperature and vapor pressure behavior of wood based panels during hot pressing. Wood Mater. Sci. Eng. 2021, 1–10. [Google Scholar] [CrossRef]
- Lykidis, C.; Moya, R.; Tenorio, C. The effect of melamine formaldehyde impregnation and hot pressing parameters on the density profile of densified popular wood. Eur. J. Wood Wood Prod. 2020, 78, 433–440. [Google Scholar] [CrossRef]
- Segovia, F.; Blanchet, P.; Essoua, G.G.E. Potential of the crude glycerol and citric acid mixtures as a binder in medium density fiberboard manufacturing. Eur. J. Wood Wood Prod. 2021, 79, 1141–1151. [Google Scholar] [CrossRef]
- Chin, L.K.X.; Baharuddin, A.; Bin, A.; Mustapha, K.B. Characterizations of medium density fiber boards derived from Malaysian merbau and rubber wood. J. Indian Acad. Wood Sci. 2021, 1–12. [Google Scholar] [CrossRef]
- Sala, C.M.; Robles, E.; Kowaluk, G. Influence of the addition of spruce fibers to industrial type high density fiberboards produced with recycled fibers. Waste Biomass Valorization 2021, 12, 4033–4042. [Google Scholar] [CrossRef]
- Esmailpour, A.; Taghiyari, H.R.; Ghorbanali, M.; Mantanis, G.I. Imporving fire retardancy of medium density fiberboard by nano-wollastonite. Fire Mater. 2020, 44, 759–766. [Google Scholar] [CrossRef]
- Gupta, A. Modeling and Optimization of Medium Density Fiberboardhot Pressing. Ph.D. Thesis, University of Canterbury, Christchurch, New Zealand, 2007. [Google Scholar] [CrossRef]
- Winistorfer, P.M.; Young, T.M.; Walker, E. Modeling and comparing vertical density profiles. Wood Fiber Sci. 1996, 28, 133–141. [Google Scholar]

| S.No | Parameters | Value |
|---|---|---|
| 1 | Temperature | 200–220 °C |
| 2 | Pressure | 145–155 bar |
| 3 | Time | 260–275 s |
| 4 | Moisture contents | 8.00–10.00% |
| S.No. | Temperature °C | Pressure Bar | Cycle Time S | Moisture Content % | Bending N/mm2 | Internal Bonding N/mm2 |
|---|---|---|---|---|---|---|
| 1 | 195 | 145 | 260 | 8.00 | 12 | 0.25 |
| 2 | 200 | 145 | 260 | 8.00 | 24 | 0.56 |
| 3 | 200 | 153 | 268 | 8.80 | 16 | 0.40 |
| 4 | 202 | 152 | 265 | 9.50 | 17 | 0.38 |
| 5 | 205 | 155 | 270 | 10.00 | 22 | 0.46 |
| 6 | 206 | 154 | 266 | 9.75 | 19 | 0.41 |
| 7 | 207 | 147 | 260 | 8.70 | 18 | 0.39 |
| 8 | 210 | 150 | 265 | 8.50 | 28 | 0.55 |
| 9 | 211 | 148 | 263 | 8.20 | 15 | 0.44 |
| 10 | 213 | 150 | 270 | 9.20 | 14 | 0.42 |
| 11 | 215 | 155 | 275 | 9.00 | 26 | 0.58 |
| 12 | 218 | 145 | 275 | 10.00 | 21 | 0.43 |
| 13 | 220 | 155 | 265 | 8.00 | 32 | 0.64 |
| 14 | 225 | 155 | 272 | 8.00 | 20 | 0.39 |
| S.No. | Temperature °C | Pressure Bar | Cycle Time S | Moisture Content % | Bending N/mm2 | Internal Bonding N/mm2 |
|---|---|---|---|---|---|---|
| 1 | 200 | 145 | 260 | 8.00 | 24 | 0.56 |
| 2 | 205 | 155 | 270 | 10.00 | 22 | 0.46 |
| 3 | 210 | 150 | 265 | 8.50 | 28 | 0.55 |
| 4 | 215 | 155 | 275 | 9.00 | 26 | 0.58 |
| 5 | 220 | 155 | 265 | 8.00 | 32 | 0.64 |
| S.No. | Density Kg/m3 | Piece No | Weight (g) | Length (mm) | Width (mm) | Thickness (mm) |
|---|---|---|---|---|---|---|
| 1 | 744 | L1 | 261.14 | 200 | 100 | 17.56 |
| 2 | 713 | L2 | 249.16 | 200 | 100 | 17.48 |
| 3 | 710 | L3 | 250.34 | 200 | 100 | 17.64 |
| 4 | 715 | L4 | 250.65 | 200 | 100 | 17.52 |
| 5 | 712 | L5 | 250.66 | 200 | 100 | 17.61 |
| 6 | 714 | L6 | 250.76 | 200 | 100 | 17.56 |
| 7 | 709 | R6 | 249.34 | 200 | 100 | 17.59 |
| 8 | 710 | R5 | 250.66 | 200 | 100 | 17.65 |
| 9 | 711 | R4 | 251.11 | 200 | 100 | 17.66 |
| 10 | 711 | R3 | 252.43 | 200 | 100 | 17.75 |
| 11 | 713 | R2 | 251.56 | 200 | 100 | 17.65 |
| 12 | 739 | R1 | 260.34 | 200 | 100 | 17.61 |
| Sample | P.max N | Strength N/mm2 | Span mm | Sample weight (g) | Density kg/mm3 |
|---|---|---|---|---|---|
| Middle M1 of right | 641 | 24.04 | 320 | 198.24 | 670 |
| Middle M2 | 653 | 24.49 | 320 | 195.66 | 661 |
| Middle M3 | 648 | 24.30 | 320 | 194.35 | 657 |
| Middle M4 | 655 | 24.56 | 320 | 196.41 | 664 |
| Middle M5 | 648 | 24.30 | 320 | 199.12 | 673 |
| Average | 24.34 | 665 |
| Sample | P.max N | Strength N/mm2 | Sample weight (g) | Density kg/mm3 |
|---|---|---|---|---|
| Middle M1 of right | 1523 | 0.61 | 26.85 | 671 |
| Middle M2 | 1411 | 0.56 | 26.44 | 661 |
| Middle M3 | 1278 | 0.51 | 26.31 | 658 |
| Middle M4 | 1352 | 0.54 | 26.13 | 653 |
| Middle M5 | 1466 | 0.59 | 27.26 | 682 |
| Average | 0.56 | 665 |
| Density | Average | 850 | kg/m3 | |
| Min. | Valve | 652 | kg/m3 | |
| Position | 5.392 | mm | ||
| Max. Left | Valve | 849 | kg/m3 | |
| Position | 0.560 | mm | ||
| Max. Right | Valve | 851 | kg/m3 | |
| Position | 0.713 | mm | ||
| Ratio | Min./Avg | 81.10 | % | |
| Gravimetric Valve | Width | 50 | mm | |
| Depth | 50 | mm | ||
| Weight | 29.21 | g |
| S.No. | Density Kg/m3 | Piece No | Weight (g) | Length (mm) | Width (mm) | Thickness (mm) |
|---|---|---|---|---|---|---|
| 1 | 687 | L1 | 256.66 | 200 | 100 | 18.68 |
| 2 | 655 | L2 | 245.13 | 200 | 100 | 18.71 |
| 3 | 654 | L3 | 244.23 | 200 | 100 | 18.66 |
| 4 | 653 | L4 | 243.67 | 200 | 100 | 18.65 |
| 5 | 657 | L5 | 244.54 | 200 | 100 | 18.61 |
| 6 | 663 | L6 | 245.98 | 200 | 100 | 18.56 |
| 7 | 657 | R6 | 244.45 | 200 | 100 | 18.59 |
| 8 | 659 | R5 | 243.98 | 200 | 100 | 18.52 |
| 9 | 659 | R4 | 244.45 | 200 | 100 | 18.55 |
| 10 | 658 | R3 | 244.98 | 200 | 100 | 18.61 |
| 11 | 661 | R2 | 246.56 | 200 | 100 | 18.64 |
| 12 | 688 | R1 | 257.76 | 200 | 100 | 18.72 |
| Sample | P.max N | Strength N/mm2 | Span mm | Sample Weight (g) | Density kg/mm3 |
|---|---|---|---|---|---|
| Middle M1 of right | 600 | 22.50 | 320 | 201.14 | 680 |
| Middle M2 | 556 | 20.85 | 320 | 198.46 | 670 |
| Middle M3 | 582 | 21.83 | 320 | 196.33 | 663 |
| Middle M4 | 599 | 22.46 | 320 | 197.67 | 668 |
| Middle M5 | 614 | 23.03 | 320 | 200.56 | 678 |
| Average | 22.13 | 672 |
| Sample | P.max N | Strength N/mm2 | Sample Weight (g) | Density kg/mm3 |
|---|---|---|---|---|
| Middle M1 of right | 1167 | 0.47 | 26.26 | 657 |
| Middle M2 | 1219 | 0.49 | 26.01 | 650 |
| Middle M3 | 1075 | 0.43 | 25.56 | 639 |
| Middle M4 | 1200 | 0.48 | 25.98 | 650 |
| Middle M5 | 1115 | 0.45 | 26.11 | 653 |
| Average | 0.46 | 650 |
| Density | Average | 898 | kg/m3 | |
| Min. | Valve | 550 | kg/m3 | |
| Position | 6.921 | mm | ||
| Max. Left | Valve | 895 | kg/m3 | |
| Position | 0.495 | mm | ||
| Max. Right | Valve | 899 | kg/m3 | |
| Position | 0.623 | mm | ||
| Ratio | Min./Avg | 79.92 | % | |
| Gravimetric Valve | Width | 50 | mm | |
| Depth | 50 | mm | ||
| Weight | 27.52 | g |
| S.No. | Density Kg/m3 | Piece No | Weight (g) | Length (mm) | Width (mm) | Thickness (mm) |
|---|---|---|---|---|---|---|
| 1 | 728 | L1 | 262.56 | 200 | 100 | 18.03 |
| 2 | 707 | L2 | 255.44 | 200 | 100 | 18.06 |
| 3 | 705 | L3 | 254.19 | 200 | 100 | 18.02 |
| 4 | 706 | L4 | 253.91 | 200 | 100 | 17.99 |
| 5 | 704 | L5 | 254.03 | 200 | 100 | 18.05 |
| 6 | 710 | L6 | 255.71 | 200 | 100 | 18.01 |
| 7 | 709 | R6 | 254.54 | 200 | 100 | 17.96 |
| 8 | 709 | R5 | 254.98 | 200 | 100 | 17.99 |
| 9 | 708 | R4 | 255.45 | 200 | 100 | 18.04 |
| 10 | 711 | R3 | 255.98 | 200 | 100 | 18.01 |
| 11 | 711 | R2 | 256.56 | 200 | 100 | 18.05 |
| 12 | 734 | R1 | 263.63 | 200 | 100 | 17.97 |
| Sample | P.max N | Strength N/mm2 | Span mm | Sample Weight (g) | Density kg/mm3 |
|---|---|---|---|---|---|
| Middle M1 of right | 715 | 26.81 | 320 | 205.76 | 695 |
| Middle M2 | 756 | 28.35 | 320 | 203.12 | 686 |
| Middle M3 | 781 | 29.29 | 320 | 200.34 | 677 |
| Middle M4 | 736 | 27.60 | 320 | 202.75 | 685 |
| Middle M5 | 709 | 26.59 | 320 | 205.61 | 695 |
| Average | 27.73 | 688 |
| Sample | P.max N | Strength N/mm2 | Sample Weight (g) | Density kg/mm3 |
|---|---|---|---|---|
| Middle M1 of right | 1387 | 0.55 | 27.55 | 689 |
| Middle M2 | 1468 | 0.59 | 27.23 | 681 |
| Middle M3 | 1254 | 0.50 | 26.15 | 654 |
| Middle M4 | 1345 | 0.54 | 25.35 | 634 |
| Middle M5 | 1477 | 0.59 | 27.86 | 697 |
| Average | 0.55 | 671 |
| Density | Average | 798 | kg/m3 | |
| Min. | Valve | 652 | kg/m3 | |
| Position | 7.020 | mm | ||
| Max. Left | Valve | 790 | kg/m3 | |
| Position | 0.569 | mm | ||
| Max. Right | Valve | 800 | kg/m3 | |
| Position | 0.758 | mm | ||
| Ratio | Min./Avg | 77.75 | % | |
| Gravimetric Valve | Width | 50 | mm | |
| Depth | 50 | mm | ||
| Weight | 26.52 | g |
| S.No. | Density Kg/m3 | Piece No | Weight (g) | Length (mm) | Width (mm) | Thickness (mm) |
|---|---|---|---|---|---|---|
| 1 | 723.0 | L1 | 265.21 | 200 | 100 | 18.34 |
| 2 | 694.4 | L2 | 254.29 | 200 | 100 | 18.31 |
| 3 | 701.3 | L3 | 256.13 | 200 | 100 | 18.26 |
| 4 | 695.1 | L4 | 255.11 | 200 | 100 | 18.35 |
| 5 | 693.9 | L5 | 254.23 | 200 | 100 | 18.32 |
| 6 | 700.0 | L6 | 257.87 | 200 | 100 | 18.42 |
| 7 | 695.3 | R6 | 255.45 | 200 | 100 | 18.37 |
| 8 | 693.3 | R5 | 254.32 | 200 | 100 | 18.34 |
| 9 | 701.1 | R4 | 256.76 | 200 | 100 | 18.31 |
| 10 | 692.3 | R3 | 254.34 | 200 | 100 | 18.37 |
| 11 | 694.0 | R2 | 255.67 | 200 | 100 | 18.42 |
| 12 | 728.5 | R1 | 266.76 | 200 | 100 | 18.31 |
| Sample | P.max N | Strength N/mm2 | Span mm | Sample Weight (g) | Density kg/mm3 |
|---|---|---|---|---|---|
| Middle M1 of right | 687 | 25.76 | 320 | 201.13 | 679 |
| Middle M2 | 676 | 25.35 | 320 | 197.52 | 667 |
| Middle M3 | 695 | 26.06 | 320 | 195.63 | 661 |
| Middle M4 | 703 | 26.36 | 320 | 198.98 | 672 |
| Middle M5 | 707 | 26.51 | 320 | 200.23 | 676 |
| Average | 26.01 | 671 |
| Sample | P.max N | Strength N/mm2 | Sample Weight (g) | Density kg/mm3 |
|---|---|---|---|---|
| Middle M1 of right | 1456 | 0.58 | 27.12 | 678 |
| Middle M2 | 1515 | 0.61 | 26.52 | 663 |
| Middle M3 | 1378 | 0.55 | 26.13 | 653 |
| Middle M4 | 1404 | 0.56 | 25.54 | 639 |
| Middle M5 | 1511 | 0.60 | 27.76 | 694 |
| Average | 0.58 | 665 |
| Density | Average | 750 | kg/m3 | |
| Min. | Valve | 525 | kg/m3 | |
| Position | 7.052 | mm | ||
| Max. Left | Valve | 755 | kg/m3 | |
| Position | 0.461 | mm | ||
| Max. Right | Valve | 746 | kg/m3 | |
| Position | 0.836 | mm | ||
| Ratio | Min./Avg | 82.4 | % | |
| Gravimetric Valve | Width | 50 | mm | |
| Depth | 50 | mm | ||
| Weight | 28.78 | g |
| S.No. | Density Kg/m3 | Piece No | Weight (g) | Length (mm) | Width (mm) | Thickness (mm) |
|---|---|---|---|---|---|---|
| 1 | 744 | L1 | 268.24 | 200 | 100 | 18.03 |
| 2 | 721 | L2 | 260.11 | 200 | 100 | 18.05 |
| 3 | 726 | L3 | 261.56 | 200 | 100 | 18.01 |
| 4 | 725 | L4 | 260.78 | 200 | 100 | 17.98 |
| 5 | 724 | L5 | 261.31 | 200 | 100 | 18.05 |
| 6 | 721 | L6 | 259.78 | 200 | 100 | 18.02 |
| 7 | 721 | R6 | 260.04 | 200 | 100 | 18.03 |
| 8 | 725 | R5 | 260.98 | 200 | 100 | 17.99 |
| 9 | 724 | R4 | 260.64 | 200 | 100 | 17.99 |
| 10 | 725 | R3 | 261.25 | 200 | 100 | 18.01 |
| 11 | 724 | R2 | 260.65 | 200 | 100 | 18.01 |
| 12 | 750 | R1 | 269.78 | 200 | 100 | 17.99 |
| Sample | P.max N | Strength N/mm2 | Span mm | Sample Weight (g) | Density kg/mm3 |
|---|---|---|---|---|---|
| Middle M1 of right | 827 | 31.01 | 320 | 207.53 | 701 |
| Middle M2 | 856 | 32.10 | 320 | 205.11 | 693 |
| Middle M3 | 898 | 33.68 | 320 | 203.68 | 688 |
| Middle M4 | 861 | 32.29 | 320 | 207.09 | 700 |
| Middle M5 | 854 | 32.03 | 320 | 208.65 | 705 |
| Average | 32.22 | 697 |
| Sample | P.max N | Strength N/mm2 | Sample Weight (g) | Density kg/mm3 |
|---|---|---|---|---|
| Middle M1 of right | 1698 | 0.68 | 27.76 | 694 |
| Middle M2 | 1587 | 0.63 | 27.98 | 700 |
| Middle M3 | 1476 | 0.59 | 27.11 | 678 |
| Middle M4 | 1523 | 0.61 | 27.31 | 683 |
| Middle M5 | 1654 | 0.66 | 27.64 | 691 |
| Average | 0.64 | 689 |
| Density | Average | 950 | kg/m3 | |
| Min. | Valve | 752 | kg/m3 | |
| Position | 8.201 | mm | ||
| Max. Left | Valve | 942 | kg/m3 | |
| Position | 0.593 | mm | ||
| Max. Right | Valve | 947 | kg/m3 | |
| Position | 0.792 | mm | ||
| Ratio | Min./Avg | 89.2 | % | |
| Gravimetric Valve | Width | 50 | mm | |
| Depth | 50 | mm | ||
| Weight | 32.2 | g |
Publisher’s Note: MDPI stays neutral with regard to jurisdictional claims in published maps and institutional affiliations. |
© 2021 by the authors. Licensee MDPI, Basel, Switzerland. This article is an open access article distributed under the terms and conditions of the Creative Commons Attribution (CC BY) license (https://creativecommons.org/licenses/by/4.0/).
Share and Cite
Minhas, A.H.; Ullah, N.; Riaz, A.A.; Siddiqi, M.U.R.; Abualnaja, K.M.; Althubeiti, K.; Muhammad, R. Experimental Investigation of Vertical Density Profile of Medium Density Fiberboard in Hot Press. Appl. Sci. 2021, 11, 10769. https://doi.org/10.3390/app112210769
Minhas AH, Ullah N, Riaz AA, Siddiqi MUR, Abualnaja KM, Althubeiti K, Muhammad R. Experimental Investigation of Vertical Density Profile of Medium Density Fiberboard in Hot Press. Applied Sciences. 2021; 11(22):10769. https://doi.org/10.3390/app112210769
Chicago/Turabian StyleMinhas, Asfar Hameed, Naveed Ullah, Asim Ahmad Riaz, Muftooh Ur Rehman Siddiqi, Khamael M. Abualnaja, Khaled Althubeiti, and Riaz Muhammad. 2021. "Experimental Investigation of Vertical Density Profile of Medium Density Fiberboard in Hot Press" Applied Sciences 11, no. 22: 10769. https://doi.org/10.3390/app112210769
APA StyleMinhas, A. H., Ullah, N., Riaz, A. A., Siddiqi, M. U. R., Abualnaja, K. M., Althubeiti, K., & Muhammad, R. (2021). Experimental Investigation of Vertical Density Profile of Medium Density Fiberboard in Hot Press. Applied Sciences, 11(22), 10769. https://doi.org/10.3390/app112210769