1. Introduction
Absorption is a separation process used to capture many gases—such as CO
2—which, when released into the atmosphere, contributes to the increase of global warming. The absorption technology for CO
2 capture mainly consists of the absorber column and the regeneration unit. The absorber column can be a plate column or packed column. The absorbent enters the absorber from the top, and the waste gas containing CO
2 enters the absorber from the bottom. The gas and liquid phases come into contact with each other on the trays or packing. The trays or packing material increase the gas–liquid interface, which increases mass and heat transfer between the contact phases. The CO
2 component passes from the gas phase to a liquid phase and is then absorbed. Knowledge of the hydrodynamic properties of trays is necessary for the design and operation of absorption columns because they control the liquid height on the trays and affect the pressure drop, tray efficiency, and flow conditions on the trays (Wijn, et al., 1999) [
1].
In the literature, various studies can be found on the influence of the inlet gas flow on the hydrodynamic characteristics and mass transfer in gas–liquid systems. Some studies discuss the influence of gas velocity on froth height and the height of clear liquid on the trays.
Dhulesia, H. (1984) [
2] tested the effect of gas velocity on the height of clear liquid for three sieve trays. They plotted the height of the clear liquid versus the flow ratio
, they found that the height of the clear liquid was proportional to the flow ratio for froth regime. However, for the spray regime, they stated that the dependence of clear liquid height on the flow ratio group could not be detected. Dhulesia, H. (1984) [
2] also investigated the influence of liquid and gas rates on the clear liquid height by using a valve tray with a weir height of 25 mm. They established that the clear liquid height increases with liquid volume, where the clear liquid height decreases with increasing superficial air velocity.
Badssi, Bugarel et al. (1988) [
3] explored the effect of the superficial velocity of gas on the interfacial area in two different gas–liquid systems CO
2-DEA and CO
2-NaOH. The experiment was carried out in a laboratory column equipped with cross-flow sieve trays. They found that the total interfacial area increased when the superficial velocity was increased.
Wijn (1999) [
1] stated that the liquid height depends on the gas and liquid loads, gas and liquid properties, and some geometrical parameters such as the height and length of the weir, free hole area, hole diameter, etc.
Van Baten, Ellenberger et al. (2001) [
4] investigated the hydrodynamics of a sieve tray column for reactive distillation. The author observed that the clear liquid decreased significantly when the superficial velocity of the gas increased between 0.4–1 m/s.
Furzer et al. (2001) [
5] determined the height of froth and the height of clear liquid on dual-flow trays with 20% free area; the authors stated that there is a strong relationship between the height of froth and the height of clear liquid, as the height of froth increases when the height of clear liquid increases. The authors noted that the height of the clear liquid increases with the vapour velocity.
Rahimi, Zarei et al. (2010) [
6] studied hydraulic parameters such as dry pressure drop in a column with a diameter of 1.22 m. The column has two sieve trays and two chimney trays; the author observed that the pressure drop increases when the Fs factor is increased. Their experiments were conducted in a round tower with a diameter of 1.22 m for the air/water system; The author observed that the height of the clear liquid decreases as the velocity of the gas increases.
R Brahem et al. (2015) [
7] reviewed experimental measurements of hydrodynamic and interface parameters performed on two pilot-scale rectangular valve tray columns. They present their results for the height of the clear liquid as a function of the flow ratio Ψ and show that the height of the clear liquid increases as the flow ratio Ψ increases. In the same study, they also plot that the tray pressure drop increases by increasing the gas kinetic factor, Fa.
Kurella, Bhukya et al. (2017) [
8] studied the effect of the gas velocity on the average height of the clear liquid that is on the tray; their experimental study was conducted in a dual-flow sieve plate scrubber. The authors found that at constant liquid flow rates, the average clear liquid height increased as the gas loading factor (Fs) was increased.
Kurella, Bhukya et al. (2017) [
8] examined the effects of gas and liquid flow rates on the percent removal of H
2S at H
2S input concentrations of 50–300 ppm. Their experiments were performed in a lab-scale three-stage dual-flow sieve plate column scrubber. The authors concluded that the percentage of H
2S removal increases as the gas flow rate is increased.
Feng, Fan et al. (2018) [
9] analysed the effects of the Fs factor on dry pressure drop, wet pressure drop, clear liquid height, and froth height. Their experiments were conducted using a folding sieve tray (FST), which consists of double-perforated oblique planes folding at a specific angle. The author found that the dry pressure drop, wet tray pressure drop, clear liquid height, and froth height increased when the Fs factor of the gas was increased, while the clear liquid height decreased when the Fs factor was increased.
There are numerous studies in the literature investigating the effect of parameters such as temperature, flow rate of the solvent flow rate of the inlet gas on CO2 absorption, but the study of the correlation between the hydrodynamic characteristics of the sieve tray and CO2 absorption is still limited.
The objectives of this study are summarized as follows:
- (1)
To experimentally investigate the effect of inlet gas flow rate on the hydrodynamic properties of the sieve tray column, such as total tray pressure drop, wet tray pressure drop, dry tray pressure drop, clear liquid height, liquid holdup, and froth height, an absorber test rig was constructed and operated.
- (2)
Investigating the influence of inlet gas flow rate on the hydrodynamic characteristics of the sieve tray and its effect on the performance of a sieve tray absorber for CO2 capture using water as the absorbent.
2. Experimental
2.1. Test Rig Setup
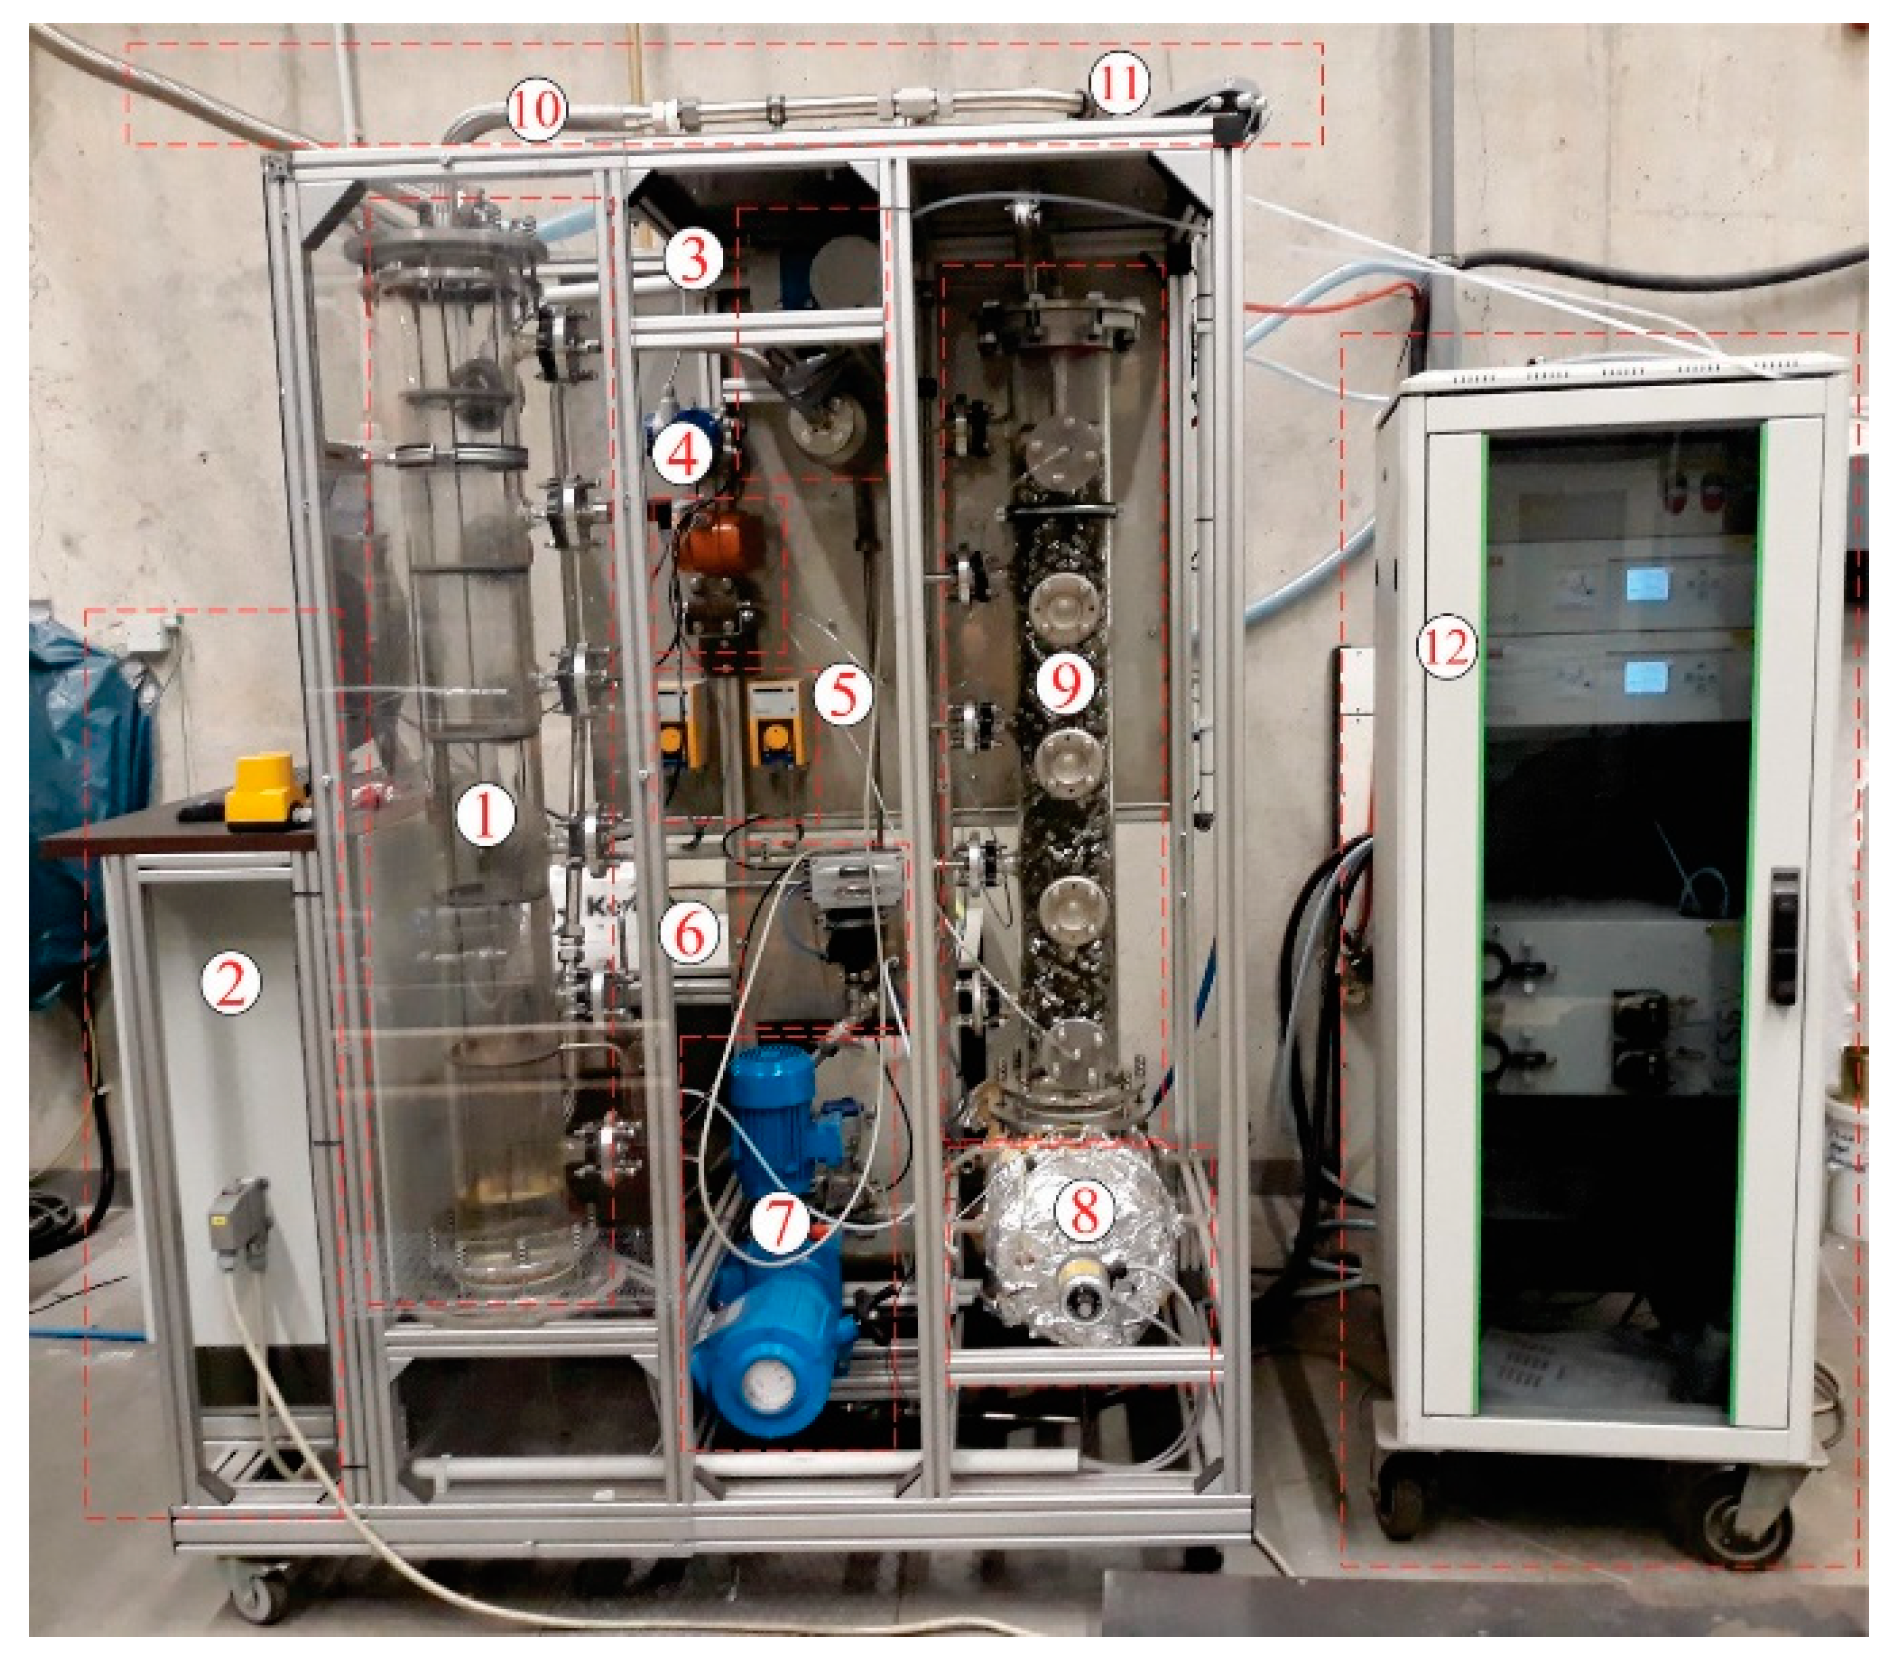
Figure 1 and
Figure 2 show an absorber test rig that was constructed at the Technical University of Darmstadt. The absorber test rig consists of four main parts: an absorber column, a regeneration unit, a gas mixing unit, and a gas analysis unit. The absorber consists of a glass column with an inner diameter of 152 mm and a height of 1500 mm. The upper and lower parts of the column were closed by suitable metal flanges. The lower flange contains the outlet of the liquid and the upper flange contains the outlet of the gas. The column has 12 glass nozzles to which metal flanges can be connected, 10 nozzles of which are used to measure the temperatures and pressures in the absorber, and 2 nozzles for the entrance of the liquid and gas into the absorber.
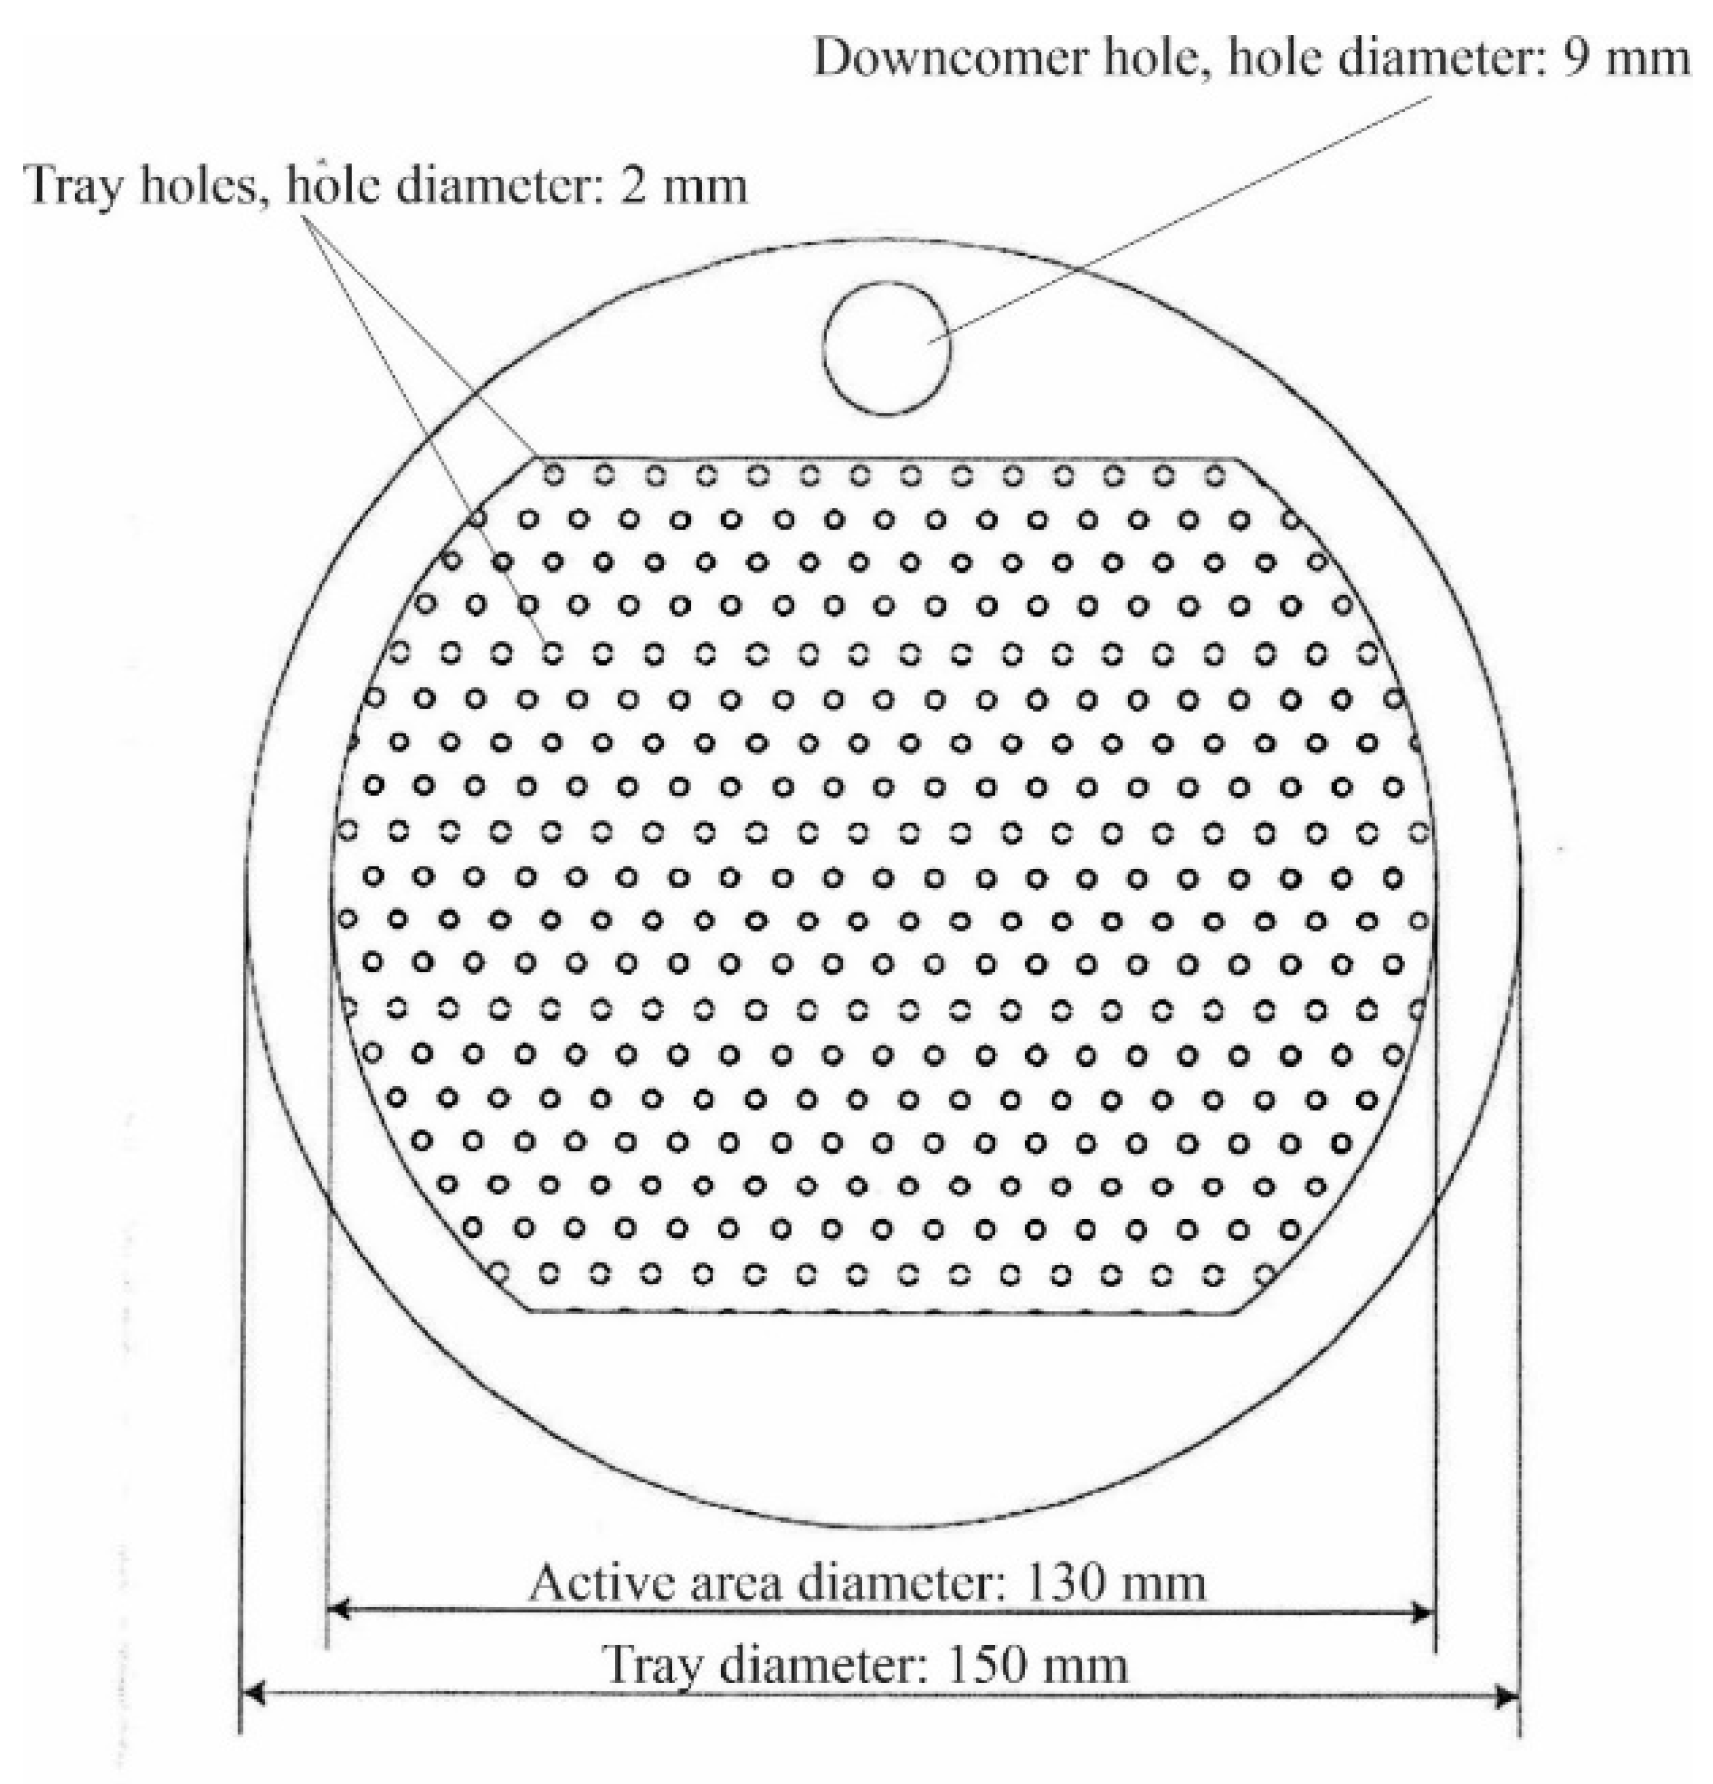
Figure 3 shows a cross section of the sieve tray used in the absorber, five sieve trays are fixed with threaded rods and inserted into the absorber. The diameter of the sieve tray is 150 mm, the space between the sieve tray and the glass wall is sealed with rubber seals. The percentage of the sieve holes area in the active area is 0.071, the diameter of the hole in the sieve tray is 2 mm, the vertical and horizontal pitch between the holes is 6 mm, and the height of the weir is 15 mm. The tray spacing is 240 mm. The mixing unit consists of two lines connected to a manifold in front of the absorber. One of the lines is connected to cylinders filled with CO
2 gas, while the other is connected to an air compressor. The MFC is used to control the flow rate of the gases introduced into the absorber. A gas analyser is connected to the gas outlet line to measure the volume fraction of CO
2 at the outlet of the absorber.
The regeneration unit is used to regenerate the absorbent and recycle it to the absorber as a lean absorbent. It consists of a packed column, a reboiler, two heat exchangers, a recycle pump and a make-up pump. The packed column was made of a glass column with a height of 1300 mm and a diameter of 152 mm. The packed column is filled with a metallic packing of the Pall-Ring 15 mm type with a specific surface area of 360 m2/m3 and a free volume of 95%. The height of the packed column is 1 m. The rich absorbent enters the packed column through a liquid distributor to uniformly distribute the absorbent over the top of the packed column. The shaped liquid distributor is of spray type, which contains 13 holes uniformly arranged on the liquid distributor. The packed column is installed on the reboiler, a heating coil with a heating capacity of 4.5 kW was inserted into the reboiler to heat and regenerate the absorbent. A circulation pump is connected to the reboiler, which draws the water from the reboiler and pumps it into the absorber. The lean hot absorbent is cooled by two heat exchangers. In the first heat exchanger, the lean hot absorbent is precooled by heat exchange with the absorbent leaving the absorber, while in a second heat exchanger the precooled absorbent is cooled by heat exchange with cold water.
2.2. Instrumentation and Control Equipment of the Test Rig
The test stand is equipped with various devices and control circuits installed to measure the required parameters of the absorption process and for safe operation. A pressure reducer is installed on each line of the gas mixer to set the maximum pressure of the gas entering the absorber. After the pressure reducer, a magnetic valve is installed, which allows opening or closing the gas supply and can be closed in case of emergency. An MFC is attached to each line of the gas mixer to control the volume flow. A temperature sensor is placed near each absorber tray to measure the temperature of the liquid on that tray. A Coriolis device is placed at the inlet of the fluid to measure the temperature and flow rate of the water entering the absorber. A pressure difference meter was attached to the absorber column to estimate the total pressure drop in the tray.
The test rig is equipped with five control loops for control. The first control loop is used to regulate the pressure to the set point and to prevent the pressure from rising above 0.6 MPa (permissible internal pressure of the glass absorber). The pressure control circuit consists of a control valve and a pressure sensor. The control valve is attached to the gas outlet of the absorber, while the pressure sensor is attached to the column. The pressure control loop starts controlling the pressure after the gas enters the absorber, resulting in a pressure increase. The pressure sensor sends a signal with the actual value of the pressure to a PID controller. The PID controller compares the set point of the pressure with the actual value of the pressure and gives a signal to the control valve, which opens or closes with the percentage value to keep the pressure at the desired set point. At the outlet of the absorber, there is a safety pressure valve that releases the pressure in the absorber when it reaches the value of 0.45 MPa. This design protects the glass absorber from unexpected pressure development above 0.45 MPa.
The second control circuit is used to control the liquid level at the bottom of the absorber. The liquid level control is necessary because it prevents the gas from flowing from the liquid outlet and prevents the accumulation of the liquid in the absorber to a high level. The level control circuit consists of a pressure differential device and a control valve. The pressure differential device is installed in the sump of the column, while the control valve is attached to the liquid outlet of the absorber. The third control circuit regulates the level of absorbent in the reboiler, since a certain loss of absorbent occurs due to the evaporation of water. The control circuit consists of a make-up pump and a level sensor. The level sensor sends a signal to the make-up pump when the absorbent level falls below the set point to pump fresh absorbent into the reboiler. The fourth control loop is used to control the temperature of the absorbent in the reboiler. The purpose of this control circuit is to regenerate the absorbent by heating it using the heating coil installed in the reboiler. Since the third control circuit may not work for unexpected reasons, a control circuit (the fifth control circuit) is installed in the reboiler to protect the heating coil, which switches off the heating element when the liquid level in the reboiler drops below the set value of the absorbent level.
2.3. Test Procedure
The CO2 gas was mixed with air in the gas mixing unit; the air served as the carrier gas. The CO2 volume fraction was 0.3 in all experiments, and the inlet gas flow rate was varied in the ranges 12–24 Nm3/h. The pressure of the absorber was varied at 0.22, 0.24, and 0.26 MPa. Distilled water was used as the absorbent. The volume flow rate of the feed water was almost constant at 0.148 m3/h, and the temperature was controlled at 19.5 °C. The regeneration unit was operated with a thermal power of 4.5 kW over time.
3. Results and Discussion
3.1. Effect of the Inlet Gas Flow Rate on Outlet CO2 Volume Fraction
The absorber test rig is run for 10 min under specified conditions for every measurement, resulting in time-dependent values for each measured parameter (i.e., pressure, temperature, and gas concentrations). The standard deviation, which indicates the range of variation of each measured parameter, is then calculated to estimate the random error. The systematic error of the measuring instruments is constant for all tests and is therefore not presented additionally in this chapter. In general, the measurement uncertainty of directly measured values (e.g., temperature, pressure, and flue gas concentrations) depends only on the relative uncertainty of the measuring instruments and is given by the relative error. For indirectly measured parameters or calculated values (e.g., volumetric flow rate, where the pressure difference and temperature are used in the calculation), the Gaussian error propagation method is applied, assuming normally distributed uncertainties. In this study, the volumetric concentrations are determined with the gas analysis unit, and the maximum relative error for CO2 in the different process streams is about 3%.
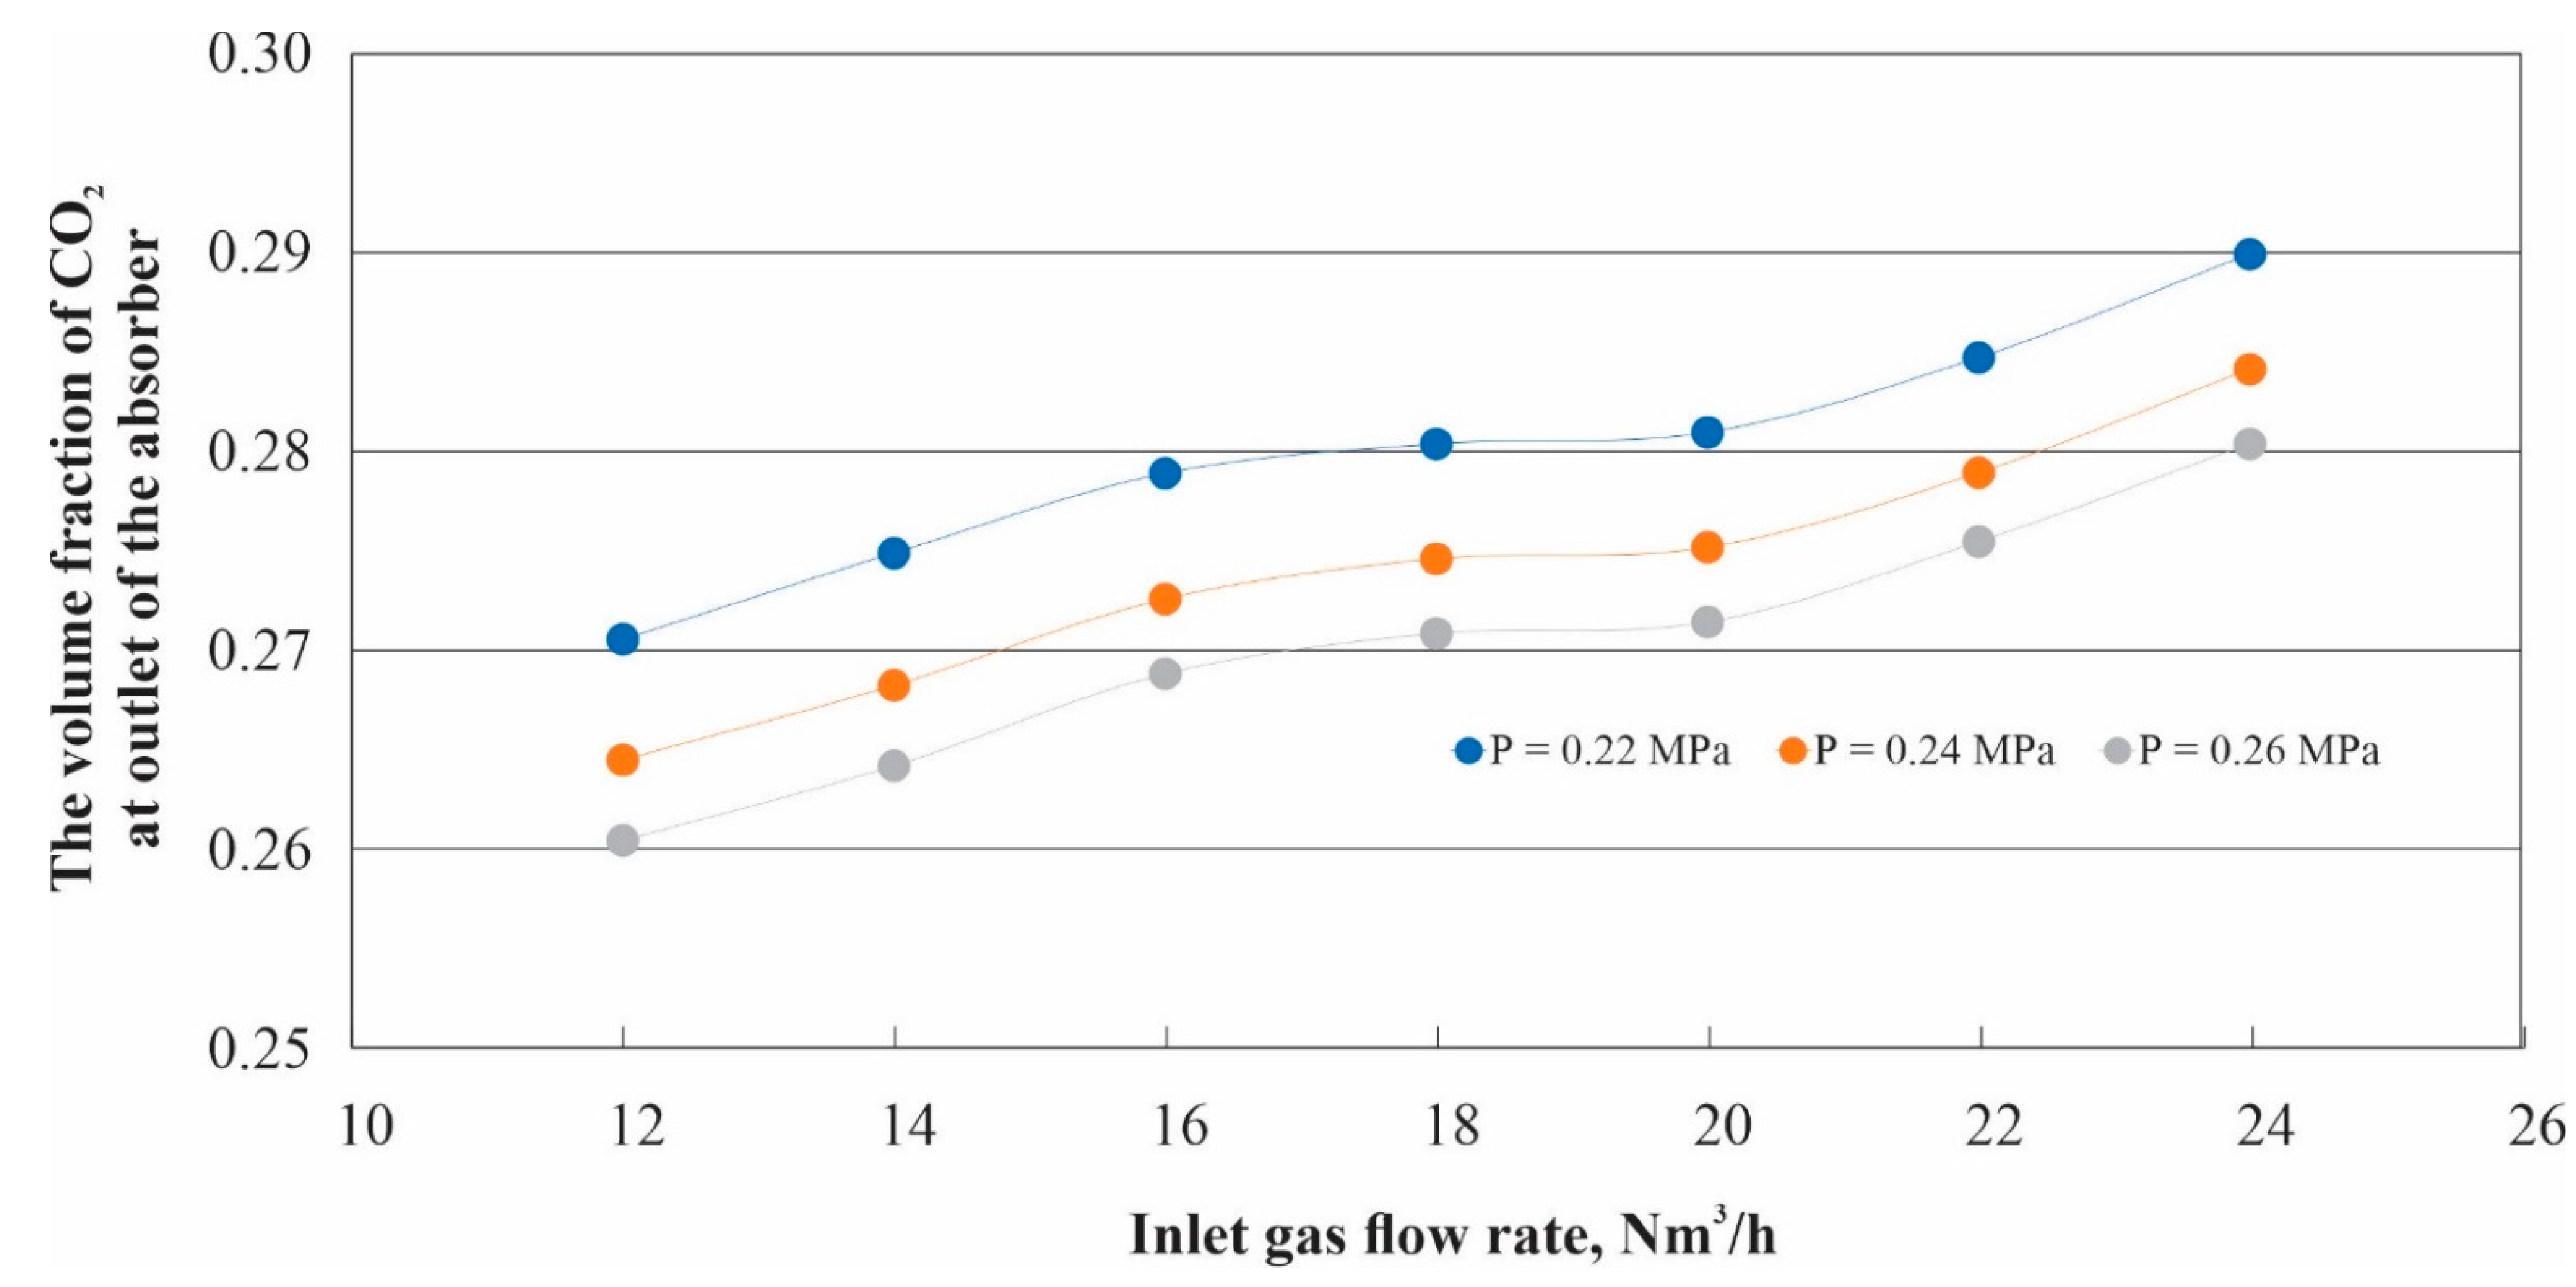
Figure 4 demonstrates the effect of inlet gas flow rate on the outlet volume fraction of CO
2 at pressures of 0.22, 0.24, and 0.26 MPa. From
Figure 4, it can be shown that increasing the inlet gas flow rate has a significant effect on the volume fraction of CO
2. The volume fraction of CO
2 goes up with the increase of the inlet gas flow rate from 12 to 16 Nm
3/h and from 20 to 24 Nm
3/h, while an increase of the inlet gas flow rate between 16 and 20 Nm
3/h has a slight effect on the volume fraction of CO
2. The trend of this effect is similar for all pressure values investigated.
The principal explanation for this effect may be that a change in the gas flow rate will influence the hydrodynamic characteristics of the tray—such as clear liquid height, the liquid holdup of the tray, and the froth height on the tray—which will be studied later.
The standard errors of the measurements of CO
2 volume fraction are shown in
Table 1.
3.2. Effect of the Inlet Gas Flow Rate Hydrodynamic Characteristics of Sieve Tray
3.2.1. Effect of the Inlet Gas Flow Rate on Tray Pressure Drop
To study the effect of the inlet gas flow rate on tray pressure drop, the absorber test rig is equipped with a pressure difference device that measures the pressure difference before and after the third tray as shown in
Figure 2. The pressure difference device measures the total pressure drop of the tray, which is the sum of the dry and wet pressure drops, is calculated as
where
is the total tray pressure drop,
is the dry tray pressure drop, and
is the wet tray pressure drop.
is measured during performing the experiments when the liquid and the gas are coming into the column, in contrast
is measured when only the gas is coming into the column at operating conditions of gas flow rates between 12 to 24 Nm
3/h and different pressure with 0.22, 0.24, and 0.26 MPa.
By measuring both
one can get the
as
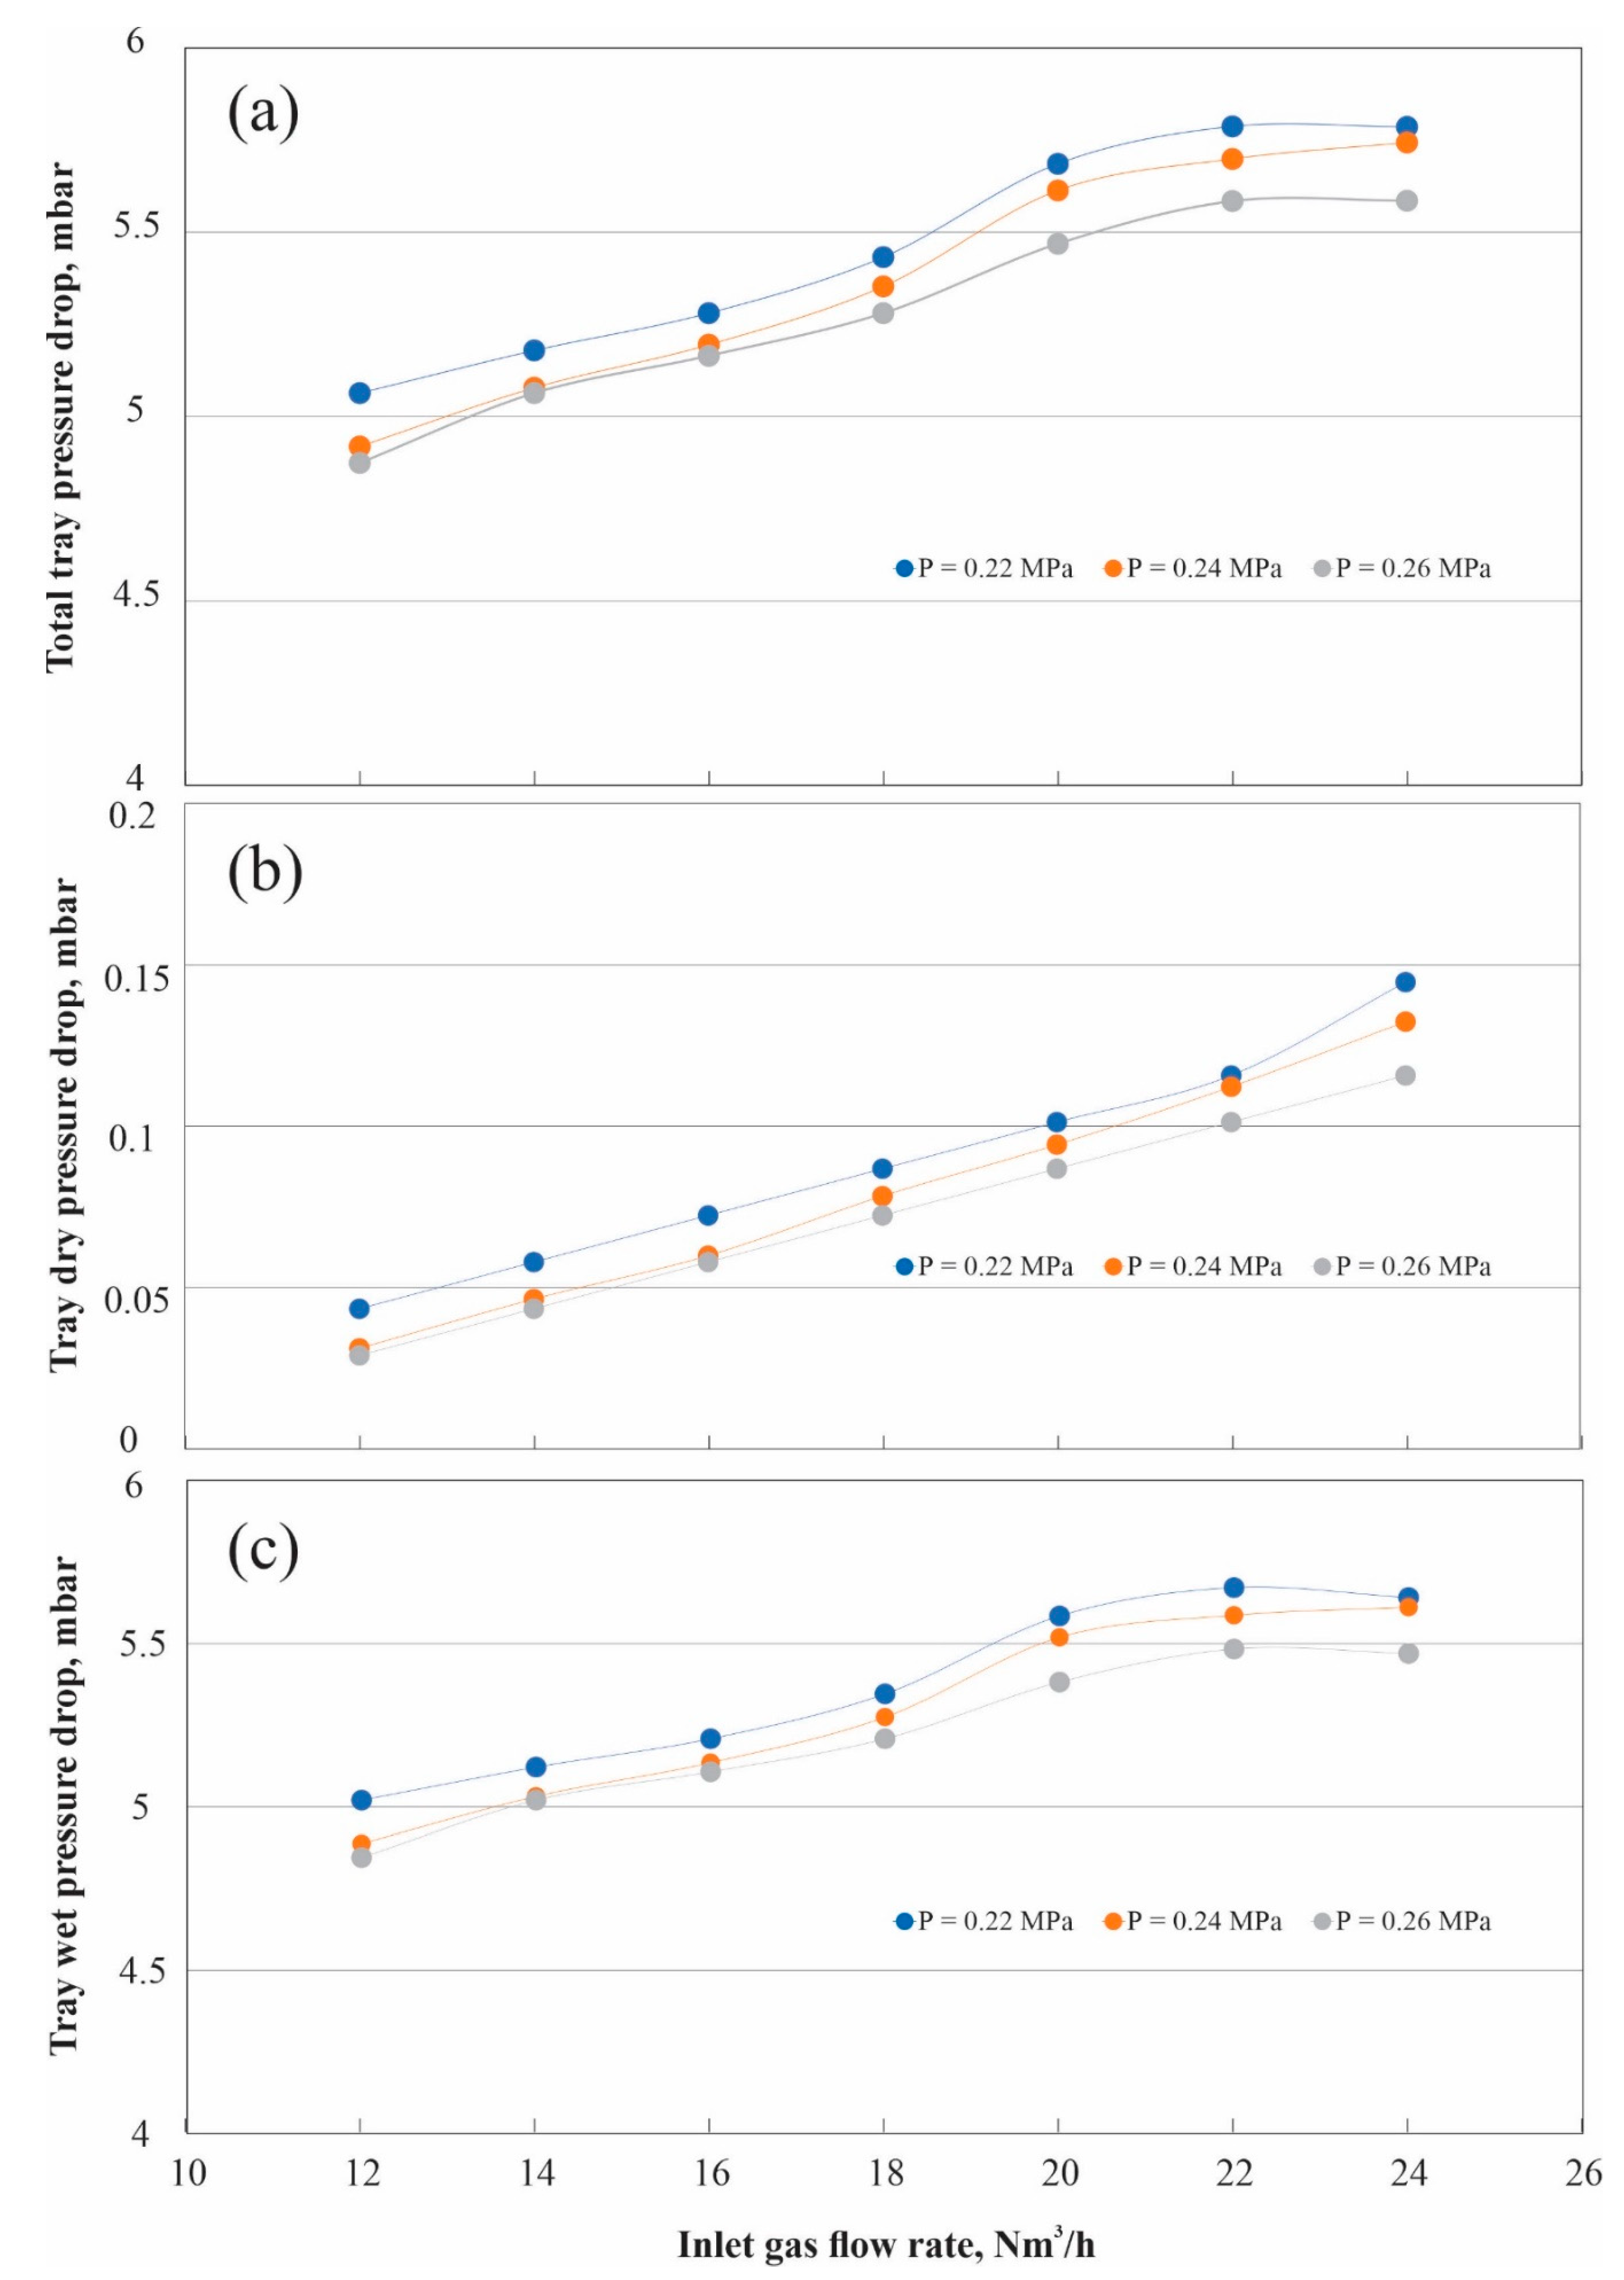
Figure 5 shows the impact of the gas flow rate on the total tray pressure drop, dry tray pressure drop, and wet tray pressure drop. It can be observed that both the total tray pressure drop and the wet tray pressure drop increase smoothly between 12 and 20 Nm
3/h, and these pressure drops are almost constant when the inlet flow rate increases between 20 and 24 Nm
3/h, while the dry pressure drop increases due to an increase in the gas flow rate between 12 and 24. It is clear that the trend of this effect is similar for all pressure values studied.
The standard errors of the measurements of total tray pressure drop are shown in
Table 2.
3.2.2. Effect of the Inlet Gas Flow Rate on Clear Liquid Height
Since wet pressure drop is equivalent to the clear liquid high on the tray, one can calculate clear liquid height as
There are several correlations in the literature for estimating the clear liquid head. Francis (1883) [
10] proposed an equation to calculate the liquid flow rate across the exit weir with rectangular cross section. The Francis equation is
where
= discharge in
neglecting velocity of approach,
= the length of weir in ft,
= head on the weir in ft.
From this equation, we can conclude that the height of the clear liquid and the liquid accumulation are only affected by the change in liquid flow. The gas flow has no influence.
Bennett et al. (1983) [
11] developed a correlation for clear liquid height as
where
is the clear liquid height,
is the outlet weir height,
C empirical constant,
is the liquid flow rate,
is the weir length,
is the bubbling velocity,
is the density of gas
,
is the density of liquid
, and
is the effective liquid volume fraction. It can be noted that the liquid clear high is a function of the bubbling velocity and the liquid/gas density.
Hofhuis et al. (1979) [
12] have developed an Empirical correlation as
where
A is the hole pitch, m; and
is superficial velocity.
It can be see that Hofhuis equation is a function of flow ratio group
, weir height, and hole pitch. Hofhuis model can be applied to both froths and spray regimes (Wang, Chao, et al., 2018) [
13].
Taking into account these studies, the Hofhuis correction can be modified to accommodate the height of the clear liquid on the sieve tray studied as
Figure 6 shows the comparison between the experimental data and the results from Equation (10). It appears that there is agreement within the relative error
.
3.2.3. Effect of the Inlet Gas Flow Rate on Tray Liquid Holdup
One can calculate liquid holdup as
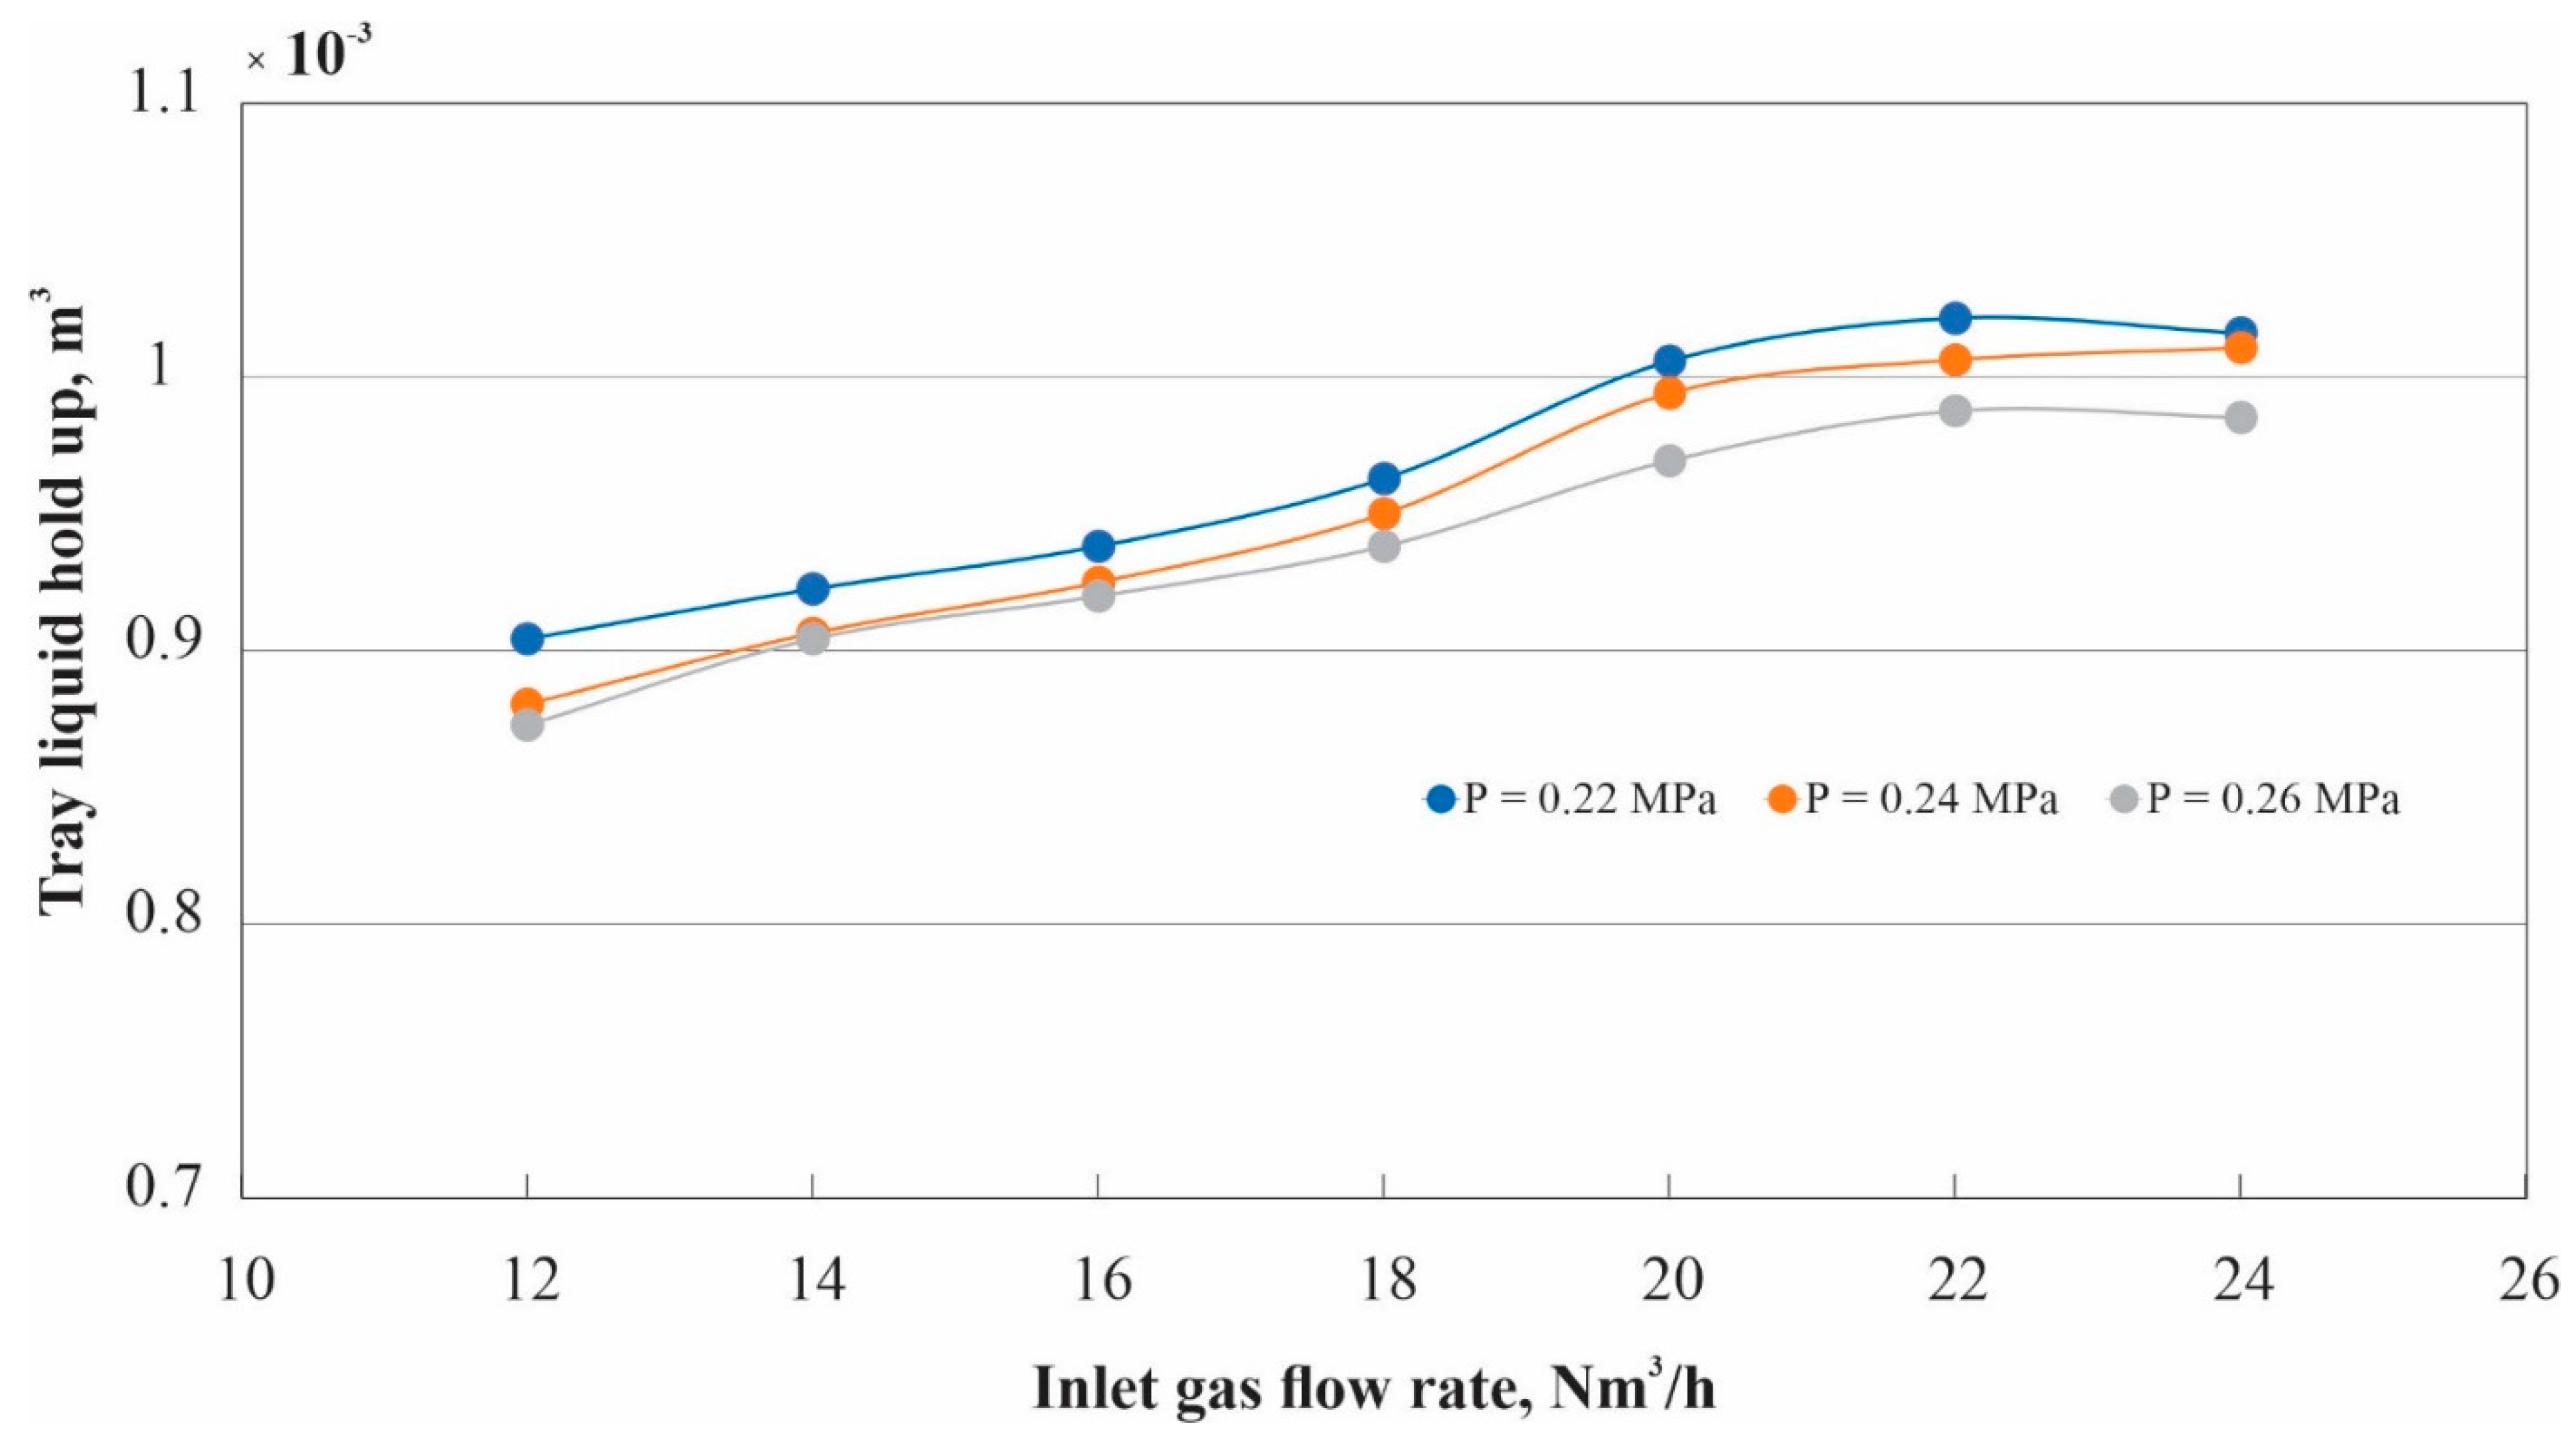
Figure 7 shows the liquid holdup on the tray when the inlet gas flow rate is increased.
Figure 7 shows that increasing the gas volume flow rate has a significant effect on liquid holdup on the tray. The liquid holdup on the tray is drastically increased when the gas volume flow rate is increased between 12 and 20 Nm
3/h. It is noted that the increase in flow rate between 16 and 20 Nm
3/h is more significant than the increase in flow rate between 12 and 16 Nm
3/h, while the increase in flow rate between 20 and 24 Nm
3/h has a small effect on liquid holdup. The trend of this effect is similar for all pressure values studied. The possible reason for this behavior is the increase in the superficial velocity of the gas in the absorber due to the increase in inlet gas flow rate, the increase in gas velocity causes the liquid to be trapped on a tray, resulting in the accumulation of the liquid on the tray, and as a result, the liquid holdup will increase. It appears also that when the gas inlet flow rate is increased after 20 Nm
3/h, the liquid holdup is almost constant. This trend may be due to the high gas velocity accelerates the liquid to flow into the downcomer, resulting in a steady liquid holdup.
3.2.4. Effect of the Inlet Gas Flow Rate on Froth Height
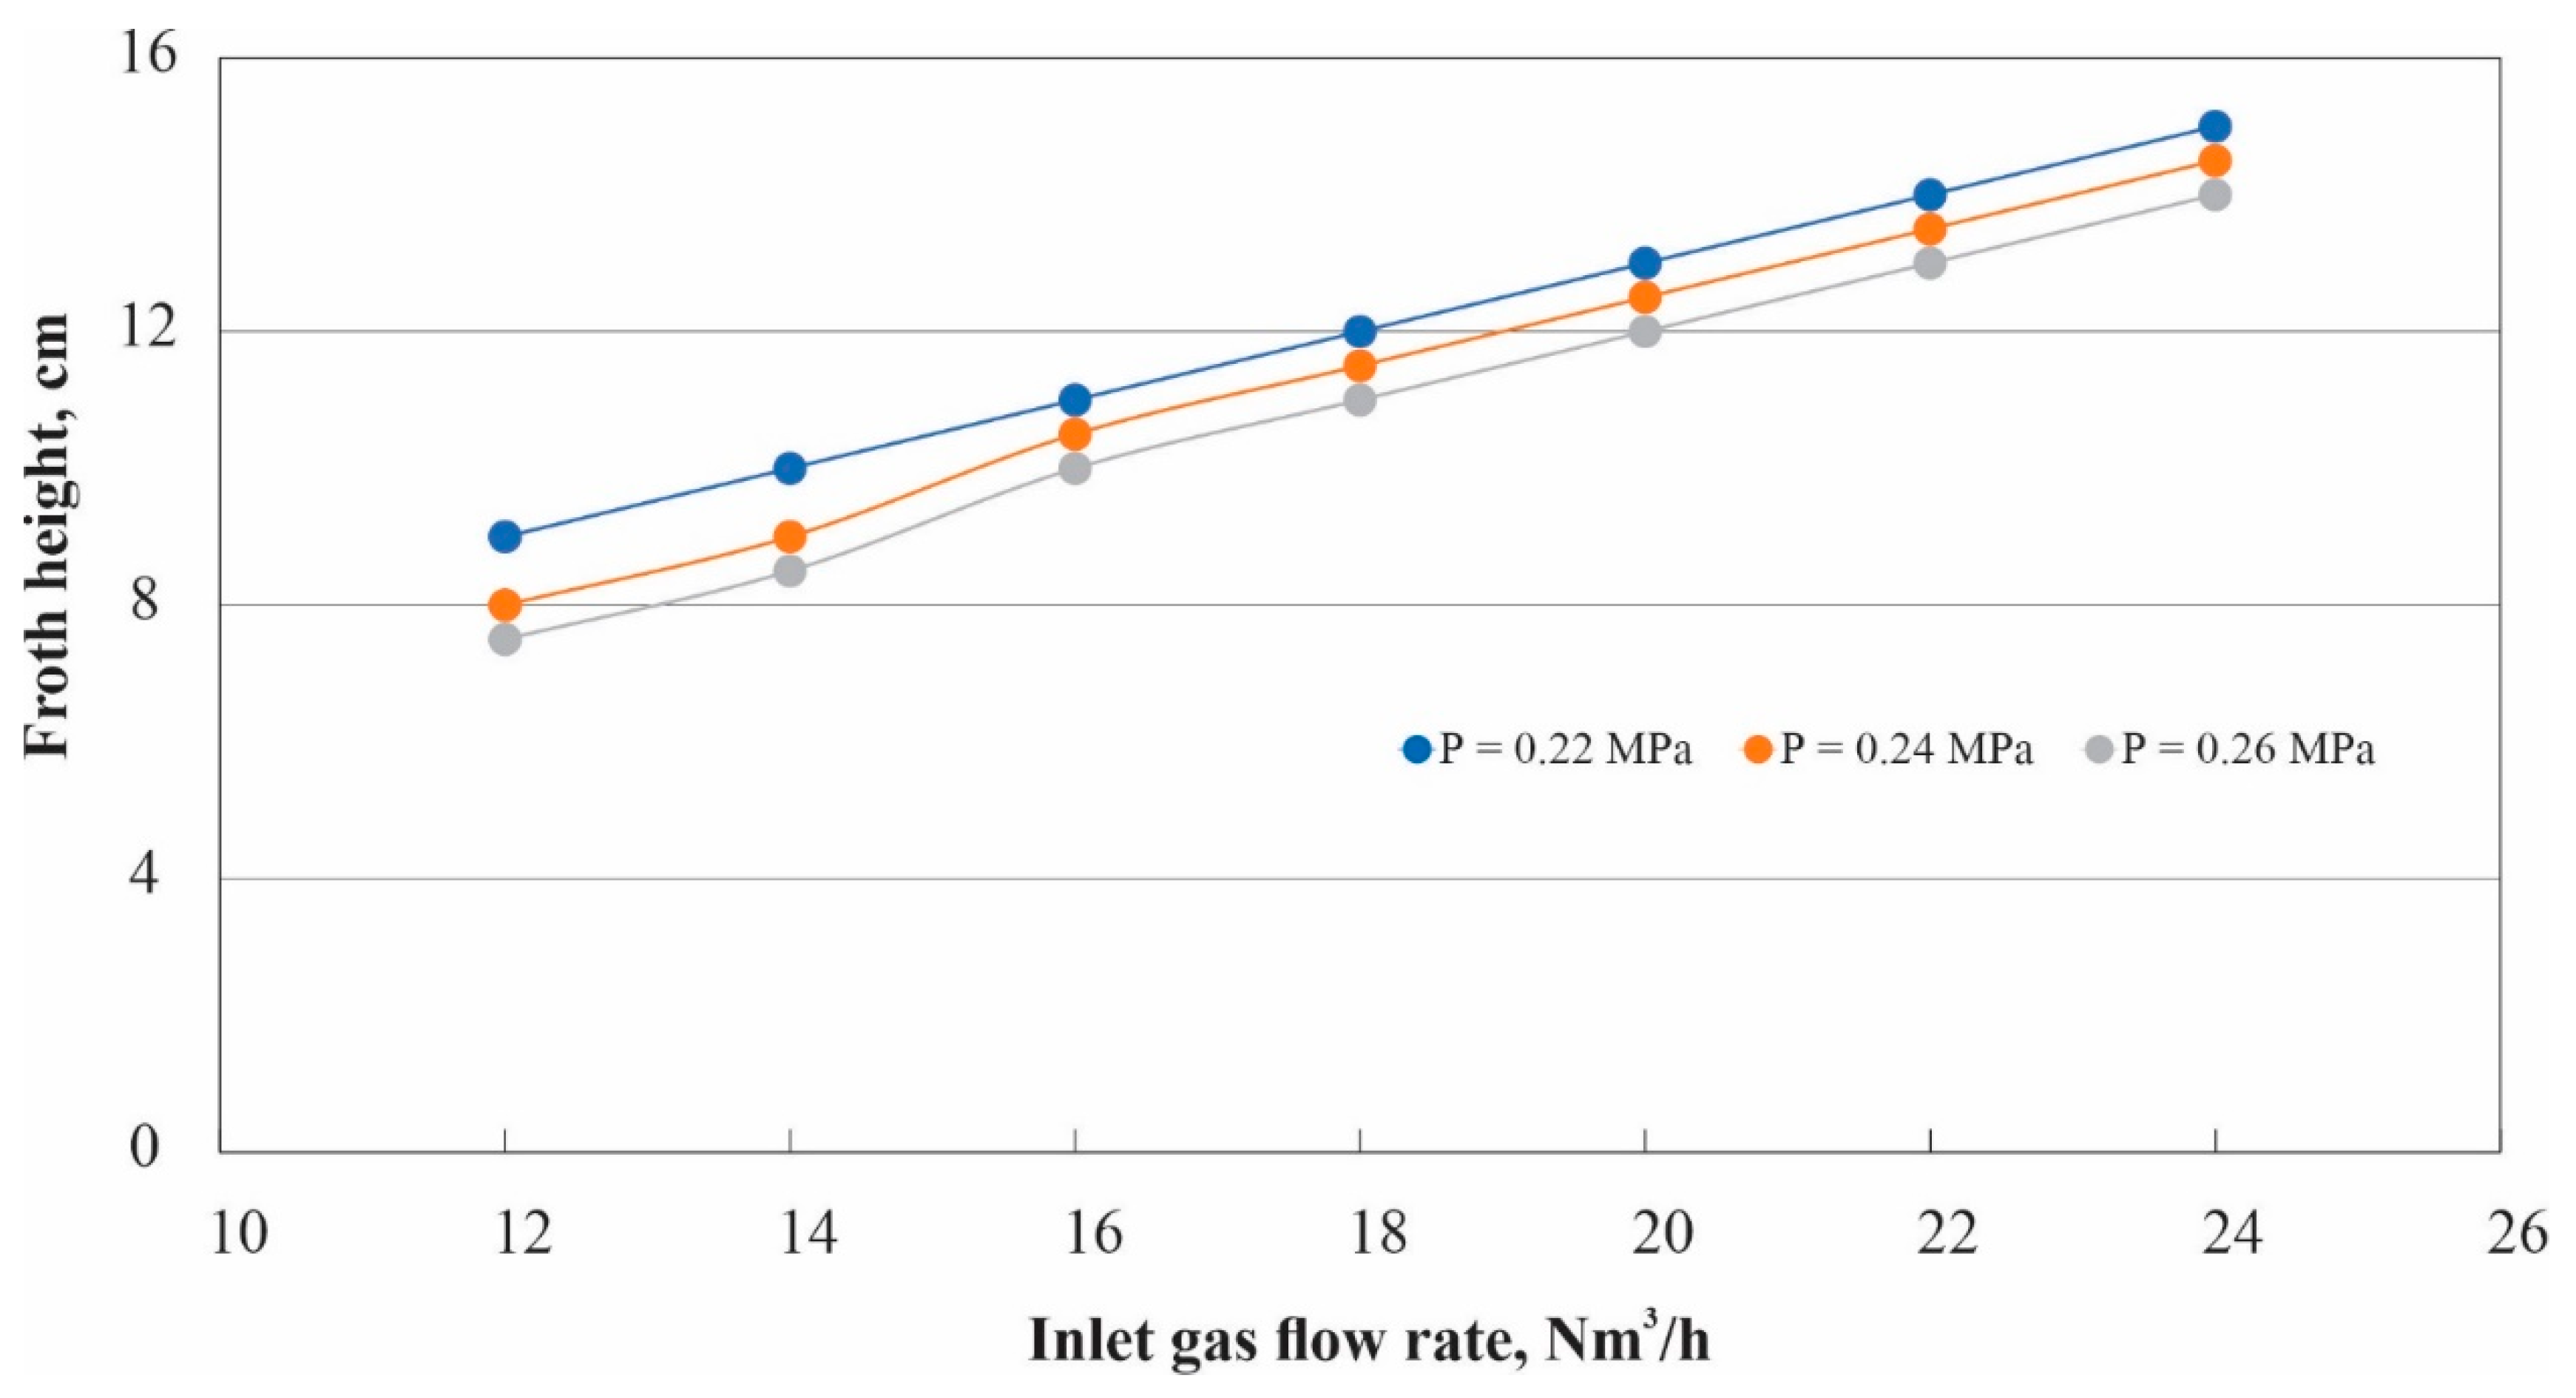
To investigate the effect of gas flow rate on froth height, the absorber was fitted with a ruler to observe froth formation above the tray. It can be seen from
Figure 8 and
Figure 9 that the froth height above the tray goes up as the flow rate progresses. The trend of this effect is similar for all pressure values studied. This trend can be explained by the increasing of the superficial velocity of the gas into the absorber through the increase of the flow rate, leading to an increase of the liquid holdup, as can be seen in
Figure 7. The increase of the tray liquid holdup will increase the height of the froth on the tray.
3.3. Studying the Effect of the Inlet Gas Flow Rate on the Performance of the Absorber
The performance of the absorber for CO
2 capture was measured by estimating the absorbed rate of CO
2. The absorbed rate
of CO
2 was calculated using the equation
where
is the inlet volumetric fraction of CO
2,
is the outlet volumetric fraction of CO
2, and
is the inlet gas flow rate.
was measured by the gas analysis unit, where
was calculated as
is the inlet CO2 flow rate, and is the inlet air flow rate.
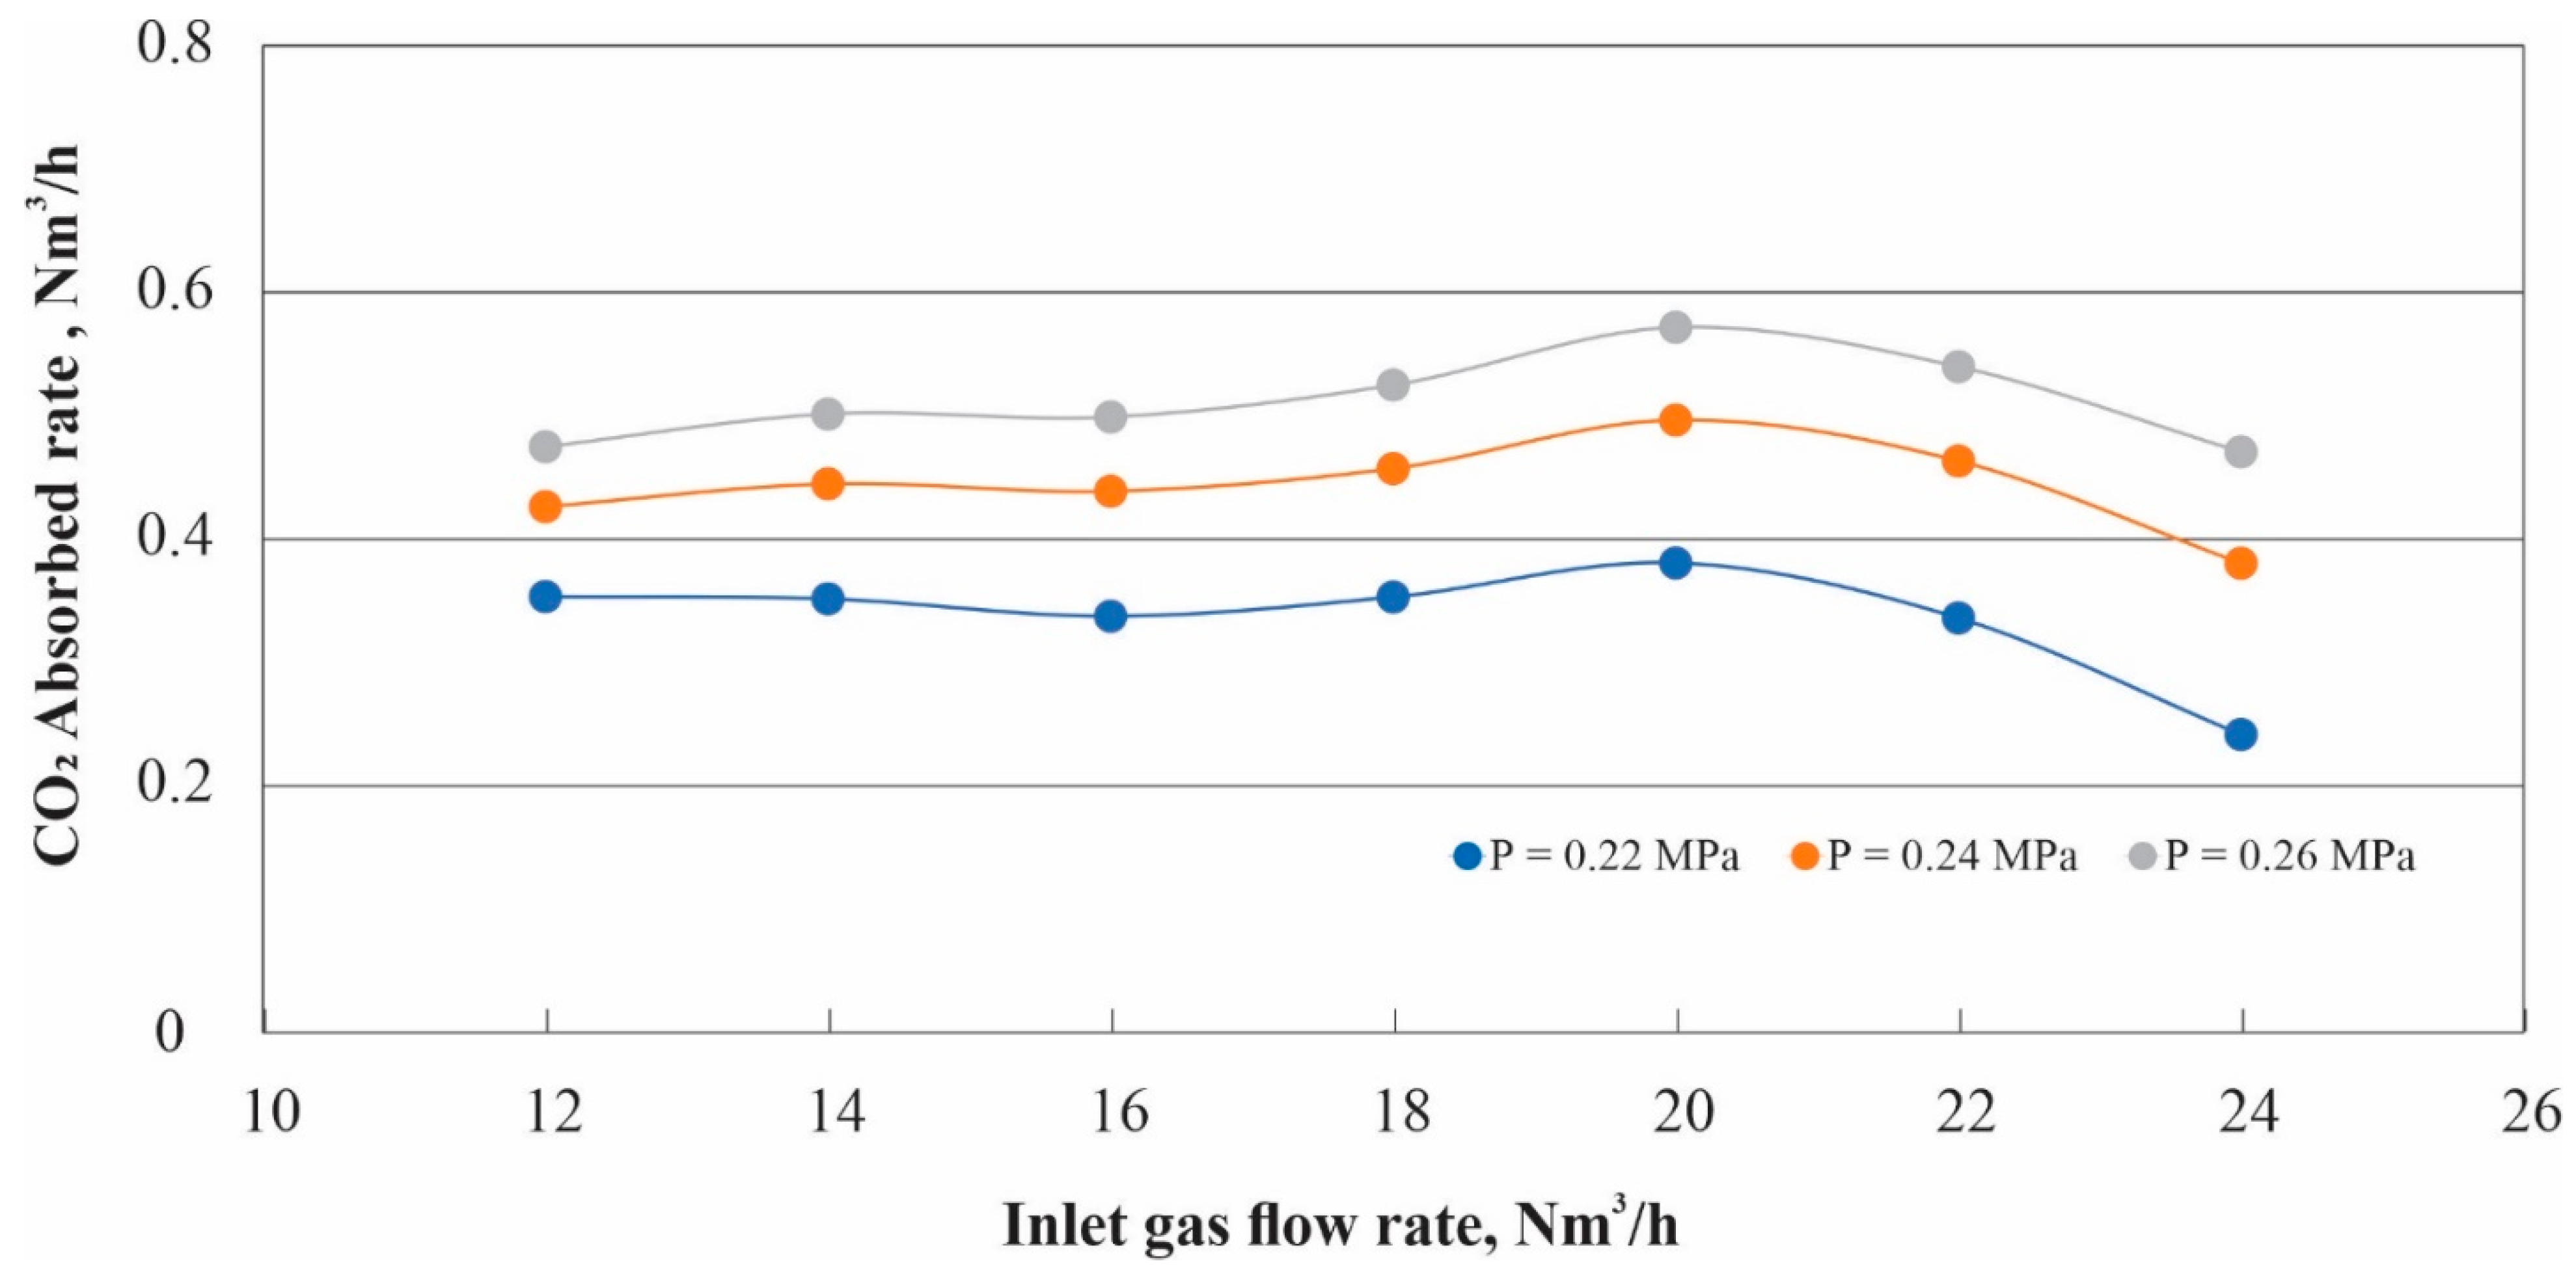
Figure 10 illustrates the effect of inlet gas flow rate on CO
2 absorption rate when the inlet gas flow rate is changed in the range of 12–24 Nm
3/h. There is a significant effect on the CO
2 absorption rate. The trend of this effect is similar for all pressure values studied. It can be seen that the CO
2 absorption rate is almost constant when the flow rate is changed between 12 and 16 Nm
3/h, whereas the CO
2 absorption rate increases clearly when the gas flow rate is increased between 16 and 20 Nm
3/h, while the CO
2 absorption rate decreases significantly when the flow rate is increased between 20 and 24 Nm
3/h.
Such trends in absorber performance can be interpreted by the increasing superficial velocity of the gas in the absorber as the flow rate increases. Increasing the gas velocity has different effects on the absorber performance. Increasing the superficial velocity of the gas affects the hydrodynamic characteristics of the tray, as shown in
Figure 5,
Figure 6,
Figure 7,
Figure 8 and
Figure 9. Specifically, in the case of liquid holdup, increasing the liquid holdup on the tray improves the mass transfer between the liquid and gas phases, resulting in an increase in the amount of CO
2 absorbed, and vice versa. In addition, as the superficial velocity of the gas increases, the interfacial area between the gas and liquid phases increases, as seen in the increase in froth height when the gas flow rate at the inlet is increased (as seen in
Figure 9), leading to an increase in mass transfer and the amount of CO
2 absorbed.
On the other hand, increasing the superficial velocity above a certain value does not enhance the liquid holdup, as can be seen in
Figure 7. In addition, increasing the superficial velocity will decrease the residence time of the gas in the absorber, thus decreasing the contact time between the gas and liquid phases, leading to a decrease in mass transfer between the gas and liquid phases, which could explain the decrease in CO
2 absorption rate when the flow rate is increased between 20 and 24 Nm
3/h.
