
The Influence of Drying Temperature on Color Change of Hornbeam and Maple Wood Used as Surface and Inner Layers of Wood Composites

 ,
,  , ,
, ,  and
and
Abstract
:1. Introduction
2. Material and Method
2.1. Drying Mode and Method
2.2. Color Difference ΔE*
2.3. Hue Angle—h*
2.4. Color Saturation—C*ab
2.5. Saturation—Sab
3. Results and Discussion
4. Conclusions
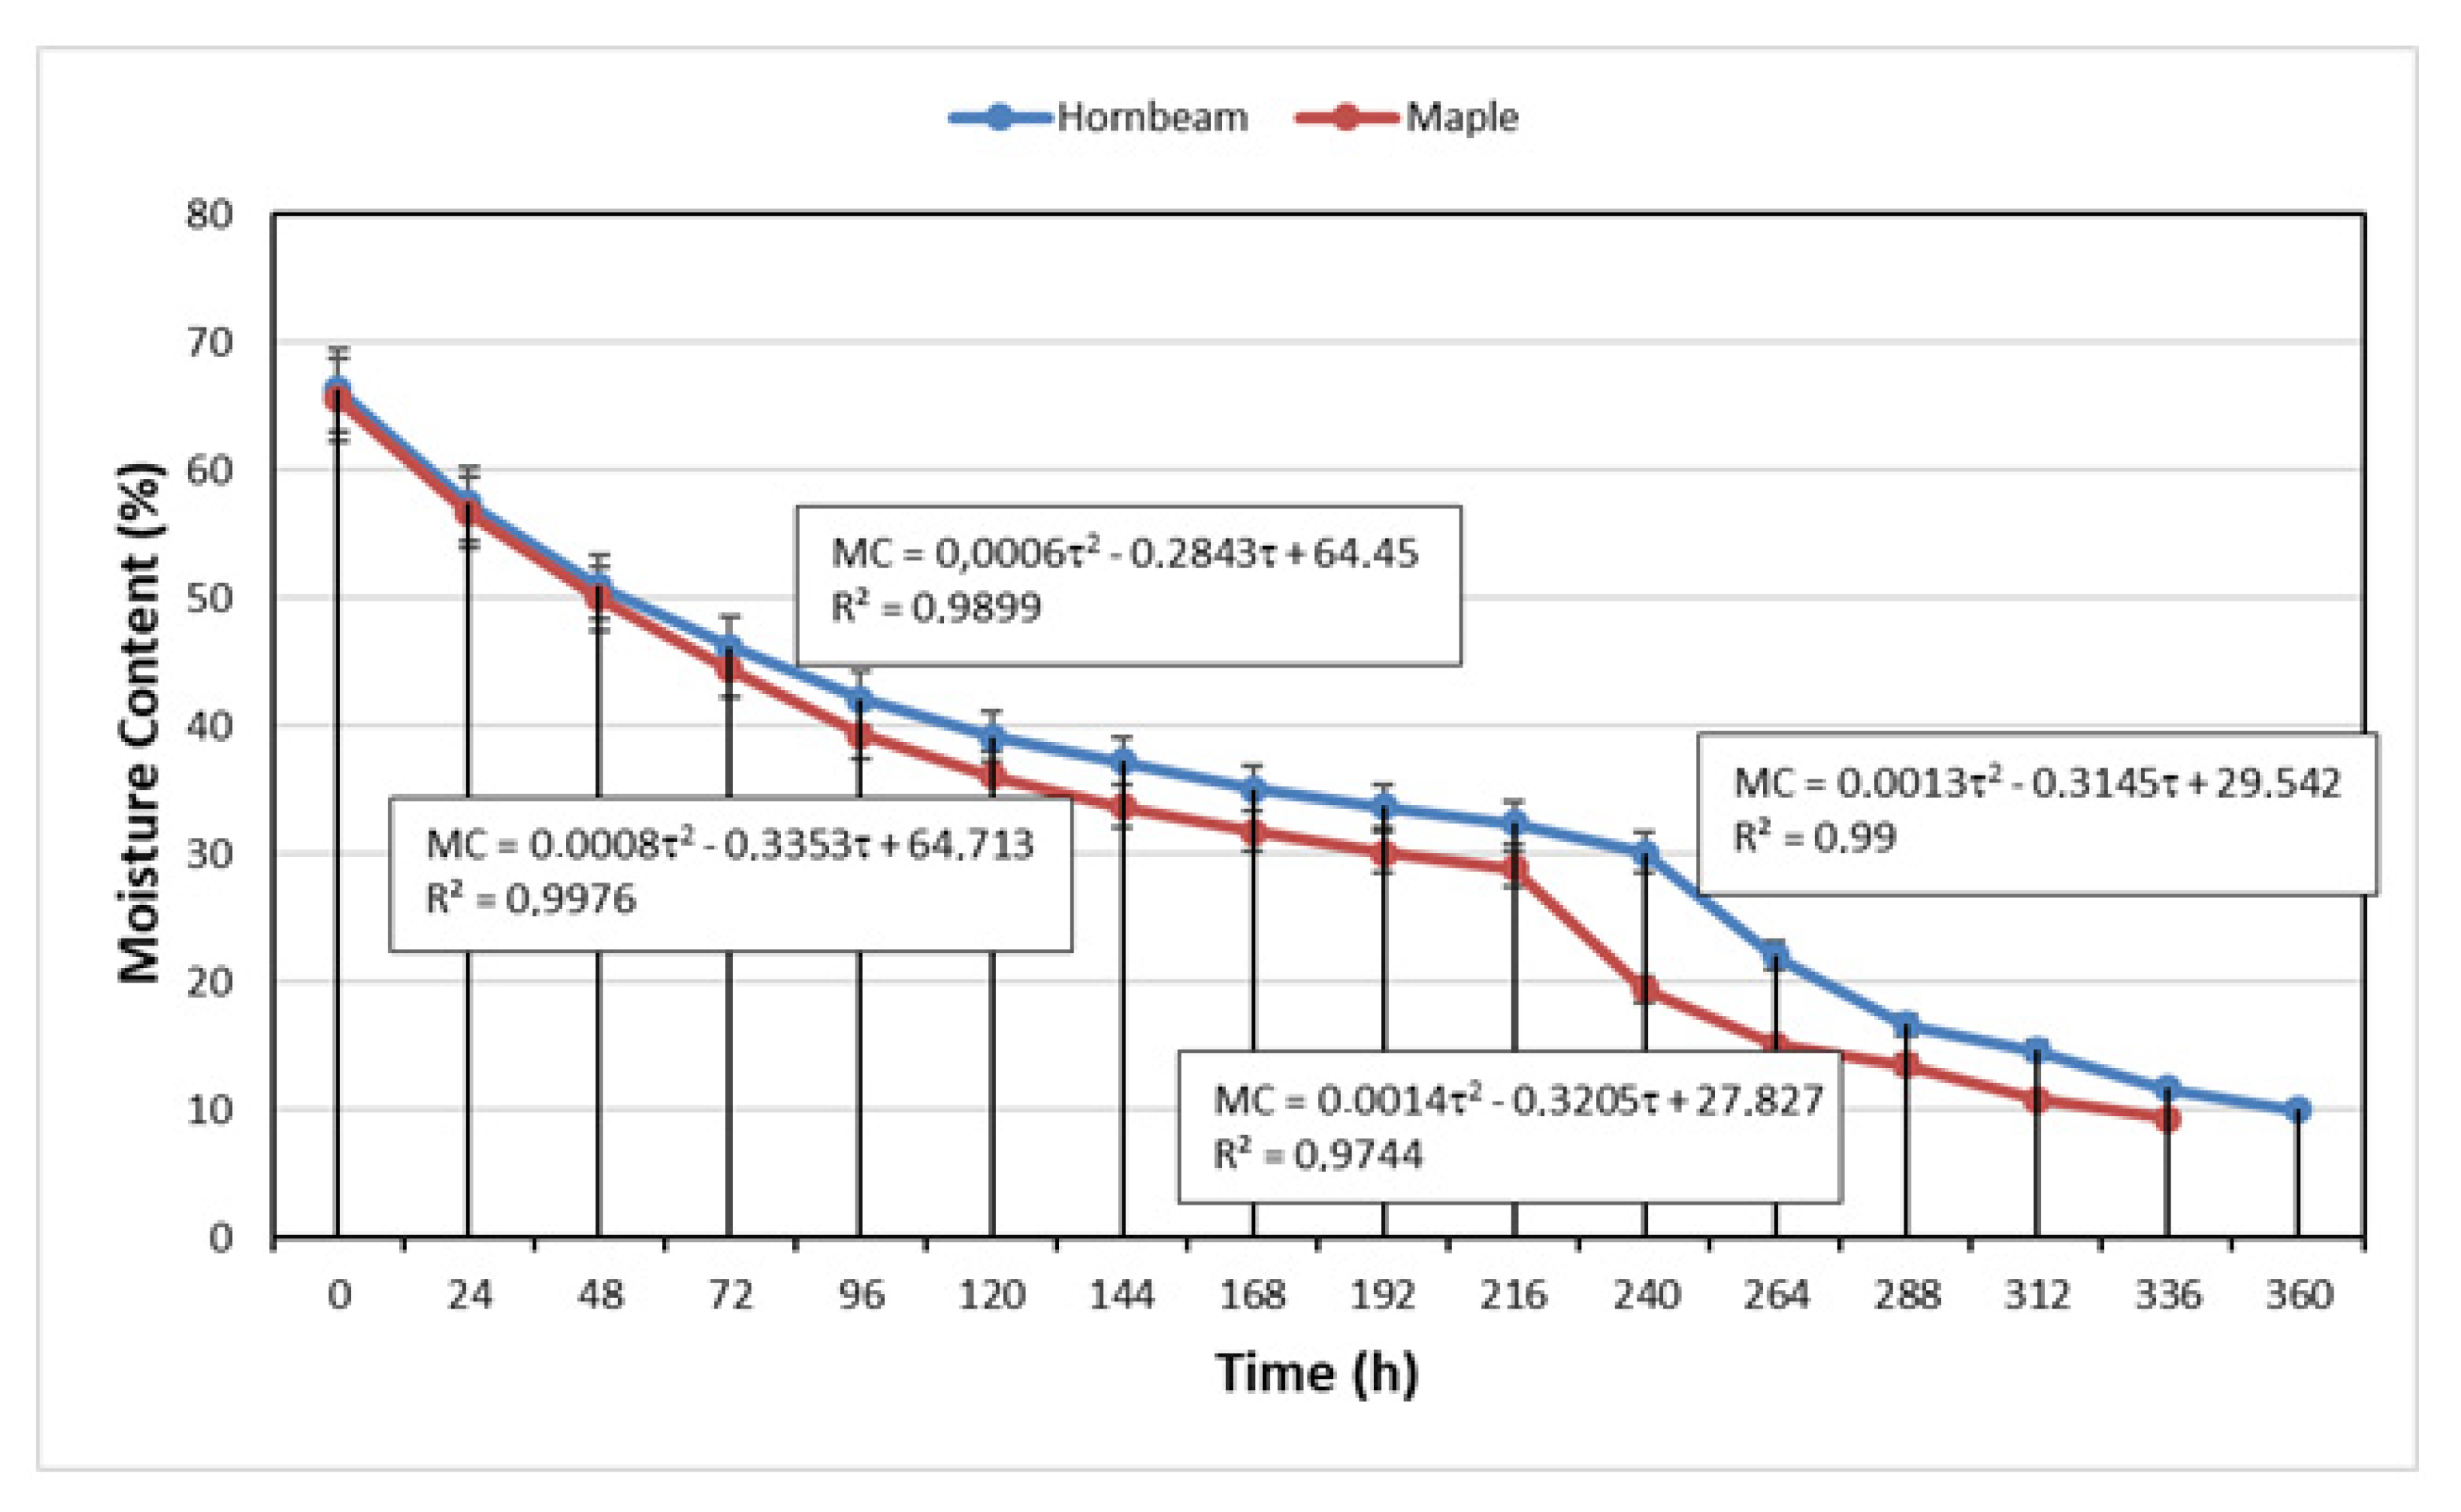
- During hot-air drying (60 °C), maple samples dried faster than hornbeam samples. The difference in drying times of wood species is directly proportional to their density.
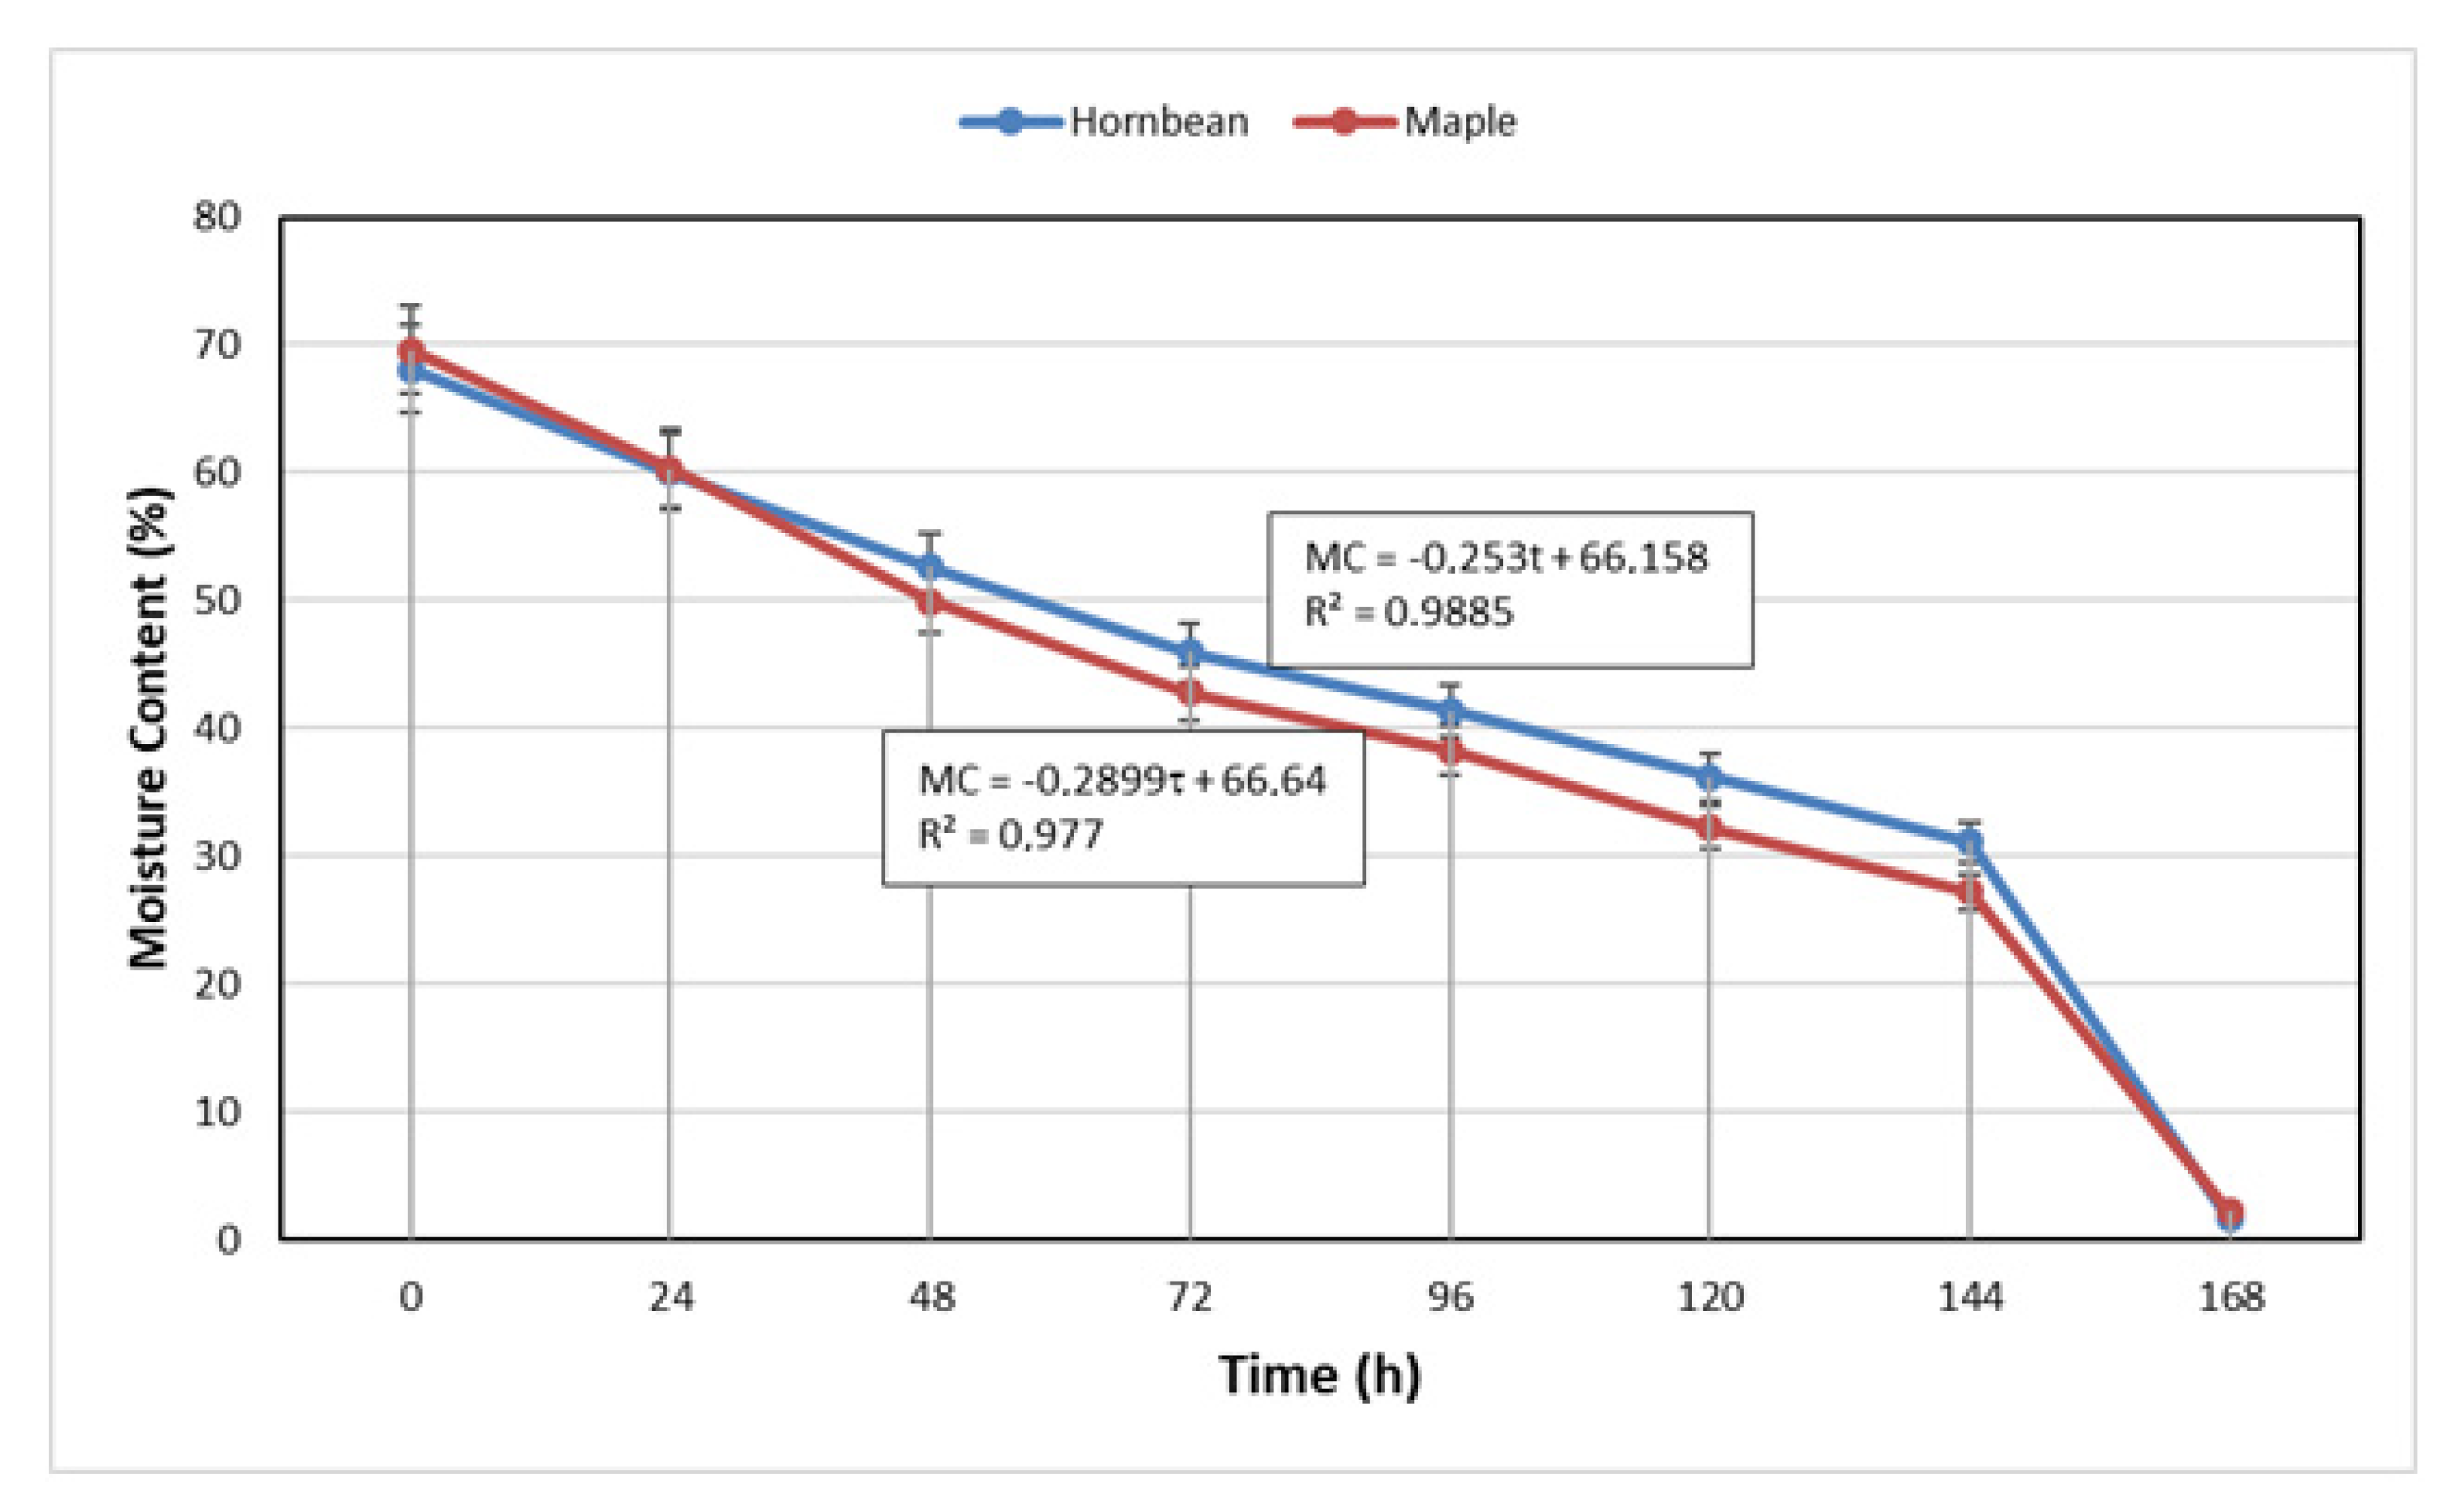
- During high-temperature drying, maple samples were dried faster in the first drying section (MC > FSP), but after raising the temperature of the drying environment to 120 °C, the resulting times for both woods were identical.
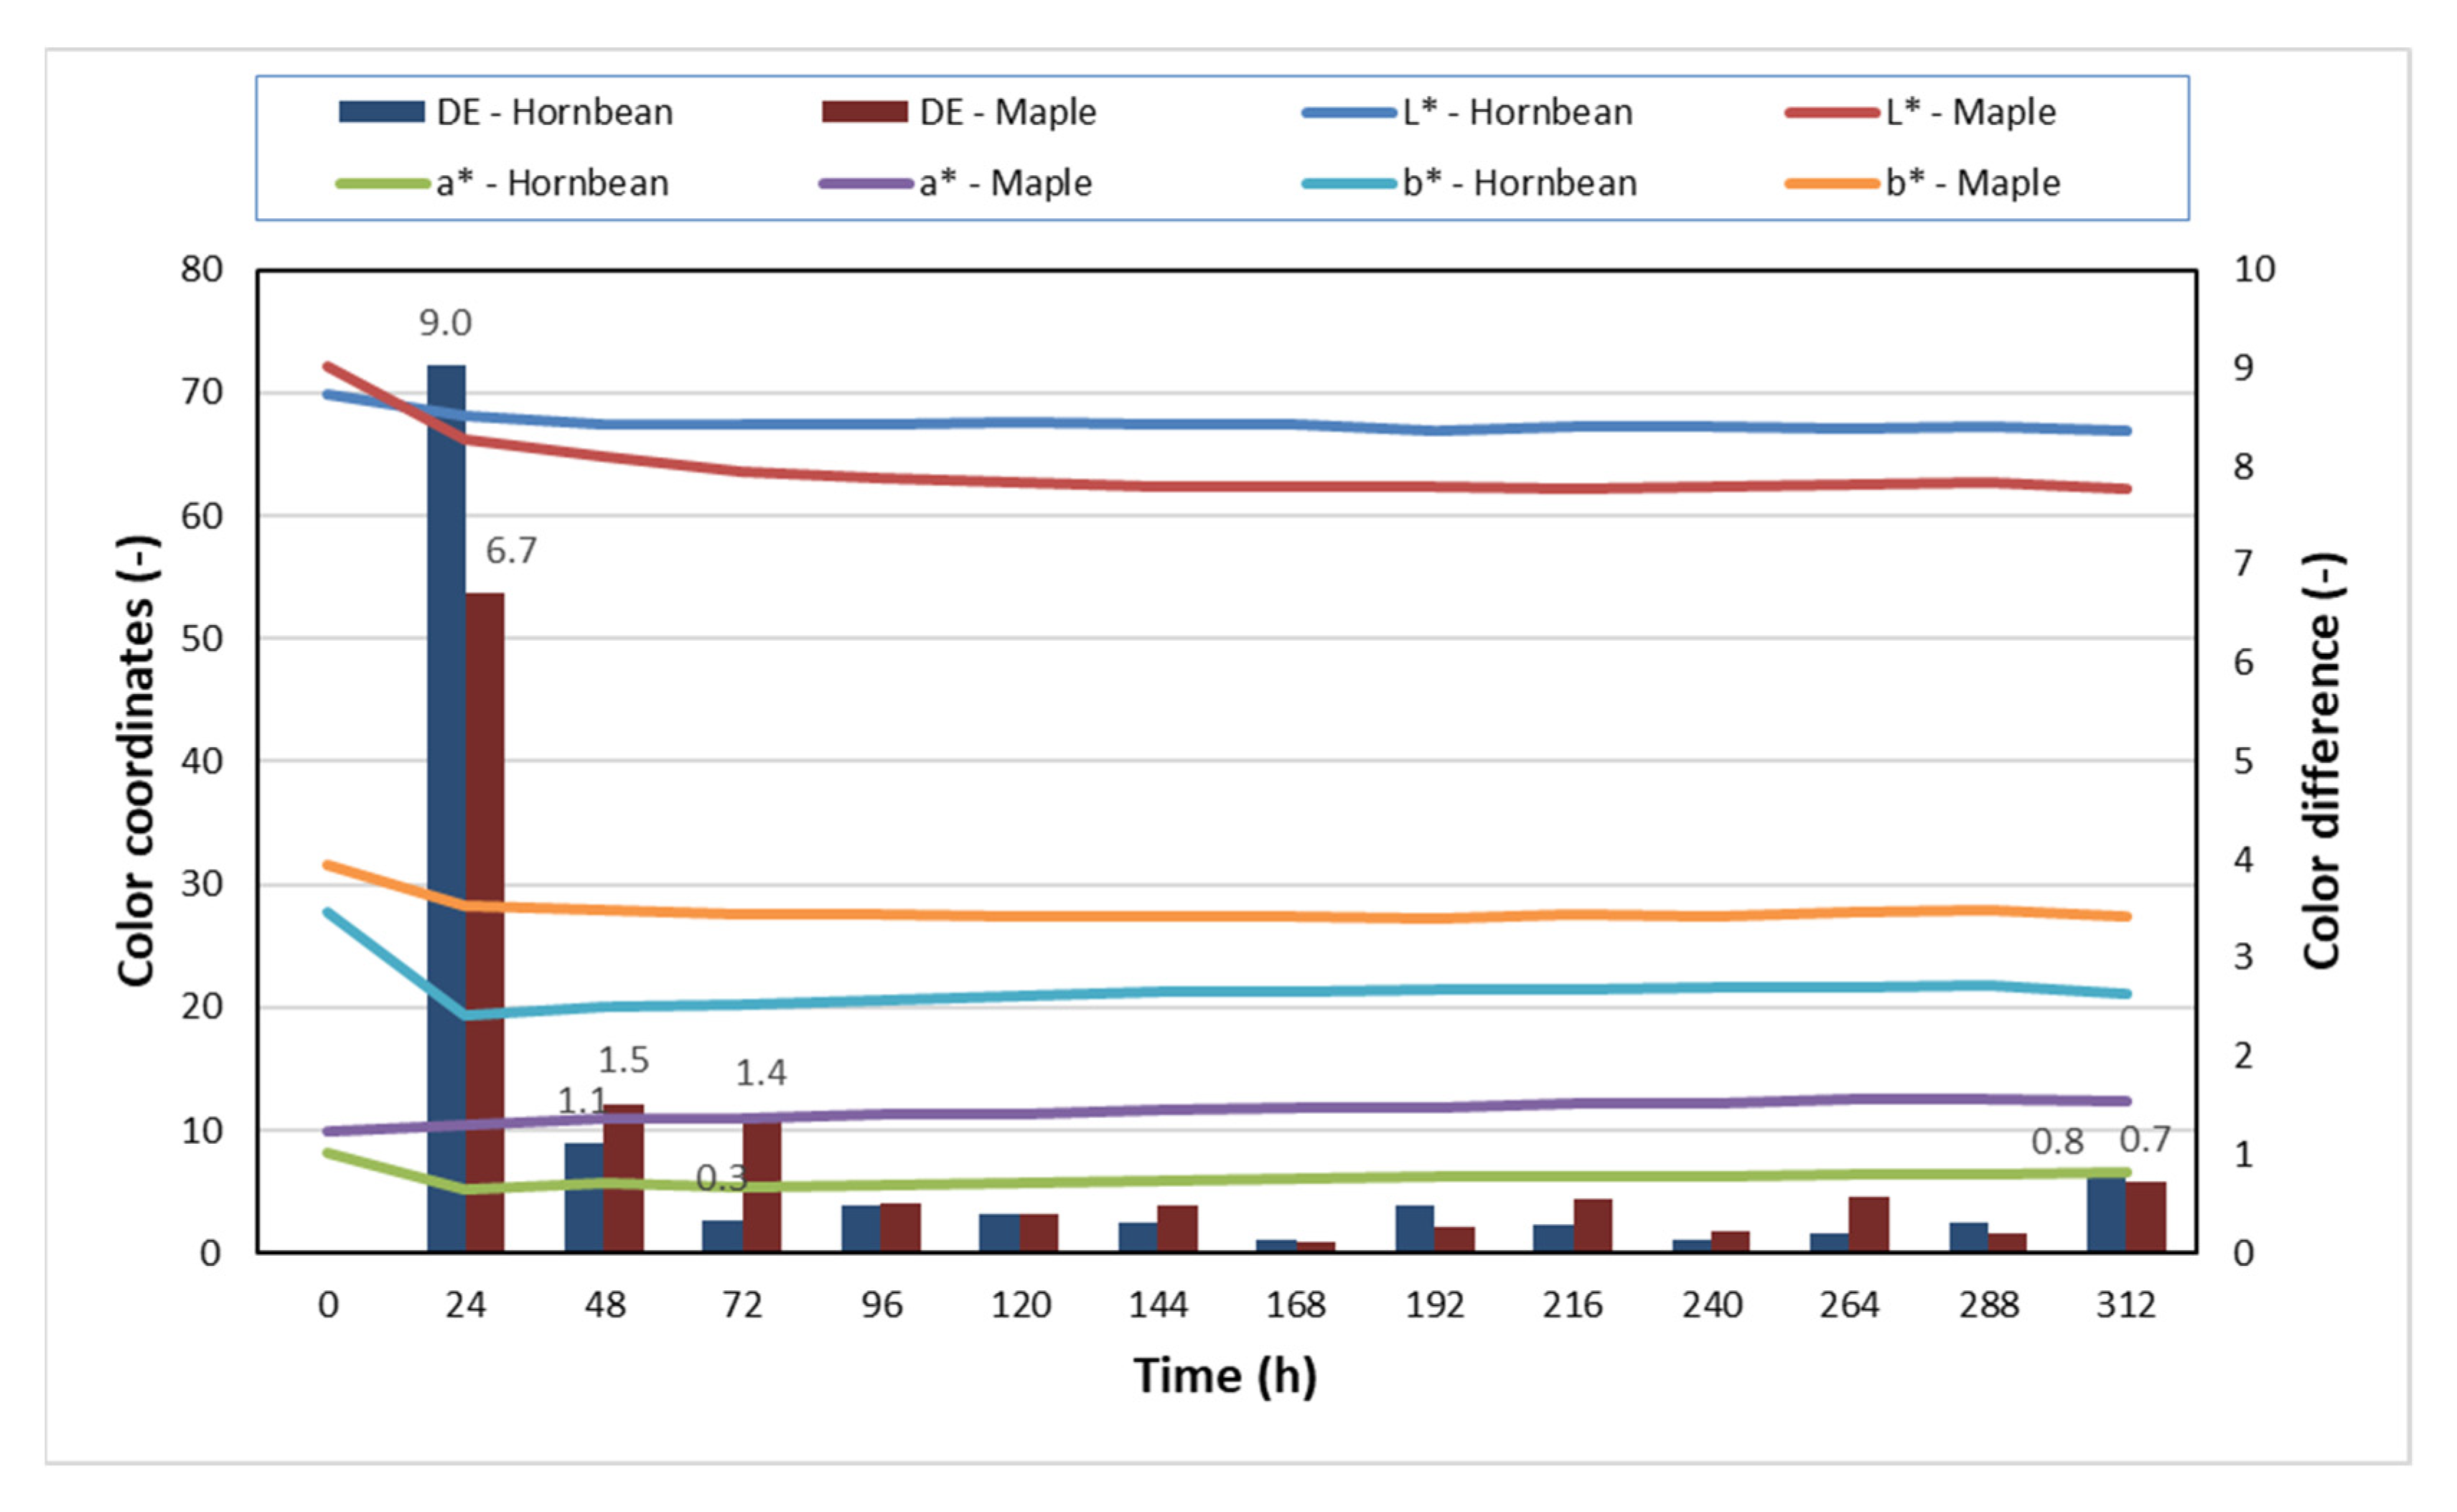
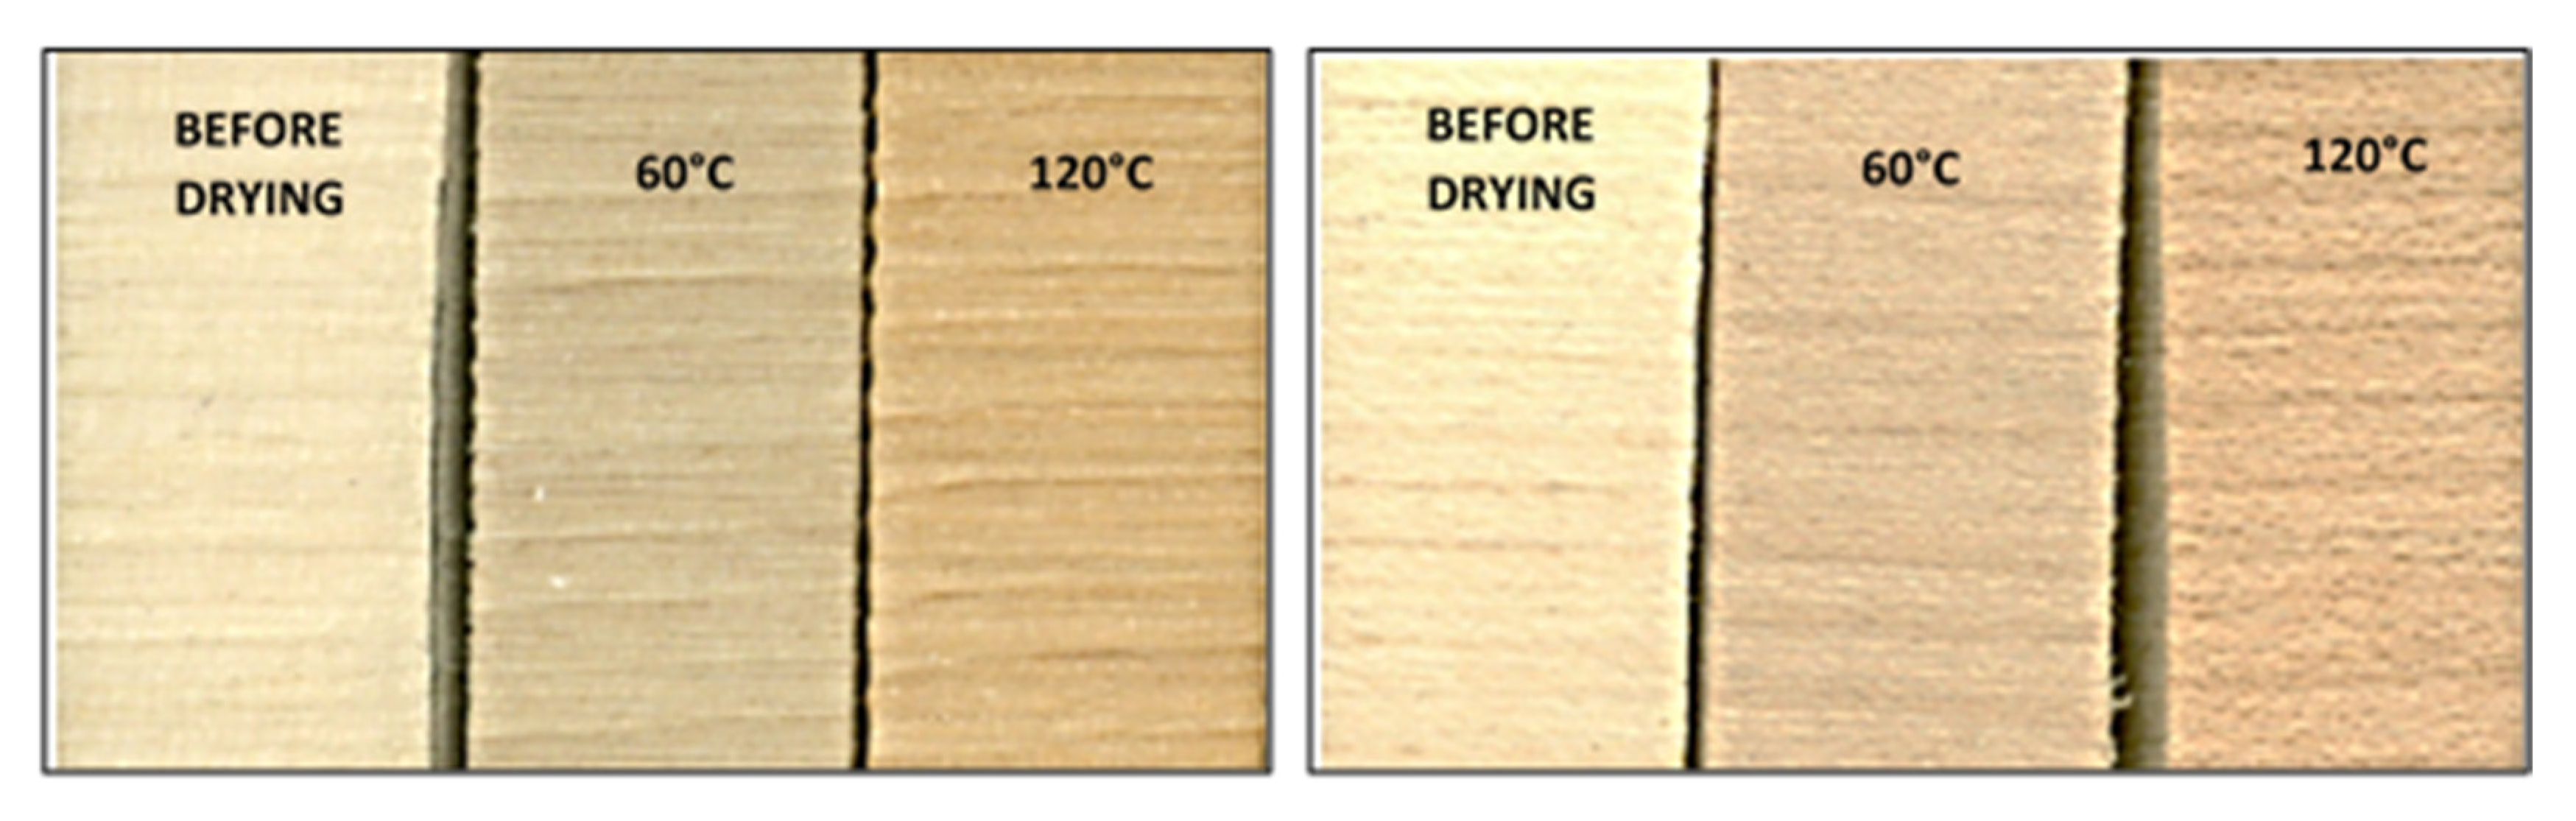
- For maple wood, there were remarkable changes in the coordinates of the color space L*, a* and b* with both methods of drying. At a maximum drying temperature of 60 °C, the most remarkable change in coordinates occurred during the first 24 h of drying. For maple, the brightness value L* decreased remarkably, but the a* coordinate hardly changed. The change in the b* coordinate was also smaller for maple than for hornbeam. The color difference between the compared woods at a drying temperature of 60 °C was minimal. The total color difference between the color at the end and at the beginning of drying was 7.3 for hornbeam and 11.1 for the maple.
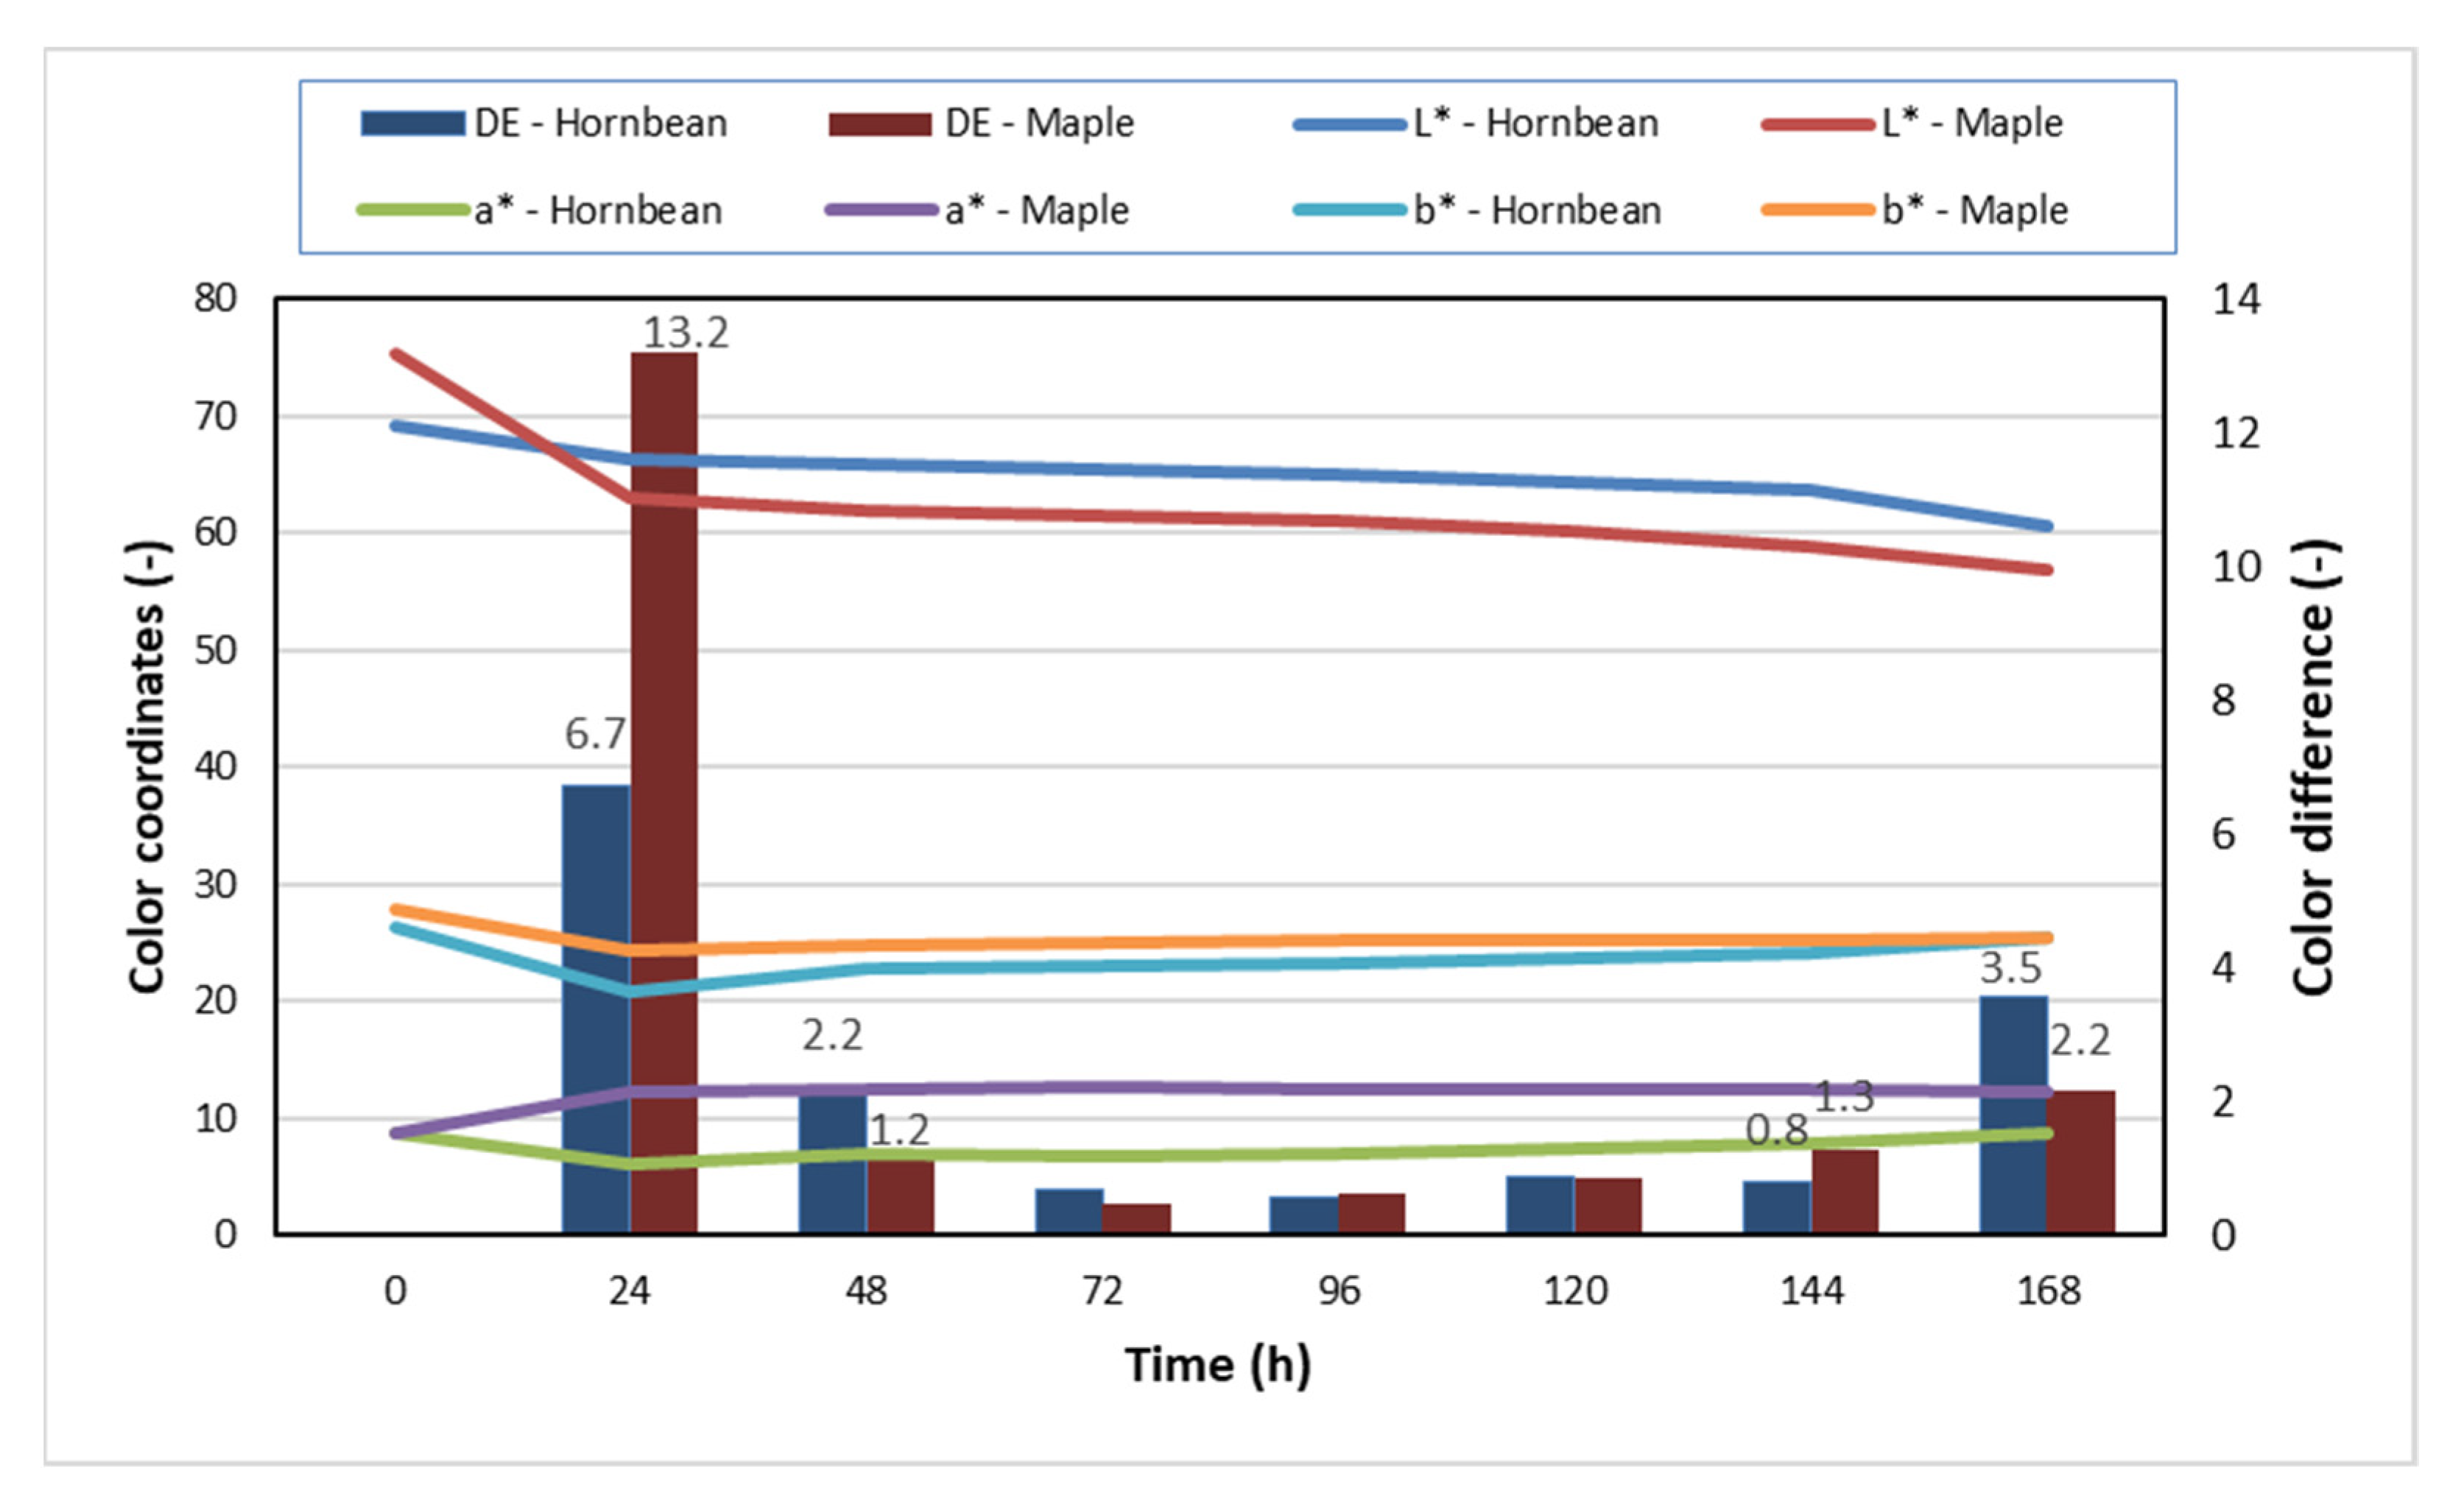
- During high-temperature drying (120 °C), the color changes of the dried woods were more pronounced. There was a remarkable change at the beginning of drying, but also after raising the temperature to 120 °C, where there was mainly a change in the coordinate of L*. The maple samples were darker than the hornbeam samples, likely due to enhancement of oxidation during high-temperature drying. The total color difference between the color at the end and the beginning of the drying was 8.7 for hornbeam and 18.9 for maple. The color change was visible to the naked eye.
- A remarkable change in color of the maple samples during high-temperature drying was also confirmed by the values of hue angle, color saturation and saturation in individual measurement sections. During the drying of maple samples, there was a remarkable decrease in the value of the hue angle towards a red-brown color. The change was 8.1° for maple and 0.7° for hornbeam.
- The Sab and color saturation values decreased in both wood species during hot-air drying (60 °C). A more significant reduction in Sab was observed in hornbeam, a difference of 6.8°. During high-temperature drying (120 °C) the values increased. There was a more remarkable increase in maple wood (8.3°).
- There was a visible color change in both monitored wood species due to the drying process. An effect of the temperature of the drying medium in combination with the humidity of the dried wood was confirmed. Differences were observed in the brightness and color shade. These differences are due to the chemical composition of individual trees and thus also to different hydrolysis reactions due to the interaction of temperature and humidity.
Author Contributions
Funding
Institutional Review Board Statement
Informed Consent Statement
Data Availability Statement
Acknowledgments
Conflicts of Interest
References
- Torres, S.; Jomaa, S.; Marc, W.; Puiggali, J.F. Causes of color changes in wood during drying. For. Stud. China 2010, 12, 167–175. [Google Scholar] [CrossRef]
- White, R.H.; Dietenberger, M. Wood Products: Thermal Degradation and Fire. In Encyclopedia of Materials: Science and Technology; Elsevier Science Ltd.: Madison, WI, USA, 2001; pp. 9712–9716. [Google Scholar] [CrossRef]
- Papp, E.A.; Csiha, C.; Valent, J. Colour change of some wood species during artificial xenon radiation. Obuda Univ. e-Bull. 2012, 3, 89–97. [Google Scholar]
- Pandey, K.K.A. Note on the influence of extractives on the photo-discoloration and photo-degradation of wood. Polym. Degrad. Stabil 2005, 87, 375–379. [Google Scholar] [CrossRef]
- Hon, S.N.D.; Shiraishi, N. Wood and Cellulosic Chemistry; Woodand Cellulosic Chemistry Marcel Dekker: New York, NY, USA, 2001; pp. 385–442. [Google Scholar]
- Klement, I.; Marko, P. Colour changes of beech wood (Fagus sylvatica L.) during high temperature drying process. Wood Res. 2009, 54, 45–54. [Google Scholar]
- Gündüz, G.; Aydemir, D. Some Physical Properties of Heat-Treated Hornbeam (Carpinus betulus L.) Wood. Drying Technol. 2009, 27, 714–720. [Google Scholar] [CrossRef]
- Németh, R.; Ott, Á.; Takáts, P.; Bak, M. The effect of moisture content and drying temperature on the colour of two poplars and Robinia wood. BioResources 2013, 8, 2074–2083. [Google Scholar] [CrossRef] [Green Version]
- Gündüz, G.; Aydemir, D.; Korkut, S. The Effect of Heat Treatment on Some Mechanical Properties and Color Changes of Uludag Fir Wood. Drying Technol. 2010, 28, 249–255. [Google Scholar] [CrossRef]
- Klement, I.; Vilkovská, T. Color Characteristics of Red False Heartwood and Mature Wood of Beech (Fagus sylvatica L.) Determining by Different Chromacity Coordinates. Sustainability 2019, 11, 690. [Google Scholar] [CrossRef] [Green Version]
- Barański, J.; Klement, I.; Vilkovská, T.; Konopka, A. High temperature drying process of beech wood (Fagus sylvatica L.) with different zones of sapwood and red false heartwood. BioResources 2017, 12, 1861–1870. [Google Scholar] [CrossRef] [Green Version]
- Möttönen, V.; Kärki, T. Effect of Drying Force on Birch Wood Colour Change during High Temperature Drying. Baltic For. 2007, 13, 126–130. [Google Scholar]
- Konopka, A.; Baranski, J.; Orlowski, K.A.; Chuchala, D. The effect of drying intensity on the color changes of pine wood (Pinus Sylvestris L.). Trieskove Beztrieskove Obrabanie Dreva 2020, 12, 79–84. [Google Scholar]
- Konopka, A.; Chuchala, D.; Orlowski, K.A.; Tatiana, V.; Klement, I. The effect of beech wood (Fagus sylvatica L.) steaming process on the colour change versus depth of tested wood layer. Wood Mater. Sci. Eng. 2021. [Google Scholar] [CrossRef]
- Chuchala, D.; Ochrymiuk, T.; Orlowski, K.A.; Lackowski, M.; Taube, P. Predicting cutting power for band sawing process of pine and beech wood dried with the use of four different methods. BioResources 2020, 15, 1844–1860. [Google Scholar] [CrossRef]
- Chuchala, D.; Sandak, J.; Orlowski, K.A.; Muzinski, T.; Lackowski, M.; Ochrymiuk, T. Effect of the Drying Method of Pine and Beech Wood on Fracture Toughness and Shear Yield Stress. Materials 2020, 13, 4692. [Google Scholar] [CrossRef]
- Rogozinski, T.; Chuchala, D.; Pedzik, M.; Orlowski, K.A.; Dzurenda, L.; Muzinski, T. Influence of drying mode and feed per tooth rate on the fine dust creation in pine and beech sawing on a mini sash gang saw. Eur. J. Wood Wood Prod. 2021, 79, 91–99. [Google Scholar] [CrossRef]
- Orłowski, K.A.; Chuchała, D.; Muziński, T.; Barański, J.; Banski, A.; Rogoziński, T. The effect of wood drying method on the granularity of sawdust obtained during the sawing process using the frame sawing machine. Acta Fac. Xylologiae Zvolen 2019, 61, 83–92. [Google Scholar] [CrossRef]
- Gao, J.; Zhang, B.; Chang, J. Induced discoloration of buerger maple during drying process. For. Stud. China 2004, 6, 50–55. [Google Scholar] [CrossRef]
- Sergovskij, S.P. Hydrotermická Úprava Dreva a Sušenie Dreva (Hydrothermal Treatment of Wood and Drying of Wood), 1st ed.; ALFA Publishing of Technical and Economic Literature: Bratislava, Slovakia, 1977; p. 402. [Google Scholar]
- STN EN 49 0103. Determination of Moisture Content of the Physical Mechanical Tests; Slovak Standards Institute: Bratislava, Slovakia, 1979. [Google Scholar]
- STN 490 108. Wood. Determination of Density; Slovak Standards Institute: Bratislava, Slovakia, 1993. [Google Scholar]
- Schanda, J. Colorimetry: Understanding the CIE System; John Wiley & Sons: Hoboken, NJ, USA, 2007; pp. 445–449. ISBN 978-0470049044. [Google Scholar]
- Cividini, R.; Travan, L.; Allegretti, O. White Beech: A Tricky Problem in Drying Process; NARDI Srl: Siena, Italy, 2007; Available online: www.ivalsa.cnr.it/ISCHP07/CividiniTravanAllegretti.pdf (accessed on 27 January 2019). [Google Scholar]


| Drying Mode | 1. Phase MC (%) ≥ FSP | 2. Phase MC (%) < FSP | ||||
|---|---|---|---|---|---|---|
| Temperature of Environment (°C) | Psychometric Difference (°C) | Relative Humidity of Environment (%) | Temperature of Environment (°C) | Psychometric Difference (°C) | Relative Humidity of Environment (%) | |
| 60 | 60 | 2 | 91 | 60 | 12 | 52 |
| 120 | 100 | 2 | 94 | 120 | - | - |
| ∆E* < 0.2 | No visible difference |
| 2 > ∆E* > 0.2 | Small difference |
| 3 > ∆E* > 2 | Color difference visible with high-quality screen |
| 6 > ∆E* > 3 | Color difference visible with medium-quality screen |
| 12 > ∆E* > 6 | High color difference |
| ∆E* > 12 | Different colors |
| Drying Mode | Samples | Initial Moisture Content MCi (%) | Final Moisture Content MCf (%) | Density in Absolutely Dry State (kg·m−3) | Drying Time (h) |
|---|---|---|---|---|---|
| 60 | Hornbeam | 66.25 ± 0.43 | 9.00 ± 0.28 | 795.50 ± 3.42 | 384 |
| Maple | 65.54 ± 0.64 | 9.36 ± 1.46 | 579.92 ± 4.81 | 336 | |
| 120 | Hornbeam | 68.14 ± 0.22 | 1.71 ± 0.14 | 799.10 ± 2.90 | 168 |
| Maple | 69.59 ± 0.31 | 2.19 ± 0.07 | 574.99 ± 3.11 | 168 |
| Samples | Color Coordinates | Before Drying | After Drying | Count | |||||
|---|---|---|---|---|---|---|---|---|---|
| Mean | Standard Deviation | Sample Variance | Mean | Standard Deviation | Sample Variance | ||||
| 60 °C | Hornbeam | L* | 69.8 | 1.503 | 2.259 | 67.0 | 3.277 | 10.737 | 30 |
| a* | 8.3 | 0.747 | 0.558 | 6.6 | 0.610 | 0.372 | 30 | ||
| b* | 27.7 | 0.361 | 0.130 | 21.1 | 0.946 | 0.896 | 30 | ||
| Maple | L* | 66.1 | 1.842 | 3.393 | 62.2 | 0.587 | 0.344 | 30 | |
| a* | 12.7 | 0.669 | 0.448 | 12.4 | 0.541 | 0.293 | 30 | ||
| b* | 33.0 | 1.129 | 1.275 | 27.3 | 0.158 | 0.025 | 30 | ||
| 120 °C | Hornbeam | L* | 69.3 | 0.533 | 0.284 | 60.6 | 1.373 | 1.886 | 30 |
| a* | 8.7 | 0.507 | 0.257 | 8.8 | 0.567 | 0.322 | 30 | ||
| b* | 26.3 | 0.706 | 0.498 | 25.4 | 0.083 | 0.007 | 30 | ||
| Maple | L* | 75.3 | 0.816 | 0.666 | 56.8 | 1.202 | 1.444 | 30 | |
| a* | 8.7 | 0.422 | 0.178 | 12.2 | 0.446 | 0.199 | 30 | ||
| b* | 27.9 | 0.501 | 0.251 | 25.5 | 0.620 | 0.385 | 30 | ||
| Samples | Process | Hue Angle h* (°) | Color Saturation C*ab | Saturation Sab (%) | |
|---|---|---|---|---|---|
| 60 °C | Hornbeam | Before drying | 73.4 | 28.9 | 38.2 |
| After drying | 72.7 | 22.1 | 31.4 | ||
| Maple | Before drying | 69.0 | 35.3 | 47.2 | |
| After drying | 65.5 | 30.0 | 43.5 | ||
| 120 °C | Hornbeam | Before drying | 71.7 | 27.7 | 37.2 |
| After drying | 71.0 | 26.8 | 40.5 | ||
| Maple | Before drying | 72.6 | 29.2 | 36.2 | |
| After drying | 64.5 | 28.3 | 44.5 | ||
Publisher’s Note: MDPI stays neutral with regard to jurisdictional claims in published maps and institutional affiliations. |
© 2021 by the authors. Licensee MDPI, Basel, Switzerland. This article is an open access article distributed under the terms and conditions of the Creative Commons Attribution (CC BY) license (https://creativecommons.org/licenses/by/4.0/).
Share and Cite
Klement, I.; Vilkovský, P.; Vilkovská, T.; Orłowski, K.A.; Barański, J.; Chuchala, D.; Suchta, A. The Influence of Drying Temperature on Color Change of Hornbeam and Maple Wood Used as Surface and Inner Layers of Wood Composites. Appl. Sci. 2021, 11, 10673. https://doi.org/10.3390/app112210673
Klement I, Vilkovský P, Vilkovská T, Orłowski KA, Barański J, Chuchala D, Suchta A. The Influence of Drying Temperature on Color Change of Hornbeam and Maple Wood Used as Surface and Inner Layers of Wood Composites. Applied Sciences. 2021; 11(22):10673. https://doi.org/10.3390/app112210673
Chicago/Turabian StyleKlement, Ivan, Peter Vilkovský, Tatiana Vilkovská, Kazimierz A. Orłowski, Jacek Barański, Daniel Chuchala, and Aleksandra Suchta. 2021. "The Influence of Drying Temperature on Color Change of Hornbeam and Maple Wood Used as Surface and Inner Layers of Wood Composites" Applied Sciences 11, no. 22: 10673. https://doi.org/10.3390/app112210673
APA StyleKlement, I., Vilkovský, P., Vilkovská, T., Orłowski, K. A., Barański, J., Chuchala, D., & Suchta, A. (2021). The Influence of Drying Temperature on Color Change of Hornbeam and Maple Wood Used as Surface and Inner Layers of Wood Composites. Applied Sciences, 11(22), 10673. https://doi.org/10.3390/app112210673