1. Introduction
Visual comfort is a subjective evaluation of satisfaction with the surrounding environment [
1,
2]. Today, people are increasingly pursuing satisfaction, especially satisfaction with the environment. Therefore, it is of practical significance to improve the ambient light condition [
3]. As representatives of modern urban buildings, many libraries use full-transparent floor-to-ceiling windows, which allow people to observe from both inside and outside. While ensuring the aesthetic qualities of the building, this structure is relatively less considerate of visual comfort in the indoor environment. Individuals are more likely to suffer from extra glare [
4].
Based on current research, two main conclusions were derived from existing indoor lighting research. First, our research has shown that natural light technology can save 64% more energy compared to other institutions, so making full use of natural light can help protect the natural environment by making full use of natural energy [
5,
6]. According to the available data, changes in library lighting conditions can affect users’ reading, mood, comfort, and behavior in the library. Satisfaction and residence time are also affected by the light. With better sunlight, readers show more positive behaviour and favour lightened areas. Secondly, most of the current research has focused only on macro level concepts, such as form, function, space, the streamlined design of libraries and the form of future digital libraries. There have also been some related achievements in energy conservation research. Most of them are simple, producing findings on a macro level but have not conducted any specific spatial experience research. Most current studies are strategic analyses of natural light through simulation using a traditional calculating system. There is far less research that has conducted simulation analysis and collected quantitative data to propose improvements aiming at a more flexible light and climate environment. There are also relatively few studies on new shading devices and shading strategies based on light discomfort in college libraries. Thirdly, several studies have discussed the potential smart devices and automatic solutions for high-performance or efficient lighting environments, which inspired this research to take smart and automatic into consideration [
7,
8,
9,
10]. The library is an important place for college students to carry out learning activities. Creating a comfortable indoor environment here is conducive to improving the overall experience and learning efficiency of students [
11]. At present, this area of research, especially that focusing on design and practice, is relatively sparse worldwide [
9].
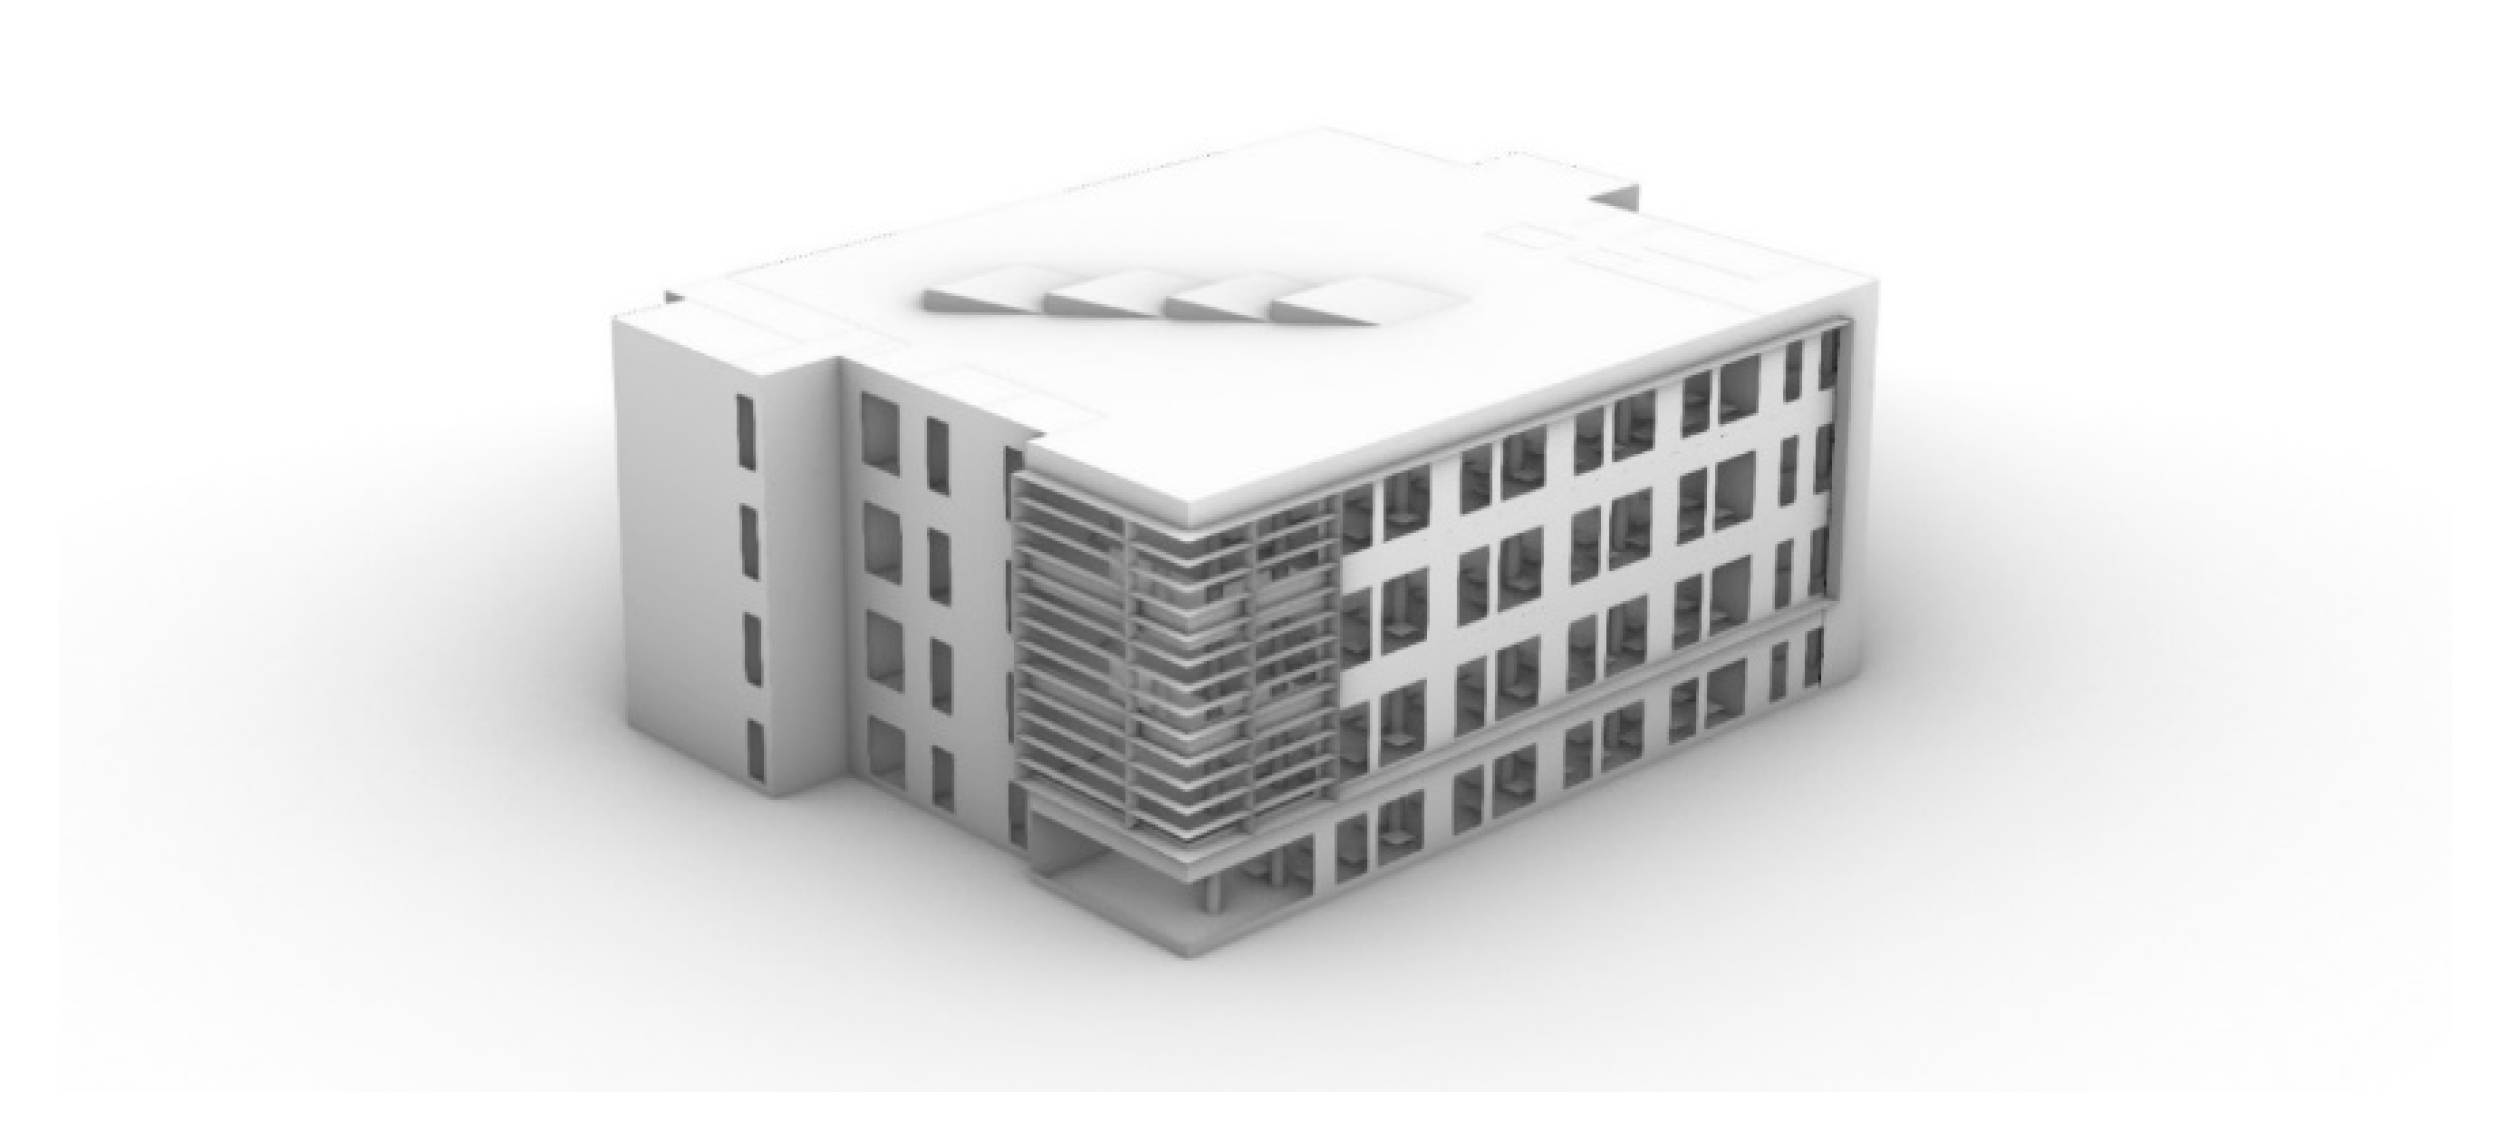
This project set Shanghai Jiao Tong University’s main library as the research object. The college library we chose to study is one of the most frequently used learning spaces for teachers and students on the campus. The current library reading environment features obvious pain points in terms of visual comfort. Students and teachers bring their own umbrellas to block out strong sunlight, and seats close to the window are avoided due to strong direct sunlight. These forced actions obviously affect users’ experience negatively. By focusing on the existing light environment of the library and the subjective experiences of users, this study pursues insights into existing pain points and real user needs and proposes corresponding design strategies that can improve the quality of the indoor environment of the library.
3. Research Procedure
We specifically chose the library in Shanghai Jiao Tong University as the research area, as it is the most used area in the university. The library contains a large number of floor-to-ceiling windows that lack efficient shading devices. A questionnaire focusing on occupants’ personal attitudes towards visual comfort was distributed in the library to collect subjective data. Basic personal information, including gender, age, clothing, and activity level, was collected. Subjective preferences related to light comfort was recorded. Visual comfort was rated on a five-point scale: comfortable, slightly uncomfortable, uncomfortable, very uncomfortable, and intolerable. A total of 239 samples were obtained in the field survey.
3.1. Preliminary Analysis of the Research Data
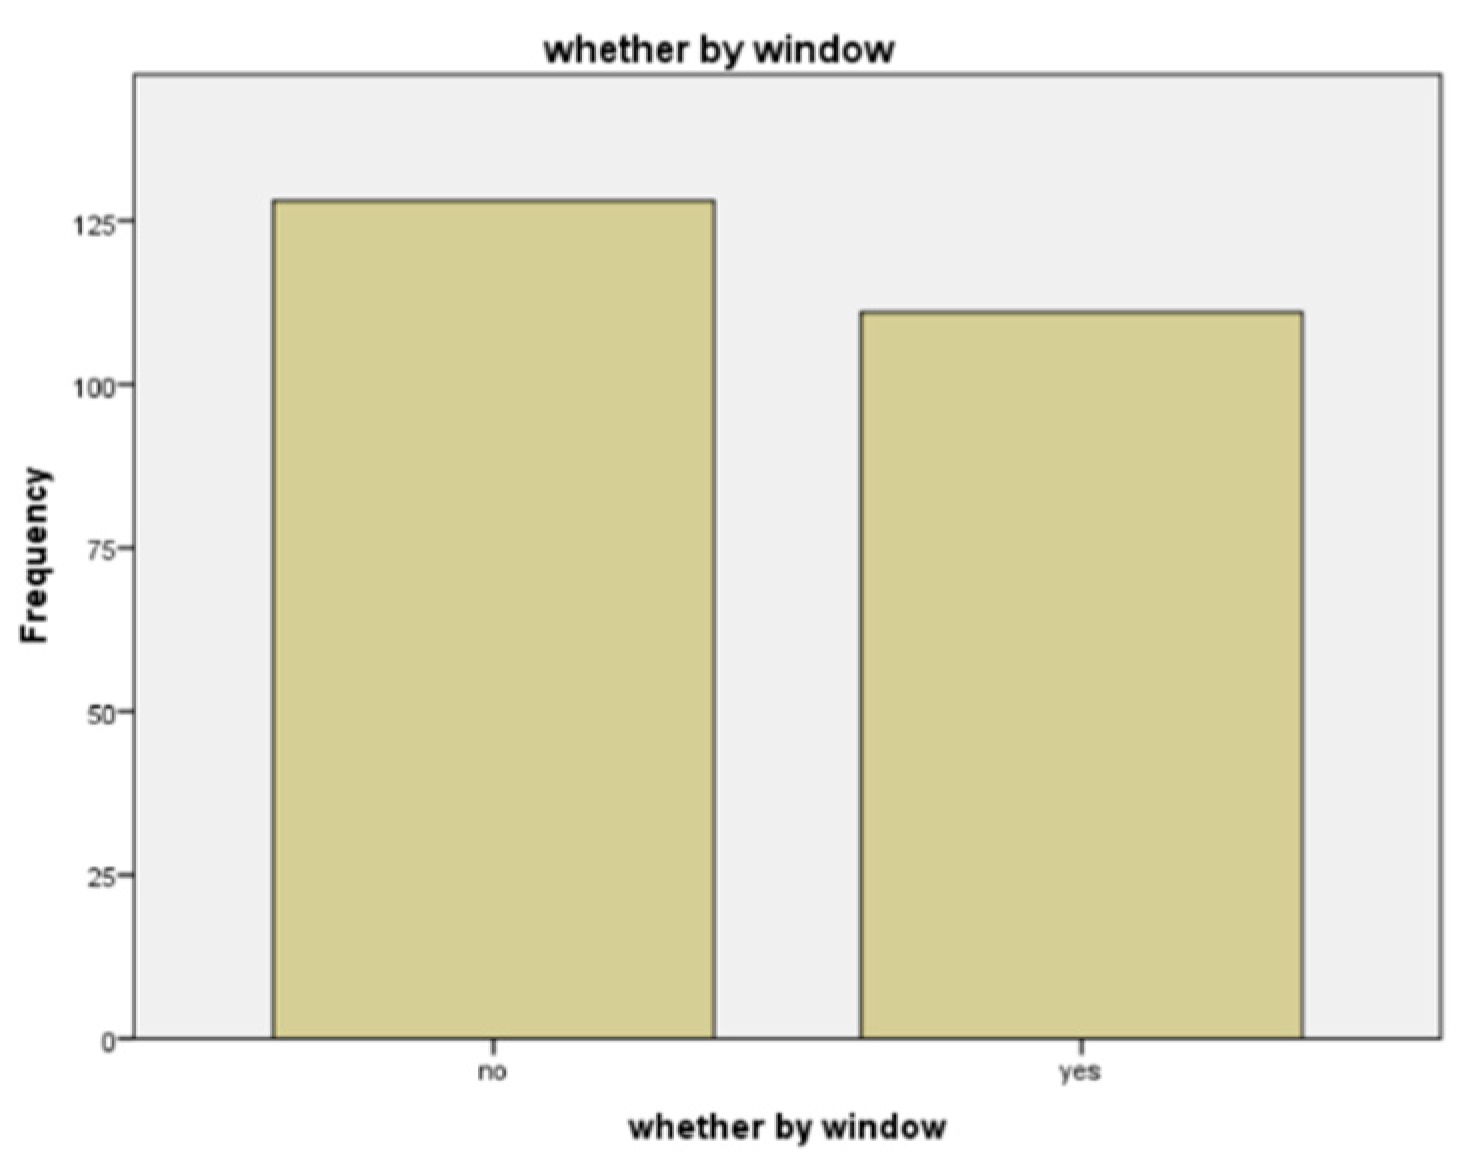
Because the major objective of this research was to assess the influence of direct sunlight and the interviewees’ opinions on the light environment of the library, we addressed the subjects’ locations in the library. By analysing whether their locations are near the windows or in direct sunlight, we are able to reach more precise conclusions in subsequent analyses. The locations are summarized in
Figure 1. According to the survey results, the number of interviewees choosing to stay by the window (111) is slightly lower than the number of interviewees choosing not to stay by the window (128).
3.2. General Description of Visual Comfort
In
Table 1, an overview of our survey results on the interviewees’ personal assessment of the light environment is provided. In
Table 1a, the data on the light and dark preferences of the interviewees and light environmental satisfaction are listed. Generally, interviewees felt positive about the library’s light environment. As shown in
Table 1b, more than half of the interviewees found the library’s light environment satisfying, but some interviewees still thought that the environment was too dark or harsh and were not satisfied with the current light environment. In addition to individual differences of perception, the main reason for this may be that the light environment at different seats is inconsistent.
3.3. Advanced Analysis of Research Data
An advanced analysis of the data collected was conducted to statistically prove the former conclusions. In the advanced analysis, the influence being by a window and being subjected to direct sunlight was specifically focused on. As shown in
Table 2, we applied a
t-test to investigate the group statistics related to direct sunlight. All of the values of significance are below 0.05, which statistically means that direct sunlight has a critical effect on the users’ experience.
In
Table 3, the user’s satisfaction with the optical environment and the light environment, and their overall comfort, all showed higher scores when without direct sunlight, meaning direct sunlight mostly has a negative impact on user experience.
In
Table 4, we see that there are significant differences between the users’ feelings towards light and dark, and their satisfaction with the light environment, between the window groups. However, the value of significance of overall comfort is above 0.05, which means, in a statistical sense, that being by the window is not critical to users’ satisfaction.
3.4. Research Conclusion
For library users, the light environment is generally warm and bright, and the overall satisfaction is relatively high. However, the data reflect that some readers still have a poor experience under the current conditions of the library.
The problem of direct sunlight has a serious negative impact on the reader’s experience, which is mainly related to the light environment. Direct sunlight can cause glare, reflections on the computer screen, a high ambient temperature, and many other uncomfortable light conditions. These are the current main problems in the library’s photo light environment. In addition to objective conditions such as direct sunlight and regional environmental differences, the individual conditions of different readers, such as studying habits, personal attire, and subjective feelings, also affect the overall comfort with the photo light environment.
4. Design and Implementation
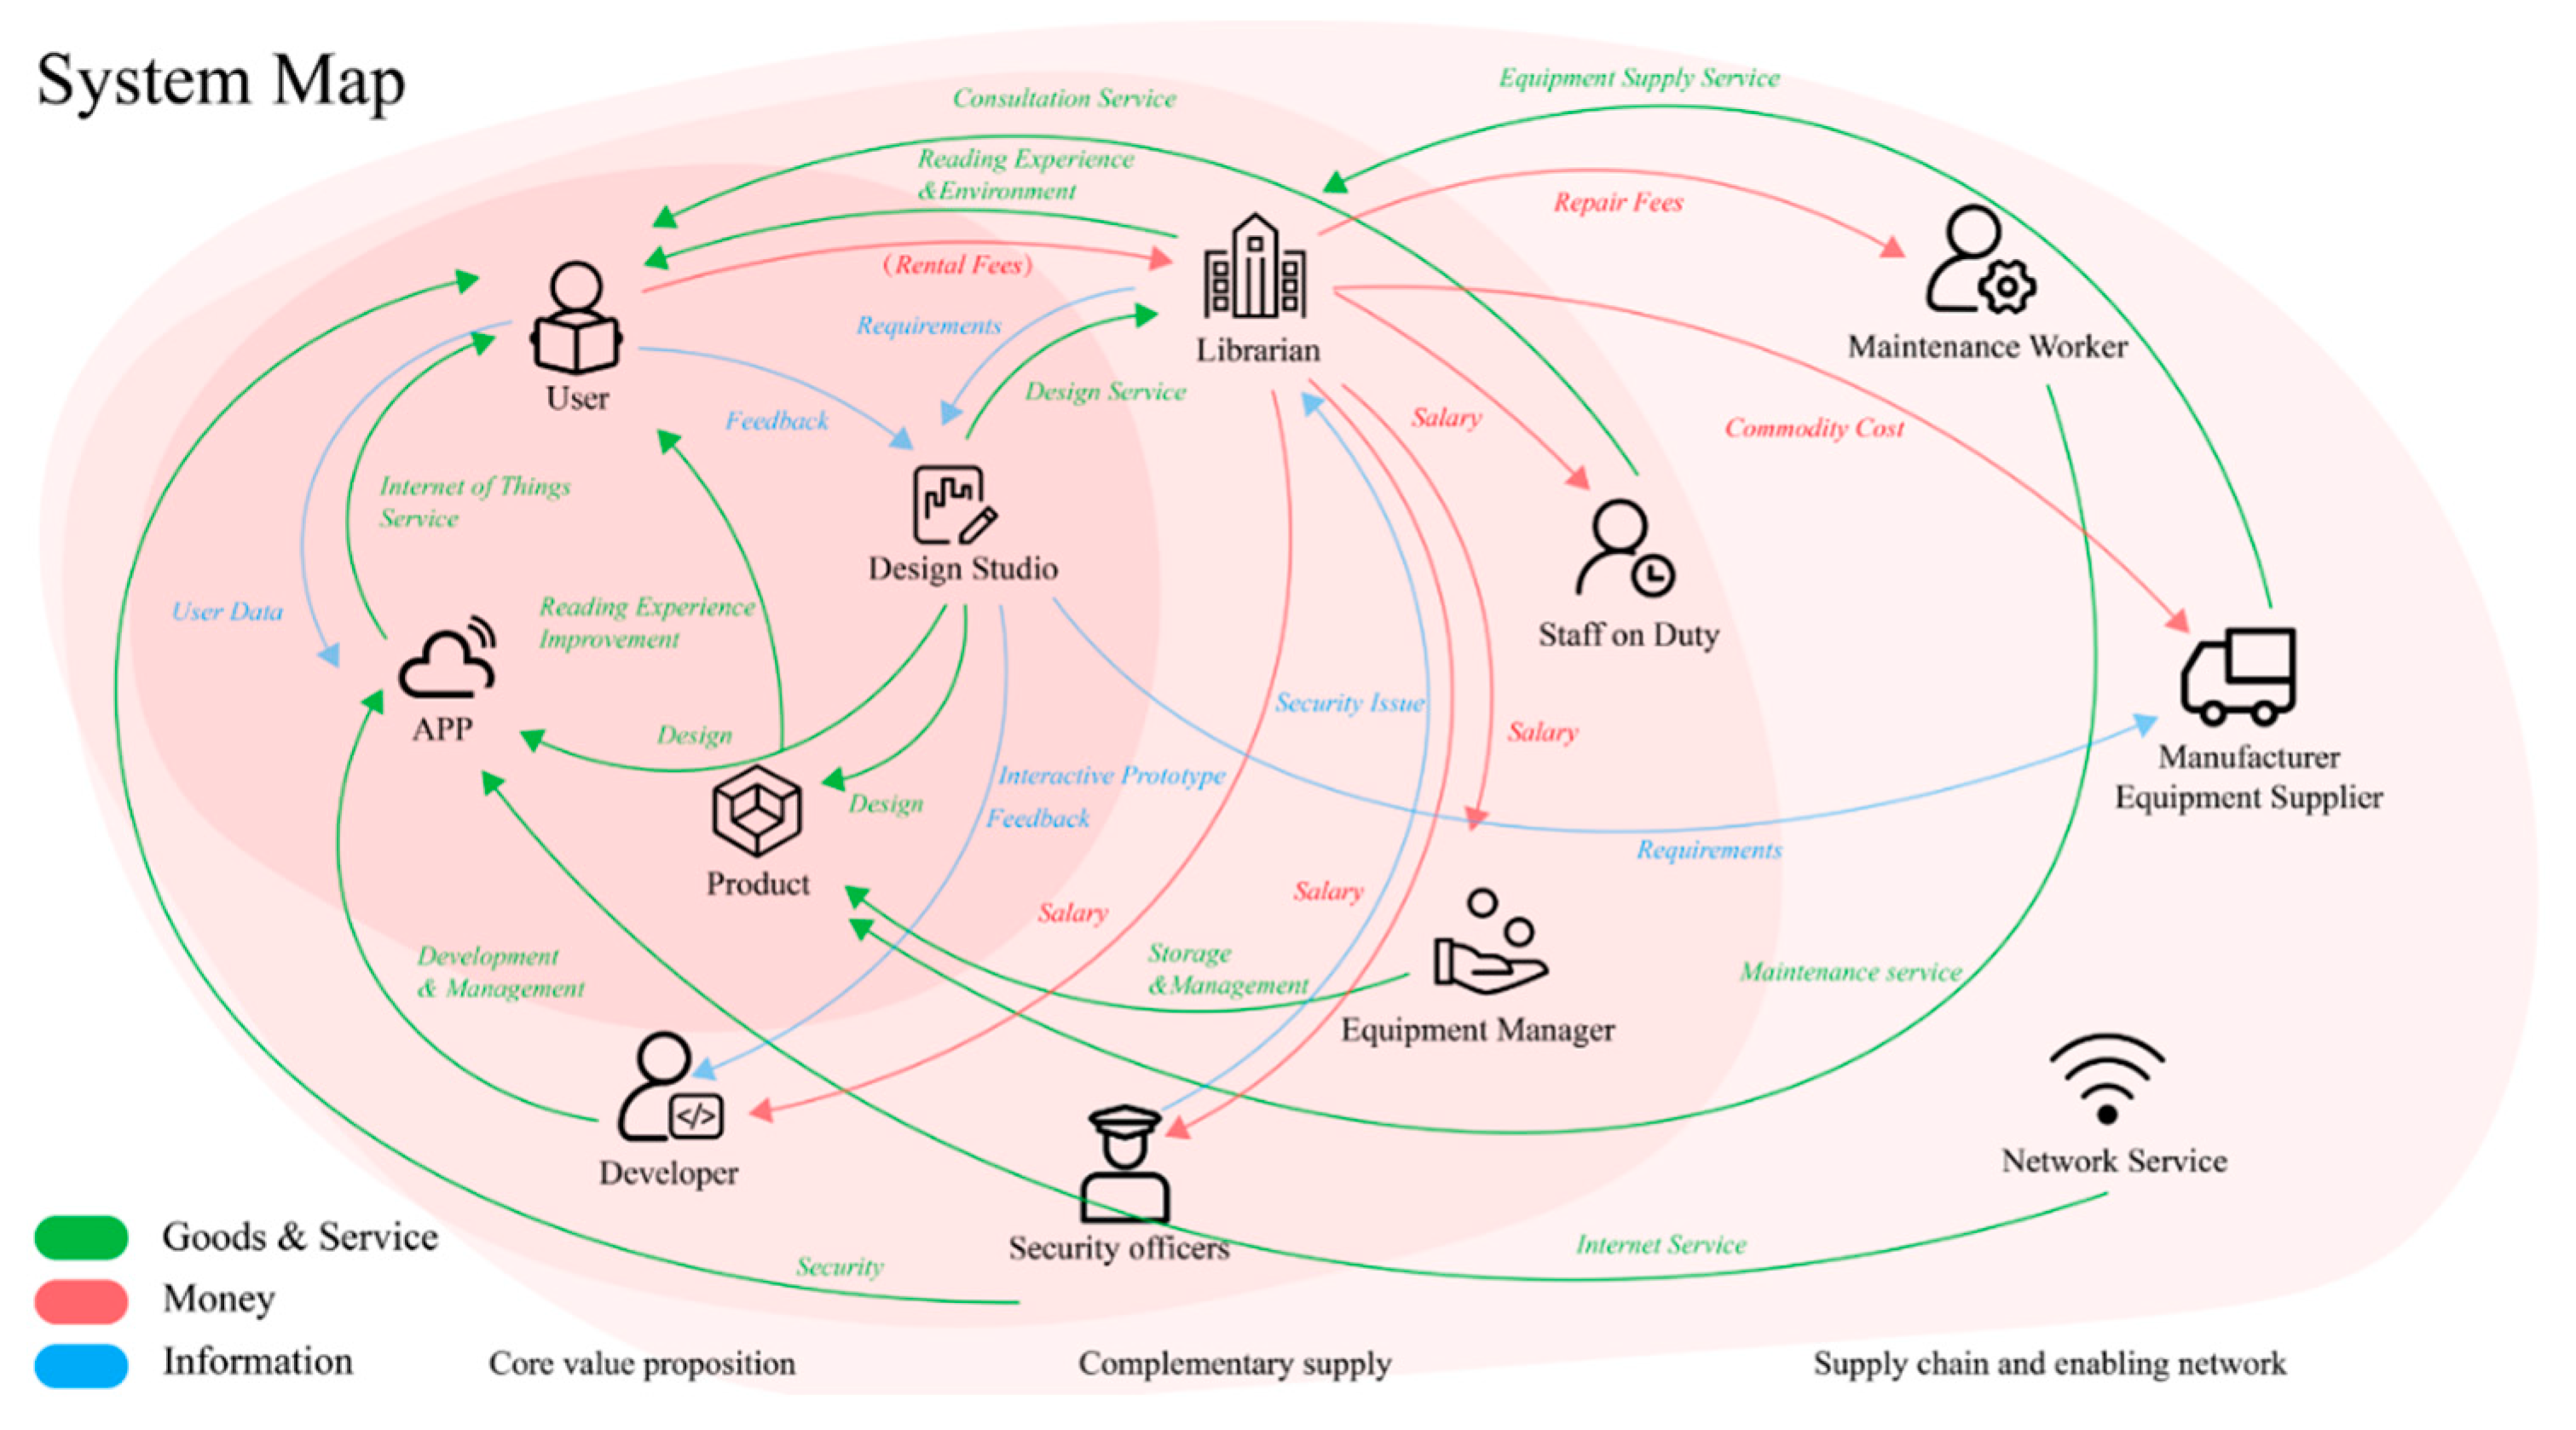
In this section, we evaluate the pain points derived from the research. The Value Flow Model presents the supply and communication between an organization and its users, as well as the value flow among multiple members in the whole system. Therefore, we built a Value Flow Model for the operation of this project in the early stage as shown in
Figure 2, incorporating readers, the design studio, APP, and products. These construct a four-core value proposition. Librarians, staff on duty, equipment managers, and security staff are complementary value points. Maintenance workers, manufacturers, and the network service compose the supply chain. The construction of the value stream model in this phase helps us establish the overall direction of product and strategy design in the actual operation system.
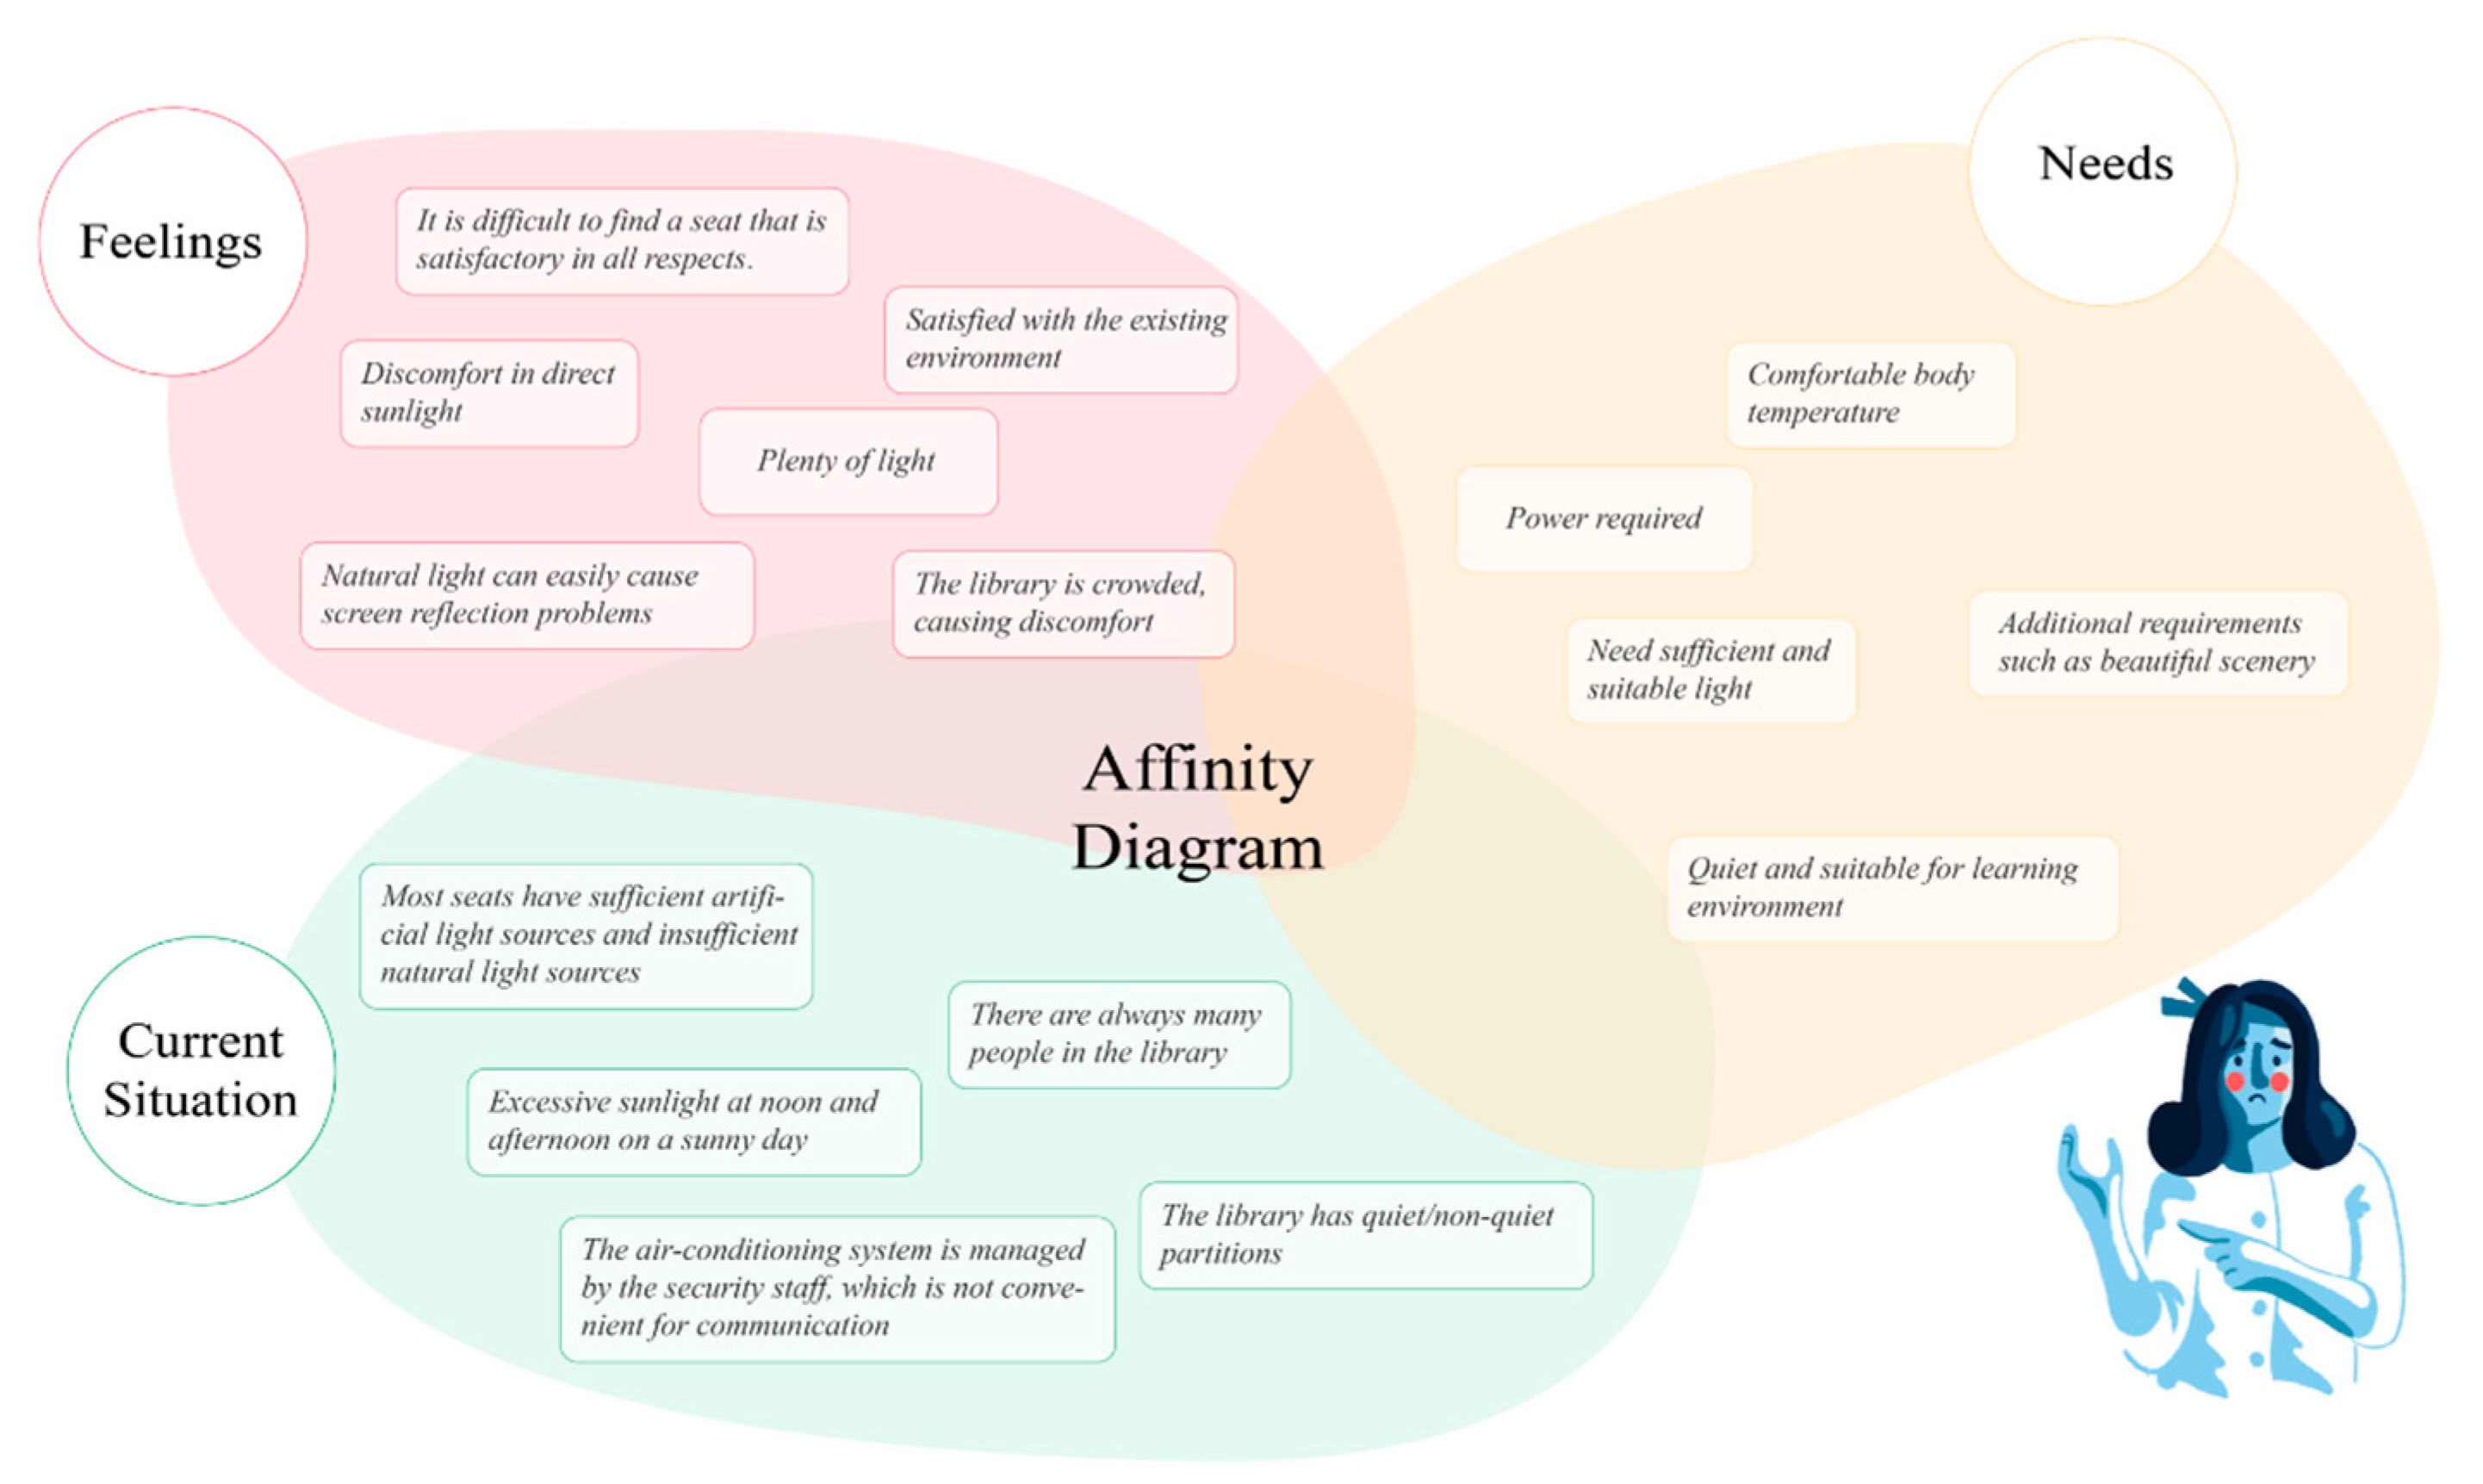
We also used an affinity diagram to derive design insights. This places designer insights and observations on paper, facilitating the aggregation of information.
Figure 3 is based on specific observations of the project and information derived from an affinity diagram. The information obtained is divided into three parts: user feeling, actual conditions, user needs.
4.1. Design Expectations
Based on the pain points derived from the research, this study sought to design a portable product for improving visual comfort, thus constructing a sun-responsive shading system. The main functional expectations are listed below.
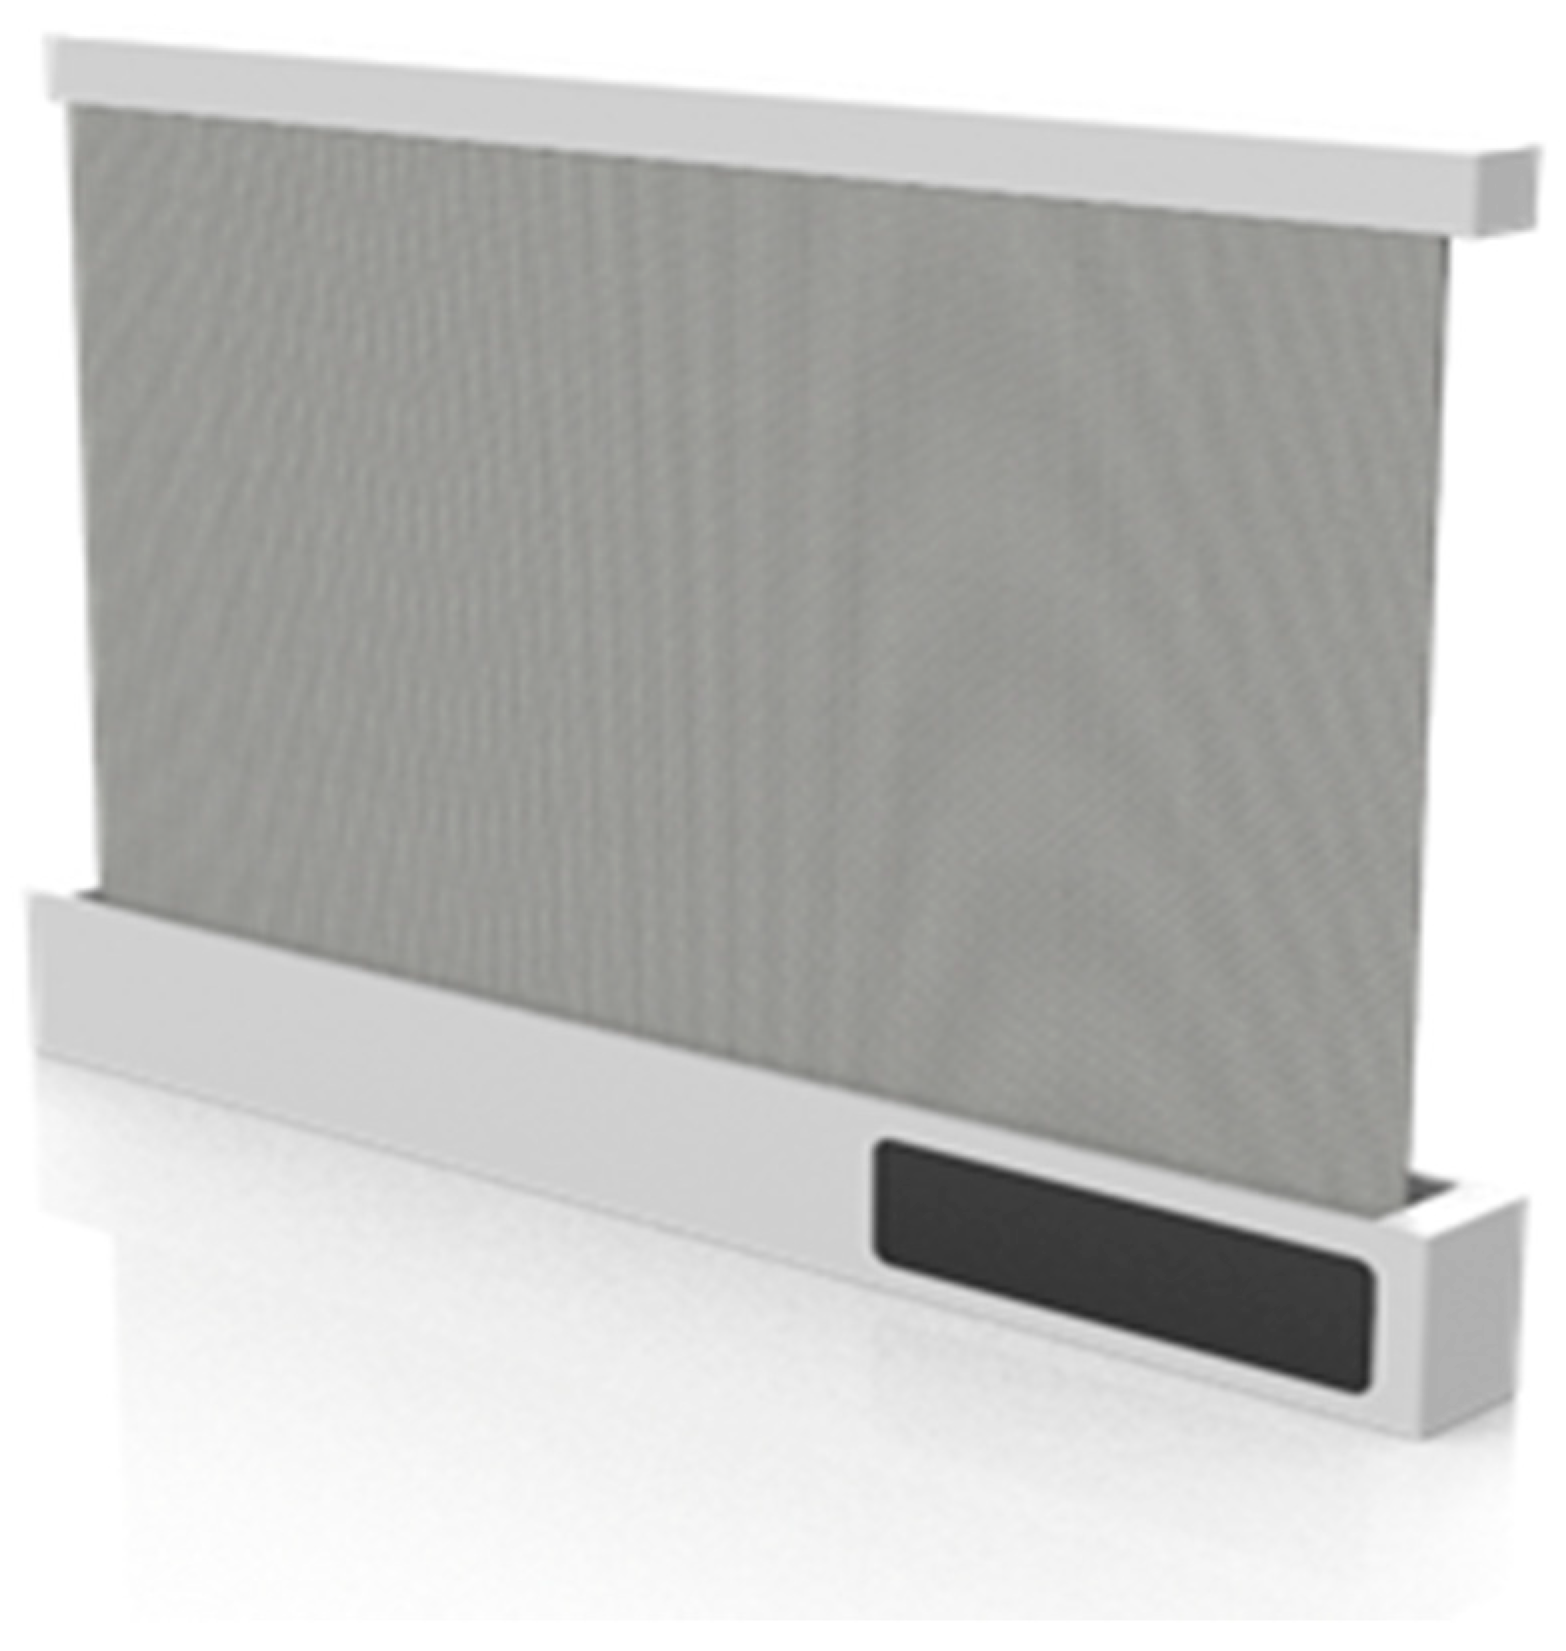
First, the device should be of a portable size. The appearance of the product is a cuboid. The sunshade curtain is hidden inside the device when it is not activated. The cuboid shape of the device when closed makes it easy to carry, and it can be placed anywhere the user wants.
Secondly, the process of controlling this device should be simple. The main target users of this device are students and office workers, so we designed a mobile phone application to control the sunshade.
Thirdly, with the sensors we put inside the device, it can automatically adjust the height of the sunshade curtain to ensure shading effectiveness. The design can automatically change the lifted height of the sunshade curtain according to environment parameters collected by sensors inside the device, helping it to keep a specific area covered. According to the users’ personal needs, the device can be switched on or off on the mobile phone application.
Fourthly, the product and the mobile phone application work together to implement information collection and communication. When a relatively high number of sunshades are used in a specific area, such as a library, sensors in the sunshades can collect data relating to environmental parameters, such as temperature and humidity, and publish them on the application, keeping the user informed of the latest information related to the building’s environment.
4.2. Product Design Workflow
Based on design expectations and existing designs, this study developed a portable intelligent indoor liftable shade, called ‘SUNSHADE’. The SUNSHADE allows users to shade specific areas. The use scenario is an offline working environment in a company or school. The target users are office workers or students suffering from direct sunlight.
The product consists of a photosensitive sensor, a temperature and humidity sensor, a total solar radiation intensity sensor, a data recorder, a connector, a single-chip microcomputer, an LED display screen, and a shading film (
Figure 4).
A customized shell comprises the main part, which can be raised and lowered, and has a small volume and a light weight. The photosensitive sensor, temperature and humidity sensor, and total solar radiation intensity sensor are integrated into the 3D-printed shell of the lifting part and connected to a single-chip microcomputer through a connecting rod.
The single-chip microcomputer is integrated in the shell of the 3D-printed main body and electrically connected to an LED screen to display the information. The main body is placed on a surface that needs to be shaded. As the sensor senses the light environment, the light environmental data will be displayed on the LED screen. The program written in the single-chip microcomputer processes the light environment data and controls the movement of the motor, so that the shading film and the flexible OLED screen rise together to achieve the shading effect. The light environment data are synchronously transmitted by the single-chip microcomputer to the LAN for processing storage. All sensors are highly integrated in the housing to ensure the uniformity of the product’s appearance. Each part is customized by 3D printing, which has high applicability and adaptability. The product is light and easy to carry. The intelligent control of each sensor ensures adaptation to different areas. This means that the product can be applied to different light environments and change automatically according to the specific characteristics.
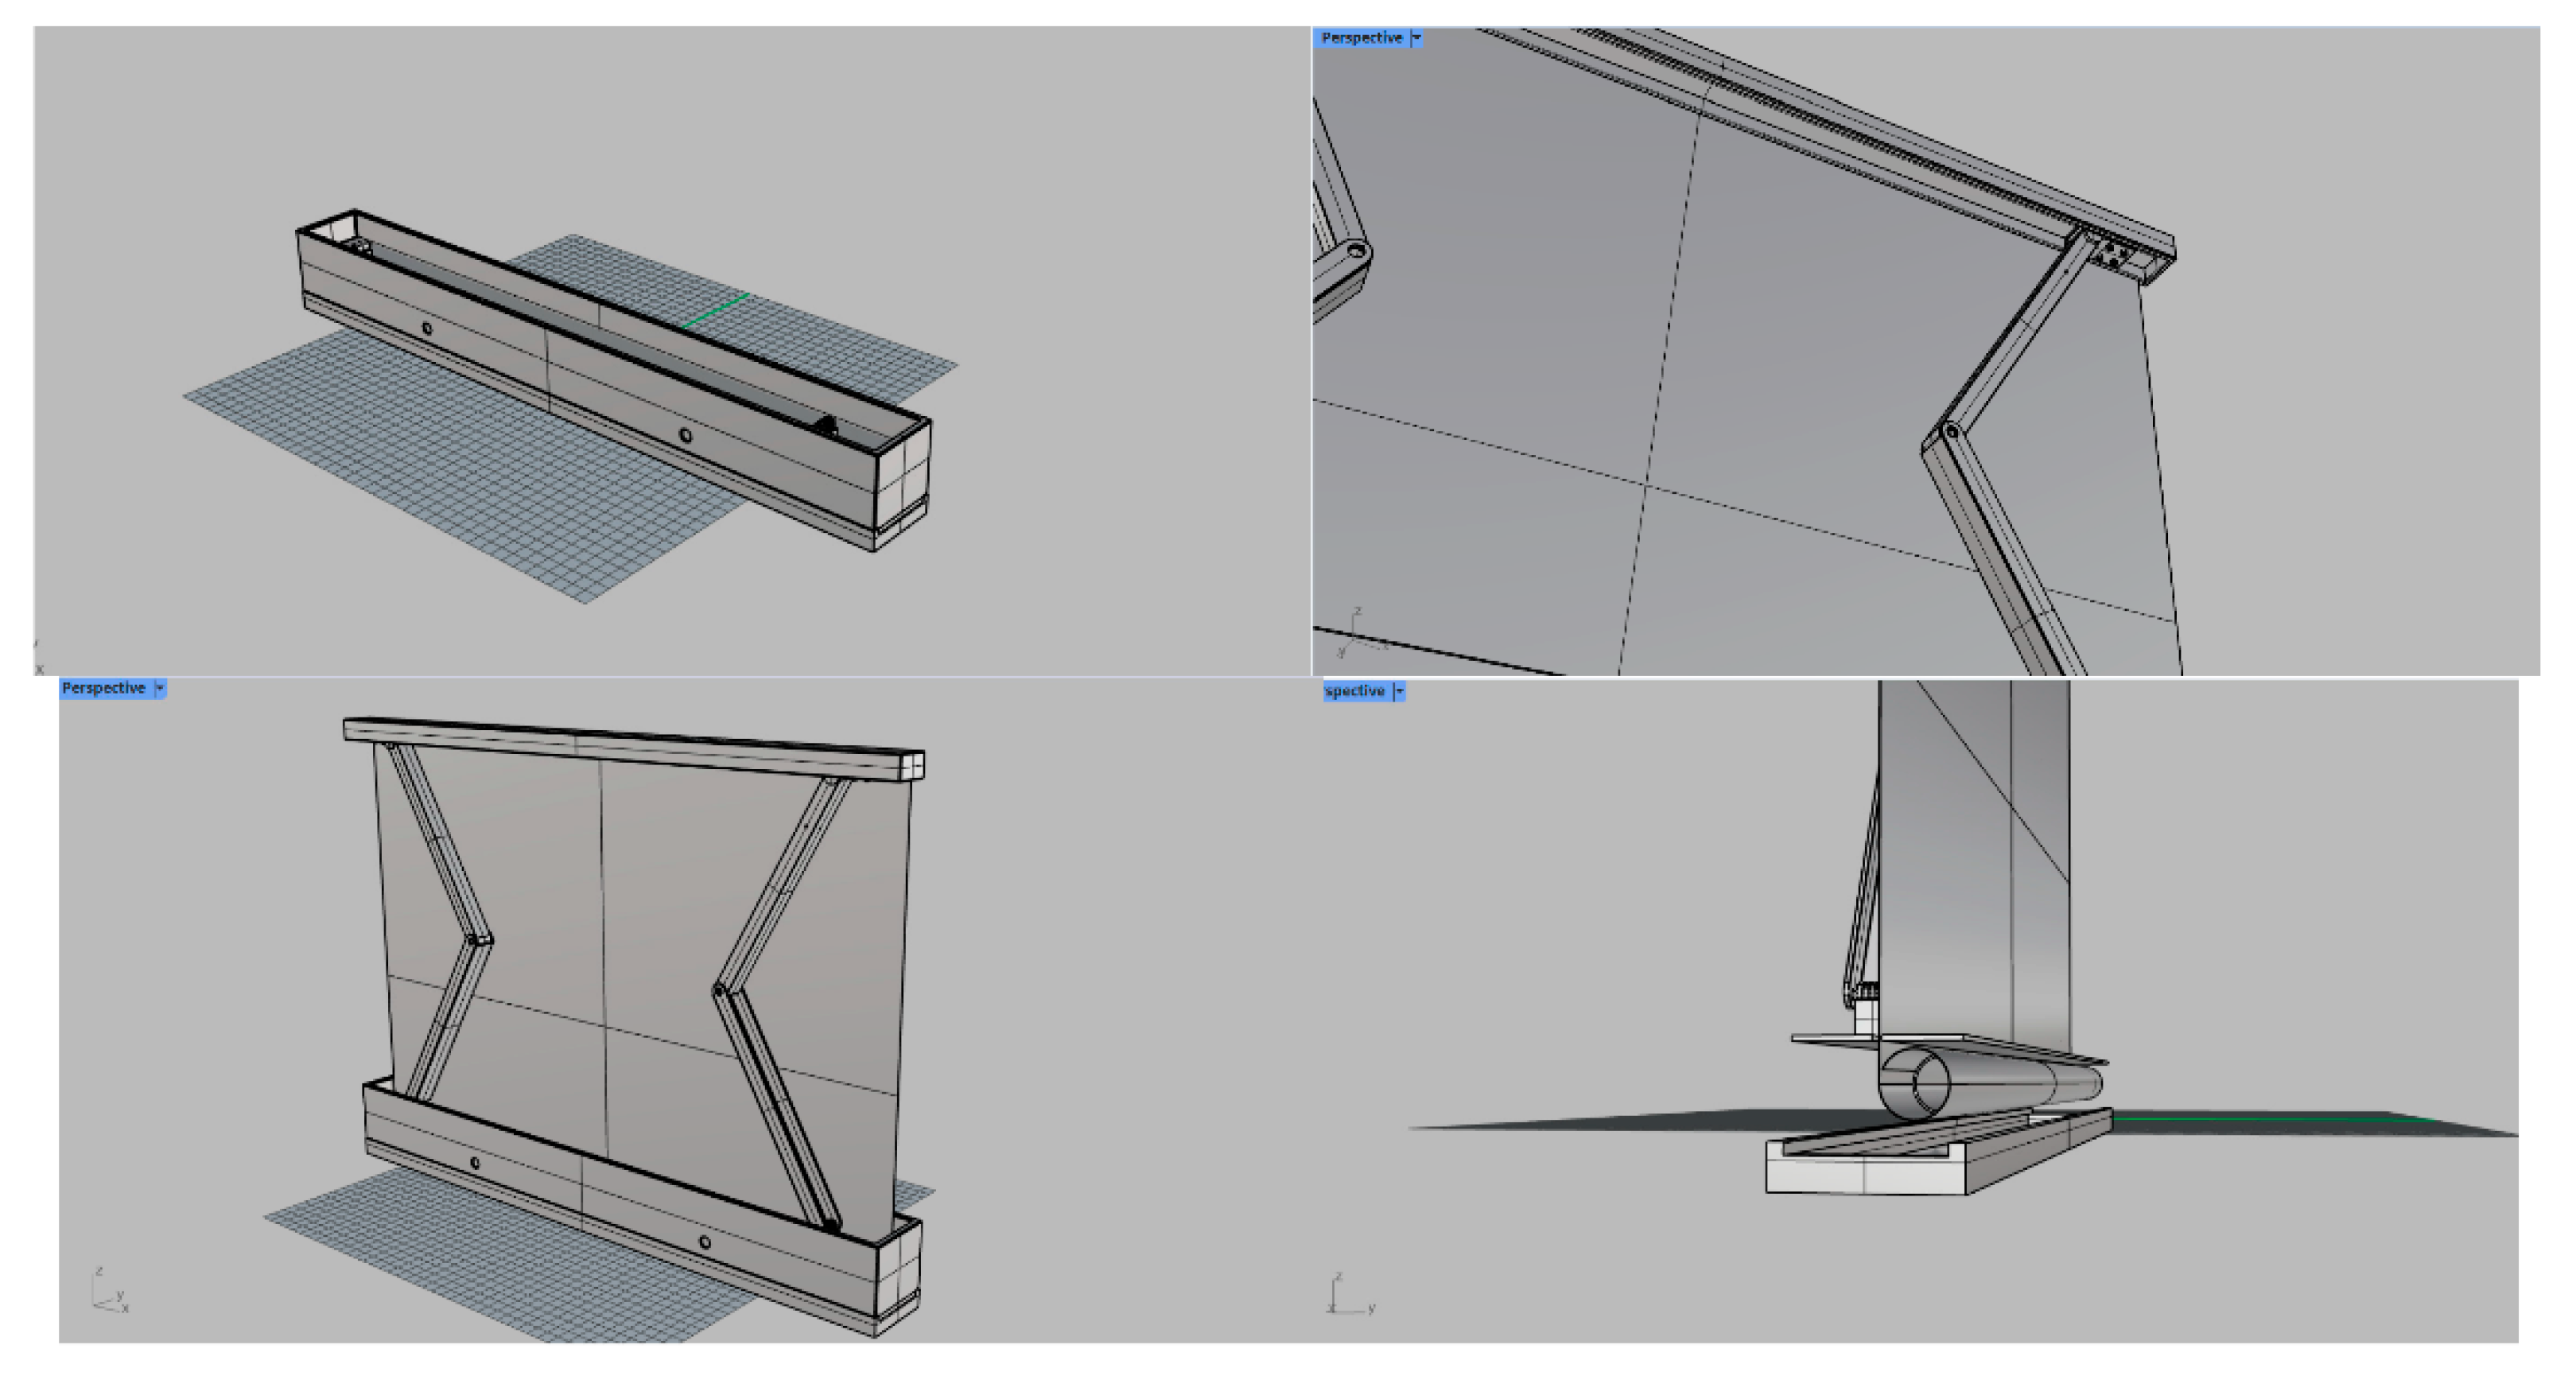
We have determined the following four requirements for our product: it must be convenient, easy to operate and intelligent, and it must be capable of environmental collection. First, according to the requirements of convenience, the shape of the product is rectangular, with the lower parts being slightly larger, and the upper part a little smaller. The regular shape can enhance the overall stability of the structure. When modelling, the lightweight design of the product is enclosed to reduce the wall thickness as much as possible. Regarding the steering gear, the shaft requires some bearing parts, such as an improved support structure and a stiffener. After stress analysis, the topology of the structure is optimized, and to make the structure stable, the weight is optimized. In order to make the form simple and facilitate the folding of the part of the structure used for shading, we chose a hinge structure. This structure can not only guarantee the scaling of the sunshade, but it can also endure much usage, ensuring its stability and long-term usage (
Figure 5).
To make our products more sustainable, we hope to use environmentally friendly materials for shell construction. Some large enterprises, such as Nike and Adidas, collect marine garbage, plastic bottles, woven nets, and other materials, and then recycle them into the soles of their shoes, which have a good supporting performance and can meet production requirements. In order to make the product more intelligent, as well as reduce the user’s use burden and learning cost, we have added a variety of sensors into the product. The top of the product is equipped with a number of photosensitive sensors, humidity sensors, temperature sensors, carbon dioxide sensors, PM2.5 detection devices and illuminance detection devices. The MCU receives sensor information to adjust the height of the sunshade. In addition to receiving sensor information, each device itself can determine the local environment model according to its location, incorporating year-round sun trajectory and temperature and humidity information, to adjust the device. These devices also do not operate independently; they can form an information collection and communication network. Several nearby devices can collect environmental information in the region, ensuring the accuracy of the mutually authenticated data. After a long period of environmental information collection, they can use these data to further optimize the environment.
4.3. Corresponding APP Design
To build the mobile phone application corresponding to the SUNSHADE device, we designed a prototype user interface in Figma. The process is divided into the following parts.
First, users of SUNSHADE can register an account in the initial page. Users can use their school accounts or telephone numbers to register.
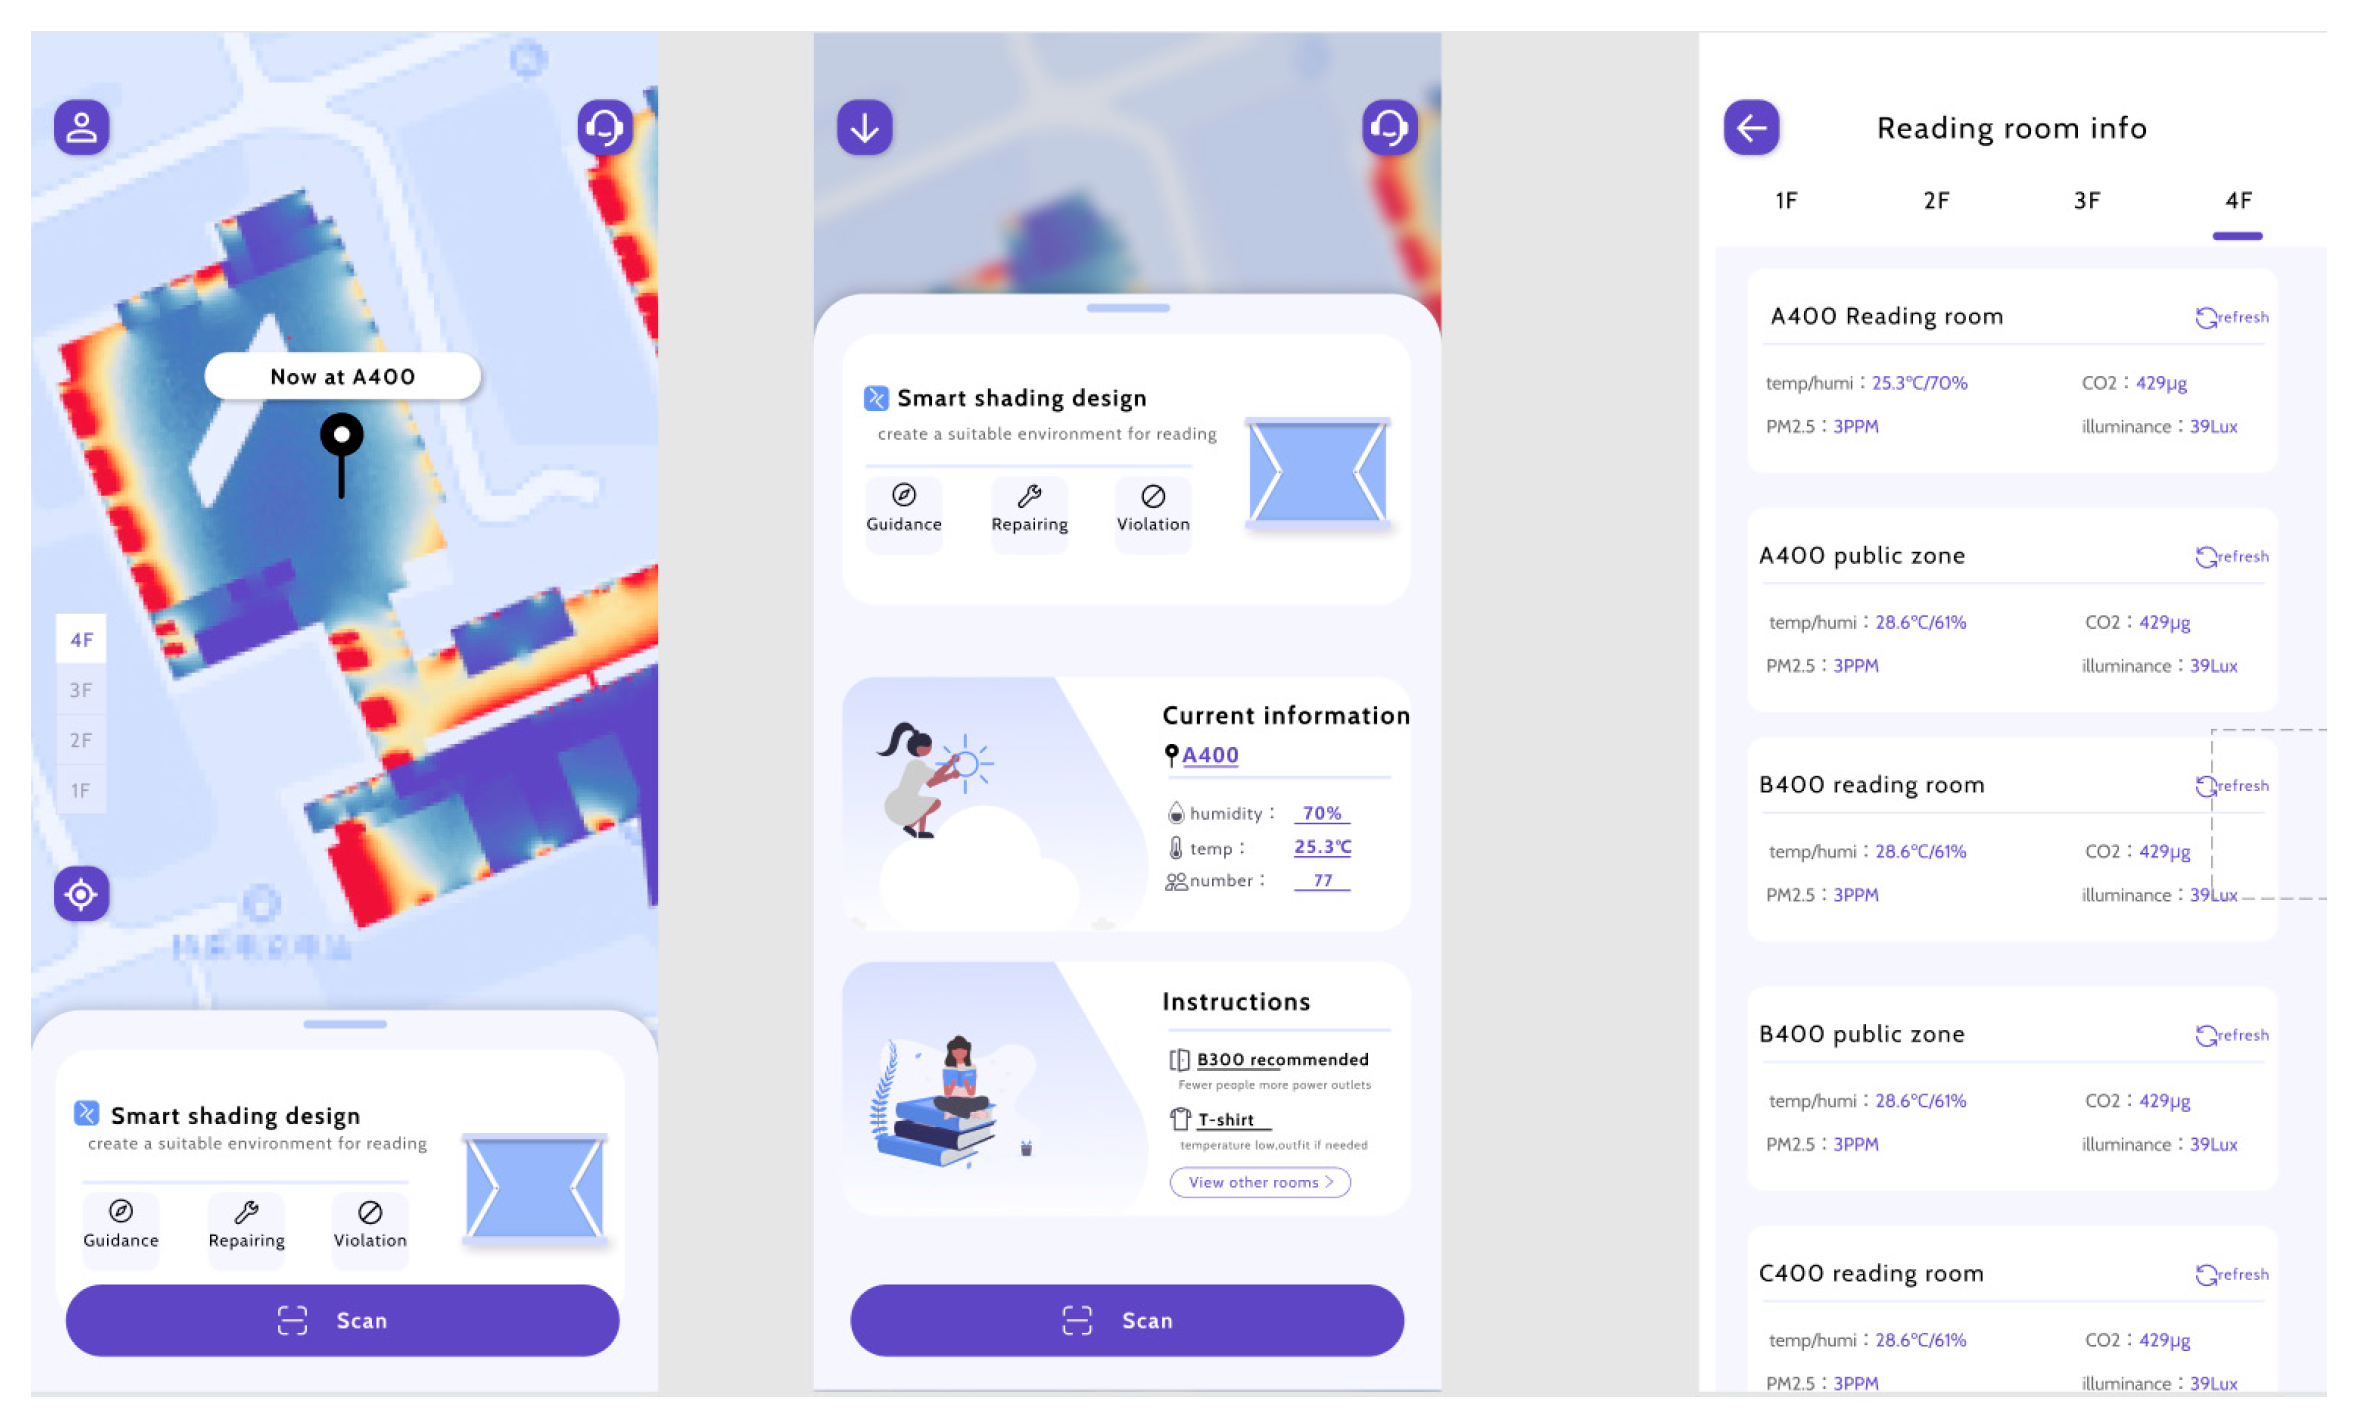
As shown in
Figure 6, After registering, the location of the user will be shown on a map of the area where the SUNSHADE is available. Sliding up from the bottom, detailed information of the environmental parameters and user distribution are shown, including the current humidity, temperature, carbon dioxide concentration and particulate matter 2.5 concentration.
If the user has decided to use one of the SUNSHADE devices, he or she can choose to either scan the QR code on the device or enter the number of the device to unlock it.
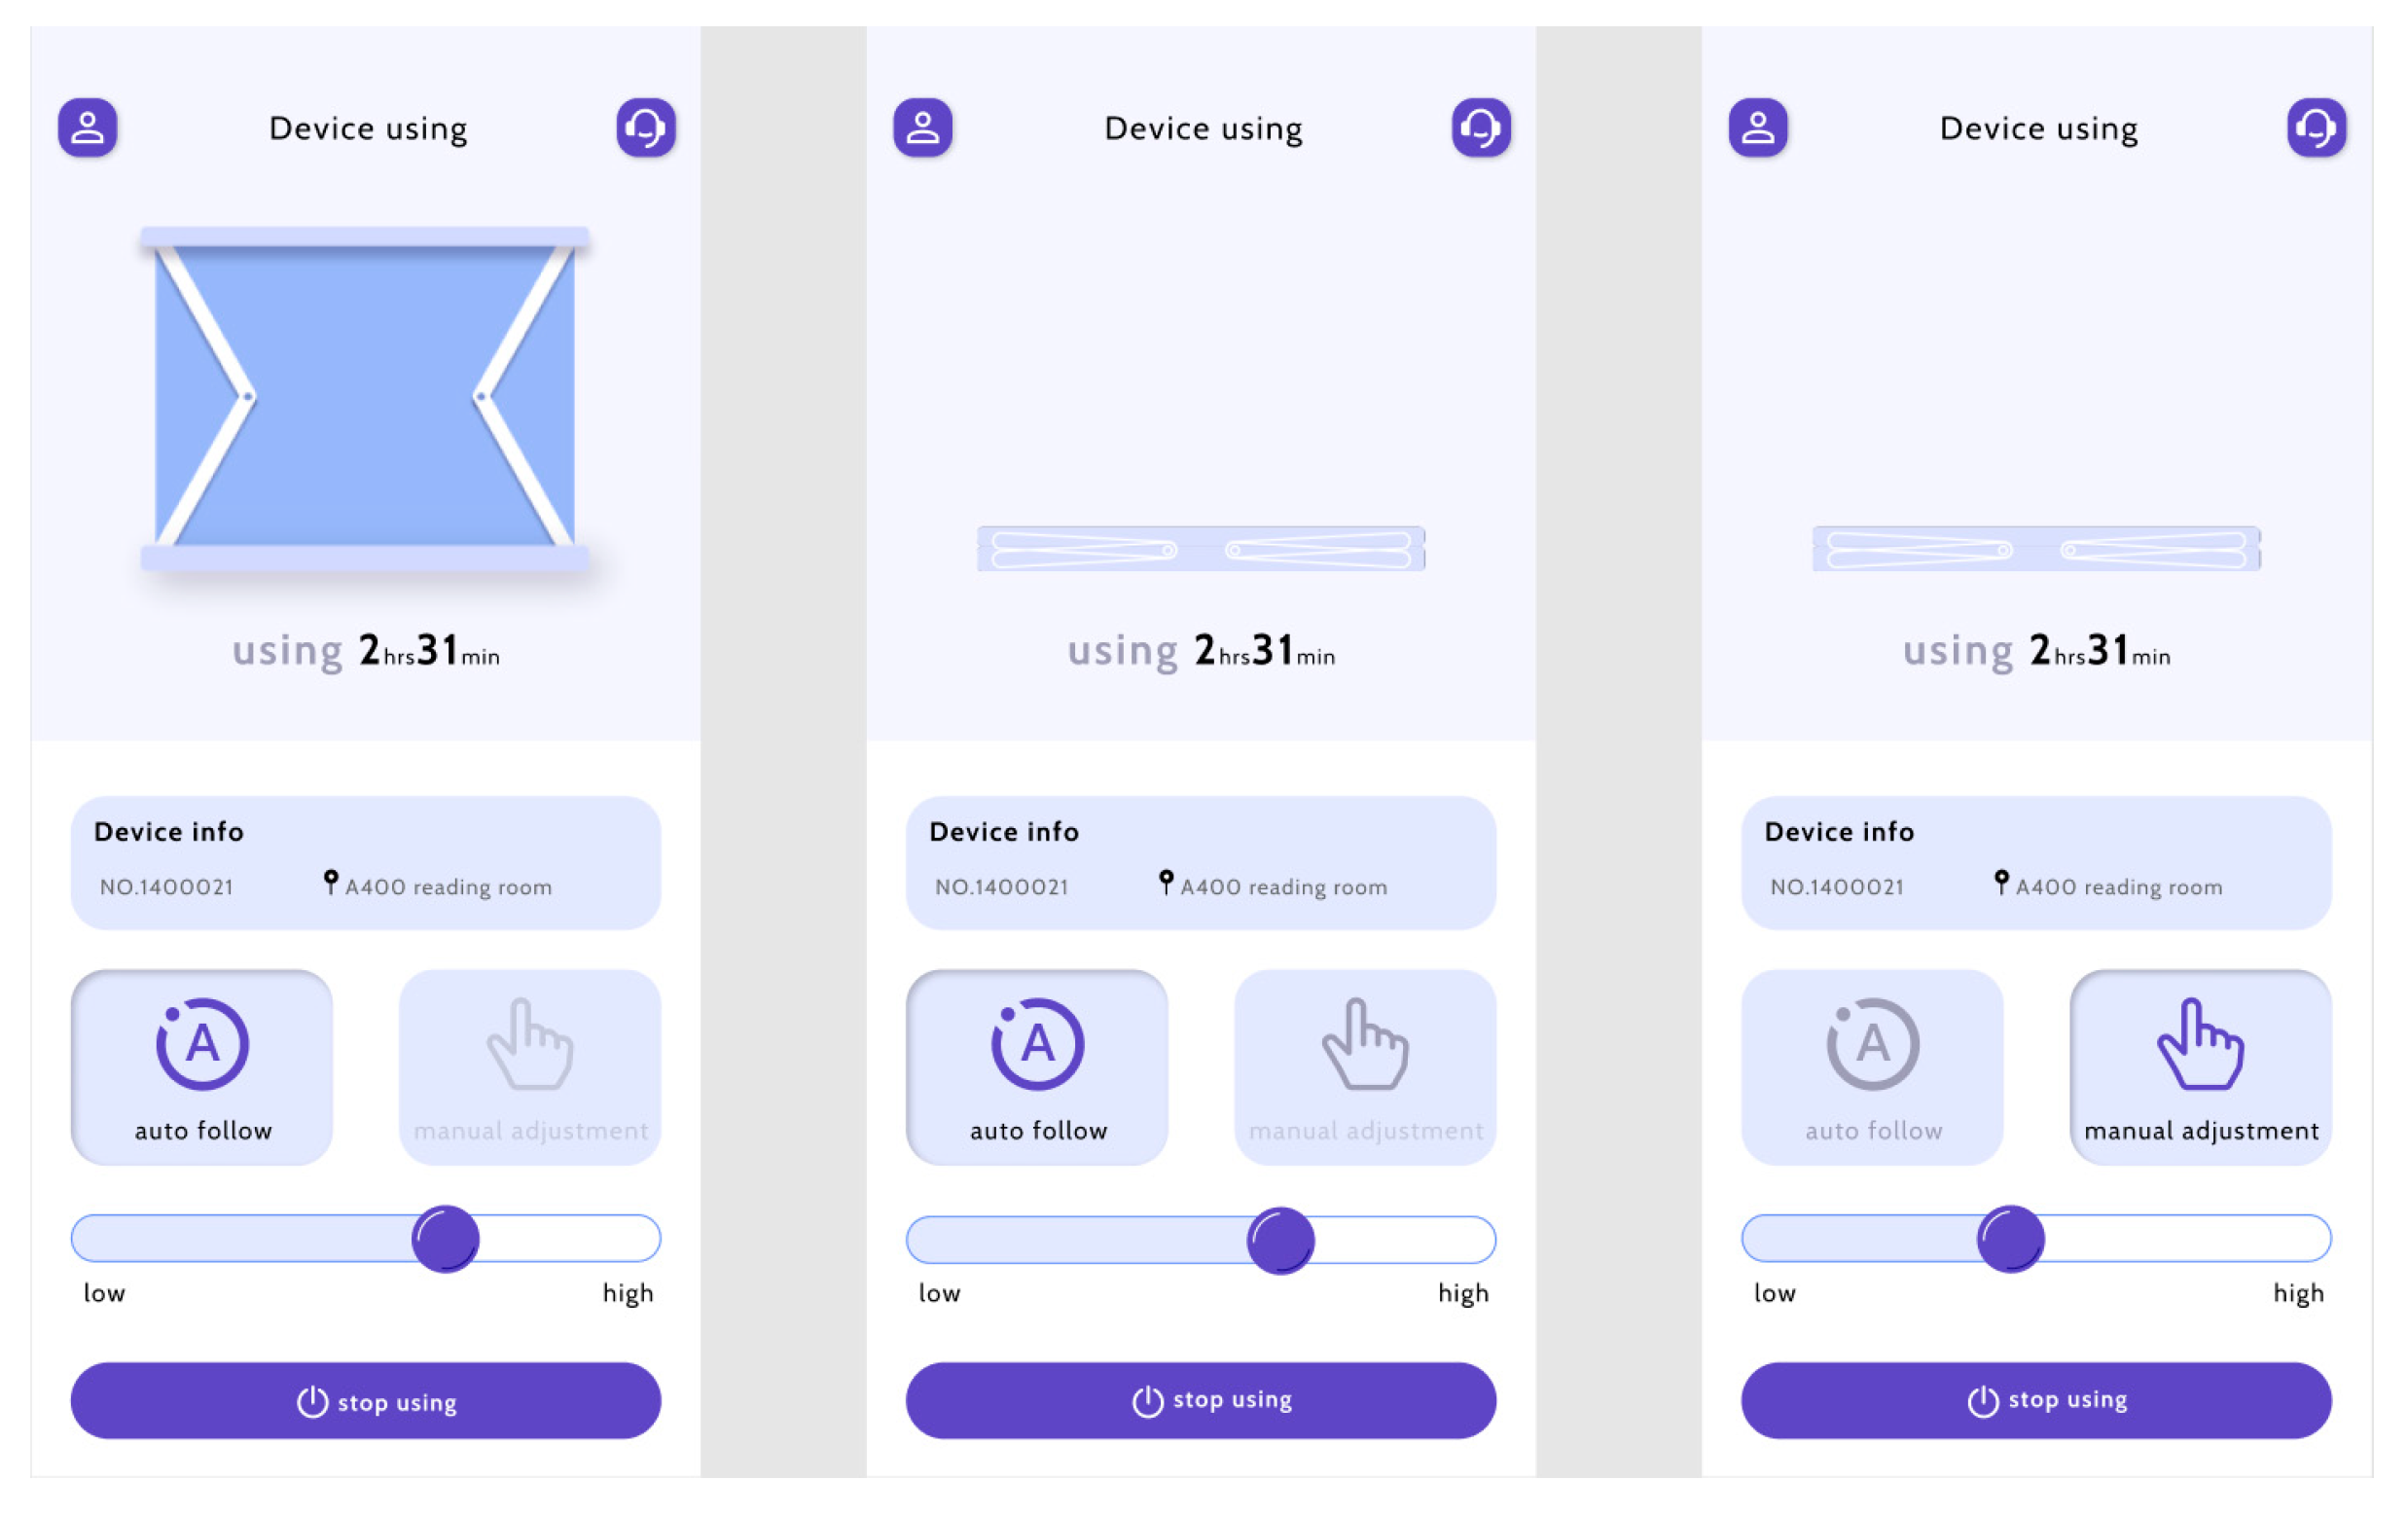
After successfully unlocking one of the devices, the controlling interface shows the device information (
Figure 7), which includes the number and location. Considering that the light environment in different areas varies significantly, and different individuals have different personal feelings about the environment, a specific function is incorporated. The users can choose between auto adjustments and manual adjustments. When choosing the auto follow mode, the SUNSHADE will adjust the height of the curtain itself, keeping its user shaded. Alternatively, the user can turn on the manual adjustment mode, which allows them to choose from a range of options between completely closed and completely open by sliding a slide block. If the users find any problems with the device, such as mechanical malfunctions, they can use the report button in the top right corner. Staff will work on the feedback.
After the user has finished using SUNSHADE and plans to lock the device, he or she can click the “stop using” button at the bottom of the screen and enter the finishing interface. The finishing interface shows the exact locking time and the period of use.
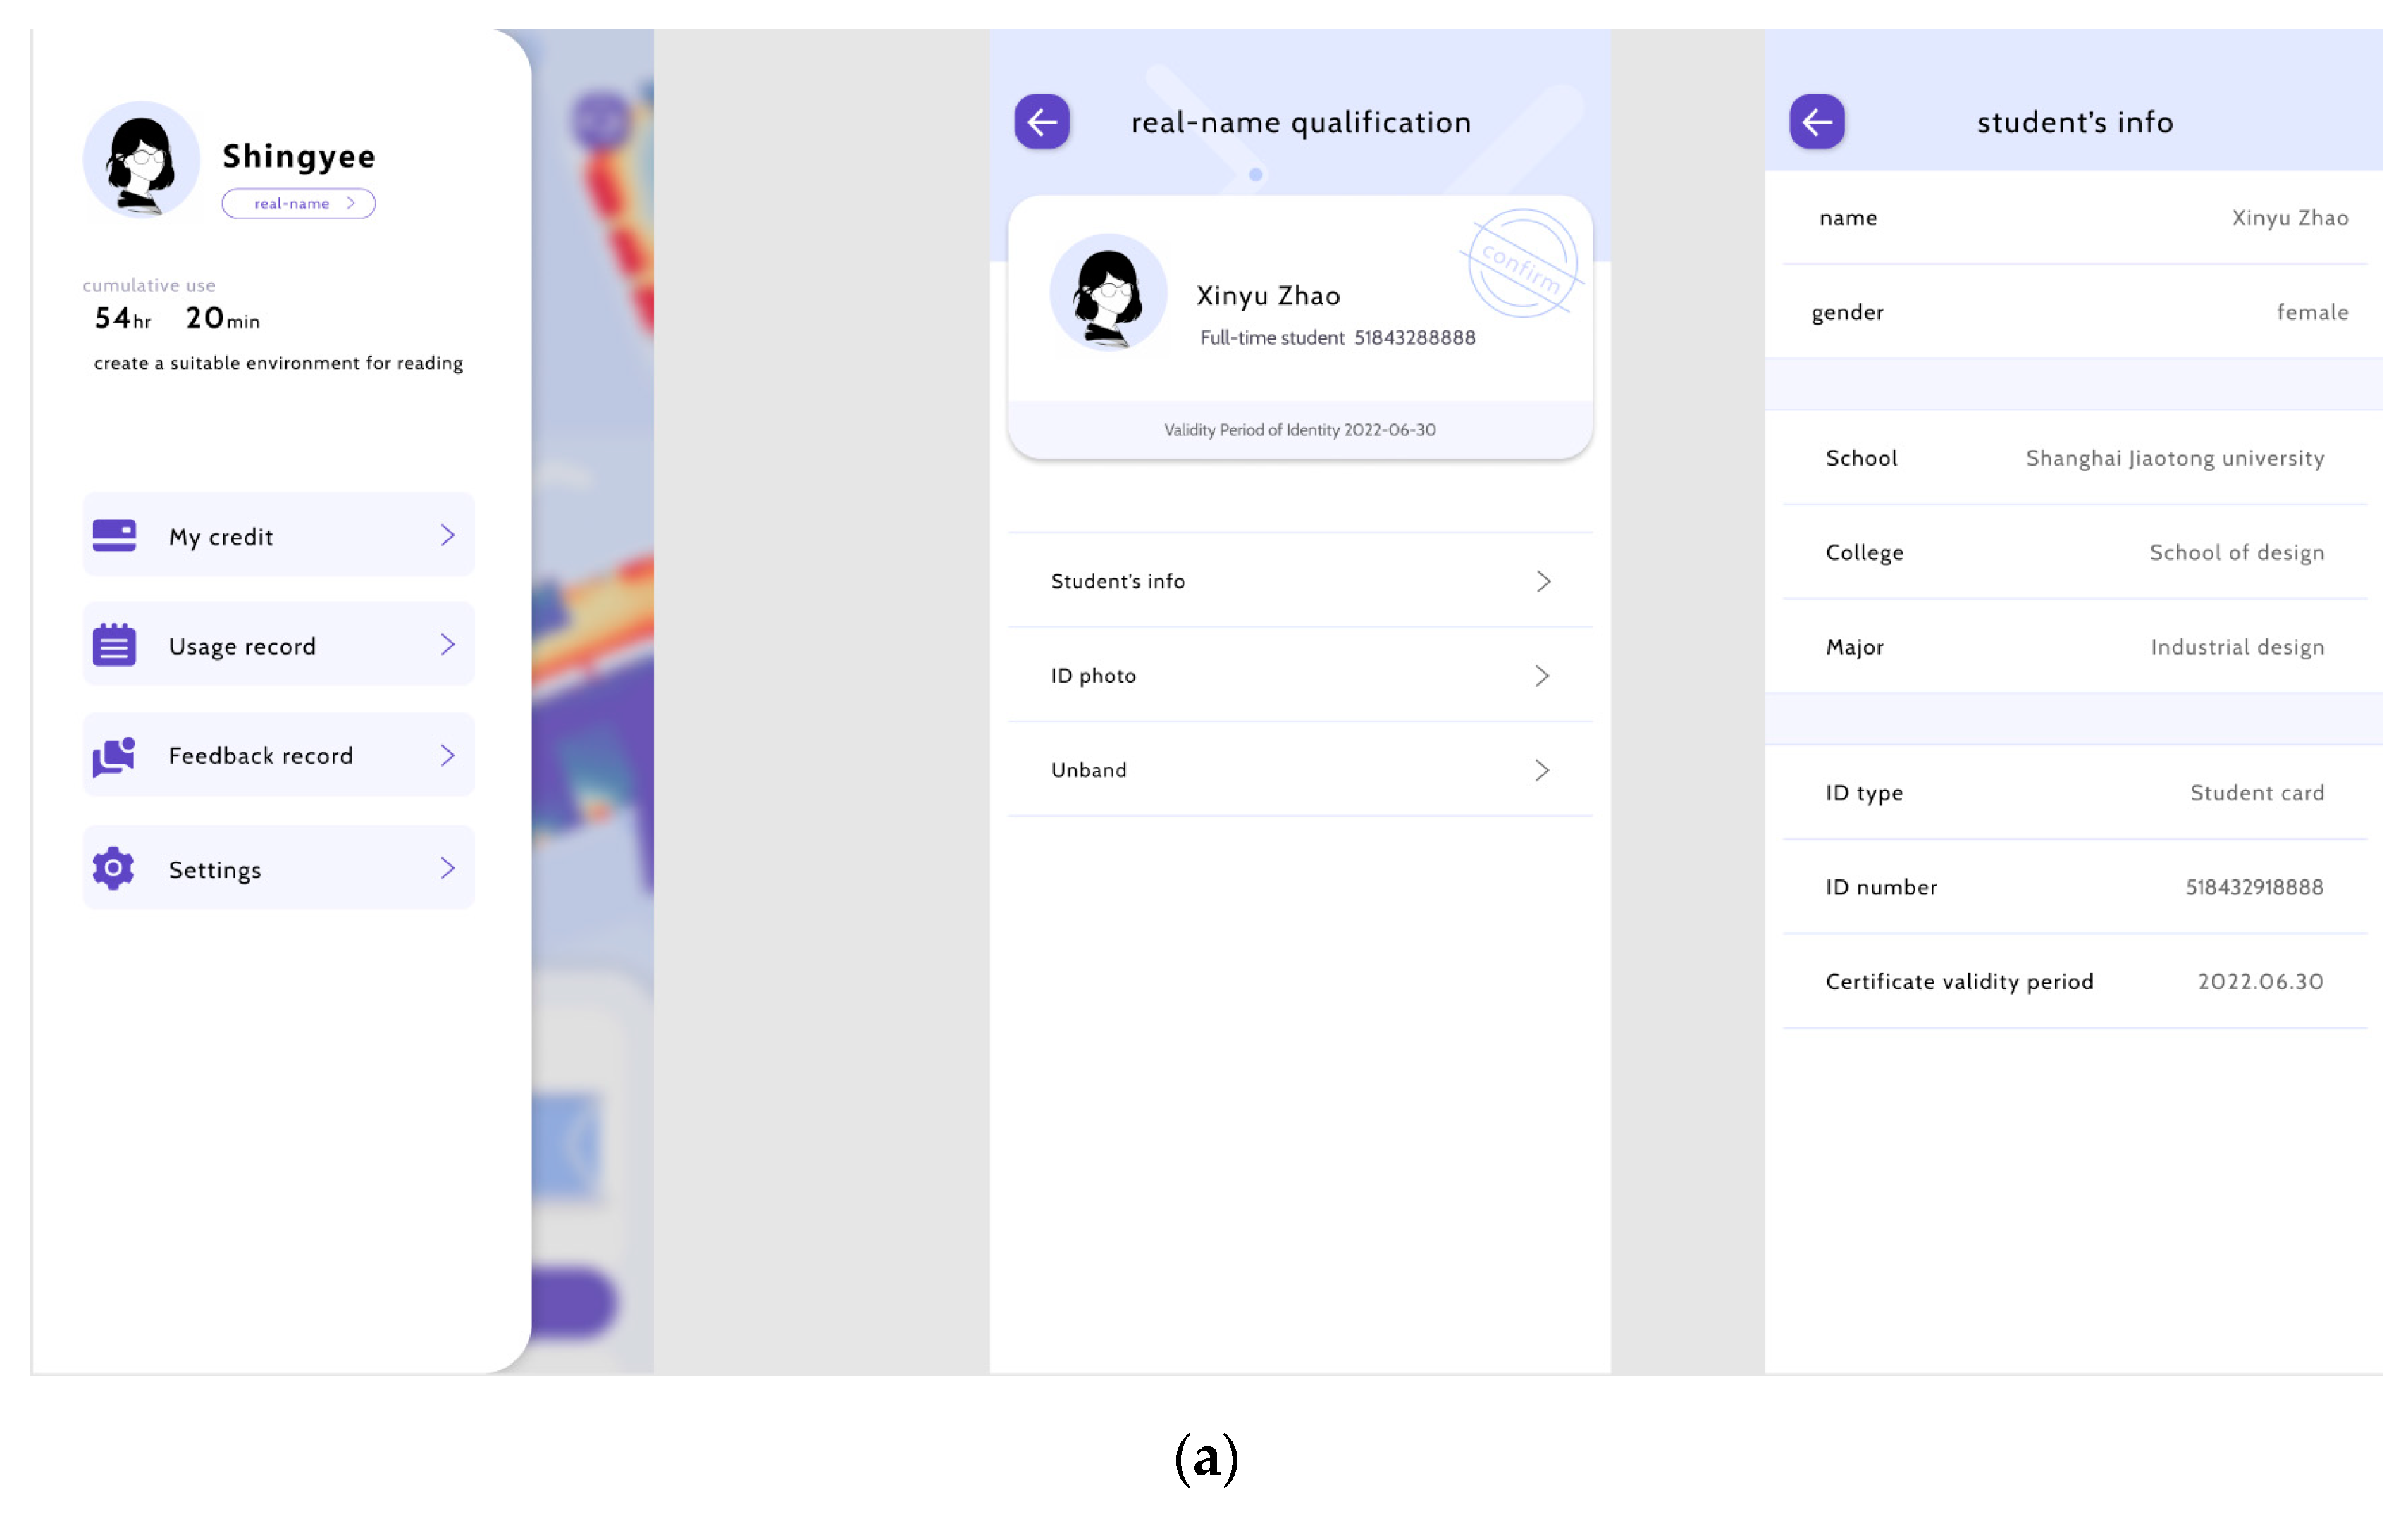
As shown in
Figure 8a, the user’s personal information interface is divided into four parts: “My credit”, “usage record”, “feedback record” and “settings”. We have also designed a real-name qualification section. Users can qualify themselves by entering their real name and identity number.
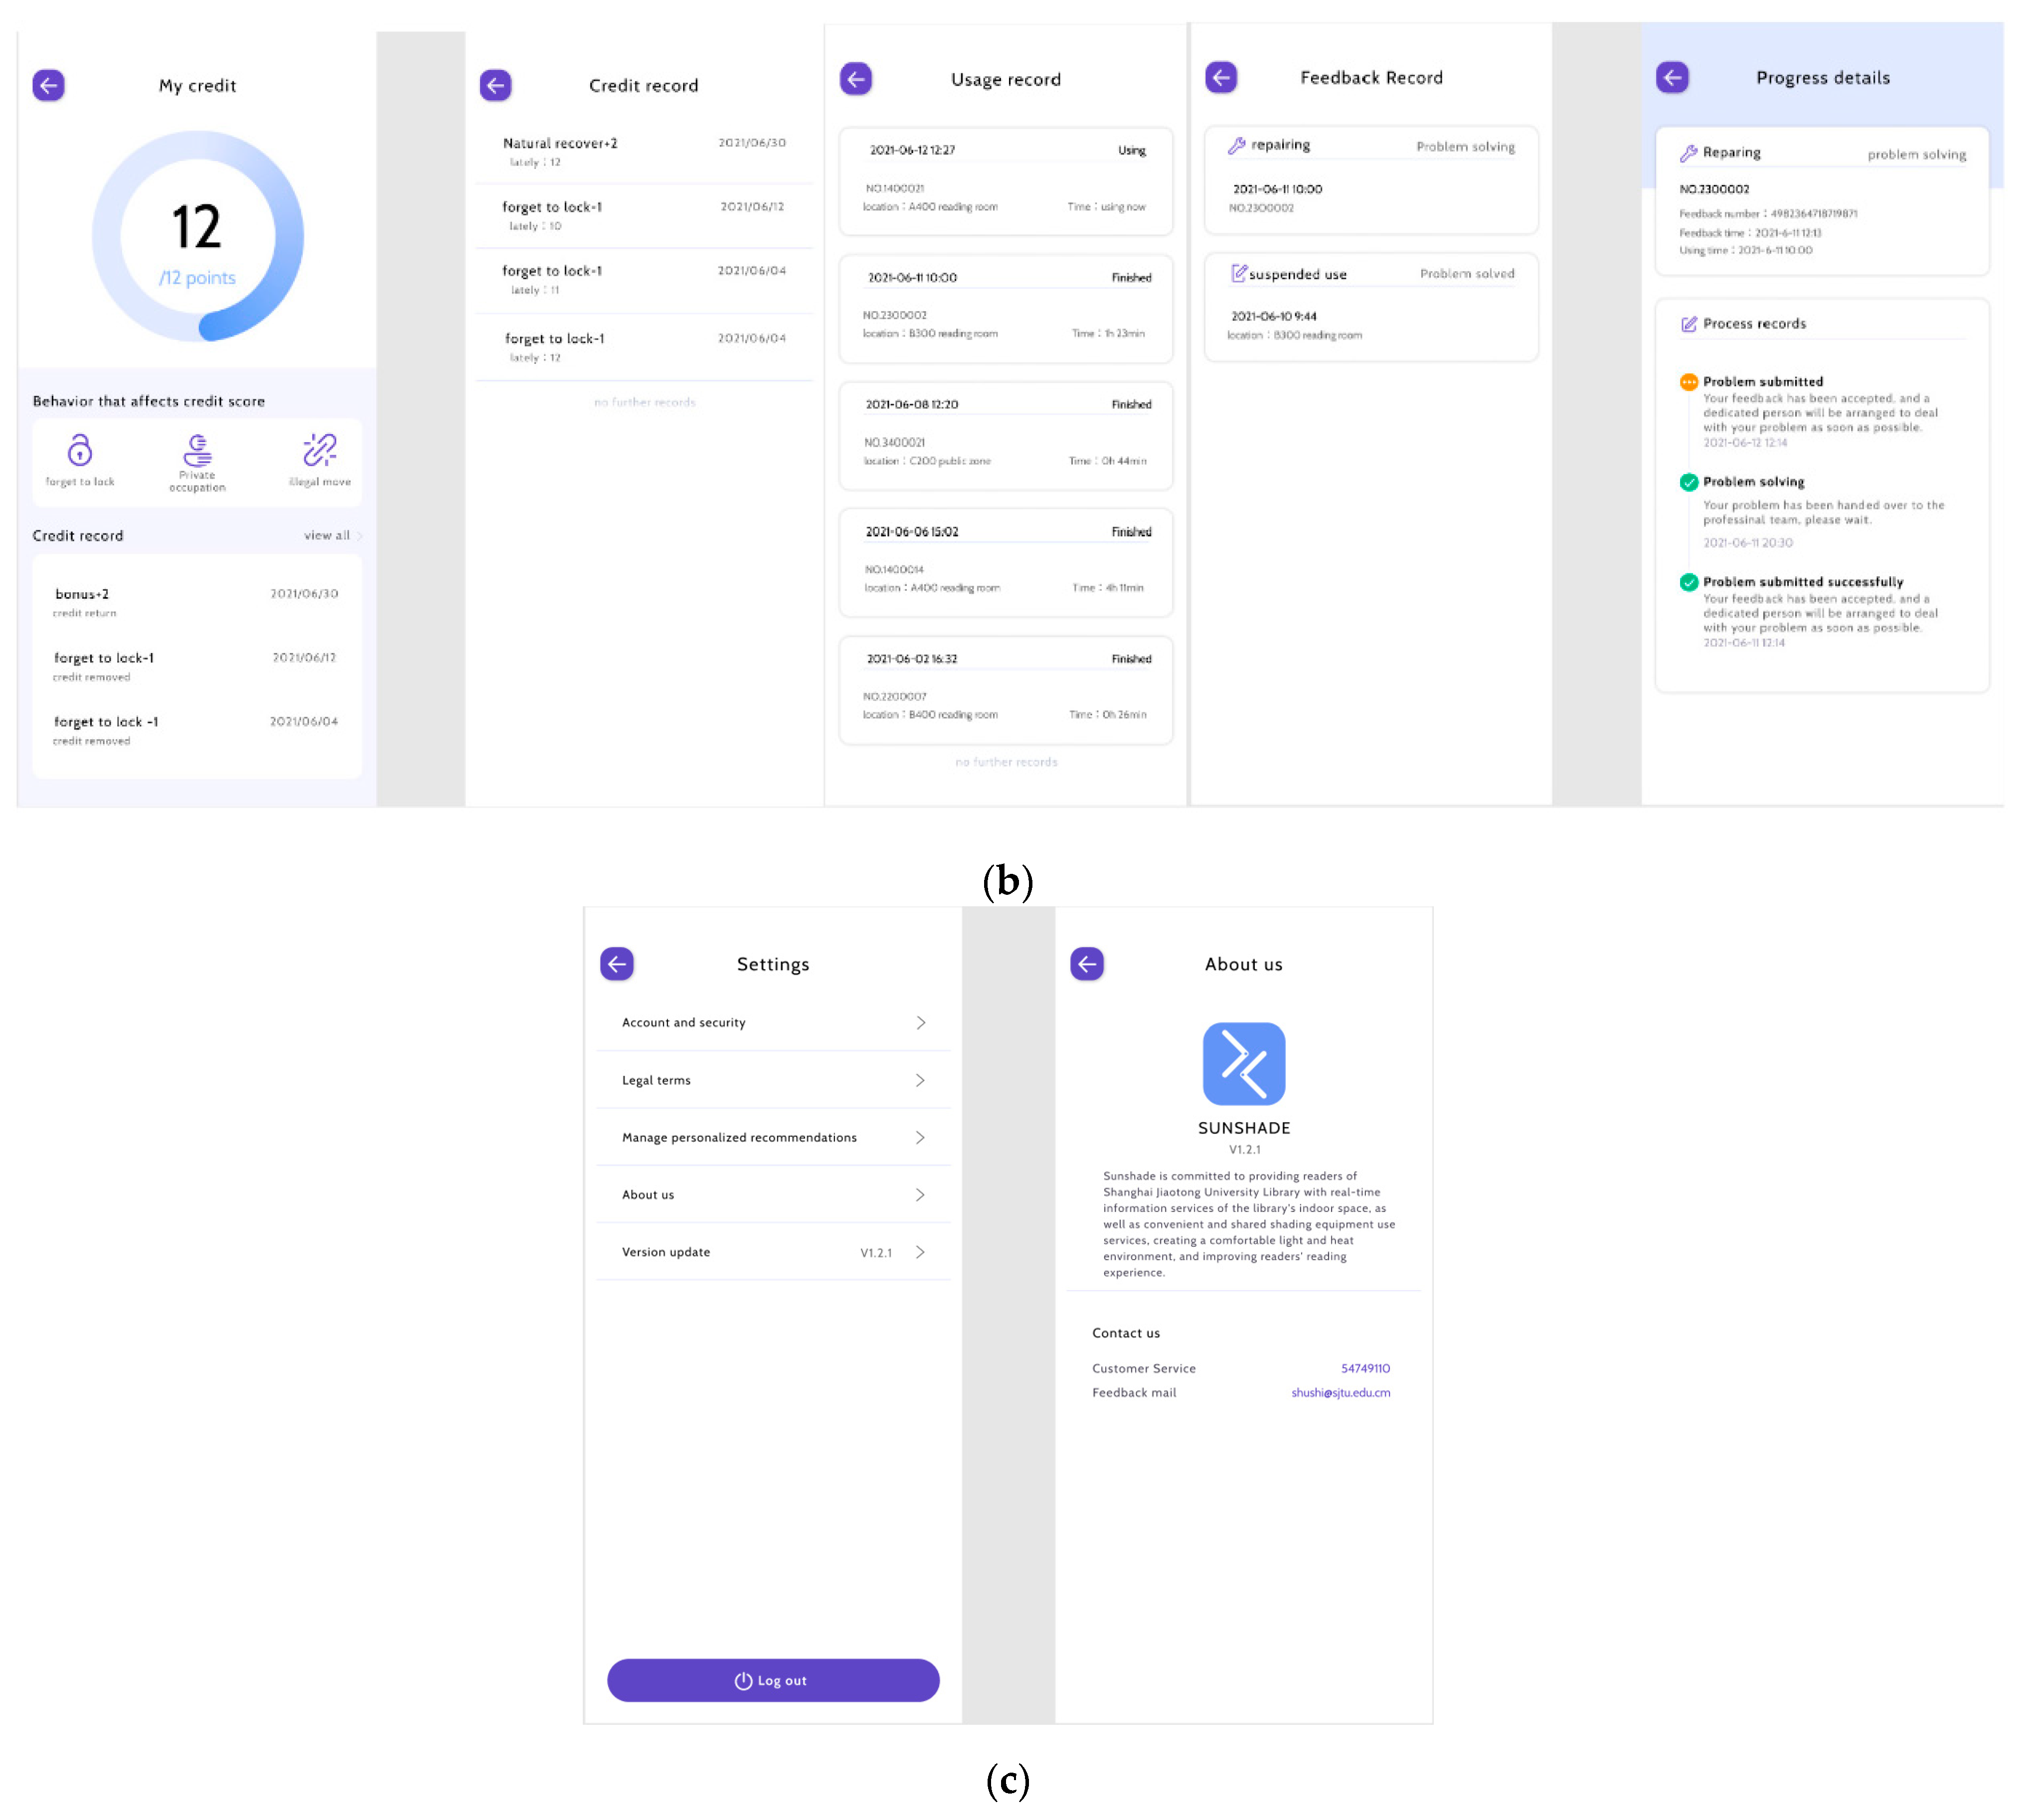
In the “My credit” part (see
Figure 8b), we have designed a credit system, including a 12-point credit record. When the user exhibits unfavourable behaviour, such as forgetting to lock the SUNSHADE after using it, one point will be removed. When the credit score is below zero, the user is qualified as unruly, and will be banned from using the SUNSHADE. After a certain period of time without unfavourable behaviour, the credit will naturally recover. In the “usage record” section, every time the user has used the SUNSHADE will be recorded and shown. The usage record includes the using location and duration. In the “feedback record” section, a feedback record is listed. Users’ feedback is shown. In the “settings” part (see
Figure 8c), five columns are shown, including “account and security”, “legal terms”, “manage personalized recommendations”, “about us” and “version update”. The version update section shows the latest version of the application and reminds the user to update the application whenever a new version is uploaded. The “about us” section shows details of the application and provides the contact number of the developers.
The user’s personal information interface is hidden on the left side of the screen, so it will not bother users during regular use. When the user needs to check his or her personal information or credit, a leftwards slide will call up the personal information interface.
6. Conclusions
According to former studies, as well as research conducted on the library environment and its users, we propose a smart design for a portable indoor shading device, used for light comfort. We make two major contributions in this work, as follows:
We conducted research based on the library’s light environment and users’ information, analysing via simulation and quantitative data, which has rarely been carried out before. As a result, we derived the exact pain points and deduced solutions.
We proposed a solution to the pain points by designing a new physical product. The product is designed in a new mechanical form. It uses internal sensors and a single-chip microcomputer to collect and process data, so it can adjust the shading mode itself. The corresponding mobile phone application provides a full system of use.
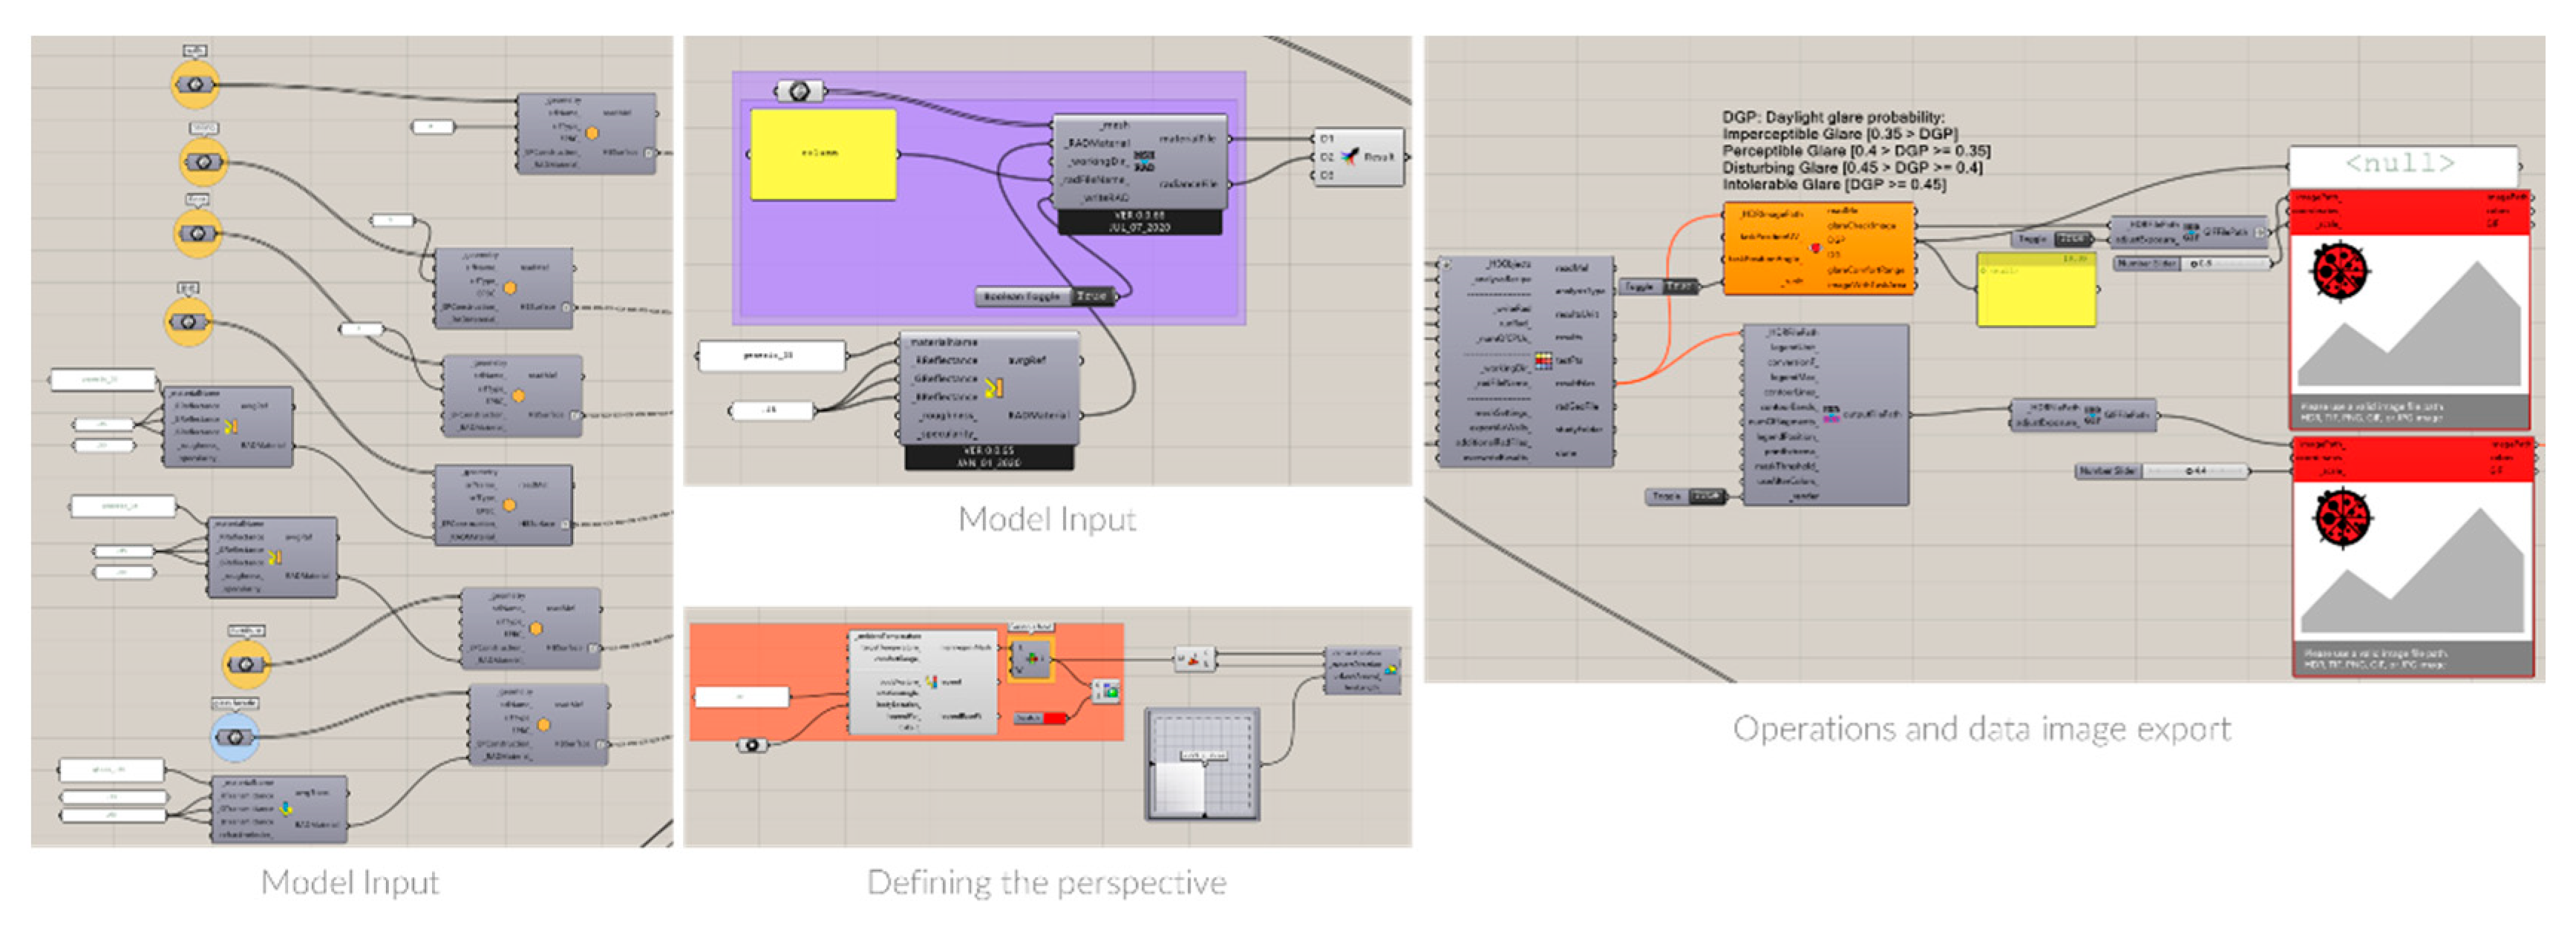
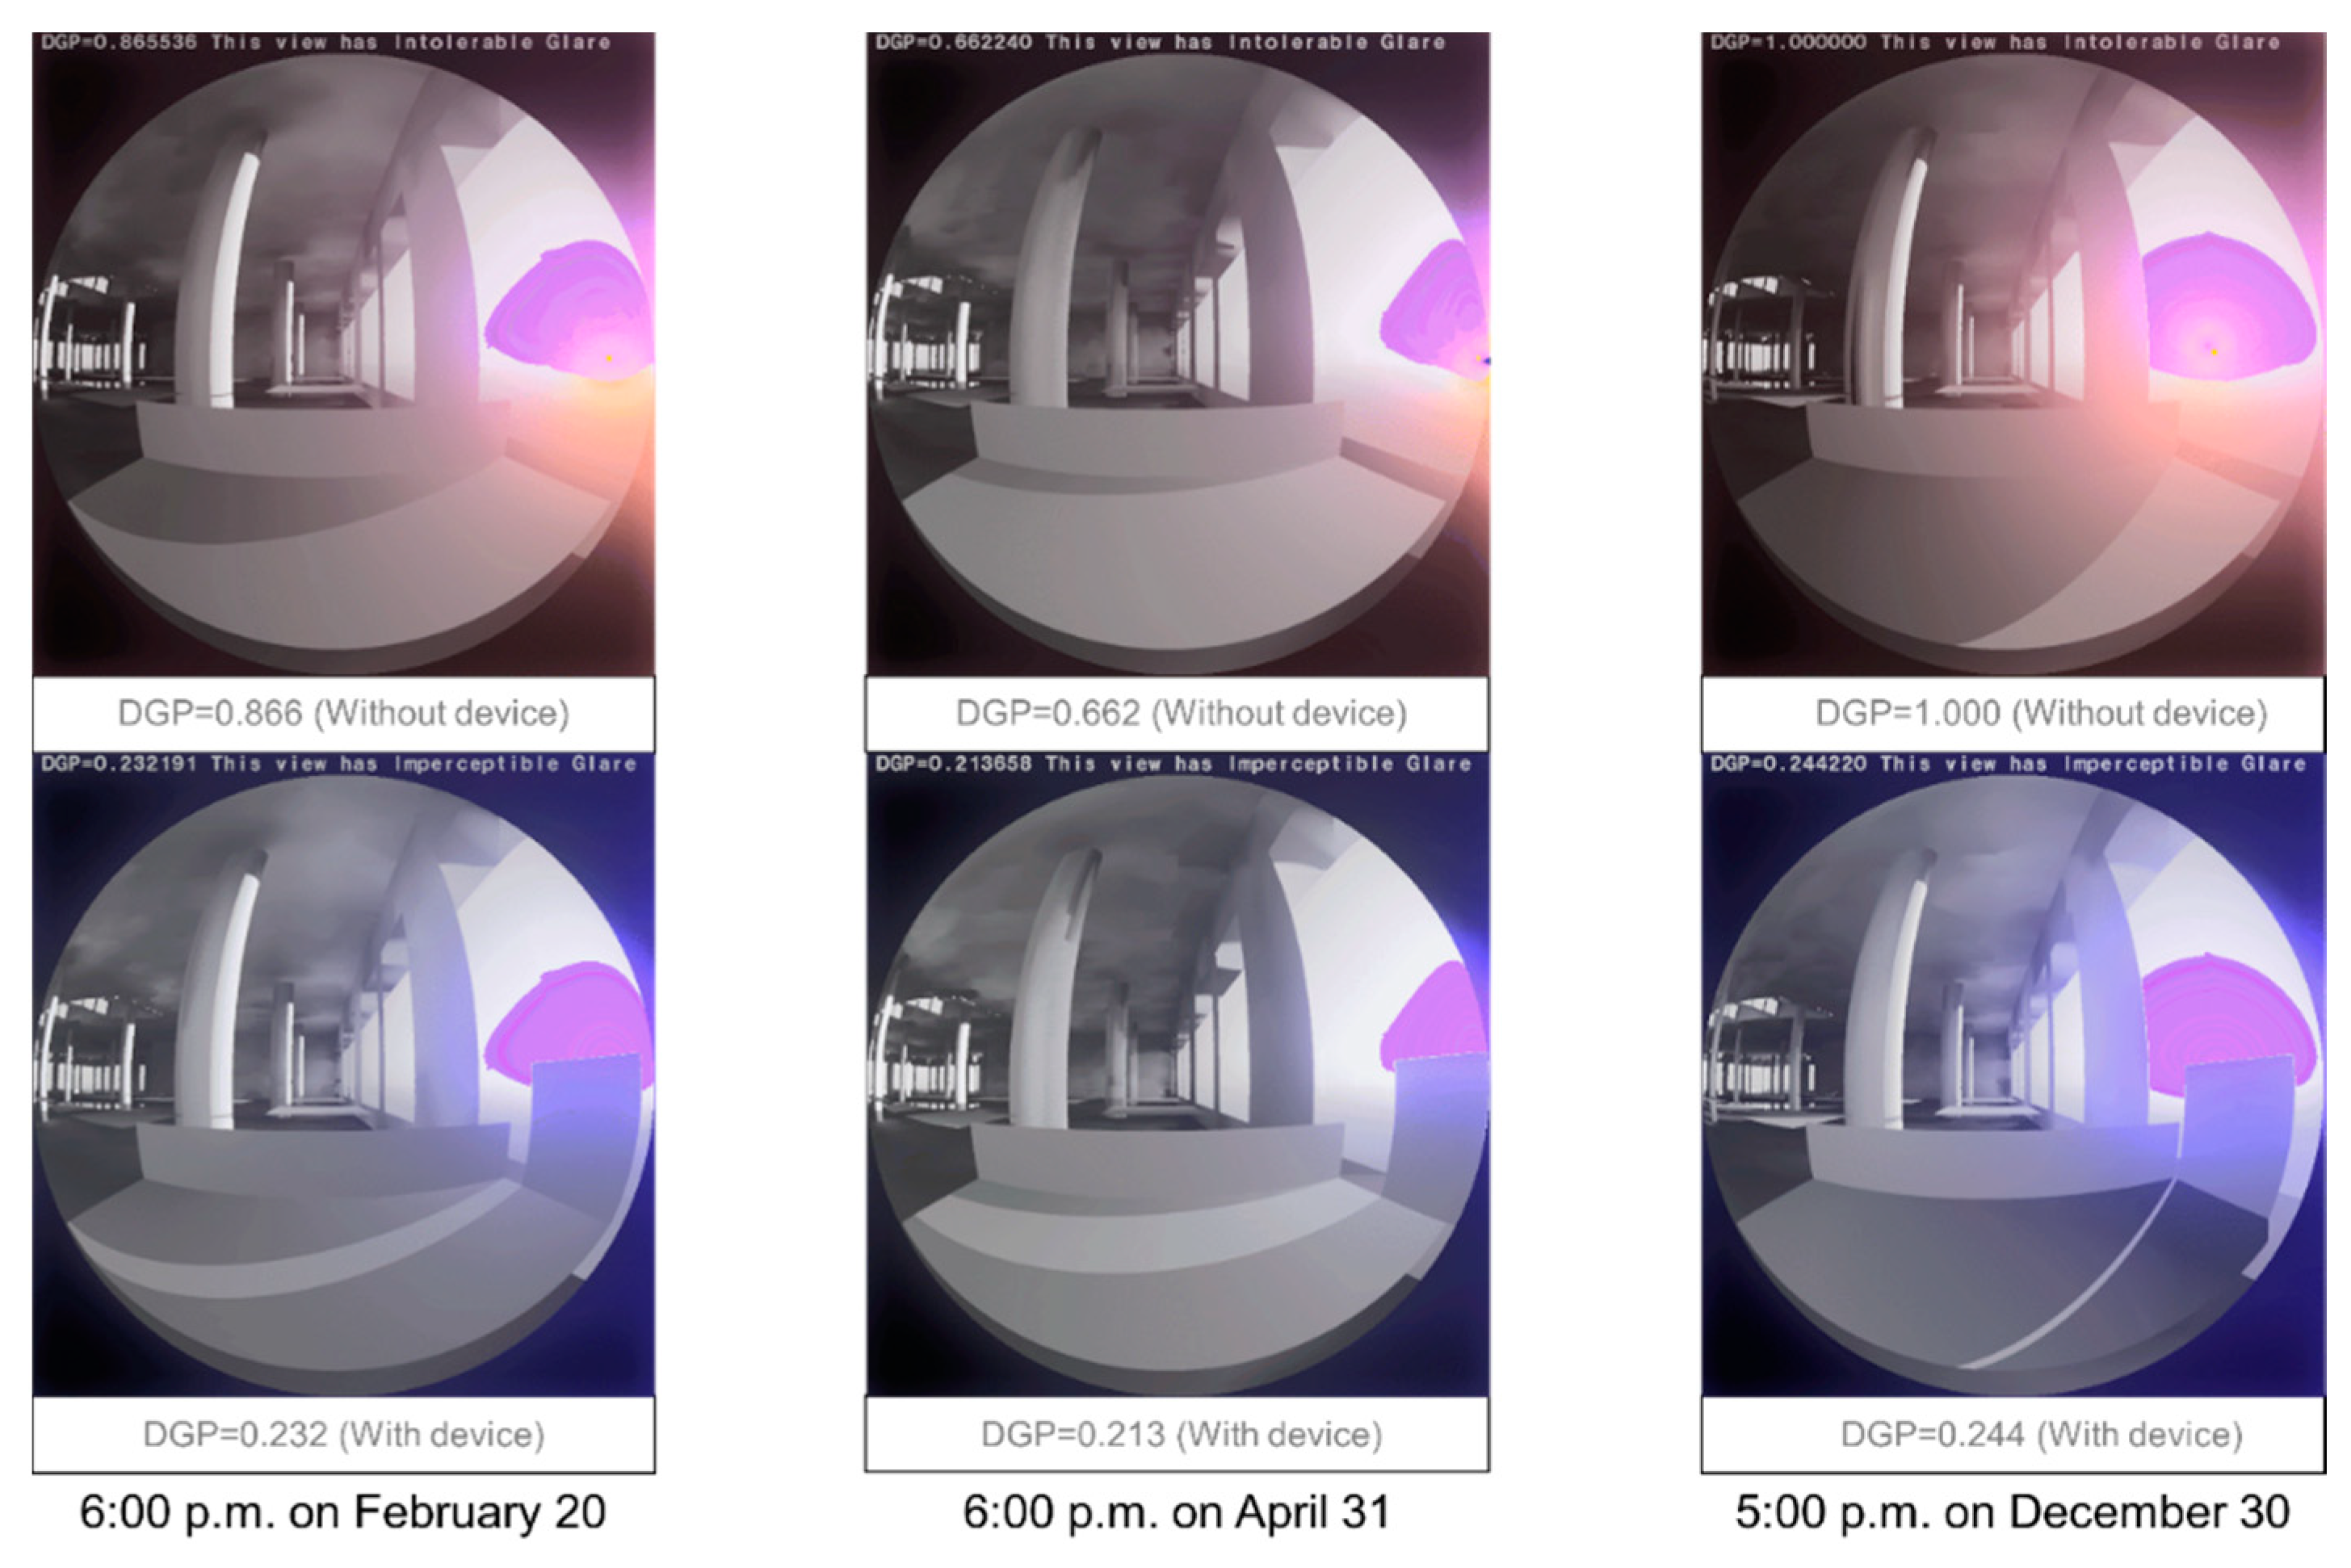
The simulation related to glaze shows that the proposed design obviously improved the light environment of the library. Furthermore, this design is able to build a network by sharing the collected data, meaning it can provide more insight for further optimization.
There are still some issues that require further research. First, availability tests could be conducted on the proposed design. Proper availability testing can identify more potential problems of the design, enabling it to be optimized. In addition, the further usability of the data collected by the proposed design remains to be assessed.


