Brief Report

Identifying Engineering Undergraduates’ Learning Style Profiles Using Machine Learning Techniques

by
Patricio Ramírez-Correa
1,*,
Jorge Alfaro-Pérez
1 and
Mauricio Gallardo
2
1
School of Engineering, Universidad Católica del Norte, Coquimbo 1781421, Chile
2
School of Business, Universidad Católica del Norte, Coquimbo 1781421, Chile
*
Author to whom correspondence should be addressed.
Appl. Sci. 2021, 11(22), 10505; https://doi.org/10.3390/app112210505
Submission received: 23 September 2021 / Revised: 9 October 2021 / Accepted: 1 November 2021 / Published: 9 November 2021
(This article belongs to the Special Issue AI in Education)

Abstract

:
In a hybrid university learning environment, the rapid identification of students’ learning styles seems to be essential to achieve complementarity between conventional face-to-face pedagogical strategies and the application of new strategies using virtual technologies. In this context, this research aims to generate a predictive model to detect undergraduates’ learning style profiles quickly. The methodological design consists of applying a k-means clustering algorithm to identify the students’ learning style profiles and a decision tree C4.5 algorithm to predict the student’s membership to the previously identified groups. A cluster sample design was used with Chilean engineering students. The research result is a predictive model that, with few questions, detects students’ profiles with an accuracy of 82.93%; this prediction enables a rapid adjustment of teaching methods in a hybrid learning environment.

1. Introduction

The COVID-19 pandemic has posed several challenges to higher education in teaching, learning, research collaboration and institutional governance [1]. Since it has been stated that the contexts in which learning occurs are crucial [2], one central research focus is examining and analysing learning styles in this new setting. This effort is even more critical given that the first reports about education in this new context indicate that the most frequent barrier is the difficulty in adjusting learning styles [3].
There are countless ways people process information from the environment, and individuals exhibit specific behaviours that allow them to learn efficiently [4]. They prefer interaction, assimilation, and information processing methods. This natural disposition or preference of the individual to learn and study is known as a learning style [5]. Since there are many learning styles among different individuals, it is a challenging task to determine and predict the learning style of an individual student. According to these ideas, adopting a standard pedagogy method is not appropriate to improve learning for all students. Therefore, it is essential to devise and adopt different pedagogies for different types of learners.
Universities in a pandemic face a hybrid teaching environment. The literature suggests that hybrid learning offers many benefits to students and faculties [6]. Nevertheless, this environment regularly changes scenarios and actors. Thus, the rapid identification of the learning styles of participants appears to be fundamental to achieving complementarity between traditional teaching and the application of new technologies. However, the extension of the existing learning style measurement instruments in the literature limits this rapid detection. In this context, is it possible to quickly detect the learning styles of university students of engineering? This question establishes the research problem for this study.
This study proposes developing a predictive model that identifies learning styles using analytical techniques. In the vein of a study that applied machine learning to reduce data capture times [7], our research is in line with works that reduce scales of learning styles [8,9,10]; however, we have advanced towards predicting a student profile associated with a learning style. The main practical contribution of this study to teaching in higher education is to allow administrators and educators to adopt different pedagogies for different groups of students quickly, improving students’ academic results. Additionally, obtaining data on the learning styles of university students in the context of the pandemic in a developing country contributes to the generation of knowledge about this phenomenon for organisations and academics interested in higher education in the world.
In particular, the objective of this study is to generate a predictive model to detect undergraduates’ learning style profiles quickly for making recommendations to teachers and managers to improve learning outcomes.
To achieve this objective, we proceed as follows. First, the following section describes the study background, including student learning profiles, student learning styles, and predictive analysis with decision trees. In the next section, the materials and methods are defined. Then, the results of the analyses are shown. Finally, the findings are discussed, limitations and future research lines are given, and conclusions are presented.

2. Background

2.1. Student Learning Profiles

Student learning profile refers to the preferred mode of learning as individuals. As a general consideration, the student obtains better results if tasks match with their skill and understanding (readiness), promote curiosity or passions (interest), and if the assignment fits their preferred learning profile [11]. Four overlapping categories of learning profile factors can be used to design a curriculum that fits students: group orientation, learning environment, cognitive style, and intelligence preferences [12]. Learning profiles have been studied from different perspectives and conditions. Specifically, student learning profiles have been studied in STEM education. At the K-12 level, [13] explored children’s preference profiles on tangible and graphical robot programming, showing that student preference profiles are related to gender and age for both interfaces. At the undergraduate level, [14] examined the relationships between study-related burnout, learning profiles, study progressions, and study success. This research shows that learning profiles affect study-related burnout in higher education. Likewise, [15] studied academic performance prediction based on learning profiles in blended learning. Their results show that student learning profiles consisting of four online factors and three traditional factors have the highest predictive power of academic performance.

2.2. Student Learning Styles

Researchers agree that understanding student learning styles is a keystone for tailoring the teaching process, improving the satisfaction of educational needs, and enhancing learning experiences, especially in learning environments [16]. From a general point of view, since learning style is a component of the broader concept of personality [2], it may be related to specific personality traits. The Five-Factor Model has been widely used in the literature to measure personality traits. The FFM proposes five traits that capture the core domains of personality: conscientiousness, agreeableness, extraversion, neuroticism, and openness. Some studies have reviewed the relationship between psychological traits and the teaching–learning process. For example, [17] studied the predictive capacity of personality traits for teacher teaching styles in the Republic of China. The results indicate that personality traits contributed to the teaching styles of teachers beyond their gender, level of education, and perception of the quality of their students. On the other hand, the relationship between learning style and learners’ personality was examined by [18]. This study reported that extroverted students tend to have an accommodative learning style. Finally, the concomitance between learning styles and psychological traits to explain learning to read English by Iranian students has been reported [19]. From a narrow point of view, the study of learning styles has generated considerable interest over the past three decades, leading to various models of learning styles based on how the learners adapt to multiple dimensions related to information reception and processing [5]. A review described 71 taxonomies of learning styles proposed in the literature [20].
The Felder–Silverman model is well-recognised in education [5,21]. In this model, learning styles refer to different strengths and preferences in acquiring and processing information [5]. We chose the Felder–Silverman model for this study due to two reasons. First, the model is widely accepted in engineering education [22]. Second, the measured scale of the model is reliable, valid, and suitable for engineering students [5,22].
The Felder–Silverman model classifies students by responding to four questions: What type of information does the learner preferentially perceive: sensory or intuitive? What type of sensory information is most effectively perceived: visual or verbal? How does the learner prefer to process information: actively or reflectively? How is the learner progressing in terms of sequential or overall comprehension? According to the answers, the learners are classified into four dimensions:
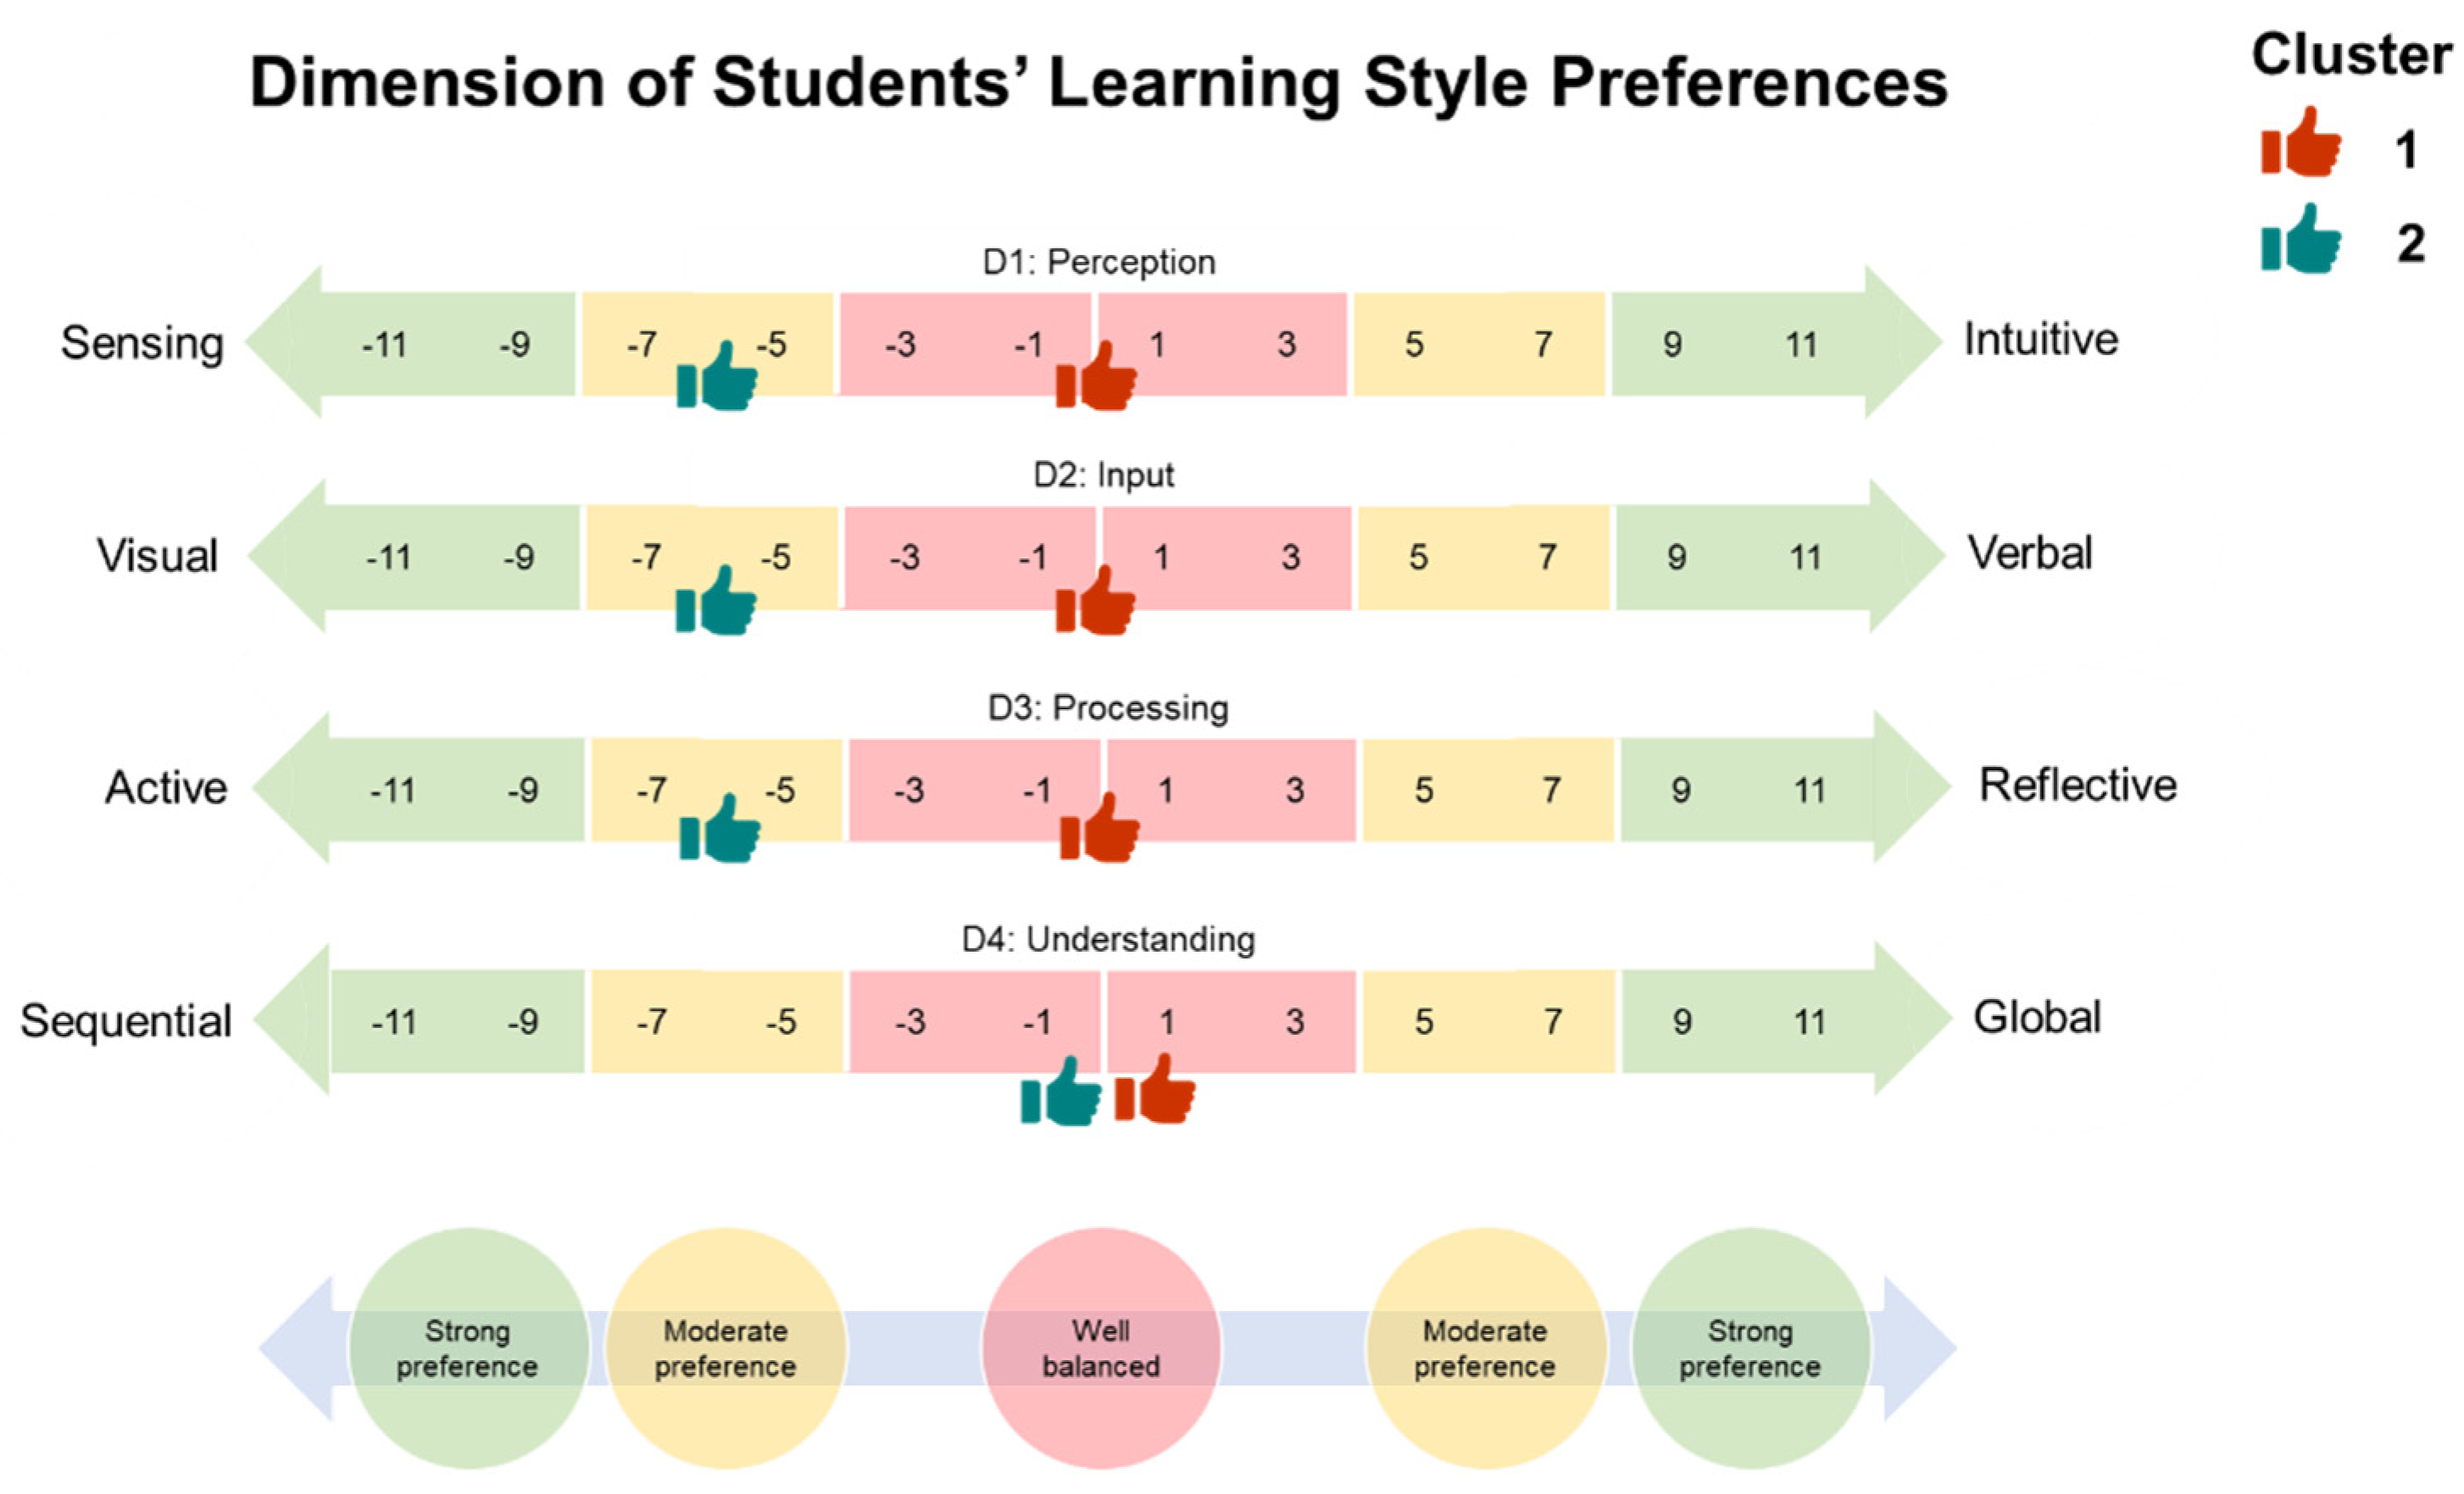
  • D1—Perception: sensing (concrete thinker, practical, oriented towards facts and procedures) or intuitive (abstract thinker, innovative, oriented towards theories and underlying meanings).
  • D2—Input: visual (learners prefer visual representations of material presented, such as pictures, diagrams, and flow charts) or verbal (learners prefer written and spoken explanations).
  • D3—Processing: active (learners prefer to learn by trying things out, enjoy working in groups) or reflective (learners prefer to learn by thinking things through, such as working alone or with a single familiar partner).
  • D4—Understanding: sequential (learners prefer to learn using a linear thinking process, learn in small incremental steps) or global (learners prefer to learn using a holistic thinking process, learn in giant leaps).
The Felder–Silverman model is operationalised by The Index of Learning Styles (ILS). The ILS is a 44-item questionnaire designed to evaluate preferences across the four dimensions of the Felder–Silverman model (active/reflective, sensing/intuitive, visual/verbal, and sequential/global). The Index of Learning Styles exposes an extensive application and formal validation [21]. For example, in management information systems, [23] studied the moderating impact of learning styles on the success of learning management systems using the Felder–Silverman model. Their results show that it is possible to improve the model performance through context-dependent moderators. Likewise, [24] studied preferred learning styles in an extensive undergraduate anatomy course (2,300 students). Their results suggest that anatomy students possess the predominant learning style dimensions seen in other STEM curricula.

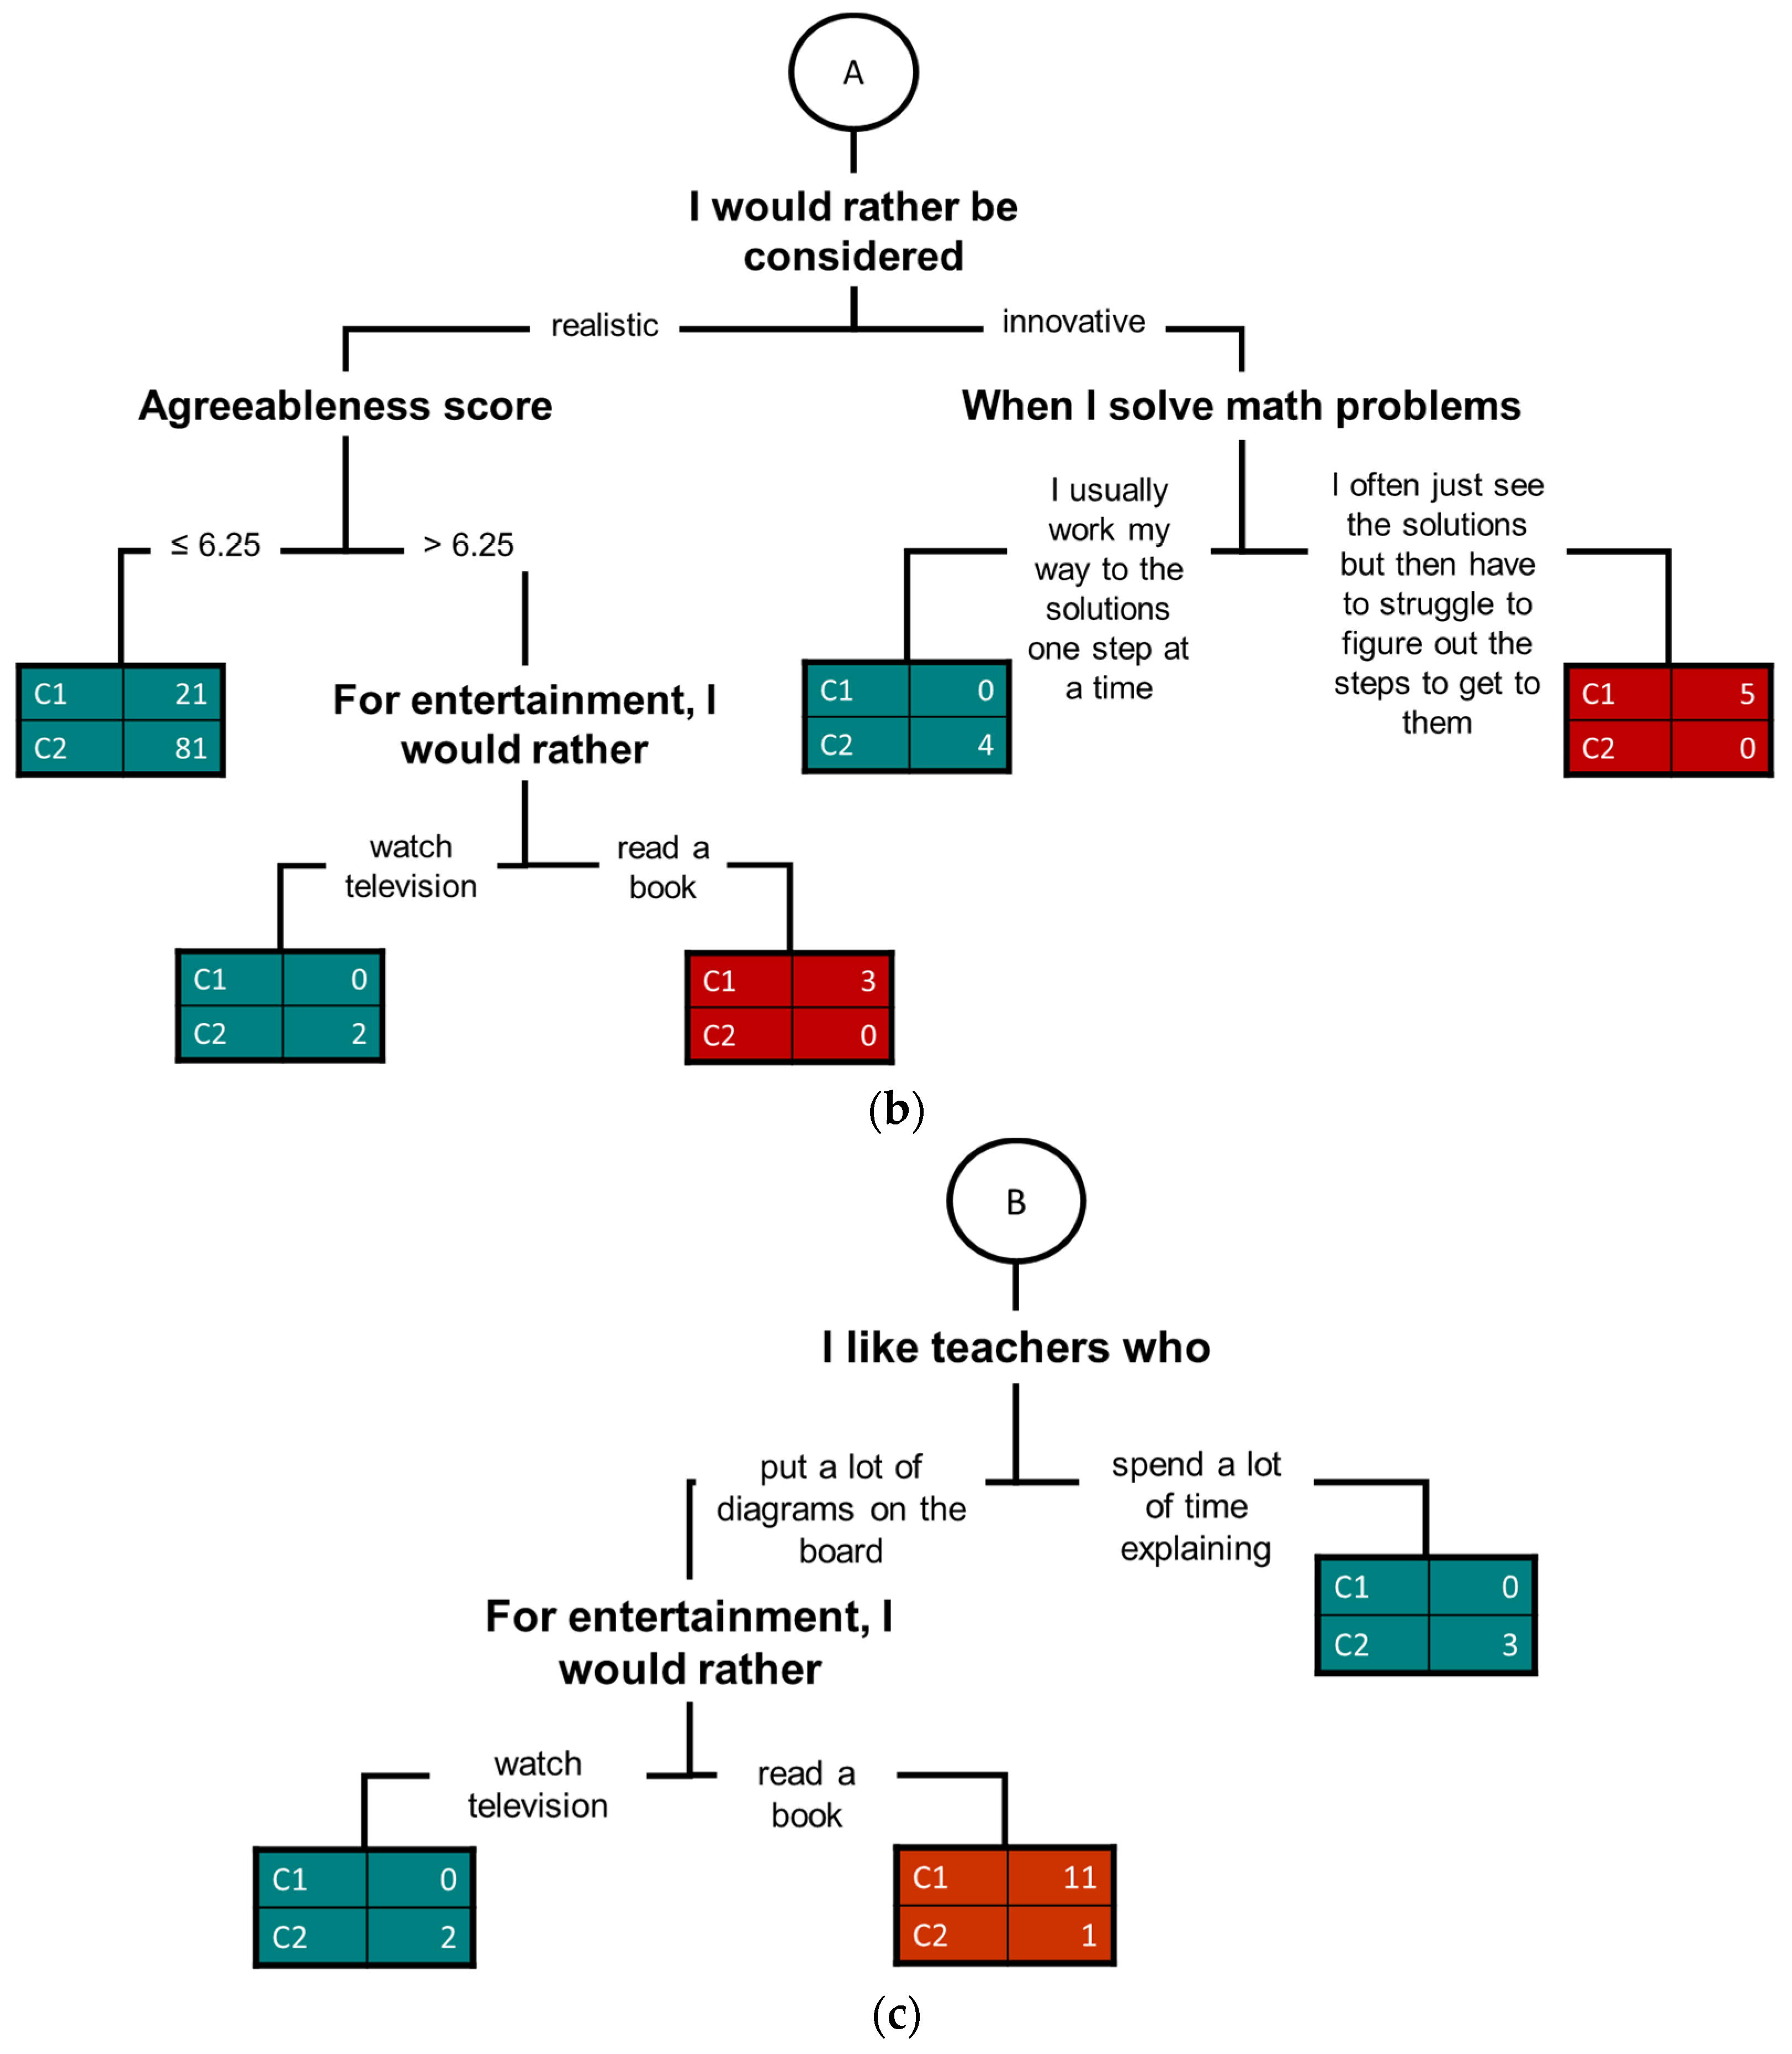
2.3. Predictive Analysis with Decision Trees

A decision tree identifies a model that best fits the relationship between the attribute set and the class label of the input data. Specifically, decision trees have a hierarchical structure composed of a group of internal nodes and leaf nodes that classify a set of data by categorising them from the root node to some leaf node. Each internal node in the tree specifies a test condition that evaluates one or more attributes. Each descendant branch of the tree represents a sequence of decisions made by the model to determine the class membership of a new unclassified entity.
Unlike other classification models considered black boxes, decision trees are white-box models that allows someone to see why the model classifies in one way or another or to argue such a classification.
Different techniques have been developed to induce decision trees in the machine learning community. One of the pioneering works came from Quinlan with the ID3 algorithm [25]. This algorithm generates decision trees based on the information obtained from training examples and then uses them to classify the test set. The dataset generally has nominal attributes to perform the classification task with non-missing values.
The C4.5 algorithm is an extension of the ID3 algorithm Quinlan introduced to improve certain deficiencies [26]. Since it was not intended for numerical attributes and did not use pruning to reduce overtraining, the C4.5 algorithm uses a new calculation that allows the measuring of a gain ratio. It also handles attributes with continuous values. Finally, C4.5 employs a pruning technique to reduce the error rate. This technique reduces the size of the tree by removing sections that may be based on erroneous or missing data, thus reducing the complexity of the tree and improving its classification power.
There are several advantages in using decision trees [27]. First, the graphical representation of decision trees is intuitive when there are a reasonable number of nodes for users unfamiliar with the subject. In general, this favours transparency and decision making between professionals from different areas. Second, decision trees, unlike other techniques, are helpful for regression and classification problems. Third, the algorithms for creating decision trees are very flexible with the data. They can handle nominal, ordinal, and numeric data. Additionally, many of these algorithms can take missing and even errored values, which is useful for saving time in the data-cleaning process.
On the other hand, using decision trees also has its disadvantages. First, the tree can become complex when the data include nominal variables with many categories or several numerical variables. As a result, it tends to overfit the data with which it was trained. However, techniques such as pruning and setting growth limits solve this problem. Second, they are sensitive to irrelevant characteristics and variability in the data. Slight variations in the data can result in a completely different tree. Cross-validation procedures are used to avoid this problem. Finally, the process of building a decision tree can take a significant amount of time. This issue usually happens when there are many characteristics of each observation due to the algorithms in each iteration that compare which best divides the data.

3. Materials and Methods

3.1. Scales and Attributes

The measurement scales of this study have been extensively tested in previous research [5]. The ILS was used to measure learning styles. Additionally, we used the FFM to measure the students’ personalities. The FFM was implemented through the Spanish translation of the Ten-Item Personality Inventory [28]. In particular, [28] validated the Ten-Item Personality Inventory in the Spanish language in a sample of 1,181 Spanish adults. Overall, [28] reported that the scale exhibited acceptable psychometric properties for measuring the FFM in terms of reliability, agreement, factor structure, and convergence with the traditional scale.
Finally, based on the previous literature [29,30,31], we develop a list of the possible attributes related to the learning style: gender, age, learning style in which the student is proficient, academic performance, use of social networking sites, and previous technical education. The learning style in which the student perceives himself or herself to be proficient was directly consulted through a single question based on a previous study [29].

3.2. Data

For the empirical study, a cluster sampling design was used to gather the data of Chilean engineering students. Two control variables were employed to define the cluster sampling: academic programmes (industrial engineering, computer engineering, and information technology engineering) and the level of the courses (five levels). We selected these two cluster variables because they are the two relevant institutional characteristics that reflect the distribution of students in the target population.
The data were obtained through an online questionnaire for students belonging to an engineering school in Coquimbo (Chile). The survey was conducted in August 2021. All the participants gave their notified consent before they contributed to the study. The research was conducted following the Declaration of Helsinki. The protocol was approved by the Ethics Committee of the Universidad Católica del Norte (Resolution No. 21of 22 June 2021), guaranteeing the safeguard of the ethical principles for research declared by the committee. A total of 268 surveys were completed for the study. Most of the completed surveys were finished by males (74 per cent), and the average age was 20.9 years old. Regarding the academic background of the study’s participants, 34.8 per cent were from the computer engineering major (93 students), 49.6 per cent from the industrial engineering major (133 students), and the remaining percentage from the information technology engineering major (42 students). Seventy-two students were from year 1, 69 from year 2, 39 from year 3, 51 from year 4, and 37 from year 5. The median of these students’ grades was between 5 to 5.5, on a scale of 1 to 7 being seven the maximum. See Table 1 for other details regarding the distribution of the sample according to some variables of interest. The scatter diagram in Figure 1 shows the relationship between gender-separated personality traits.

4. Results

4.1. Cluster Analysis

Following the proposal of [32], we used a k-means clustering algorithm to categorise students based on their style learning preferences. Table 2 and Figure 2 show the cluster analysis results. This method identified two clusters when optimised concerning the silhouette value. We used the average silhouette method to determine the number of clusters. This approach assesses the quality of clustering by determining the extent to which each object resides in its cluster. An elevated average silhouette width indicates a good clustering. This method calculates the average silhouette of the observations at different values of k. The optimum number of k clusters maximises the average silhouette over a range of possible values for k [33]. Figure 3 shows the clusters concerning the dimension of students’ learning style preferences graphically.
Cluster 1 is the largest and corresponds to 56.4% of the sample. In this cluster, regarding learning style, students have higher Z-scores in all the dimensions and a well-balanced preference in the dimensions of perception, input, processing, and understanding between sensing–intuitive, visual–verbal, active–reflective, and sequential–global poles, respectively. The dimension with the lowest mean in this cluster is perception.
Cluster 2 is the smallest in size and corresponds to 43.6% of the sample. In this cluster, regarding learning style, students have a moderate preference in the dimensions of perception, input, and processing to sensing, visual, and active poles, respectively. Additionally, students have a well-balanced preference in the dimension of understanding between sequential and global poles. Similar to Cluster 1, the dimension with the lowest mean in this cluster is perception.
In qualitative terms, these results indicate that Cluster 1 is characterised by being more intuitive, verbal, reflective, and global in the learning profile. Cluster 2, in contrast, is typified by being more sensitive, active, and sequential in the learning profile.

4.2. Predictive Analysis

The prediction of the cluster associated with preferences of learning was conducted using decision trees. Specifically, we employed the C4.5 algorithm in this study [26], making decision trees from training data collection using information criteria. In addition, we used a grid optimisation strategy to set the parameters. This procedure indicated accuracy as division criteria and a maximum depth of nine.
Furthermore, to avoid overfitting, the analysis was performed using a 10-fold cross-validation with a training sample of 85%; the remaining sample of 15% was reserved to test the model with unseen data.
Lastly, the two-class criteria measured the performance prediction: sensitivity = TP/(TP + FN), specificity = TN/(TN + FP), precision = TP/(TP + FP), and accuracy = (TP + TN)/(TP + FP + FN + TN); where TP is a true positive, TN is a true negative, FP is a false positive, and FN is a false negative.
The prediction outcomes in Table 3 reveal that the method performs well regarding selecting the cases that need to be chosen, with an accuracy of 72.20 ± 8.82%. In addition, the prediction outcomes in Table 4 reveal that the method performs well regarding selecting the cases of unseen data that need to be chosen, with an accuracy of 82.93%. Figure 4a–c shows the decision tree model.

5. Discussion

This paper generated a model to detect undergraduates’ profiles based on swift learning styles. A machine learning process founded on a C4.5 algorithm generates a predictive model to classify students into two profiles. The two student learning style profiles were previously obtained from k-means clustering analysis. The result of two distinct learning style profiles is a remarkable finding: both tend towards the sensing, visual, and active poles. This fact is consistent with the literature of both engineering students [34] and students of other disciplines [35,36]. In a sample of Chilean engineering students, [23] found that most of the students were oriented to the sensing (84 per cent), visual (76 per cent), and active (70 per cent) poles. In a sample from a university in Mexico, [37] reported that engineering students tended towards the sensing (82 per cent), visual (90 per cent), and active (67 per cent) poles. As well, in a sample of manufacturing engineering students in Ireland, [38] found a bias towards the sensing (78 per cent), visual (per cent), and active (70 per cent) poles. In undergraduate business students, [35] reported that these learners tended toward the sensory (70 per cent), visual (68 per cent), and active (64 per cent) poles. Finally, a study by [39] discovered among industrial engineering students in Brazil the trend towards sensing (70 per cent), visual (73 per cent), and active (66 per cent) poles. Although there is the recent proposal of [32], we do not find student cluster reports associated with their learning styles based on the ILS, hence the importance of these results.
Although our study is in the line of works to reduce the scale of learning styles [8,9,10], these research findings distinguish an engineering student profile using a few questions of the ILS. Furthermore, the results suggest that attributes such as gender, age, academic performance, previous education, behaviour in social networks, perception of preferences to learn, or psychological traits are not appropriate to predict the student’s profile. The exception is agreeableness; this trait discriminates between the clusters.
In particular, the results indicate that the model’s predictive capacity is good (82.93%). Additionally, we highlight the rapidity of application due to this being essential in a hybrid environment: the model classifies 65% of students with no more than five questions, respectively. This decision tree model is the basis for the design of a computerised survey system for rapid discrimination.
Two limitations of this study should be stated. First, the analysis was conducted on a relatively small sample in one unit, which does not directly extrapolate the results. Second, a limited set of student attributes was used to predict their learning style profile, and, as a result, other attributes may predict this profile with greater accuracy.
Future studies should go three ways. First, to extend the analysis to a more significant sample. Second, to explore in other samples of engineering students in emerging economies the two profiles discovered in this investigation. Third, using new student attributes to predict their learning style profile, including personal values.

6. Conclusions

This study proposes an alternative to rapidly detect the learning styles of university students in a changing environment, such as hybrid teaching in the pandemic. The results indicate that based on a decision tree model, it is possible to determine, in a couple of questions and with acceptable performance, the profile of the students in a hybrid teaching activity. Moreover, this prediction enables a quick adjustment of teaching methods in a new environment.

Author Contributions

Conceptualisation, P.R.-C. and J.A.-P.; methodology, M.G.; software, P.R.-C.; validation, P.R.-C. and J.A.-P.; formal analysis, P.R.-C.; investigation, P.R.-C., M.G. and J.A.-P.; resources, P.R.-C.; data curation, P.R.-C.; writing—original draft preparation, P.R.-C.; writing—review and editing, P.R.-C. and M.G.; visualisation, P.R.-C. and J.A.-P.; supervision, P.R.-C.; project administration, P.R.-C.; funding acquisition, P.R.-C. All authors have read and agreed to the published version of the manuscript.

Funding

This research was funded by UNIVERSIDAD CATÓLICA DEL NORTE, grant FID 2021 DGPRE. 041/2021 and ANID, grant FONDECYT 1210130. The APC was funded by UNIVERSIDAD CATÓLICA DEL NORTE.

Institutional Review Board Statement

The study was conducted according to the guidelines of the Declaration of Helsinki and approved by the Ethics Committee of UNIVERSIDAD CATÓLICA DEL NORTE (Resolution No. 21 of 22 June 2021).

Informed Consent Statement

Informed consent was obtained from all subjects involved in the study.

Data Availability Statement

The data presented in this study are available in https://doi.org/10.6084/m9.figshare.16571807.v1.

Conflicts of Interest

The authors declare no conflict of interest.

References

  1. Mok, K.H.; Xiong, W.; Ke, G.; Cheung, J.O.W. Impact of COVID-19 pandemic on international higher education and student mobility: Student perspectives from mainland China and Hong Kong. Int. J. Educ. Res. 2021, 105, 101718. [Google Scholar] [CrossRef]
  2. Hawk, T.F.; Shah, A.J. Using learning style instruments to enhance student learning. Decis. Sci. J. Innov. Educ. 2007, 5, 1–19. [Google Scholar] [CrossRef]
  3. Baticulon, R.E.; Sy, J.J.; Alberto, N.R.I.; Baron, M.B.C.; Mabulay, R.E.C.; Rizada, L.G.T.; Tiu, C.J.S.; Clarion, C.A.; Reyes, J.C.B. Barriers to Online Learning in the Time of COVID-19: A National Survey of Medical Students in the Philippines. Med. Sci. Educ. 2021, 31, 615–626. [Google Scholar] [CrossRef] [PubMed]
  4. Willingham, D.T.; Hughes, E.M.; Dobolyi, D.G. The Scientific Status of Learning Styles Theories. Teach. Psychol. 2015, 42, 266–271. [Google Scholar] [CrossRef]
  5. Felder, R.; Silverman, L. Learning and teaching styles in engineering education. Eng. Educ. 1988, 78, 674–681. [Google Scholar] [CrossRef]
  6. Ora, A.; Sahatcija, R.; Ferhataj, A. Learning Styles and the Hybrid Learning: An Empirical Study about the Impact of Learning Styles on the Perception of the Hybrid Learning. Mediterr. J. Soc. Sci. 2018, 9, 137–148. [Google Scholar] [CrossRef] [Green Version]
  7. Salazar-Concha, C.; Ramírez-Correa, P. Predicting the Intention to Donate Blood among Blood Donors Using a Decision Tree Algorithm. Symmetry 2021, 13, 1460. [Google Scholar] [CrossRef]
  8. Yagci, M. Development of an Artificial Intelligence Based Computerized Adaptive Scale and Applicability Test. In Proceedings of the International Conference on Artificial Intelligence and Applied Mathematics in Engineering, Antalya, Turkey, 18–20 April 2020; Springer: Cham, Switzerland, 2020; pp. 292–303. [Google Scholar]
  9. Mwamikazi, E.; Fournier-Viger, P.; Moghrabi, C.; Barhoumi, A.; Baudouin, R. An adaptive questionnaire for automatic identification of learning styles. In Proceedings of the International Conference on Industrial, Engineering and Other Applications of Applied Intelligent Systems, Kaohsiung, Taiwan, 3–6 June 2014; Springer: Cham, Switzerland, 2014; pp. 399–409. [Google Scholar]
  10. Jing, Y.P.; Li, B.; Chen, N.; Li, X.F.; Hu, J.; Zhu, F. The discrimination of learning styles by Bayes-based statistics: An extended study on ILS system. Control Intell. Syst. 2015, 43, 68–75. [Google Scholar] [CrossRef]
  11. Tomlinson, C.A.; Brighton, C.; Hertberg, H.; Callahan, C.M.; Moon, T.R.; Brimijoin, K.; Conover, L.A.; Reynolds, T. Differentiating instruction in response to student readiness, interest, and learning profile in academically diverse classrooms: A review of literature. J. Educ. Gift. 2003, 27, 119–145. [Google Scholar] [CrossRef] [Green Version]
  12. Tomlinson, C.A. How TO Differentiate Instruction in Mixed-Ability Classrooms; ASCD: Alexandria, VA, USA, 2001; ISBN 0871209179. [Google Scholar]
  13. Sapounidis, T.; Stamovlasis, D.; Demetriadis, S. Latent class modeling of children’s preference profiles on tangible and graphical robot programming. IEEE Trans. Educ. 2018, 62, 127–133. [Google Scholar] [CrossRef]
  14. Asikainen, H.; Salmela-Aro, K.; Parpala, A.; Katajavuori, N. Learning profiles and their relation to study-related burnout and academic achievement among university students. Learn. Individ. Differ. 2020, 78, 101781. [Google Scholar] [CrossRef]
  15. Lu, O.H.T.; Huang, A.Y.Q.; Huang, J.C.H.; Lin, A.J.Q.; Ogata, H.; Yang, S.J.H. Applying learning analytics for the early prediction of Students’ academic performance in blended learning. J. Educ. Technol. Soc. 2018, 21, 220–232. [Google Scholar]
  16. Cheng, Y.M. Extending the expectation-confirmation model with quality and flow to explore nurses’ continued blended e-learning intention. Inf. Technol. People 2014, 27, 230–258. [Google Scholar] [CrossRef]
  17. Zhang, L. Do personality traits make a difference in teaching styles among Chinese high school teachers? Pers. Individ. Dif. 2007, 43, 669–679. [Google Scholar] [CrossRef]
  18. Li, M.; Armstrong, S.J. The relationship between Kolb’s experiential learning styles and Big Five personality traits in international managers. Pers. Individ. Dif. 2015, 86, 422–426. [Google Scholar] [CrossRef] [Green Version]
  19. Foroozandehfar, L.; Khalili, G.F. On the relationship between Iranian EFL learners’ reading fluency, their personality types and learning styles. Cogent Arts Humanit. 2019, 6, 1681347. [Google Scholar] [CrossRef]
  20. Coffield, F.; Moseley, D.; Hall, E.; Ecclestone, K. Should we be using Learning Styles? Learn. Ski. Res. Cent. 2004, 84. [Google Scholar]
  21. Felder, R.M.; Spurlin, J. Applications, reliability and validity of the Index of Learning Styles. Int. J. Eng. Educ. 2005, 21, 103–112. [Google Scholar]
  22. Felder, R.M.; Brent, R. Understanding student differences. J. Eng. Educ. 2005, 94, 57–72. [Google Scholar] [CrossRef]
  23. Ramírez-Correa, P.E.; Rondan-Cataluña, F.J.; Arenas-Gaitán, J.; Alfaro-Perez, J.L. Moderating effect of learning styles on a learning management system’s success. Telemat. Inform. 2017, 34, 272–286. [Google Scholar] [CrossRef]
  24. Quinn, M.M.; Smith, T.; Kalmar, E.L.; Burgoon, J.M. What type of learner are your students? Preferred learning styles of undergraduate gross anatomy students according to the index of learning styles questionnaire. Anat. Sci. Educ. 2018, 11, 358–365. [Google Scholar] [CrossRef] [PubMed]
  25. Quinlan, J.R. Induction of Decision Trees. Mach. Learn. 1986, 1, 81–106. [Google Scholar] [CrossRef] [Green Version]
  26. Salzberg, S.L. C4.5: Programs for Machine Learning by J. Ross Quinlan. Morgan Kaufmann Publishers, Inc., 1993. Mach. Learn. 1994, 16, 235–240. [Google Scholar] [CrossRef] [Green Version]
  27. Wu, X.; Kumar, V.; Ross, Q.J.; Ghosh, J.; Yang, Q.; Motoda, H.; McLachlan, G.J.; Ng, A.; Liu, B.; Yu, P.S.; et al. Top 10 algorithms in data mining. Knowl. Inf. Syst. 2008, 14, 1–37. [Google Scholar] [CrossRef] [Green Version]
  28. Romero, E.; Villar, P.; Gómez-Fraguela, J.A.; López-Romero, L. Measuring personality traits with ultra-short scales: A study of the Ten Item Personality Inventory (TIPI) in a Spanish sample. Pers. Individ. Dif. 2012, 53, 289–293. [Google Scholar] [CrossRef]
  29. Jena, R.K. Predicting students’ learning style using learning analytics: A case study of business management students from India. Behav. Inf. Technol. 2018, 37, 978–992. [Google Scholar] [CrossRef]
  30. Troussas, C.; Krouska, A.; Sgouropoulou, C.; Voyiatzis, I. Ensemble learning using fuzzy weights to improve learning style identification for adapted instructional routines. Entropy 2020, 22, 735. [Google Scholar] [CrossRef]
  31. Carvalho, L.M.C.; do Freixo Pereira, J.M.; Dias, R.M.T.S.; Noronha, A.B. Learning Styles in Business Management students: An empirical study in Portuguese Higher Education. Adm. Ensino Pesqui. 2020, 21, 348–384. [Google Scholar] [CrossRef]
  32. Pasina, I.; Bayram, G.; Labib, W.; Abdelhadi, A.; Nurunnabi, M. Clustering students into groups according to their learning style. MethodsX 2019, 6, 2189–2197. [Google Scholar] [CrossRef]
  33. Kaufman, L.; Rousseeuw, P.J. Finding Groups in Data: An Introduction to Cluster Analysis; John Wiley & Sons: Hobeken, NJ, USA, 2009; Volume 344, ISBN 0470317485. [Google Scholar]
  34. Tulsi, P.K.; Poonia, M.P.; Priya, A. Learning Styles of Engineering Students. J. Eng. Educ. Transform. Citeseer 2016, 30, 44. [Google Scholar] [CrossRef]
  35. Vita, G. De Learning styles, culture and inclusive instruction in the multicultural classroom: A business and management perspective. Innov. Educ. Teach. Int. 2001, 38, 165–174. [Google Scholar] [CrossRef]
  36. Buxeda, R.J.; Moore, D.A. Using learning-styles data to design a microbiology course. J. Coll. Sci. Teach. 1999, 29, 159. [Google Scholar]
  37. Palou, E. Learning Styles of Mexican Food Science and Engineering Students. J. Food Sci. Educ. 2006, 5, 51–57. [Google Scholar] [CrossRef]
  38. Seery, N.; Gaughran, W.F.; Waldmann, T. Multi-Modal Learning in Engineering Education. In Proceedings of the 2003 ASEE Conference and Exposition, Nashville, TN, USA, 22–25 June 2003; American Society for Engineering Education: Washington, DC, USA, 2003; p. 17. [Google Scholar]
  39. Kuri, N.P.; Truzzi, O.M.S. Learning styles of freshmen engineering students. In Proceedings of the 2002 International Conference on Engineering Education, Manchester, UK, 18–21 August 2002; pp. 1–5. [Google Scholar]
Figure 1. Scatter plot between gender-separated personality traits.
Applsci 11 10505 g001
Figure 2. Cluster mean plots and t-SNE cluster plot.
Applsci 11 10505 g002
Figure 3. Clusters and learning styles.
Applsci 11 10505 g003
Figure 4. (a) Decision tree model; (b) decision tree model (part A); (c) decision tree model (part B).
Applsci 11 10505 g004aApplsci 11 10505 g004b
Table 1. Distribution of the attributes of interest.
Attribute N%
Gender
Male19874
Female7026
Learning style that the student was skilled at
Reading114
Writing4316
Listening2610
Doing18870
Total268100
Age Mean 20.9 ± 2.6
Range 18–46 years
Table 2. Results of k-means clustering analysis.
Cluster 1 (56.4%)Cluster 2 (43.6%)
Z-ScoreMeanSDZ-ScoreMeanSD
D1: Perception0.138 −1.6943.093−0.471 −5.1672.804
D2: Input0.547 −0.9193.043−0.487 −4.1532.188
D3: Processing0.565 0.0973.096−0.474 −3.2502.546
D4: Understanding0.550 0.1452.876−0.431 −2.5972.360
Table 3. Confusion matrix for prediction performance of training data.
Accuracy: 72.20%Cluster 1 (True)Cluster 2 (True)Class Precision
Cluster 1 (pred.)893571.77%
Cluster 2 (pred.)338772.50%
Class recall72.95%71.31%
Table 4. Confusion matrix for prediction performance of unseen data.
Accuracy: 82.93%Cluster 1 (True)Cluster 2 (True)Class Precision
Cluster 1 (pred.)15383.33%
Cluster 2 (pred.)41982.61%
Class recall78.95%86.36%
Publisher’s Note: MDPI stays neutral with regard to jurisdictional claims in published maps and institutional affiliations.

