1. Introduction
Primarily, Industry 4.0 focuses on replacing or improving the existing structure of industries with advanced digital equipment so that all the components can exchange data with each other and coordinate with other devices uninterruptedly. By keeping this in view, Industry 4.0 can simply be interpreted as the digital integration of machines, work pieces, systems, and complete infrastructure through which intelligent networks could be developed along the entire value chain. Considering the core concepts of Industry 4.0, this research took place at the Laboratory of Computer Integrated Manufacturing, Industrial Engineering Department, King Saud University, Saudi Arabia. The system is presented in
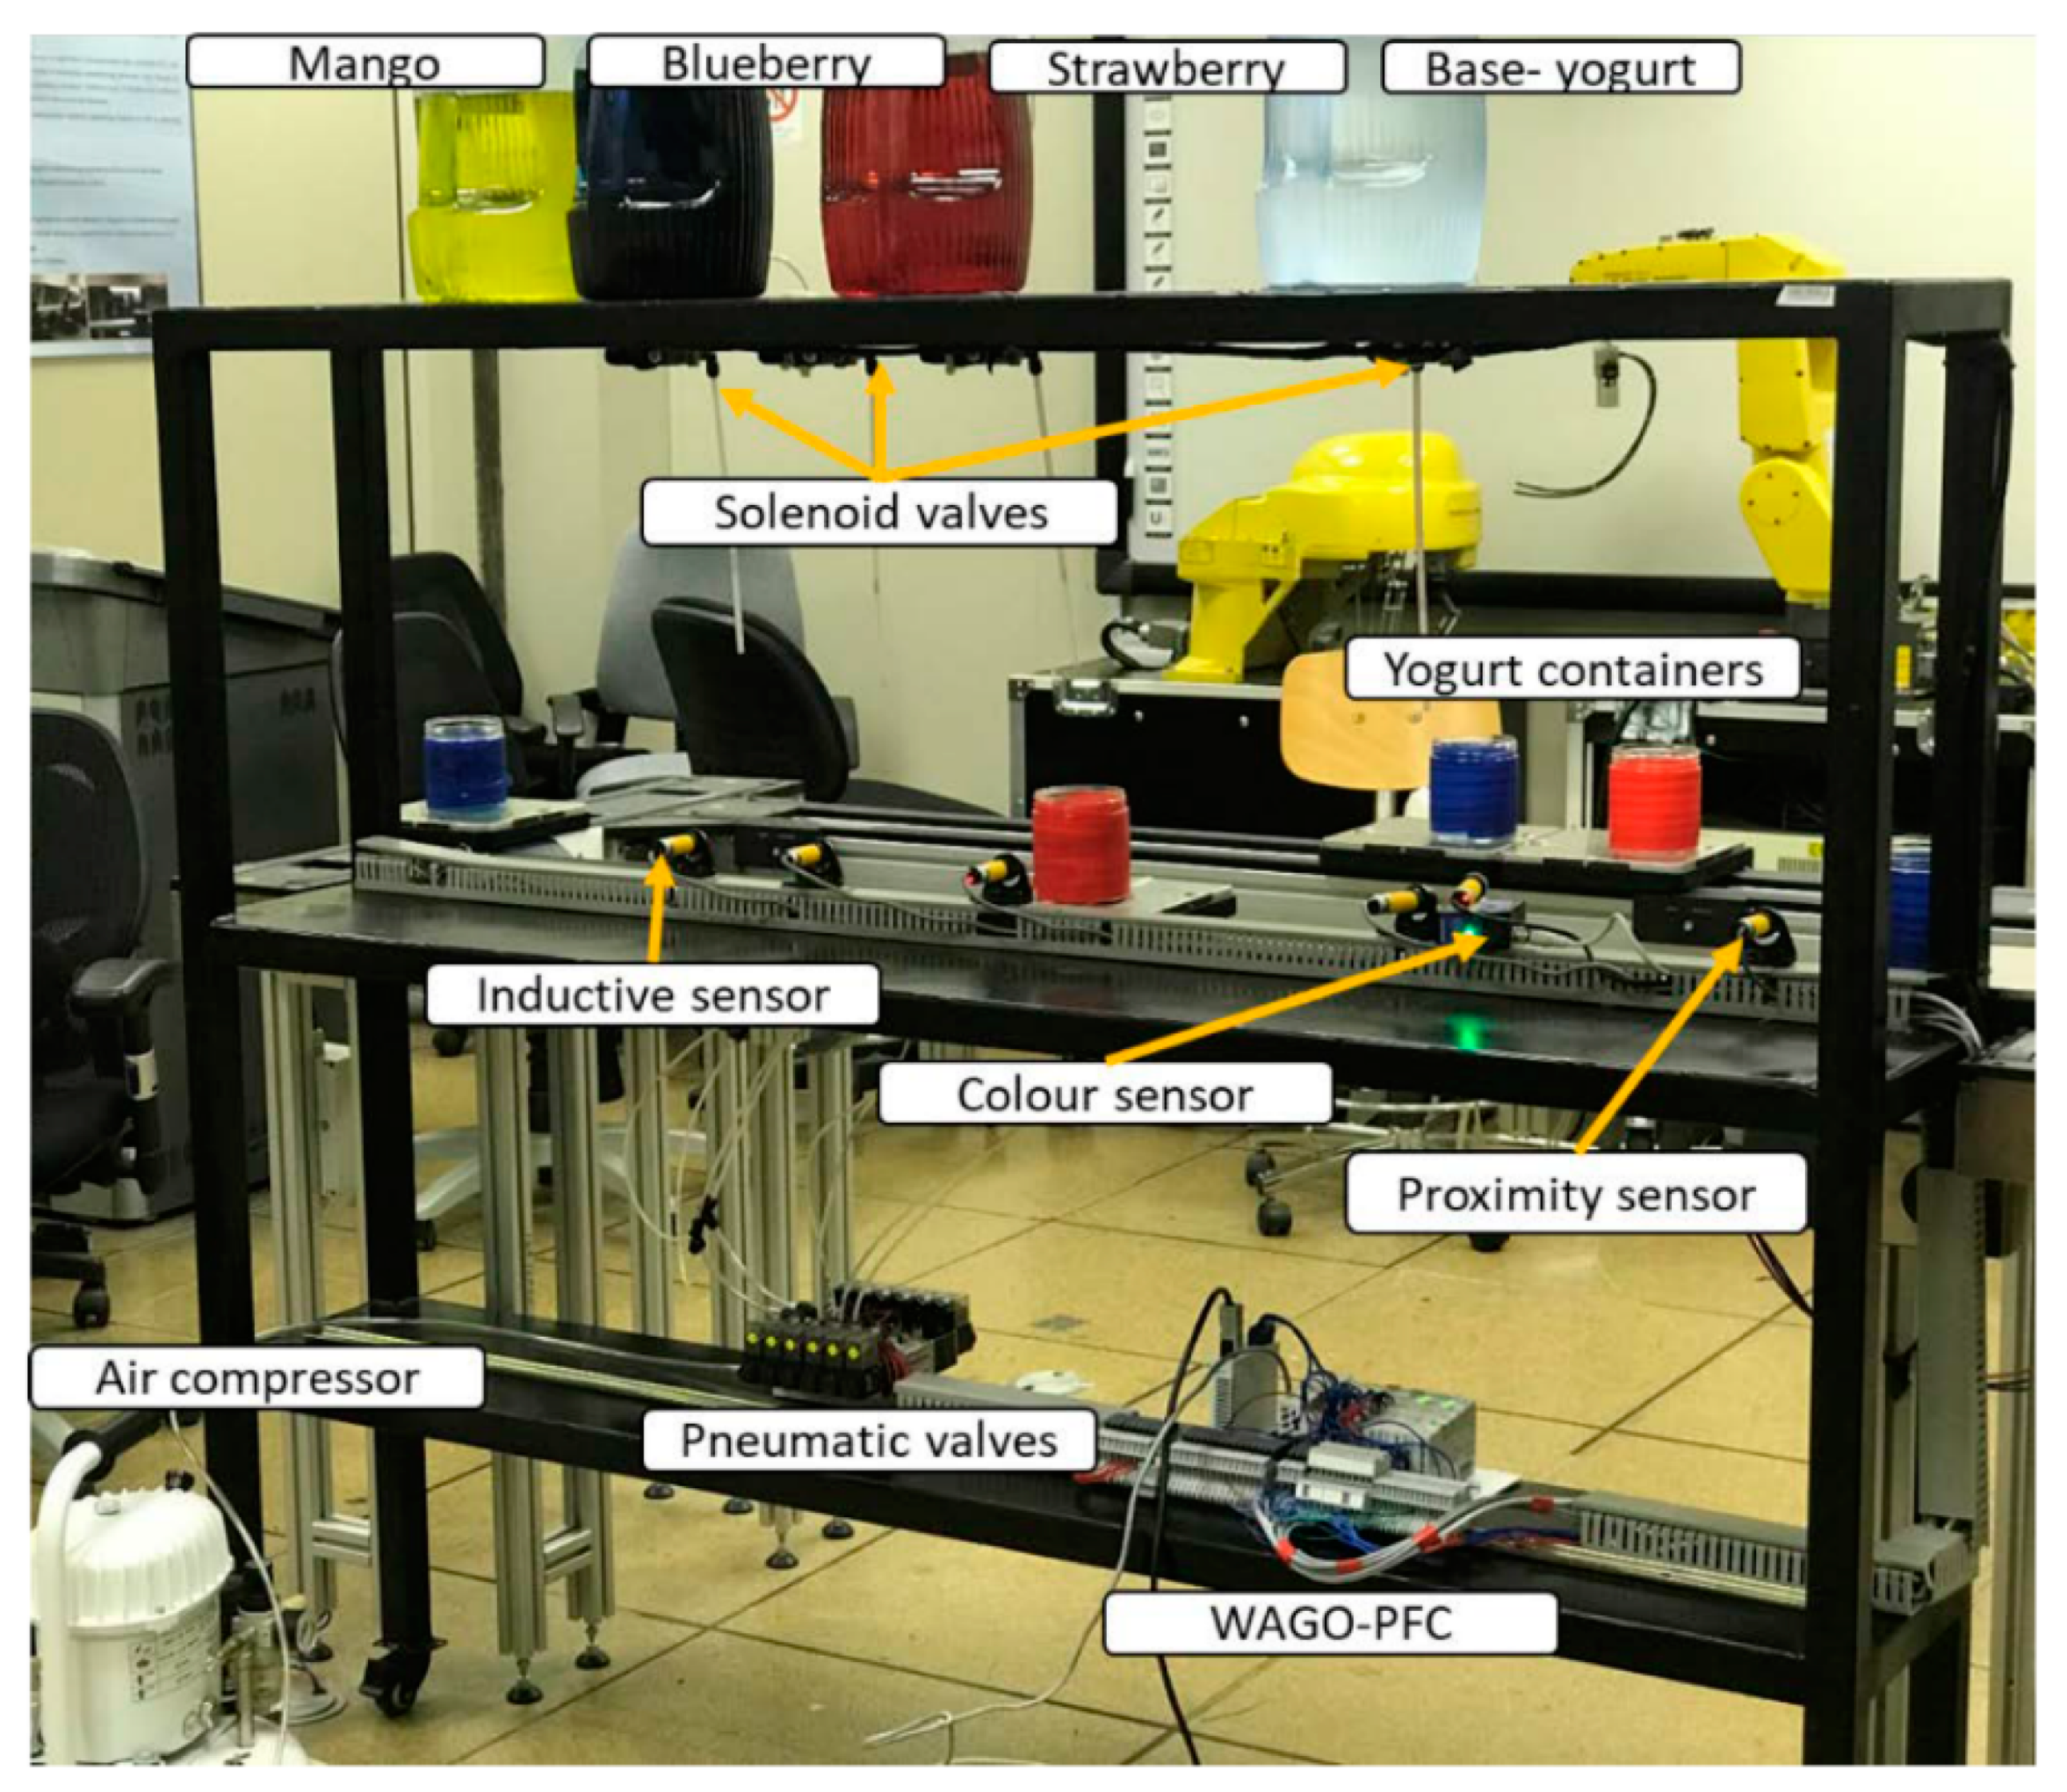
Figure 1. There are yogurt and flavor tanks from which cups of required volumes can be filled. At the placement point, the sensor senses the glass, and it then moves towards the yogurt filling point. The solenoid valve opens for a time in which the glass is filled with yogurt of the required volume. A glass filled with yogurt then moves towards the flavor filling point, and it is then filled with the required volume of flavor. After the flavor is mixed with the yogurt, the filled glass then moves towards the leaving point and leaves the system. During the filling of yogurt and flavor, the cups are held stationary by the system while the conveyor belt moves to carry cups from one point to another. Only one flavor is mixed with the yogurt as demanded by the customers. The total volume of a cup and the volumes of yogurt and flavor varies as demanded by the customer. Moreover, the industry can be operated in two types of markets: one in which the cups have standard volumes and the other where the cups have make-to-order volumes. Customer order comprises the total volume of a cup, the number of cups of required volume, the volumes of yogurt and flavor in a total volume of the cup, and the waiting time for an order.
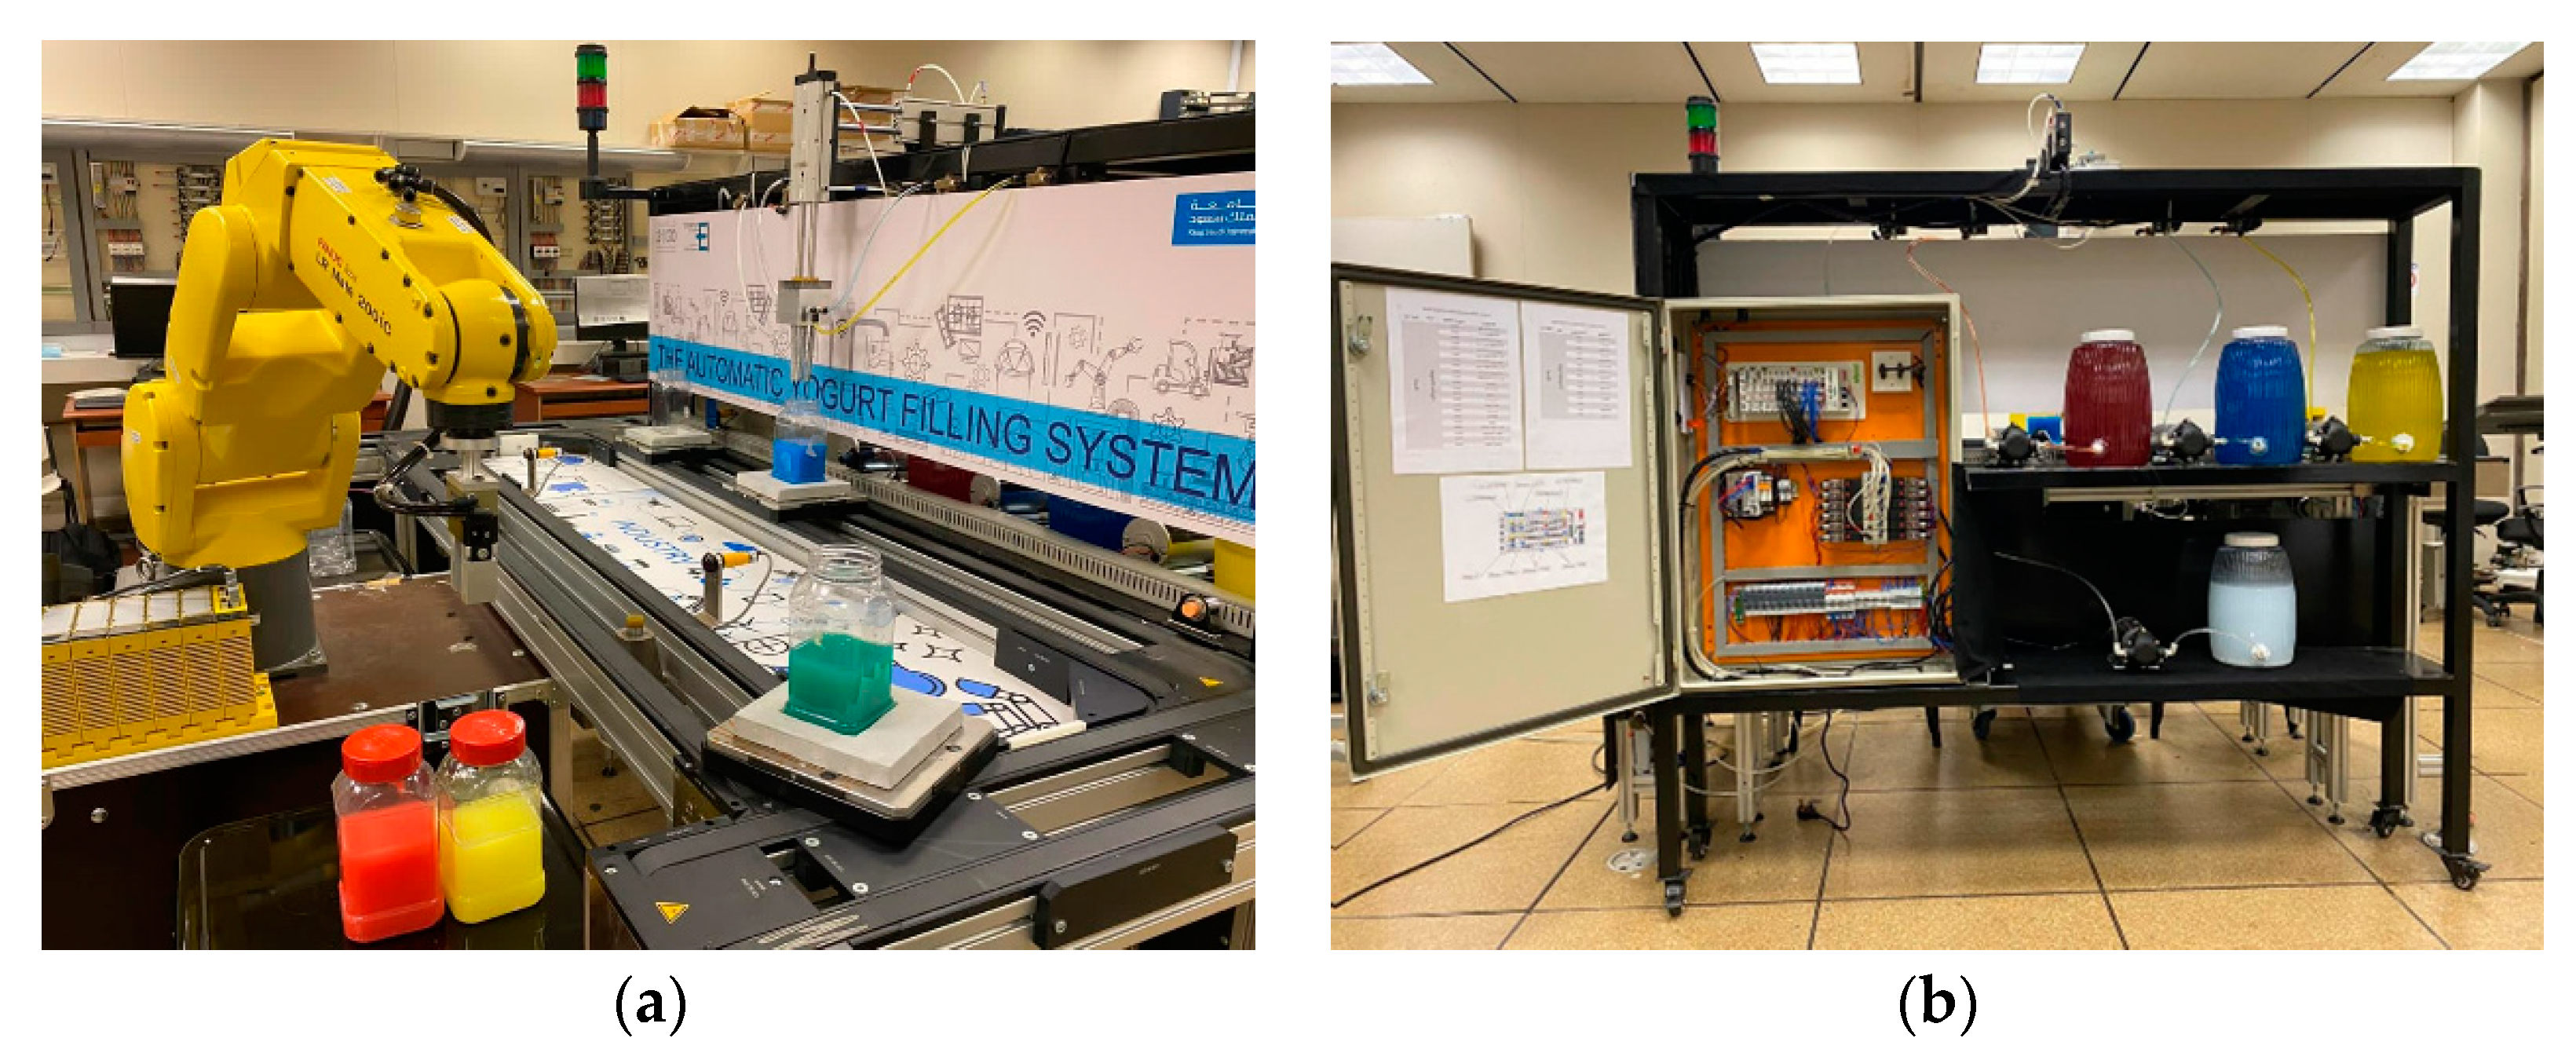
In this paper, a mathematical model was also developed for Industry 4.0 based yogurt filling machines with the main objective of maximizing the speed of the conveyor belt and hence the throughput. Overall system integration is shown in
Figure 2a,b. The orders received from customers for different volumes of yogurt and flavors in a required volume of the cup are processed through the machine optimally by using the proposed mathematical model. The results of the model are used as input for the one-dimensional rules to evaluate the performance measure of interest. Moreover, the effects of changes in the feed rate of flavor valve and length of the conveyor belt on the feed rate of flavor valve, speed of conveyor belt, waiting and processing times, and on different performance measures were investigated. Although the problem still poses challenges in practice, by solving real-life cases, the proposed model provides a benchmark for the filling process of cups of different volumes. It was found that by implementing the proposed model, significant improvements in terms of optimizing the filling process was achieved.
There is a set of constraints that must be considered in the filling process of the cups, which will be described later in
Section 4. These constraints are relevant to the maximum speed of the conveyor belt, maximum feed rate of yogurt and flavor valves, fulfilling a demand on or before the waiting time of customers, and equal filling time of yogurt and flavor in a cup.
As shown in
Figure 2, the Industry 4.0 laboratory consists of a fully automated yogurt filling machine that is equipped with real-time data capturing technologies such as smart sensors, Radio Frequency Identification (RFID) system, machine computer of the robot arm, controller of air compressor, and conveyor motor. These technologies are supposed to be the main real-time data enablers of the industry 4.0 system. In addition to real-time production data, in the presented mathematical model, virtual real-time data which are captured from IT systems, i.e., ERP such as customer orders, supplier orders, or any other necessary data for an optimal production system, are considered. Since cloud computing is one of the main pillars of industry 4.0, the mathematical model will be coded and run in real-time through the cloud of industry 4.0. In turn, the coded mathematical model will process this information in real-time and generate the most suitable production commands as a part of industry 4.0 functions to optimize the production system. In order to mimic reality, the mathematical model represents the customer orders with highly customized and dynamic behavior (e.g., the customer changes their mind in terms of the total volume of cup or yogurt and flavor percentages). Therefore, the dynamic behavior based on customer behavior or production system behavior will be captured in real-time through the coded mathematical model in the cloud in order to generate the most suitable production commands for optimal production where the conveyer belt speed is targeted to be maximized. Therefore, some production parameters were included in the mathematical model and considered to be dynamic, such as yogurt and flavor filling rate and mixing percentages. Since a large mix and small volume production system will contribute to slow down the speed of the conveyer belt, the intended function of our mathematical model is to minimize the variability in filling processes of either yogurt or flavor through real-time rescheduling and reprioritizing of the customer orders based on real-time captured data. Finally, the coded mathematical model is considered as a part of several models that are running in real-time on the cloud, which can be described as the brain of the Industry 4.0 system.
The remainder of the paper is outlined as follows. A brief literature review is provided in
Section 2, where studies that are closely related to the context of our problem are referred. In
Section 3, the solution procedure and methodology developed to solve the problem is described, while in
Section 4, sequencing the processing of orders using single-dimensional rules was explained. The results are presented and discussed in
Section 5, while
Section 6 presents the conclusion and future research directions.
2. Literature Review
In the last two decades, the demand in global markets has become more customized and uncertain. This drives manufacturers to develop highly customized manufacturing systems characterized by high dynamic behavior and thus higher variability [
1,
2,
3]. The emergence of Industry 4.0 offers superior features that support manufacturing systems with the latest technological advancements in information and communication systems, such as the internet of things (IoT), Internet of Services (IoS), and cyber-physical systems (CPS), big data analytics (BDA), cloud computing, etc. [
4,
5,
6,
7,
8,
9]; several manufacturing companies rushed to adopt Industry 4.0 to solve their industrial problems through improving and optimizing the production processes [
10,
11,
12].
A number of studies [
13,
14,
15,
16,
17] pointed out that Industry 4.0 can efficiently control and coordinate smart factories and make them more responsive to the dynamic changes in market demands. Bueno et al. (2020) listed 18 smart industry 4.0 capabilities that can improve the performance of manufacturing companies (e.g., real-time tracking, monitoring, and tracing; visibility, dynamicity, and adaptability; autonomy and decentralization; and smart production planning, control, and scheduling) [
18]. In addition, through his work in developing real-time production rescheduling in the semiconductor industry, Waschneck et al. (2016) confirmed that Industry 4.0 provides the manufacturers with a new and efficient opportunity to increase and improve the performance of their production systems [
19].
Recently, several studies were conducted exploring how Industry 4.0 benefits production controlling and scheduling in a smart manufacturing environment [
20]. For example, Parente et al. (2020) concluded that Industry 4.0 could directly and effectively support the scheduling process of production activities since Industry 4.0 system collects real-time data during the physical interaction between production entities and generates an optimal production schedule [
21]. Zhang et al. (2019) explored the new perspectives of job-shop scheduling under Industry 4.0, where new techniques for developing future job-shop scheduling models and frameworks under Industry 4.0 were discussed [
22]. Rossit et al. (2018) studied how Industry 4.0 paradigm will positively impact production scheduling and thus production performance [
23].
In this regard, several mathematical optimization models for optimizing and scheduling production processes in different sectors, based on Industry 4.0 concepts and technologies, were developed [
24,
25]. Moreover, it is observed that there is significant progress in the development of rigorous production optimization models and efficient industrial solution techniques in different manufacturing sectors [
26]. Before the emergence of industry 4.0, few researches, such as [
27,
28,
29], developed a real-time scheduling mathematical model for dynamic manufacturing behavior. However, they are not effective in dealing with today’s high variability in the production environment since the real-time data, which are limited to those captured from the machine control unit, process control computers.
Due to the powerful features of Industry 4.0, industry 4.0-based smart real-time production controlling and scheduling was discussed in several scientific works [
11,
30,
31,
32,
33,
34,
35,
36,
37]. For example, Rossit et al. (2019) introduced a smart scheduling mechanism to mitigate the production incidents, interruption, and instability induced by the real-time autonomous behavior of the entities of the production system. The developed mechanism uses an efficient screening procedure called Tolerance Scheduling to reschedule the initial production plan based on pre-identified production events to face unforeseen production conditions and keep production stable (i.e., optimal or near optimal) [
11]. Yuanyuan et al. (2020) proposed a rescheduling framework that integrates optimization algorithms and machine learning techniques to improve the overall production effectiveness [
34]. Kocsi et al. (2020) presented a conceptual model for a real-time decision-support system for production scheduling in the Industry 4.0 production environment with high-mix, low-volume behavior. The aim of the model is to minimize the total production process time (i.e., makespan). The developed model encompasses a hybrid of different scheduling techniques, where the best alternative will be selected using an analytical hierarchy process (AHP) analysis [
30]. Kianpour et al. (2021) Developed an Industry 4.0-based job shop scheduling model. Project management concepts were integrated into a mixed-integer linear programming model to design a dynamic automated scheduling system [
38].
In this regard, the flexible job-shop scheduling problem has received more attention from researchers in the field of smart real-time production scheduling under Industry 4.0. For example, Framinan et al. (2019) investigated how real-time information in an industry 4.0 environment can be used to reschedule the orders in a turbulent job-shop production environment where the processing times are assumed to be variable. Several rescheduling policies were assumed and examined with the objective of improving the performance of rescheduling results within fewer rescheduling frequencies. The computational results show that the rescheduling of production processes will improve the performance of operations when the processing time variability ranges from low to medium. The results also confirmed the necessity of developing an efficient initial schedule [
31]. Ghaleb et al. (2020) developed a real-time scheduling model for the flexible job-shop scheduling problem. The model utilizes different advanced scheduling strategies, policies, and techniques, and two production disturbances were addressed, namely machine availability (i.e., random breakdowns) and unexpected arrivals of new jobs. The efficiency of the developed model was also investigated under different scenarios. The obtained results confirmed that continued rescheduling (i.e., update on the initial schedule) is more much better than a fixed schedule generated initially. Finally, the computational results of his study demonstrate that the optimal utilization of real-time information of production will significantly enhance production scheduling decisions [
32]. Leusin et al. (2018) introduced a dynamic job-shop scheduling problem framework by developing an intelligent system based on the use of Multi-Agent Systems and the Internet of Things (IoT) for real-time data collection and exchange to support decision making and to deal with disturbances in the production system [
10].
Smart real-time scheduling in lean manufacturing was also addressed by Ramadan et al. [
39]. They developed a mathematical model for a smart real-time production scheduling and dispatching system based on lean concepts to achieve lean objectives where the materials flow along value stream mapping (VSM) was optimized, and thus the manufacturing lead time is minimized. Despite a large number of publications in the field of smart real-time production scheduling in industry 4.0, the adoption of industry 4.0 still requires further knowledge to be developed and specified [
20]. Therefore, based on reviewing papers, there are still some research gaps that need to be addressed, for instance:
Most of the conducted studies focus deeply just on a flexible job-shop production environment;
None of the reviewed studies investigated how scheduling influences a fully automated filling production systems where customer orders are highly customized with the target of changing production parameters to minimize makespan;
Few studies used linear integer programming to developed dynamic mathematical models for efficient real-time rescheduling.
3. Mathematical Model
The automatic yogurt filling system is shown in
Figure 1. The mathematical model of this system is developed for maximizing the feed rates of the yogurt and flavor filling valves. The speed of the conveyor belt while filling cups of different volumes is optimized, and percentages of yogurt and flavors to meet a given order are analyzed by considering the following indices, parameters, and decision variables.
3.1. Indices
- i
percentage of yogurt in the total volume of a cup.
- y
yogurt type.
- j
percentage of flavor in the total volume of a cup.
- f
flavor type.
- k
total volume of a cup.
3.2. Process Parameters
- Sb
speed of the conveyor belt.
- Lt
total length of the conveyor belt, where Lt is divided into three equal parts each of length l.
- Viyjfk
volume of yogurt type y and percentage i, to be mixed with flavor type f and percentage j in a total volume k of a cup.
- viyjfk
volume of flavor type f and percentage j, to be mixed with yogurt type y and percentage i in a total volume k of a cup.
- Diyjfk
demand for yogurt type y and percentage i, mixed with flavor type f and percentage j in a total volume k of a cup.
- Wiyjfk
pickup time in minutes for yogurt type y and percentage i, mixed with flavor type f and percentage j in a total volume k of a cup.
3.3. Decision Variables
- βiyjfk
feed rate of yogurt type y and percentage i, to be mixed with flavor type f and percentage j in a total volume k of a cup.
- γiyjfk
feed rate of flavor type f and percentage j, to be mixed with yogurt type y and percentage i in a total volume k of a cup.
The model can be summarized as determining the maximum values of the feed rates of yogurt and flavor valves for the purpose of maximizing the speed of the conveyor belt and minimizing the transportation and filling times of a cup of required volumes of yogurt and flavor. Mathematically, the objective function for maximization of the speed of the conveyor belt can be stated as follows:
Subject to the constraints and equations which deal directly with satisfying the demand for cups of different volumes of yogurt and flavors within a given time.
The objective function (1) maximizes the speed of the conveyor belt of fixed length by maximizing the feed rates of yogurt and flavor valves for the required volumes of yogurt and flavor, respectively. The constraints (2) state that the speed of the conveyor belt should be less than or equal to the maximum allowable speed of the conveyor belt in terms of the feed rate of yogurt valve, yogurt volume, and the length between the placement point of the empty cup and yogurt filling point. In the same way, inequalities (3) enforce that the speed of the conveyor belt should be less than or equal to the maximum allowable speed of the conveyor belt in terms of the feed rate of flavor valve, flavor volume, and the length between the yogurt filling point and flavor filling point. The constraints (4) and (5) limit the maximum feed rates of the yogurt and flavor valves, respectively. Inequalities (6) were written in terms of yogurt feed rate, yogurt volume, and pickup time, and ensure that the number of cups processed within a given time must be greater than or equal to the total required number of cups of required volumes of yogurt and flavor. Finally, the Equation (7) satisfy that the filling times of yogurt and flavor in a cup of required volume should be equal.
In order to avoid congestion of cups on the conveyor belt, the solution of the proposed model results in five equal times, namely the traveling time from placement point on the conveyor belt to yogurt filling point, yogurt filling time, traveling time from yogurt filling point to flavor filling time, flavor filling time, and traveling time from the flavor filling point to the leaving point on the conveyor belt.
The objective function, as well as the constraints, is linear in the decision variables; hence, the model falls in the domain of linear programming and can be solved in an adequate amount of time. Nonlinear modeling was avoided in the construction of the model. However, by the use of approximation techniques, nonlinear models are converted into linear ones and can be solved using non-exact/metaheuristic approaches, but it requires relatively higher computational time.
Each cup goes through different states, starting from placement on the conveyor belt as an empty cup to leaving the conveyor belt as a completely filled cup with required volumes of yogurt and flavor. The various times related to the process are arrival waiting time, transportation time, filling time, and total processing time. The arrival waiting time is the time in which an empty cup is waiting in queue for placement at the starting point on the conveyor belt to start moving towards the yogurt valve for filling. The transportation time is the time taken by an empty cup in moving from placement point on the conveyor belt to yogurt filling point, or the time taken by a yogurt filled cup in moving from yogurt filling point to the flavor filling point, or the time taken by a yogurt- and flavor-filled cup in moving from the flavor filling point to the leaving point on the conveyor belt. The yogurt and flavor filling time is the time consumed with filling a cup with yogurt and flavor of required volumes, respectively.
The waiting time in the queue of
nth empty cup
En, the processing time of a cup
P, and the waiting time for
nth completely filled cup
Fn can be written in the form of equations in terms of the required volume of yogurt and yogurt filling rate. Equations (8) and (9) show the waiting time for the
nth empty cup in the queue for placement on the starting point at the conveyor belt to start moving towards the yogurt filling point and the total processing time of a cup, respectively, while Equation (10) is used to find the waiting time for
nth completely filled cup.
The benefits of the proposed model are: the solution of a problem takes less computational time due to linearity, it is used for throughput maximization purposes, and it is used for size selection of the flavor valve. The model finds the maximum feed rates of yogurt and flavor valves less than or equal to their maximum allowable feed rate values and also finds the maximum speed of the conveyor belt less than or equal to its maximum allowable speed. The model can also find the maximum number of cups that can be processed at a time less than or equal to the waiting time of a customer. Hence, the model can be used to find a better solution and can proclaim considerable operational and economic benefits to the industry.
4. Solution Procedure
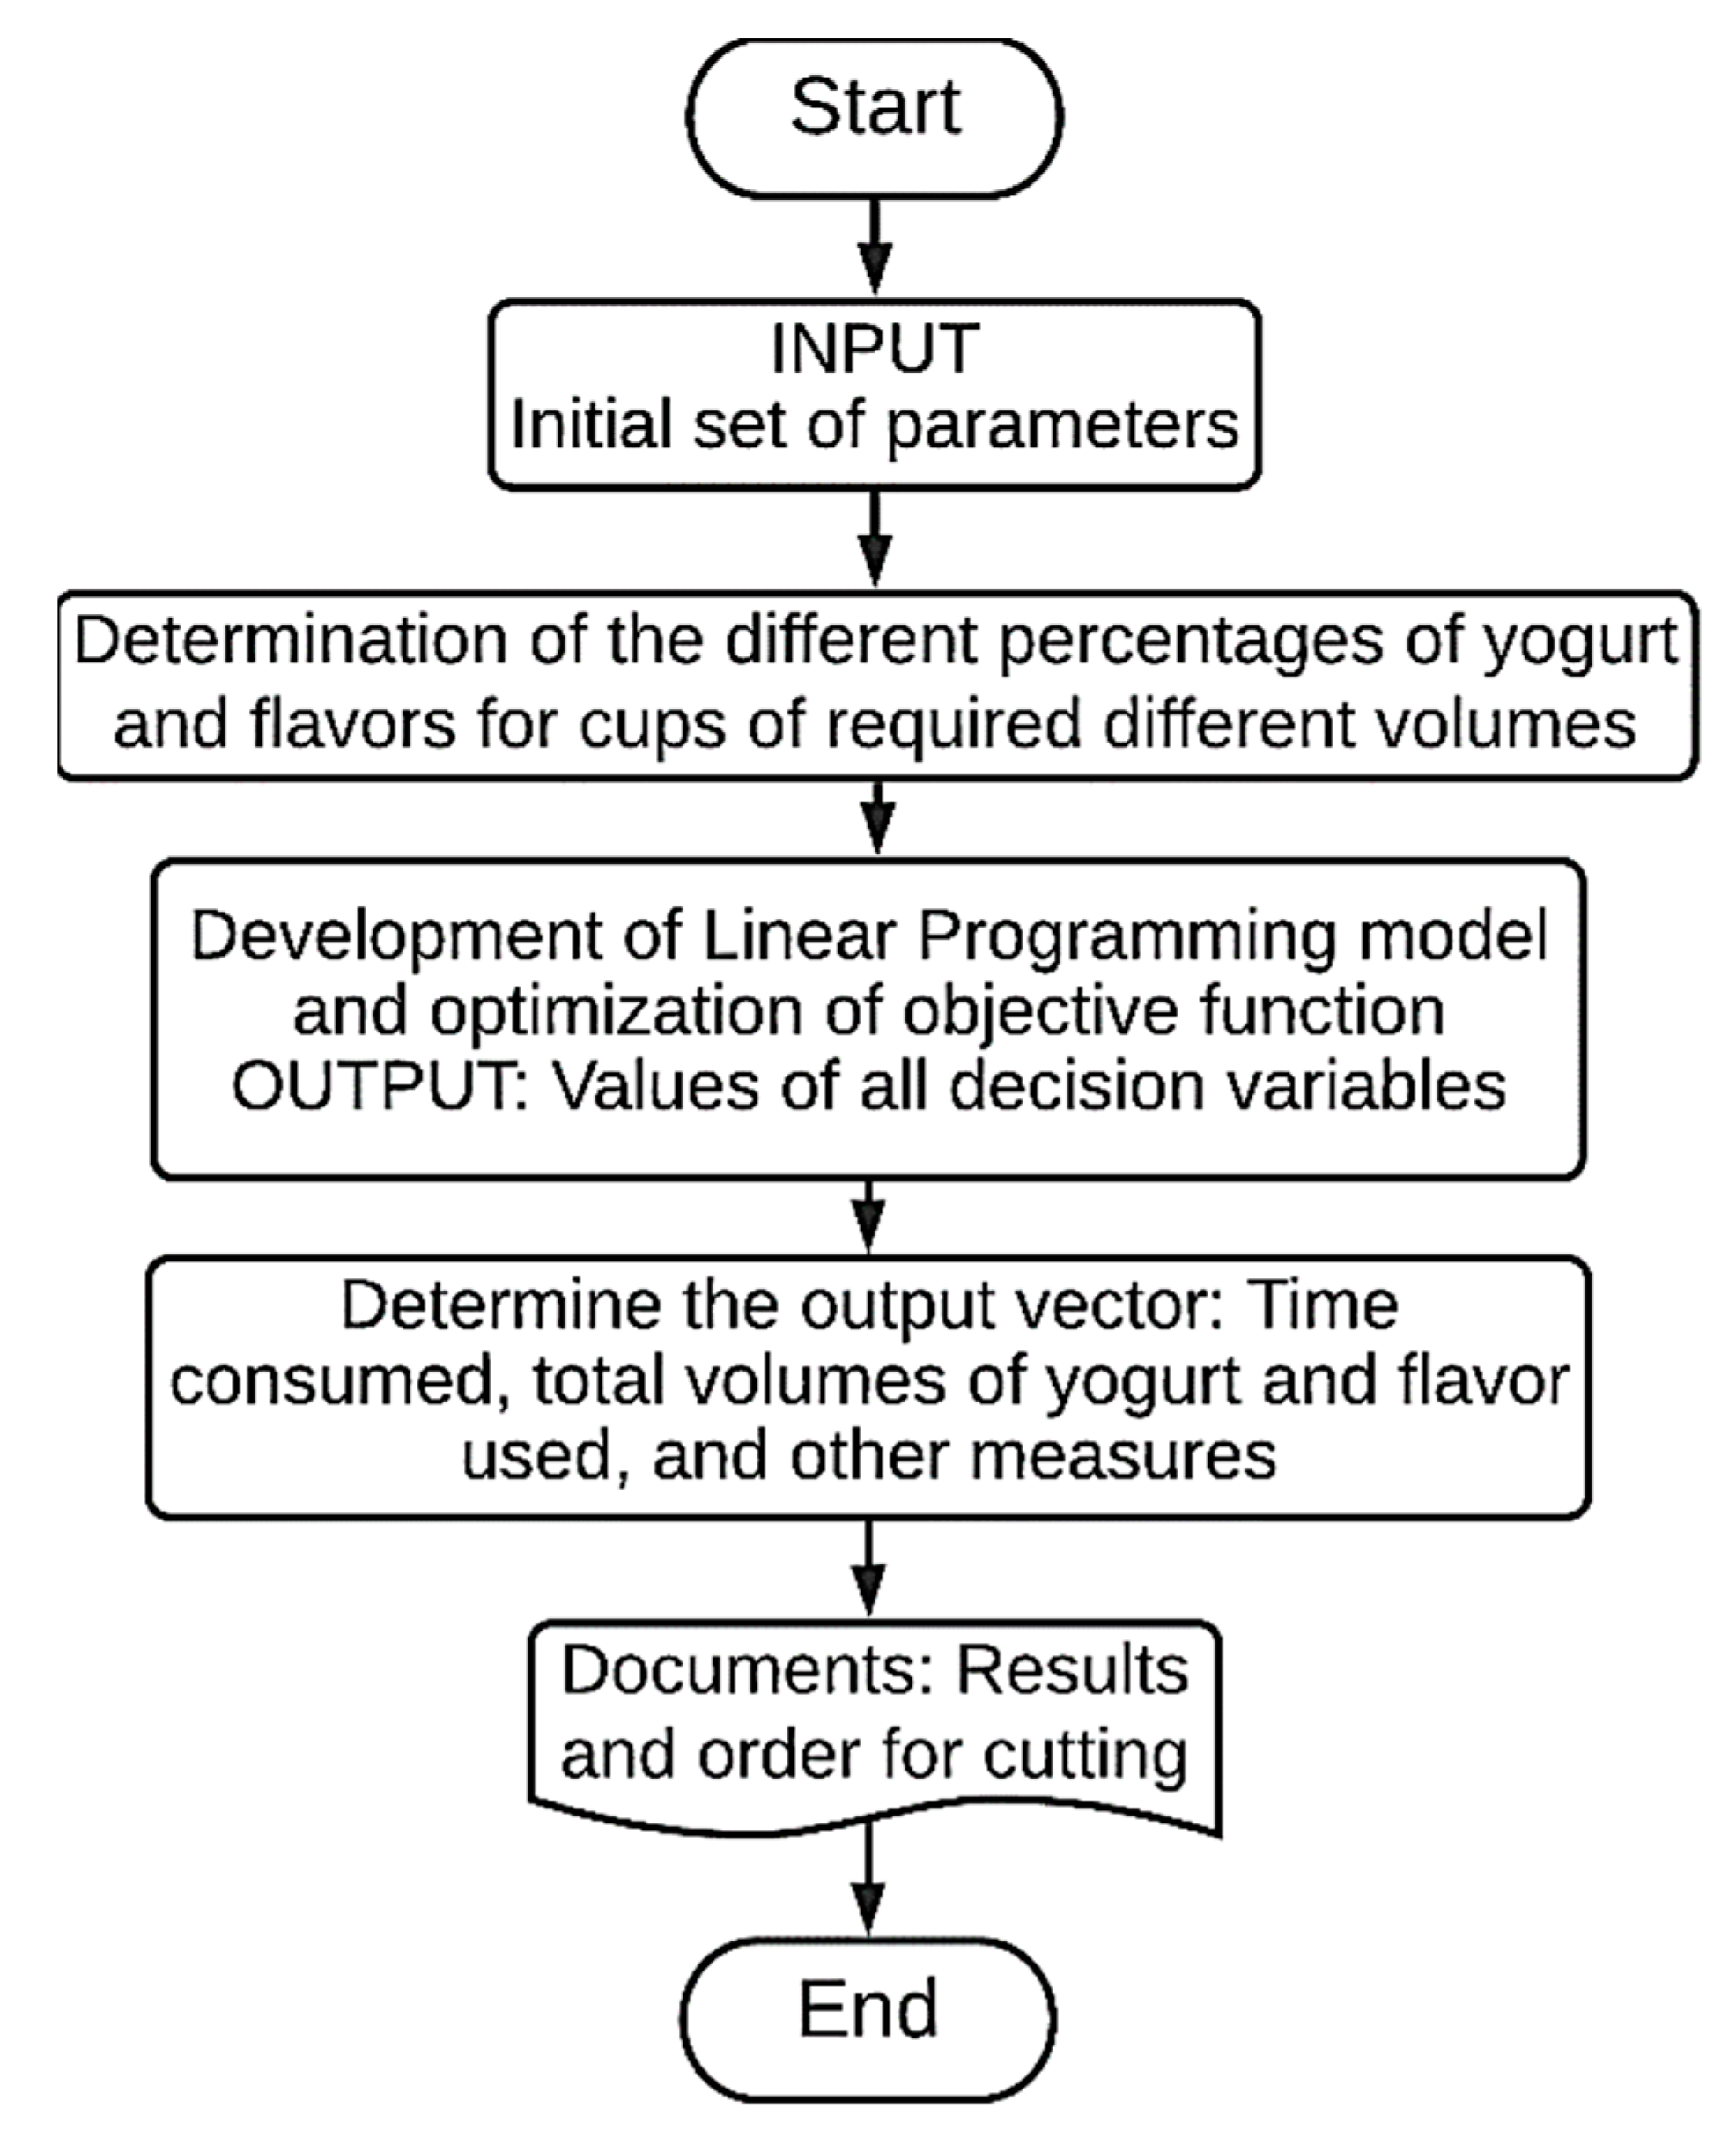
The adopted solution procedure is divided into a few stages, which are shown in
Figure 3. As a set of orders is received, all values of parameters are evaluated, and the different percentages of yogurt and flavors for cups of required different volumes are determined. All values of parameters are then used as columns in a linear programming model, and the problem is solved using the simplex algorithm. The required time, required volumes of yogurt and flavors, and all other measures are calculated by solving the problem optimally. The results are then shared and documented, and the filling of cups with required volumes of yogurt and flavor is started.
For illustration purposes of the solution procedure, a small problem is solved concerned with the filling of one type of yogurt and three different types of flavors. The flavors are strawberry, blueberry, and mango, represented by the numbers 1, 2, and 3 in the mathematical model, respectively, while the yogurt is represented by the number 1 only. In a cup filled with the required volume of yogurt, only one flavor is then filled over the yogurt. The different flavors are also filled at a single point located on the conveyor belt. The total length of the conveyor belt is considered 90 cm and is divided into three equal parts. The three parts are length from placement point to yogurt filling point, length from yogurt filling point to flavor filling point, and the length of flavor filling point to the leaving point on the conveyor belt. Hence, each of these lengths is equal to 30 cm. The maximum speed of the conveyor belt is considered as 10 cm/sec, and the maximum feed rates of the yogurt and flavor valve are 50 mL/sec and 25 mL/sec, respectively. A set of orders is described in
Table 1.
Some constraints must be considered during the filling process. Operational constraints include the imposition of minimum and maximum volumes of cups to optimize the use of the machinery available and the satisfaction of the customer specification of minimum and maximum volumes of yogurt and flavors. Technological constraints include the minimum and maximum sizes of a cup, the limited number of flavors, minimum and maximum speeds of conveyor belts, and minimum and maximum feed rates of the yogurt and flavor filling valves.
In order to solve the problem optimally, a linear programming model was developed. The objective of the model is to maximize the yogurt and flavor filling rates and hence the speed of the conveyor belt for the purpose of maximizing the throughput. Equation (11) shows the objective function of throughput maximization.
The constraints of the model limit the maximum speed of the conveyor belt to less than or equal to 10 cm/sec. Moreover, the maximum feed rates of yogurt and flavor values are restricted to 50 mL/sec and 25 mL/sec, respectively. The set of customer orders includes demand for different volumes of yogurt and flavors and different waiting times for cups. The constraints in order 1 can be written as:
Similar constraints are written for the remaining orders from customers, and the constraints of the model are solved simultaneously to find the optimal values of all decision variables satisfying all constraints and maximizing the throughput. The solution of the model results in the optimal values of the decision variables can be seen in
Table 2.
It can be seen that the feed rates of the yogurt and flavor valves are less than or equal to the maximum allowable feed rates of yogurt and flavor valves. Similarly, the solution shows that the speed of the conveyor belt is less than its maximum allowable speed, and the demand for the required number of cups can be produced within the given waiting time for customers.
Sequencing the Processing of Orders
In sequencing, the order in which cups of different volumes are processed is determined. The situation becomes complicated when a machine is heavily loaded, and many customer orders are involved. The order of processing is crucial as it affects the waiting time of the cups in queues and the idle time of the machine. One of the categories in priority sequencing rules is single-dimension rules, which determine priority based on a single aspect such as due date, processing time, or the arrival time at the machine. The data from the problem solved in
Section 2 are considered for single-dimension priority rules, e.g., Earliest Due Date (EDD), Shortest Processing Time (SPT), and First Come First Serve (FCFS), as shown in
Table 3.
The EDD rule states that the third order is the one with the closest due date. Consequently, the third order is processed first and then the second one. The sixth order, with its due date furthest, is processed last. The sequence is shown in
Table 4 along with flow time, minutes early, and minutes past due, with average values of 26.19, 0.30, and 10.99, respectively.
Under the SPT rule, the sequence starts with the order that has the shortest processing time, which is the third one, and it finishes with the order that has the longest processing time, the fourth order. The sequence of orders is shown in
Table 5. The average values of flow time, minutes early, and minutes past due for the SPT rule are 26.19, 1.73, and 12.42, respectively.
With the FCFS rule, the sequence is started with an order in which the customer orders are received. Hence, the sequence starts with the first order and ends in the sixth order, which is received at last. The sequence is shown in
Table 6 along with flow time, minutes early, and minutes past due, with average values 27.56, 0.06, and 14.54, respectively.
The setup time is assumed independent of the processing sequence in the above single-dimension rules, but this may not always be the case, and customer orders that require similar setups can reduce setup times when sequenced back-to-back. Few other assumptions considered are: no interruption in processing, deterministic processing times, and no arrival and cancellation of orders after the process is started.
5. Results and Discussion
The Laboratory of Computer Integrated Manufacturing, Industrial Engineering Department, King Saud University, Saudi Arabia, provided the basic information and data used in the computational results, and it corresponds to a real problem solved in the laboratory. The algorithm was solved using MATLAB programming language on a computer, and the results were obtained with a Core i7 and 1.99 GHz processor at a reasonable computational time.
The aim was to maximize the speed of the conveyor belt, the feed rate of the yogurt, and flavor valves for the purpose of improving the throughput. The challenging issues were to find the optimal solution for the throughput maximization within a short time by finding the maximum feed rates of yogurt and flavor valves and the maximum speed of the conveyor belt less than or equal to the allowable limits. This was an interesting study as a team of researchers of the Department of Industrial Engineering were working on the yogurt filling machine directly, and it was a convenient sample for data collection and finding the results of the model developed. It was also easy for us to trace the results after implementation.
In the previous sections, the optimal solution was found, and the results were considered for single-dimension priority rules. This section comprises two subsections. In the first, the effect of the change in the maximum value of feed rate of yogurt valve on the decision variable, Sb, En, P, Fn, and different performance measures were analyzed. While in the second subsection, the effect of change in the length of the conveyor belt on the decision variable, Sb, En, P, Fn, and different performance measures were investigated.
5.1. The Effect of Change in Yogurt Flow Rate at Decision Variable, Parameter, Different Times and Performance Measures
The effect of change in yogurt feed rate at the flavor feed rate, speed of conveyor belt, waiting time of the last cup of an order for processing, the processing time for a cup, total processing time on a cup, and performance measures (average flow time, average minutes early, average minutes past due) was analyzed in this subsection. The flow rate of the flavor valve changed from 51 mL/sec with an increment of 1 unit 55 mL/sec. During this change, the length between any two points (placement to yogurt filling, yogurt filling to flavor filling, and flavor filling to leaving) is considered 30 cm. The maximum speed of the conveyor belt is 10 cm/sec.
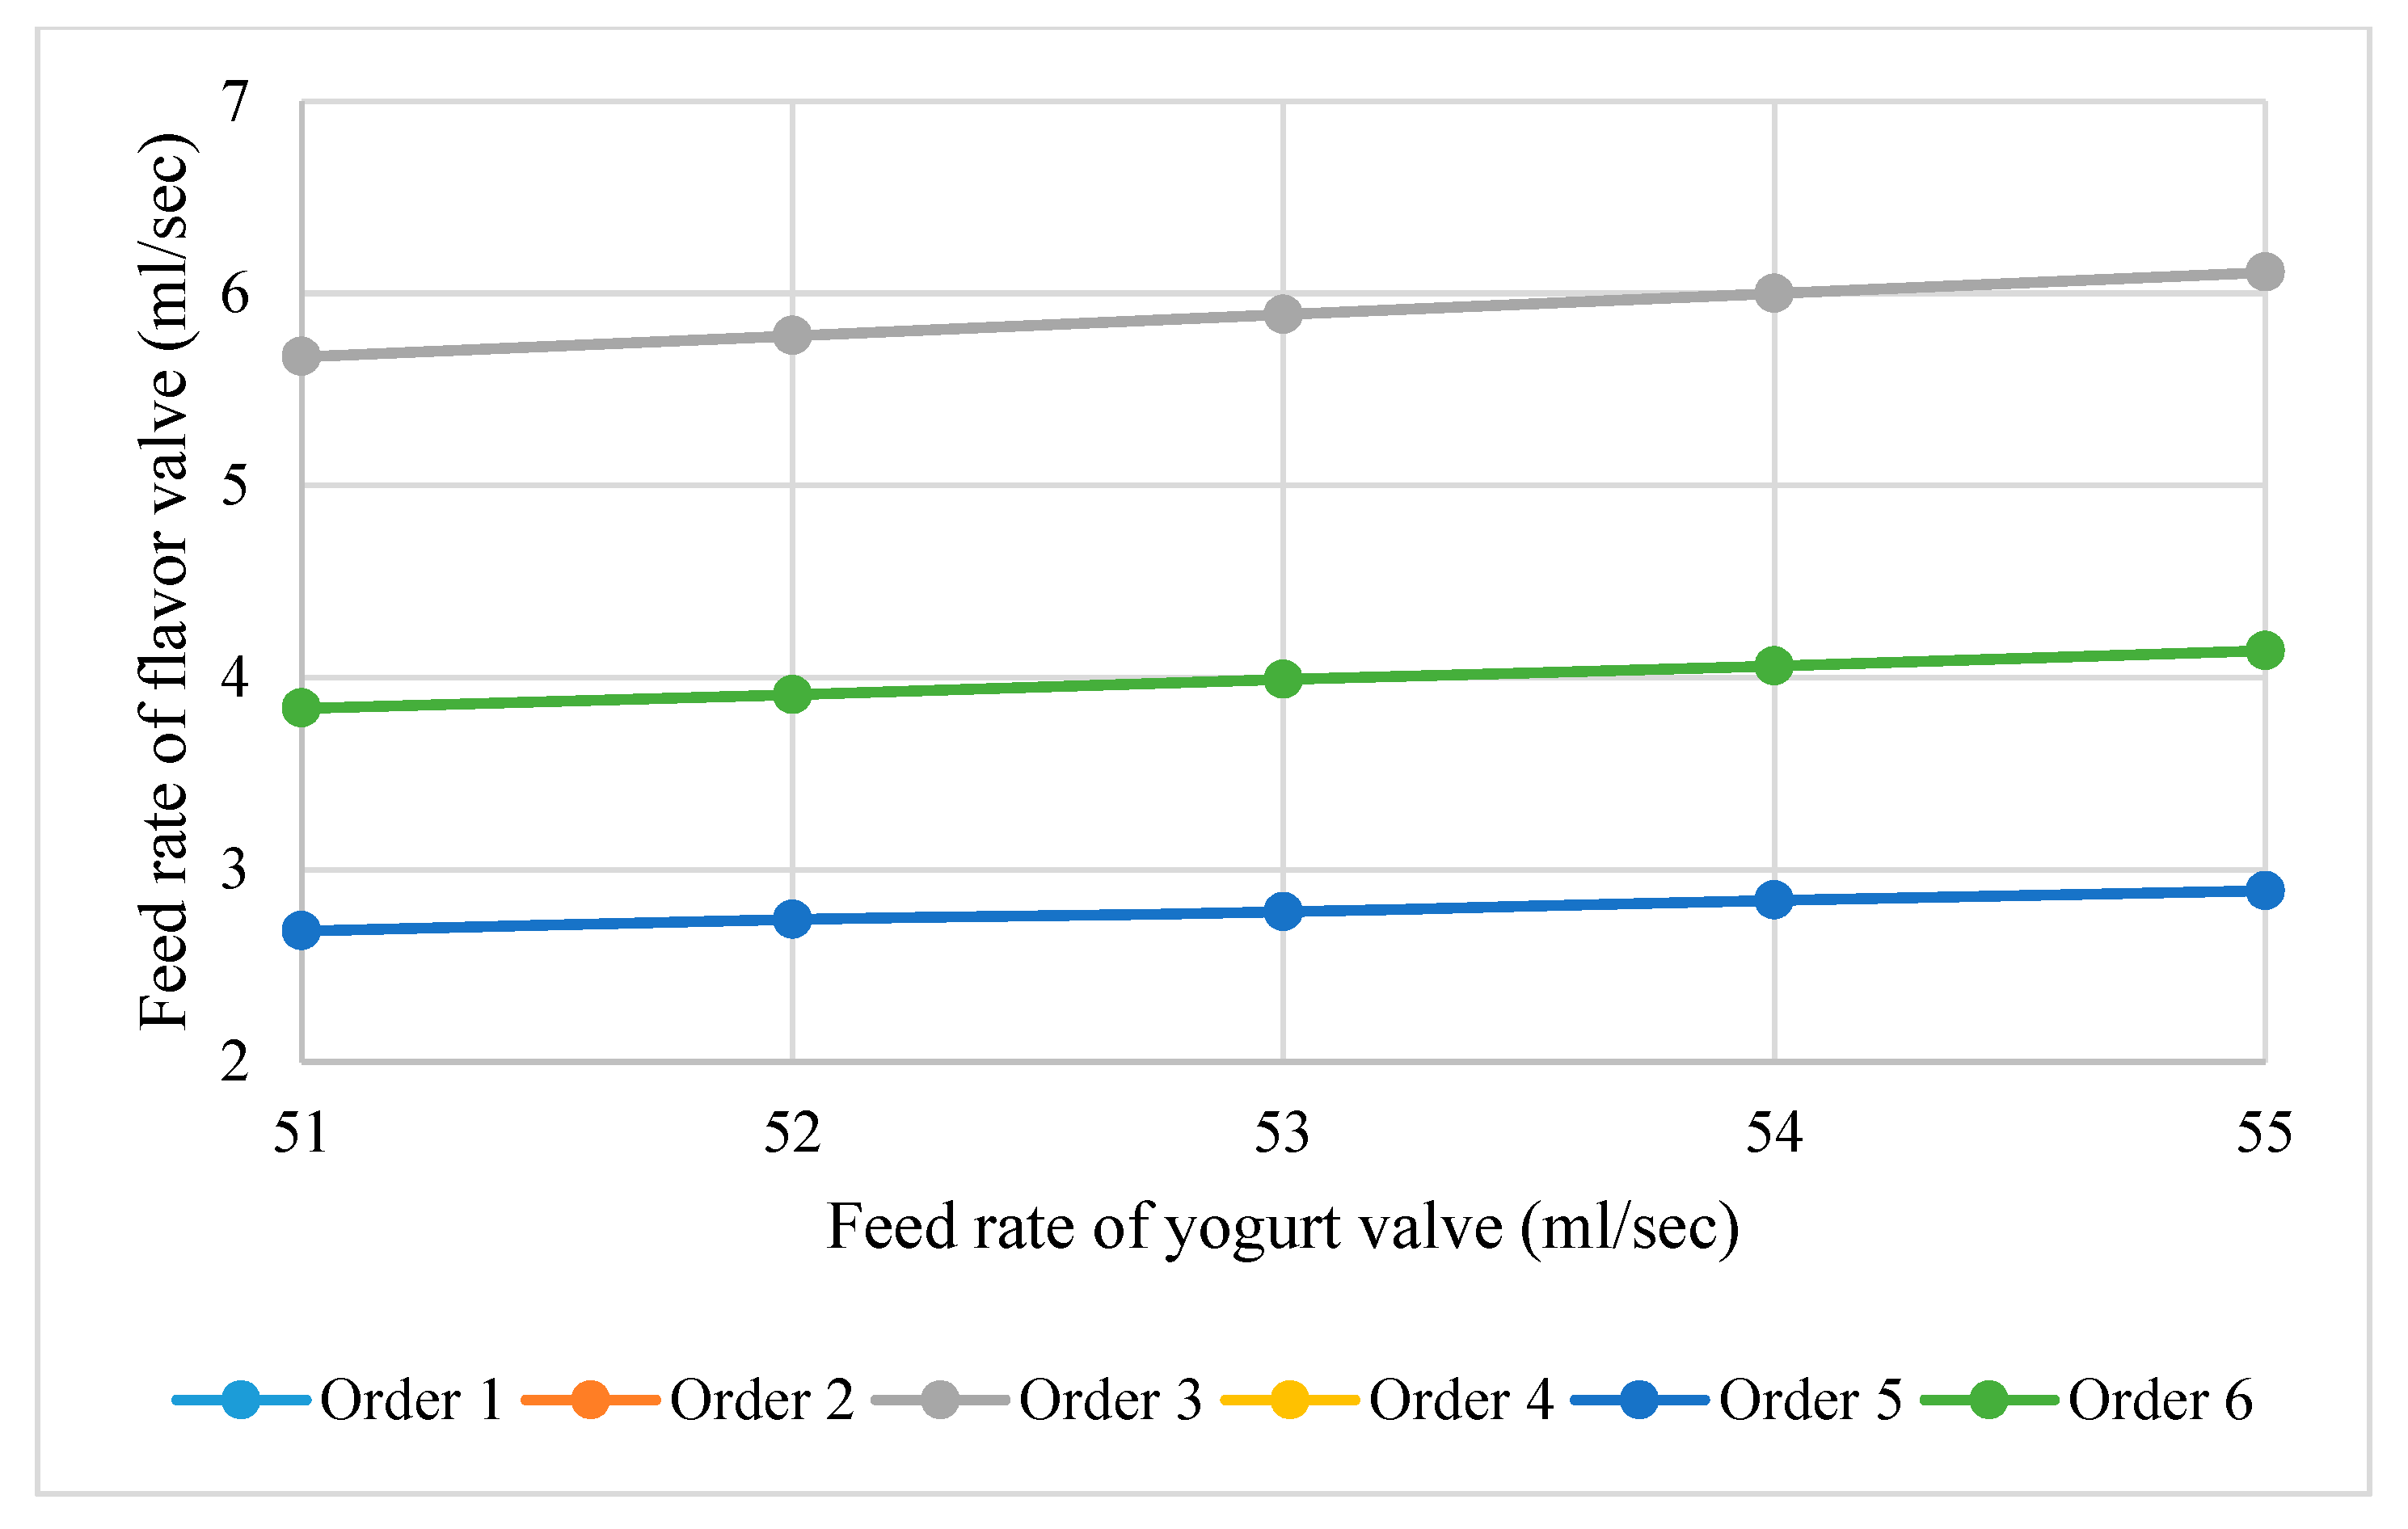
As depicted in
Figure 4, with an increase in the feed rate of yogurt, the flavor flow rate increases linearly. It can be observed that with the change in the yogurt feed rate, changes in the flavor flow rate of orders 1 and 6, 2 and 3, and 4 and 5 are equal. Moreover, due to the higher ratio of the flavor of yogurt in a required volume of a cup, the change in the feed rate of flavor in the case of orders 2 and 3 is greater than 1 and 6, and 4 and 5.
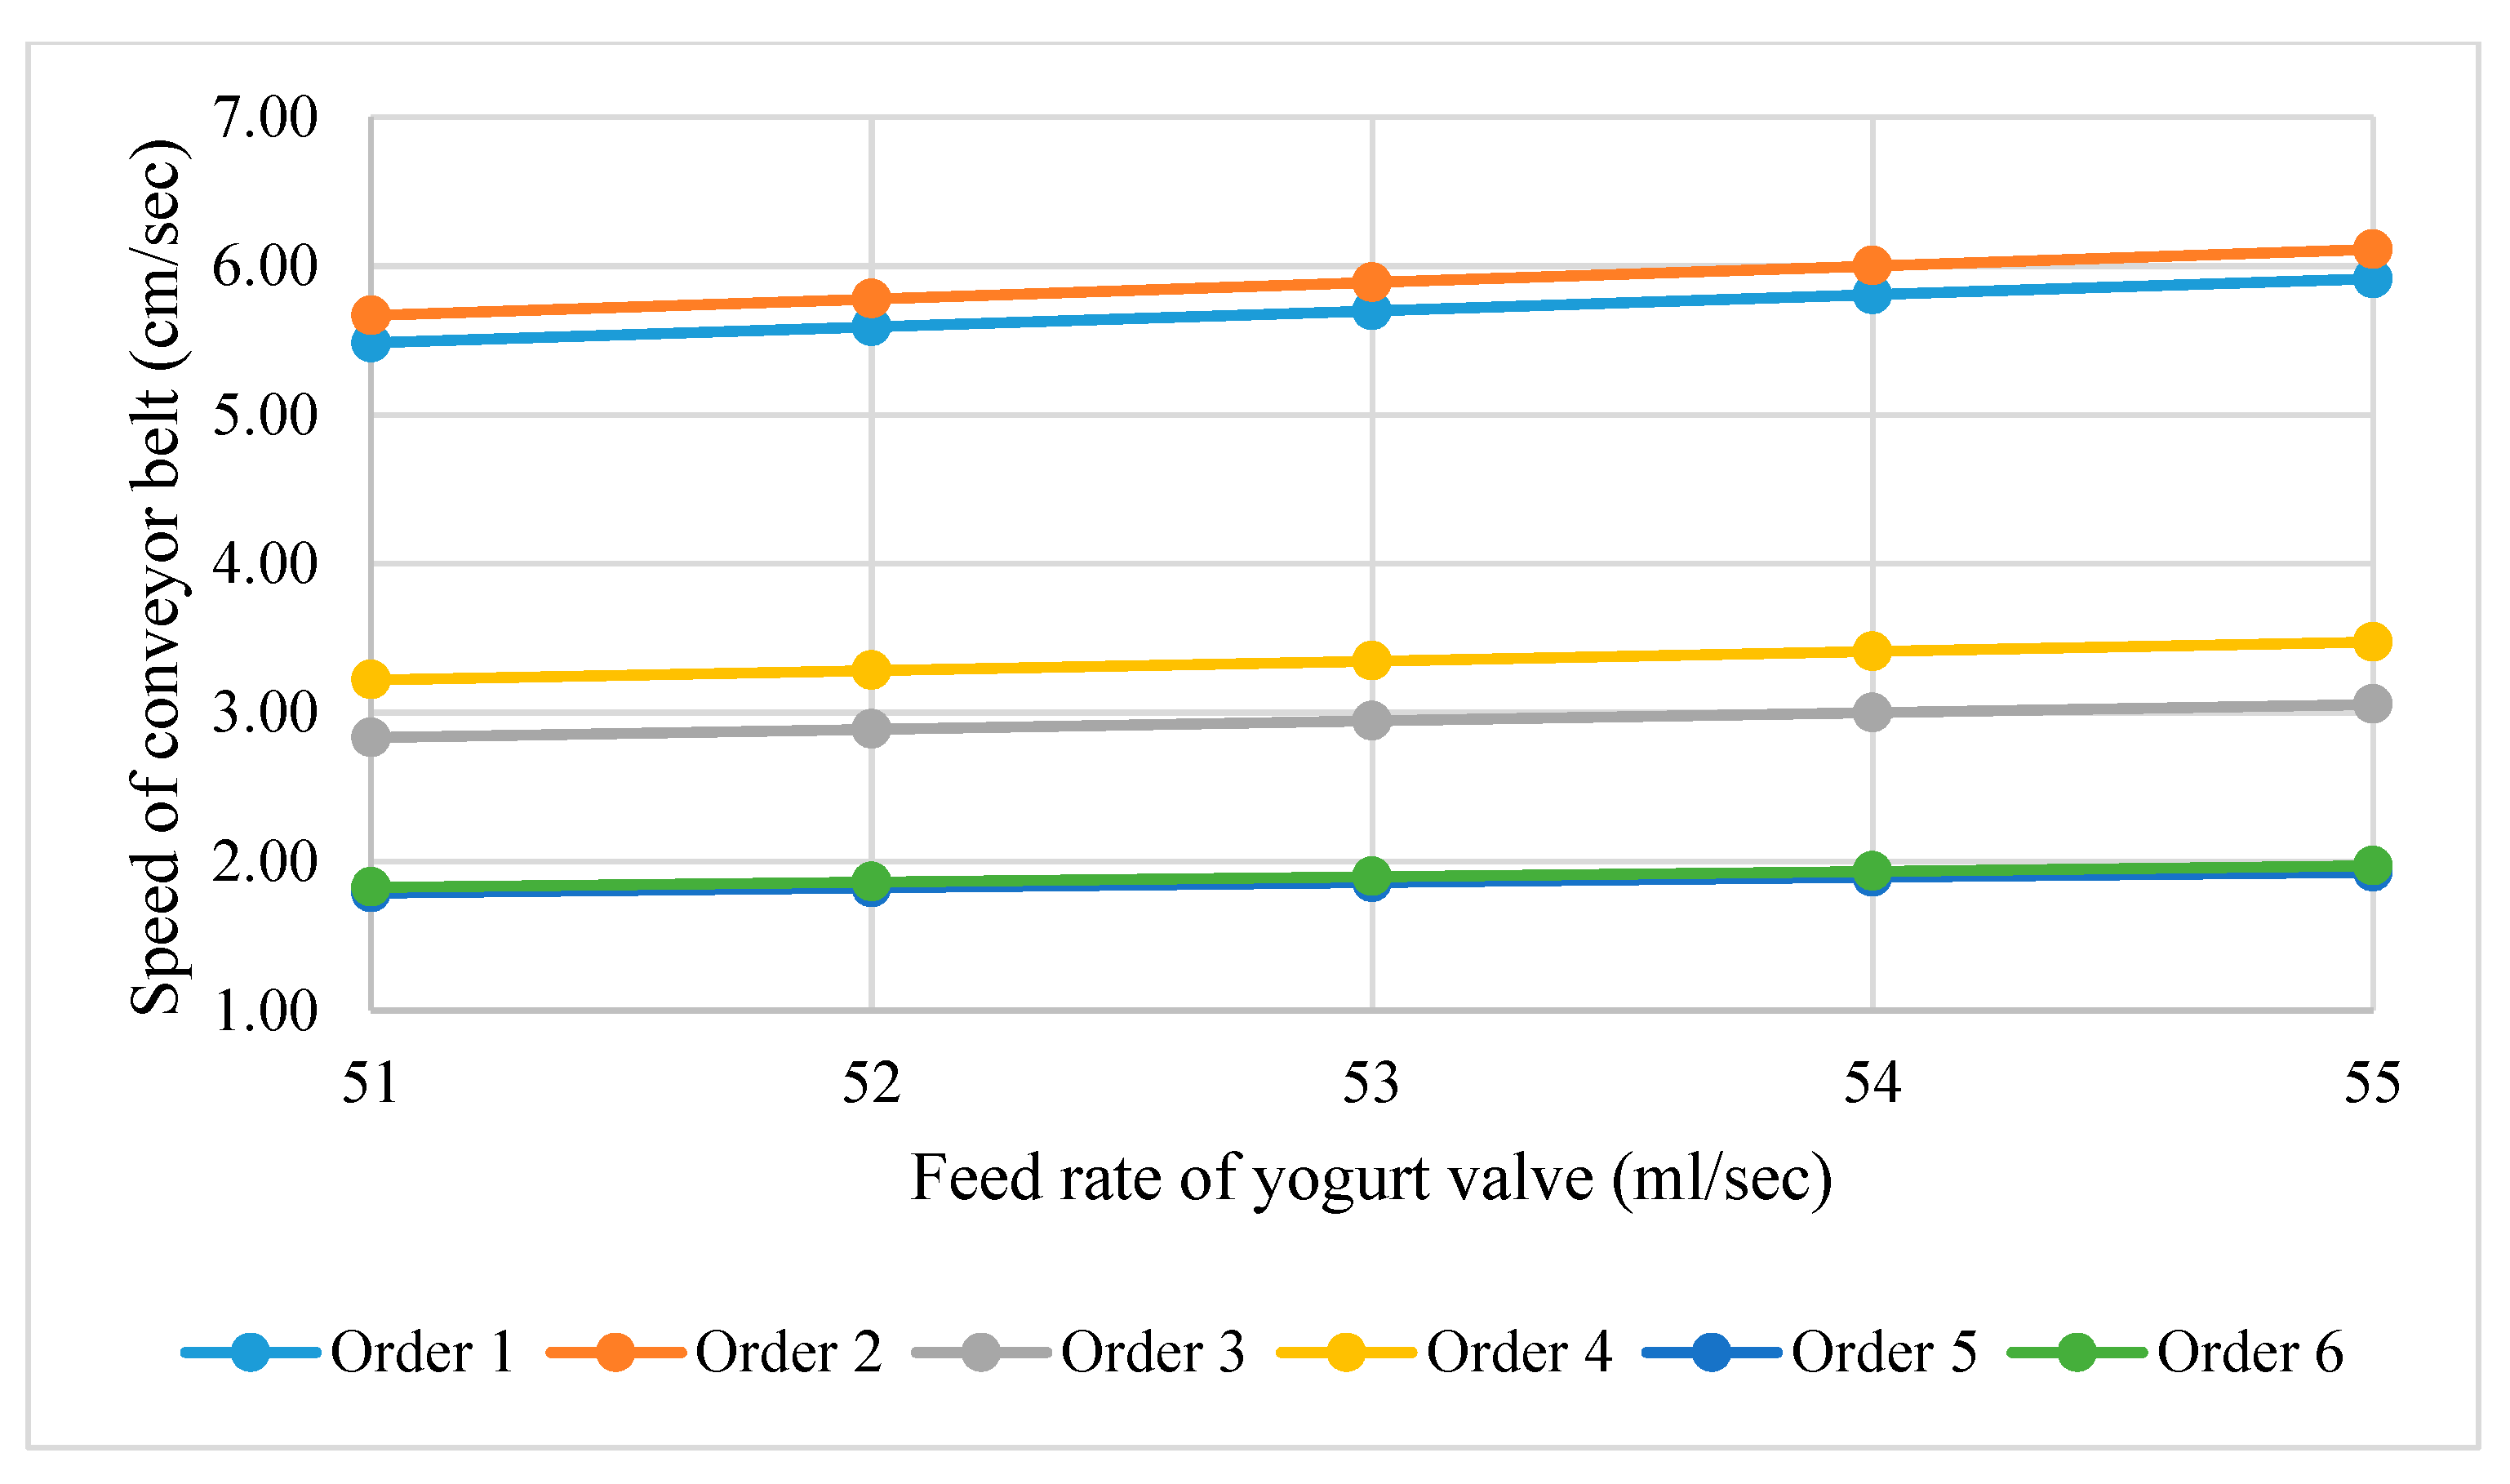
As shown in
Figure 5, an increase in the feed rate of the yogurt valve increases the speed of the conveyor belt linearly. The cups move quickly between any two points on the conveyor belt at the feed rate of the yogurt valve is increased. The required volumes of orders 1 and 2, 3 and 4, and 5 and 6 are close to each other, and hence their speeds are changing with almost equal rates. An inverse relation was found between the speed of the conveyor belt and the required volume of a cup. The speed of the conveyor belt decreases with the increase in the required volume of a cup.
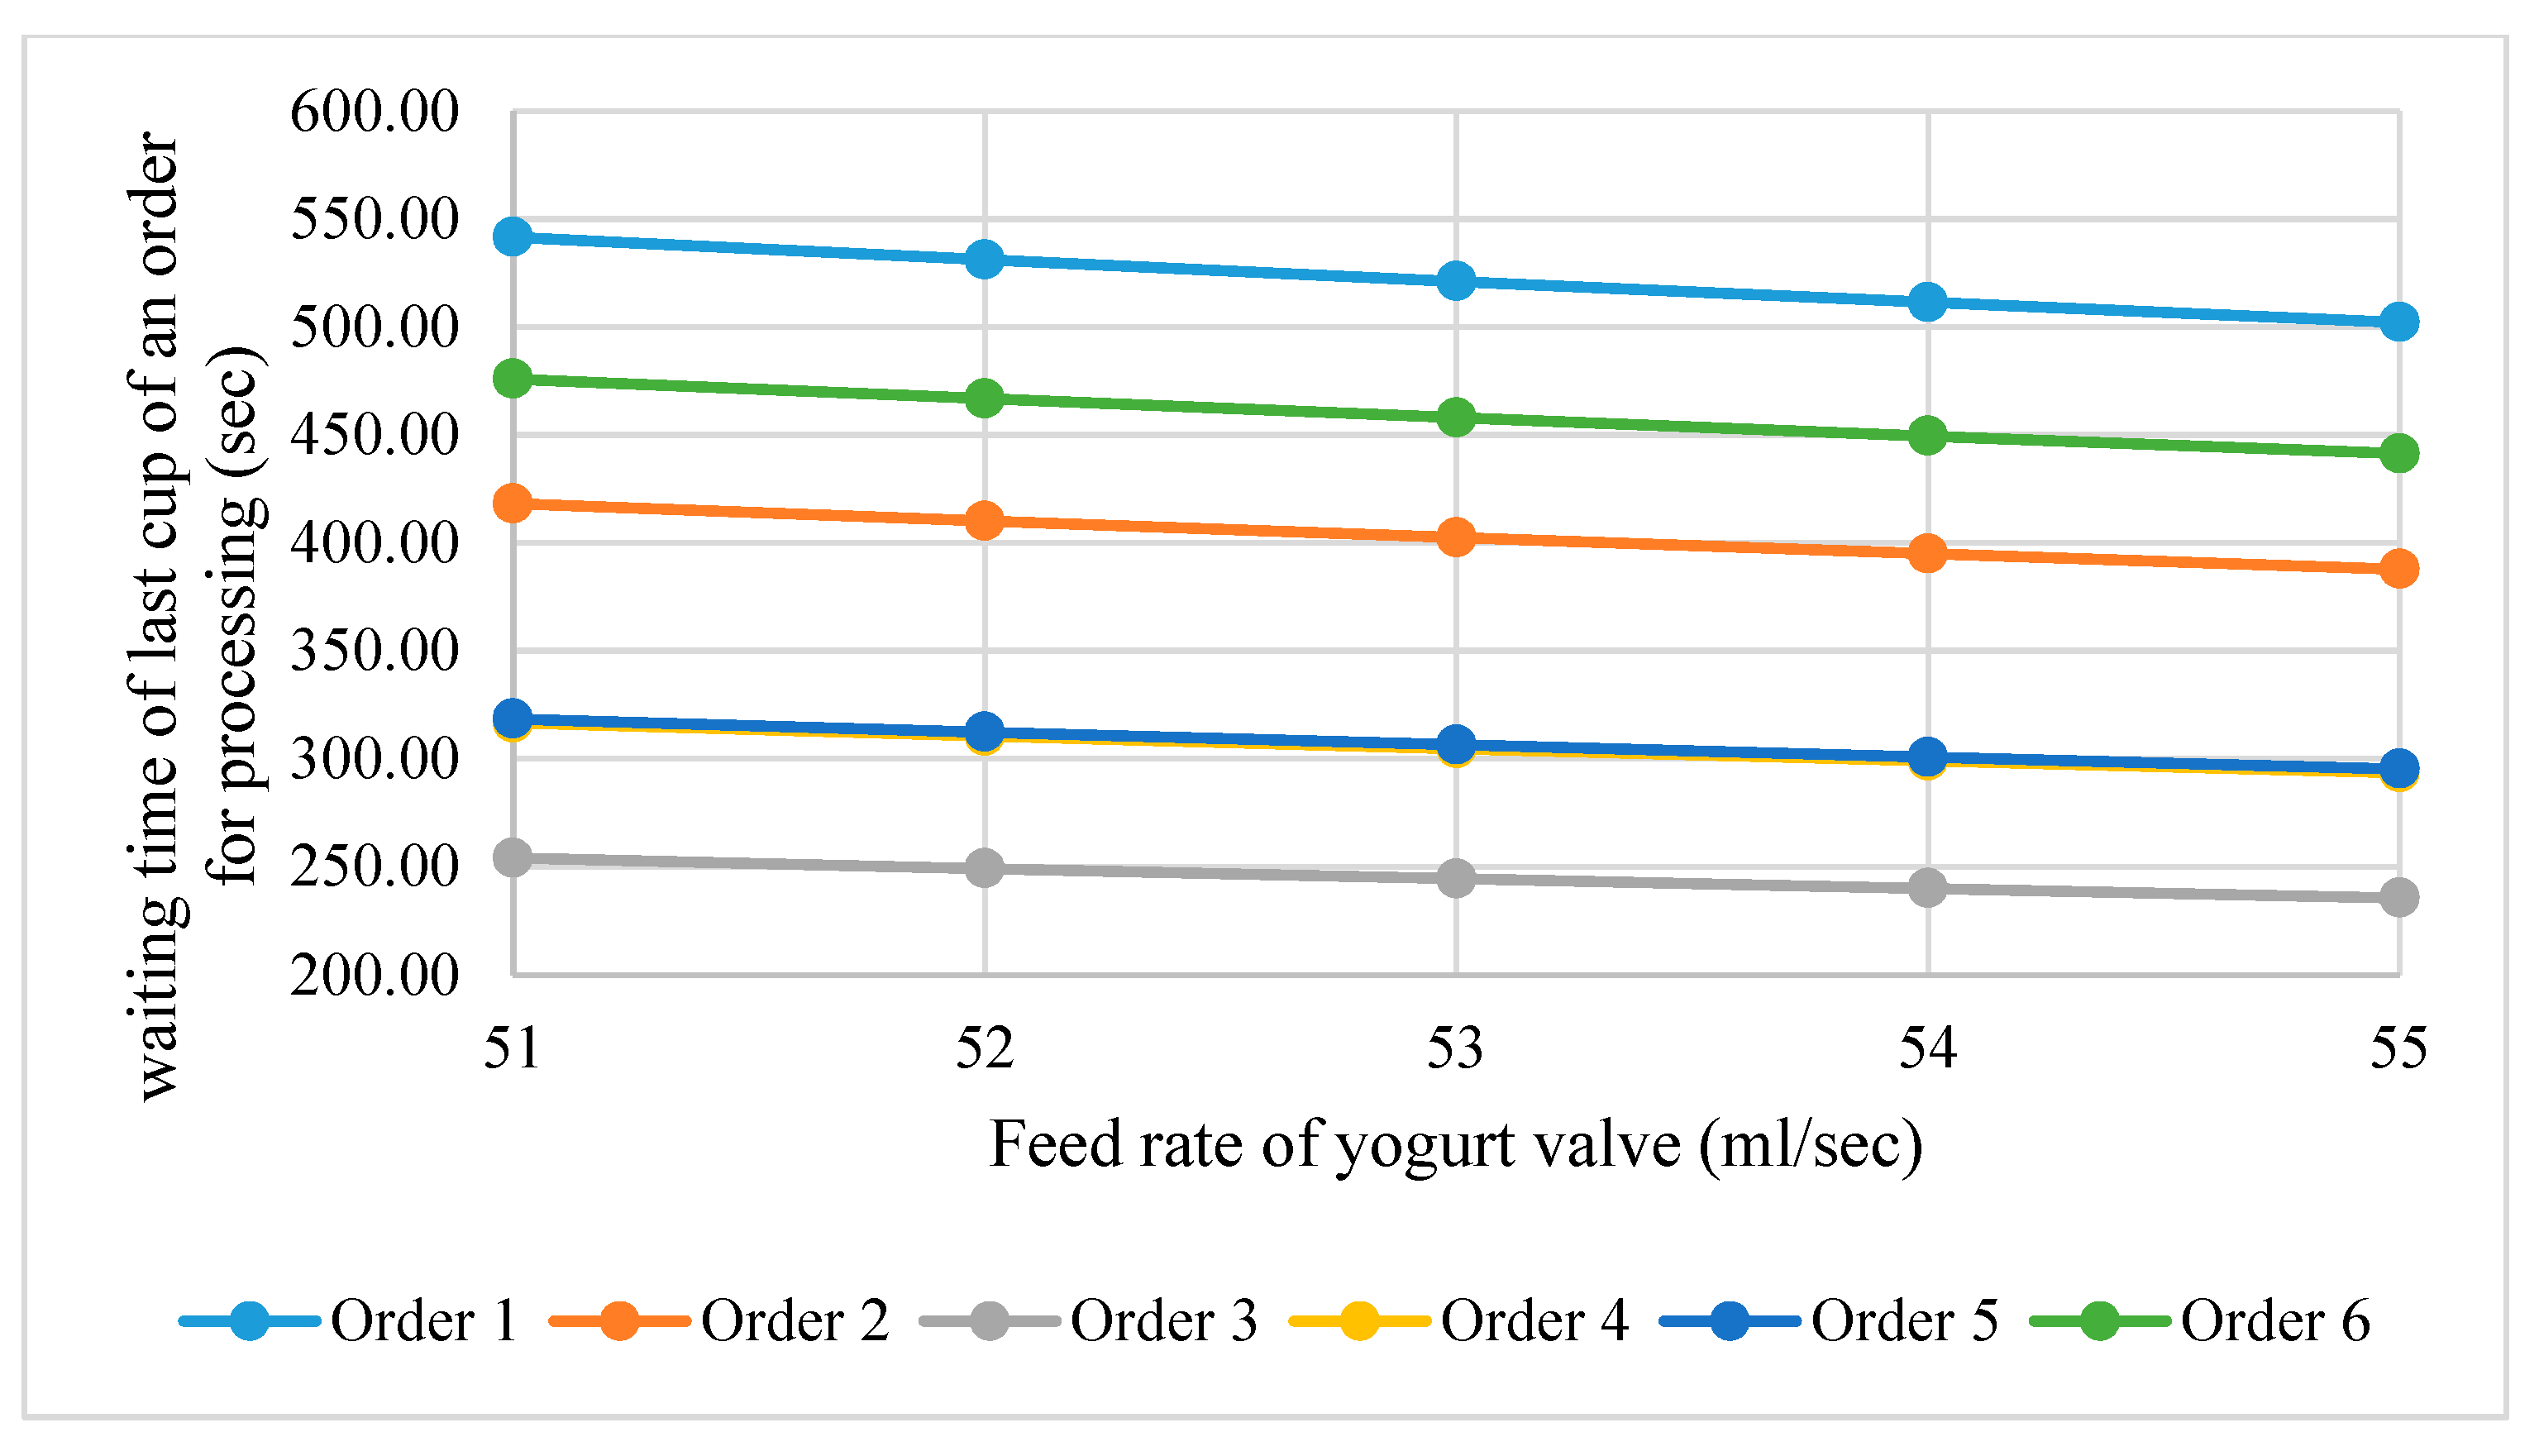
To increase the feed rate of the yogurt valve, the waiting time of the last cup of an order for processing decreases linearly, as can be seen in
Figure 6. There is a higher decrease per unit change in the feed rate of the yogurt valve in orders 1 and 6 compared to the other orders. In the case of order 1, compared to other orders, time depends on the required number of cups and volume. The decrease in time per unit change in the feed rate of yogurt for all other orders are is almost the same.
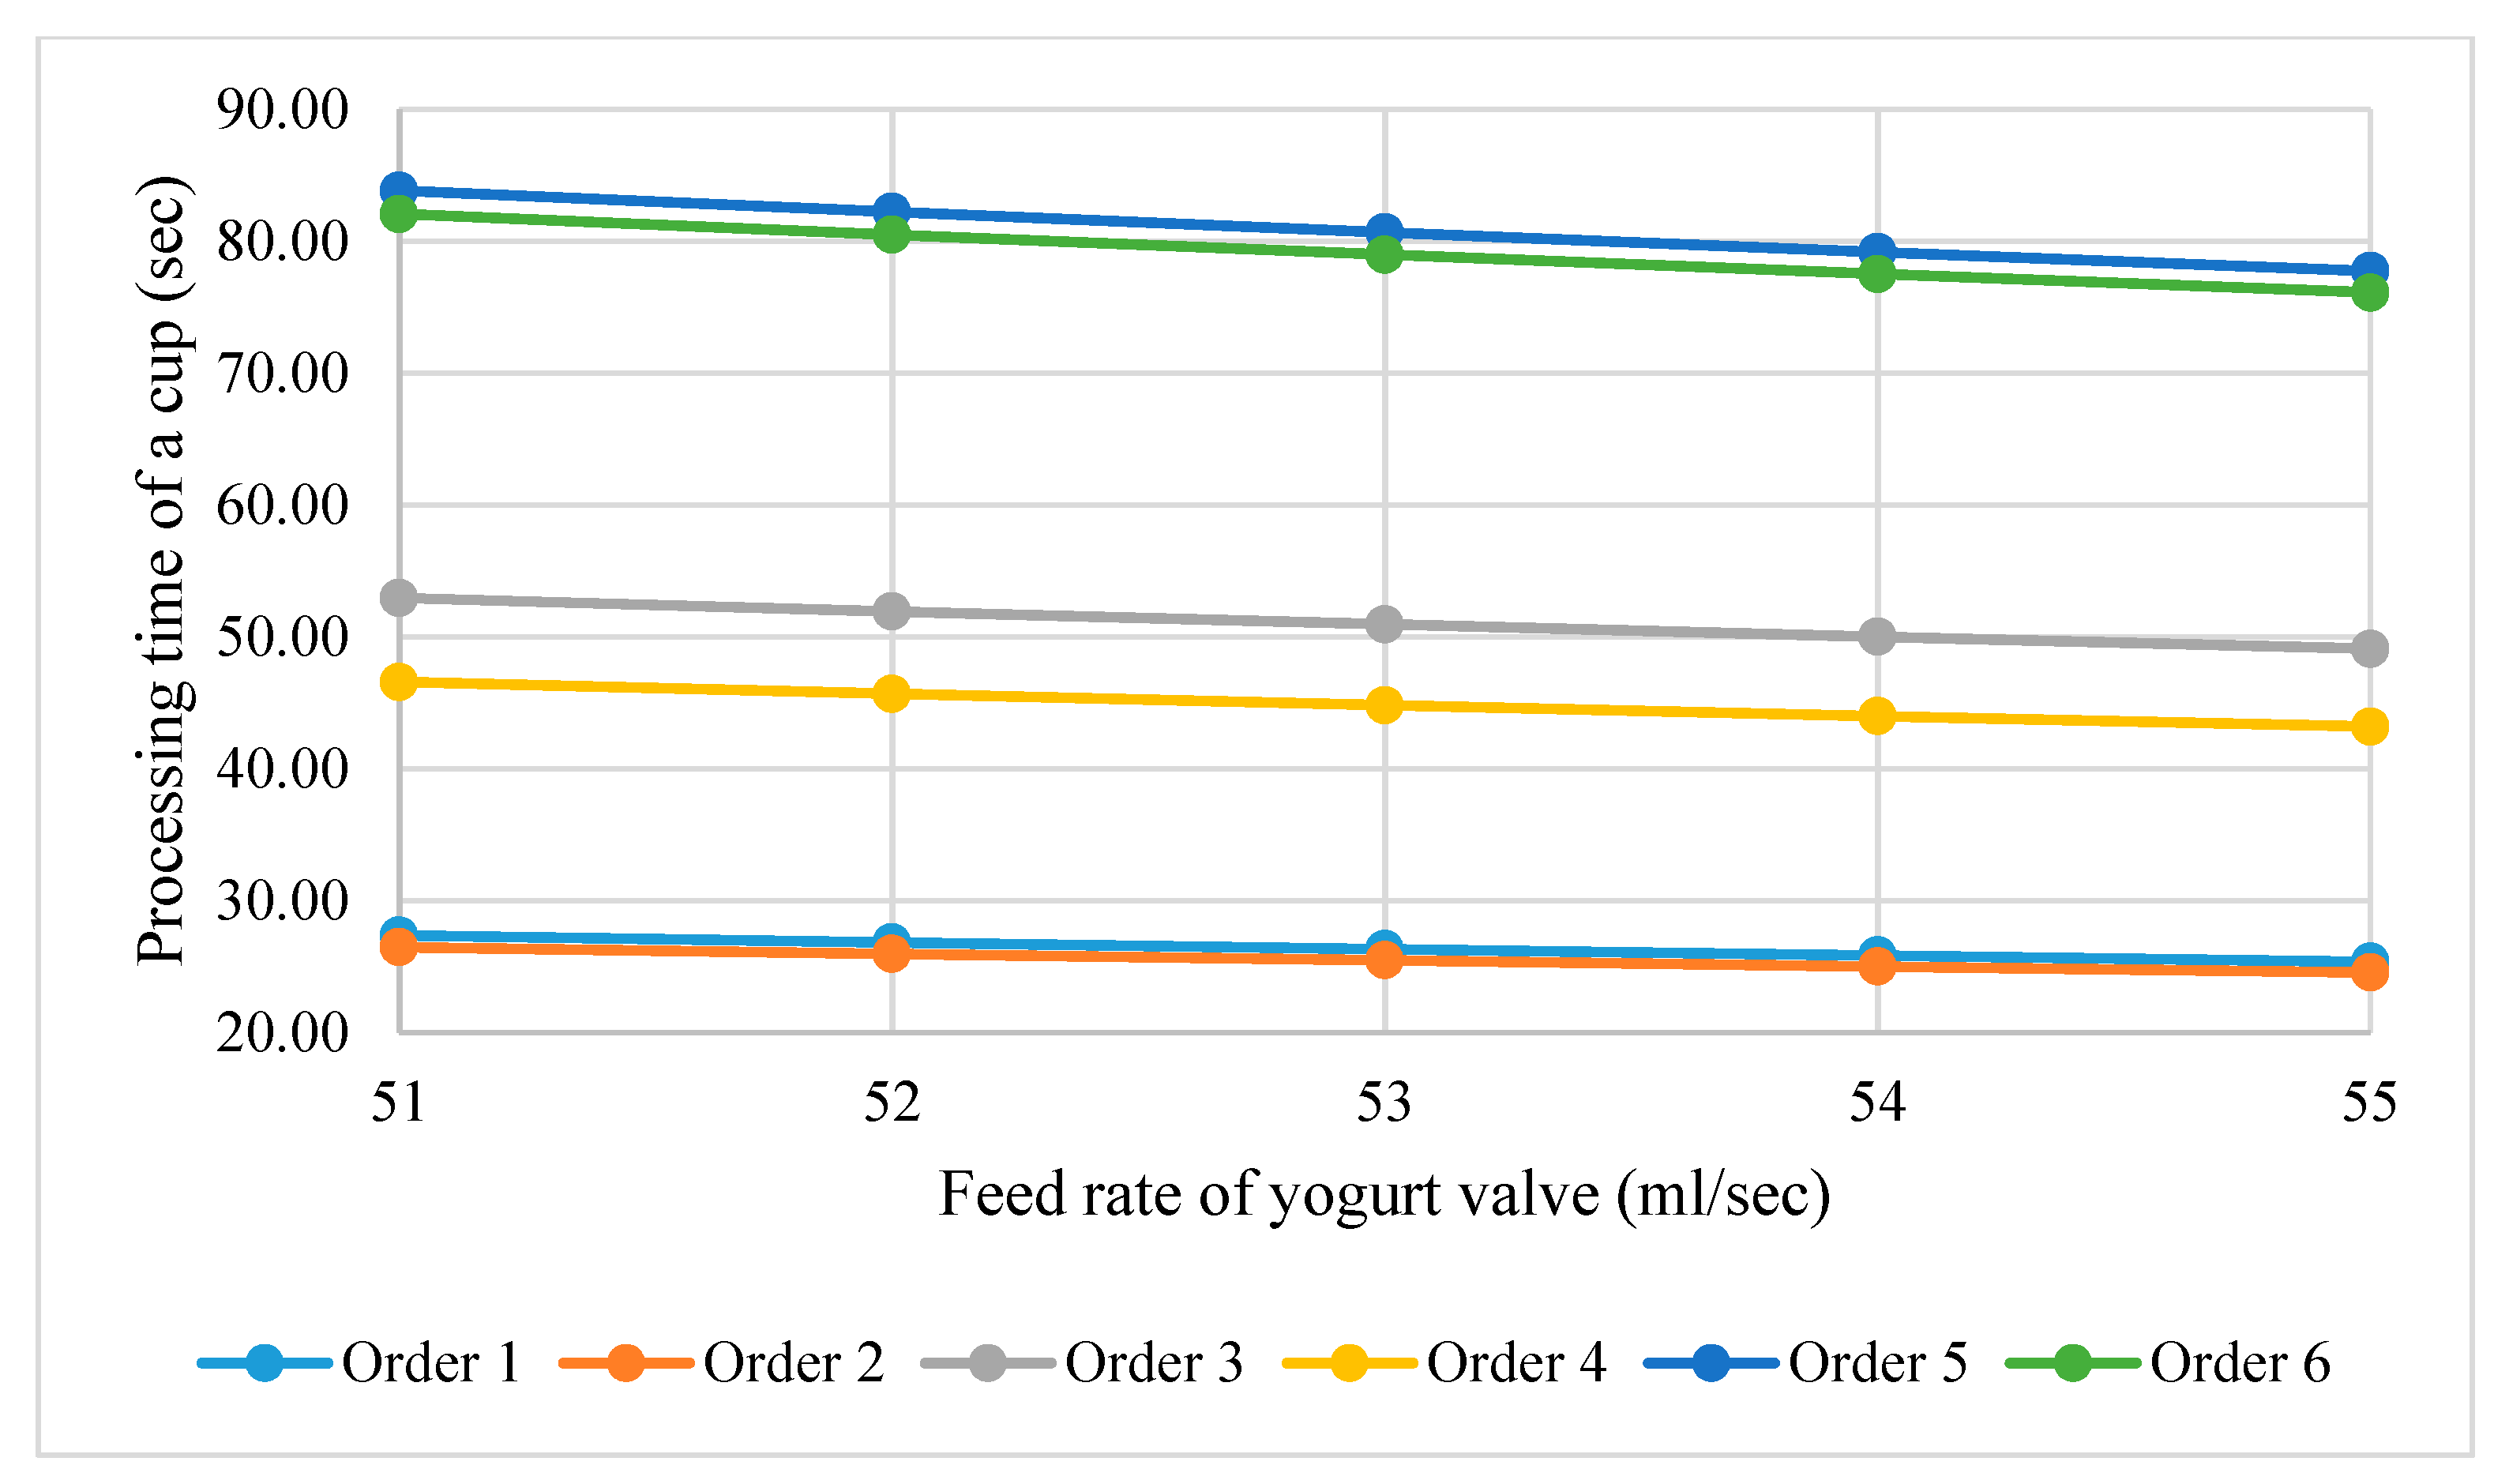
With an increase in the feed rate of the yogurt valve, the processing time for a cup decreases, as depicted in
Figure 7. It decreases linearly with the increase in the feed rate of the yogurt valve. It can be noted that for large volumes of cups (orders 5 and 6), there is more decrease per unit change in the feed rate of the yogurt valve, while for small volumes (orders 1 and 2), the decrease per unit change in the feed rate is small.
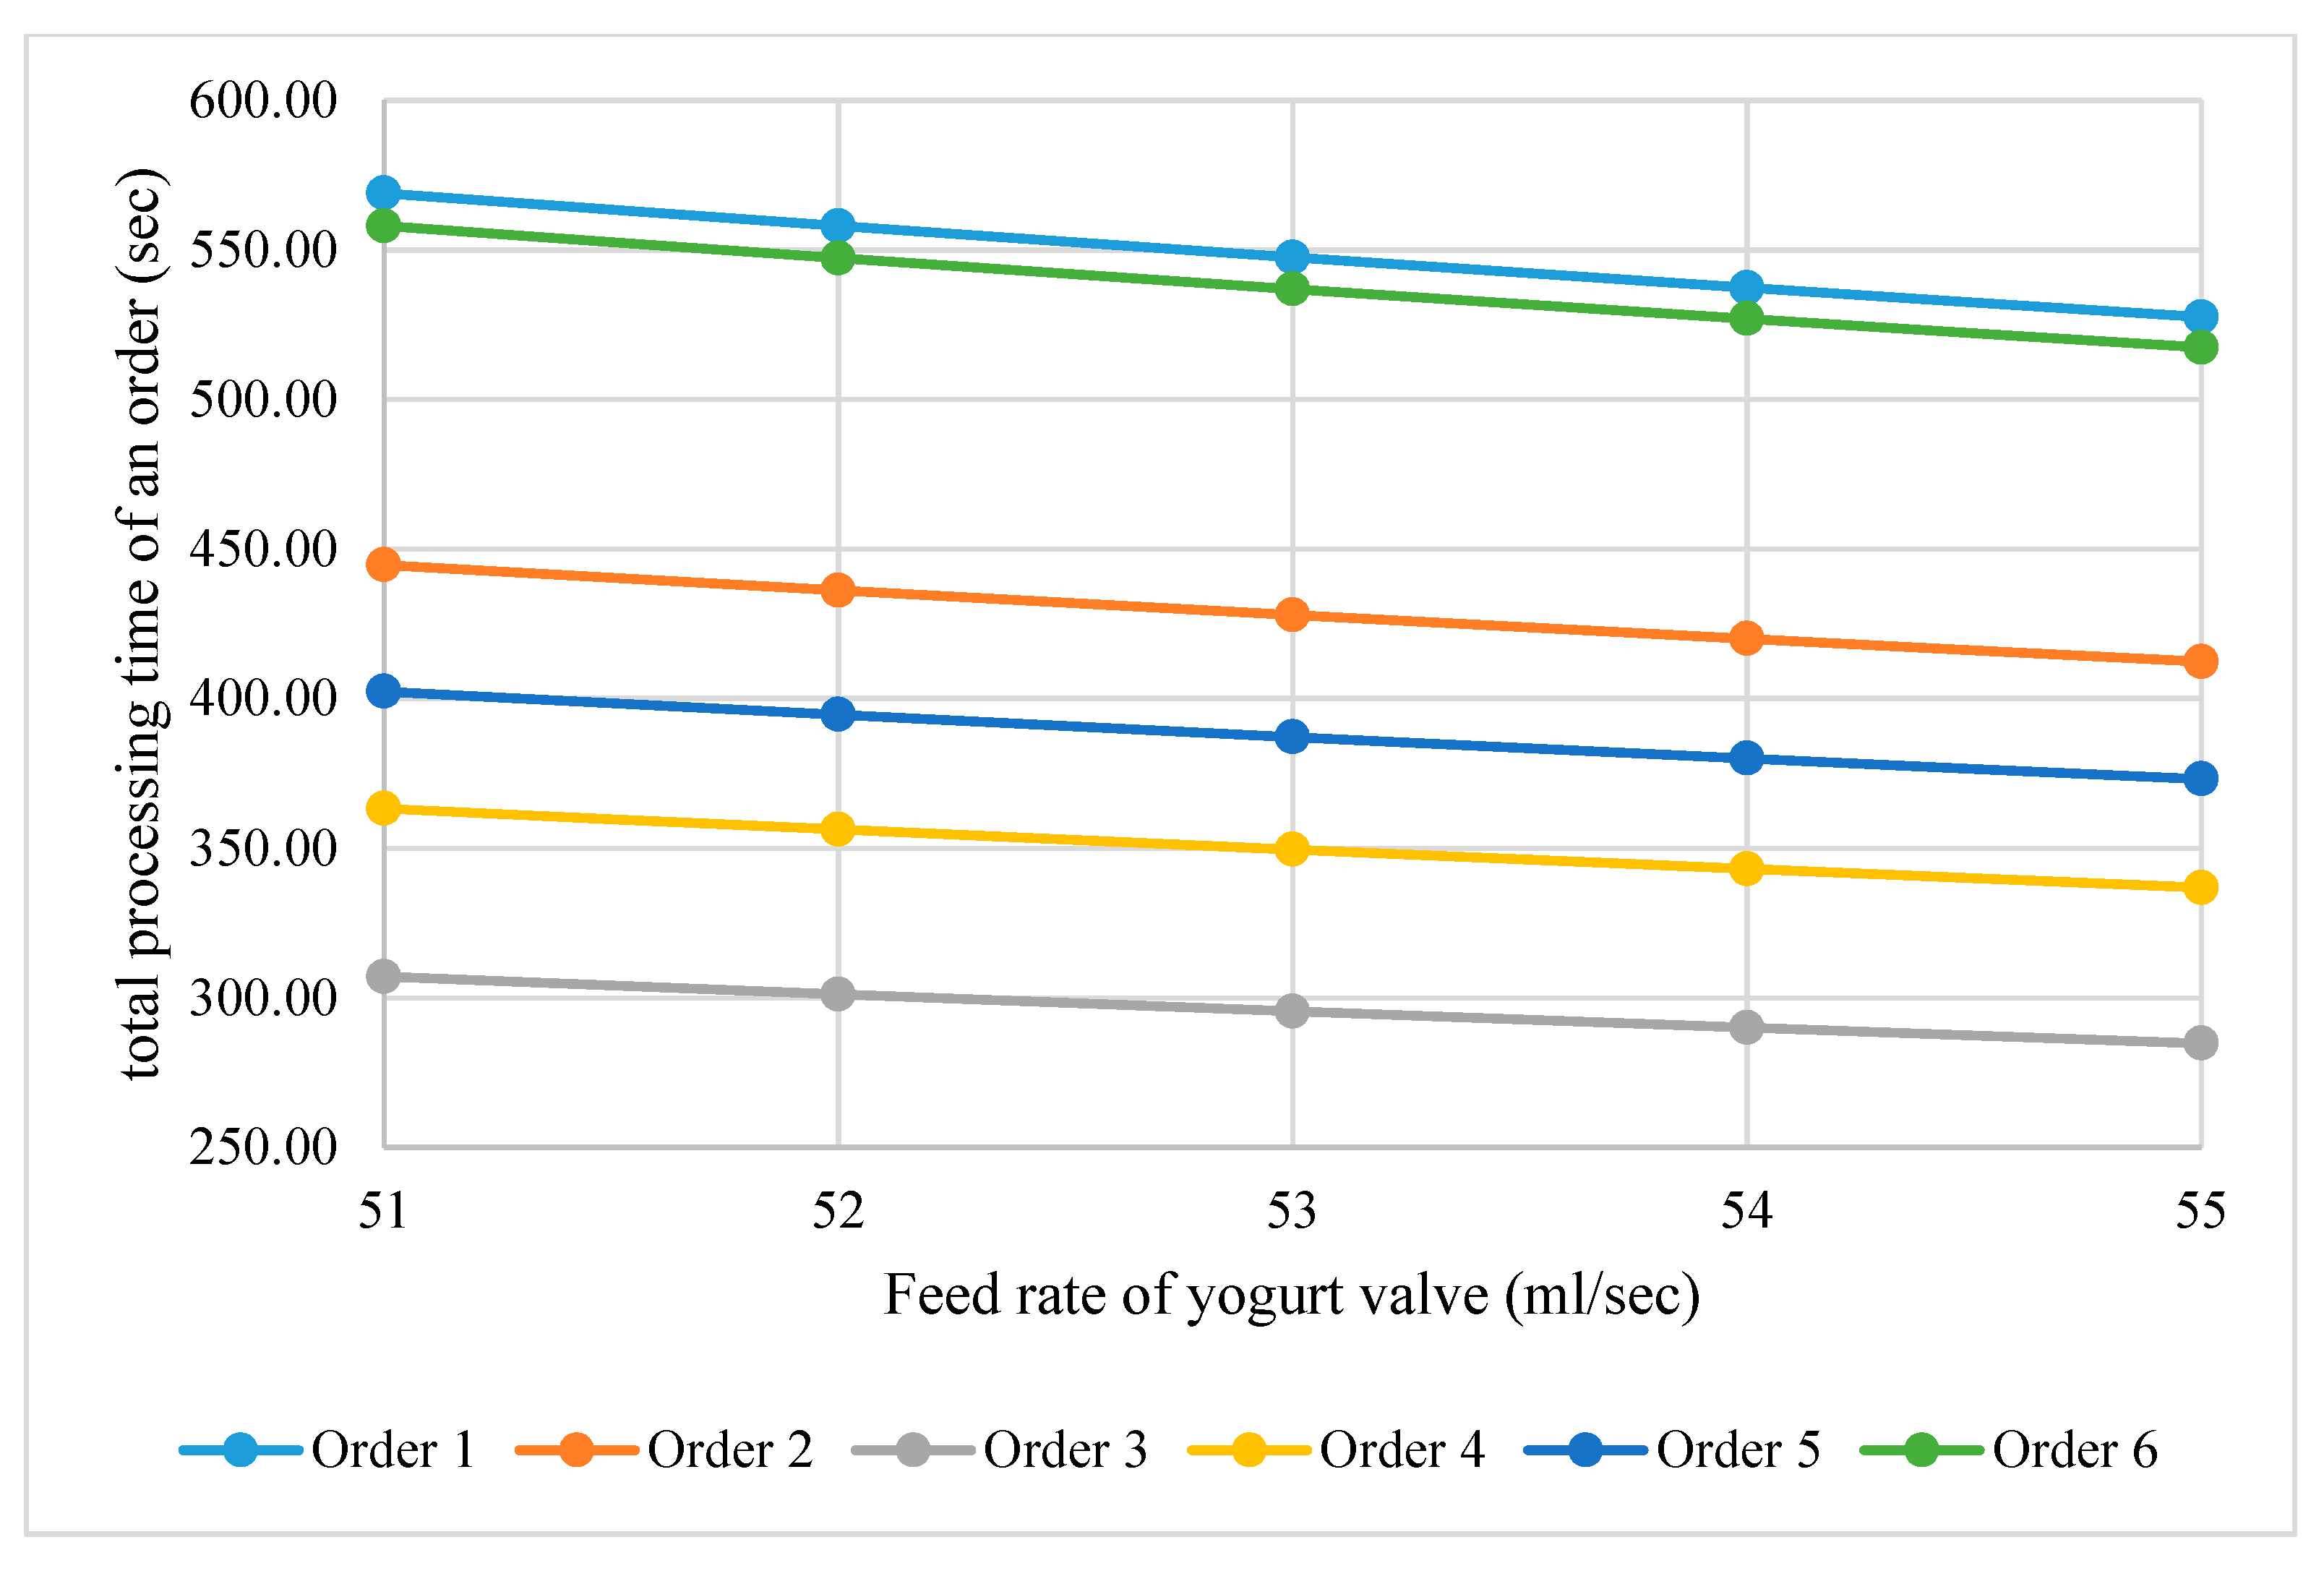
Increasing the feed rate of the yogurt valve decreases the total processing time on a cup, as shown in
Figure 8, as filling a cup takes less time when the feed rate of yogurt is increasing. The processing time on the cup decreases linearly with an increase in feed rate. For orders 1 and 6, the decrease per unit change in the feed rate of yogurt is more than other orders. This greater change is due to a higher number of required cups (as in the case of order 1) and also due to a higher volume of required cups (as in the case of order 6).
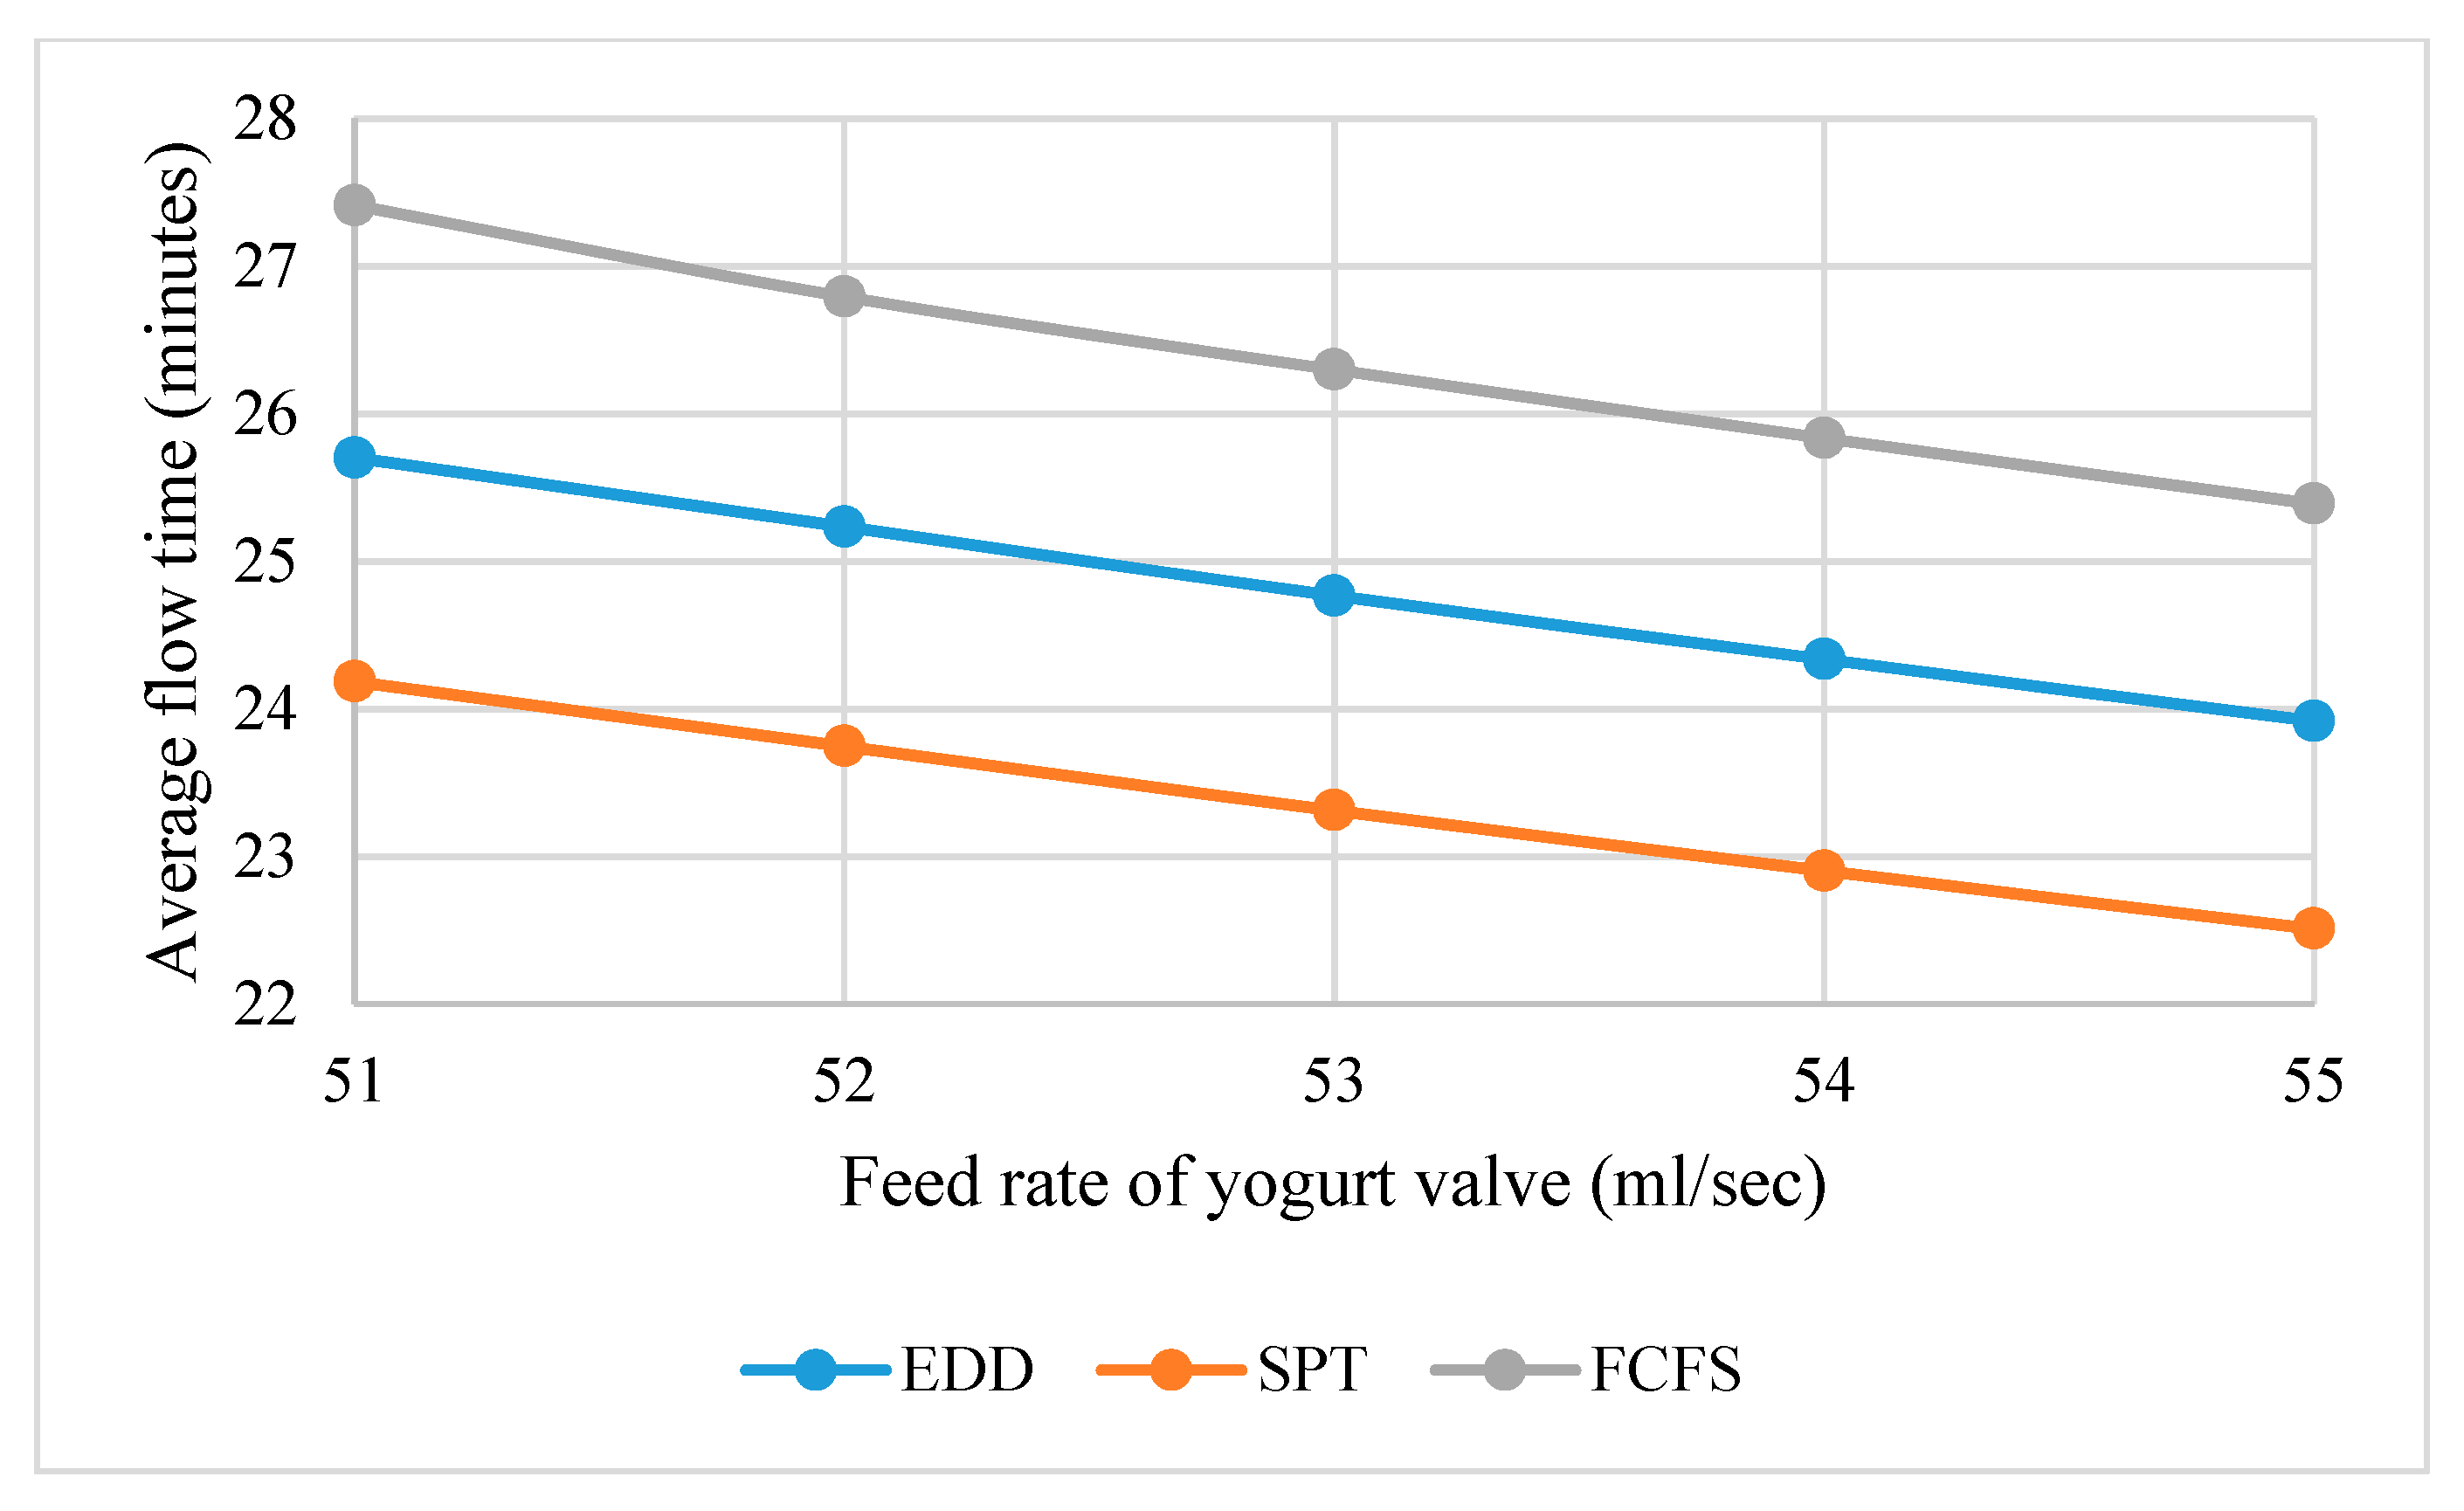
The effect of changes in the yogurt feed rate on the three performance measures (average flow time, average minutes early, and average minutes past due) was analyzed. The change in the average flow time per unit change in the yogurt feed rate is almost the same in all one-dimensional rules as given in
Figure 9. The average flow time in the case of SPT is lower than EDD and FCFS for different values of the feed rate of the yogurt valve.
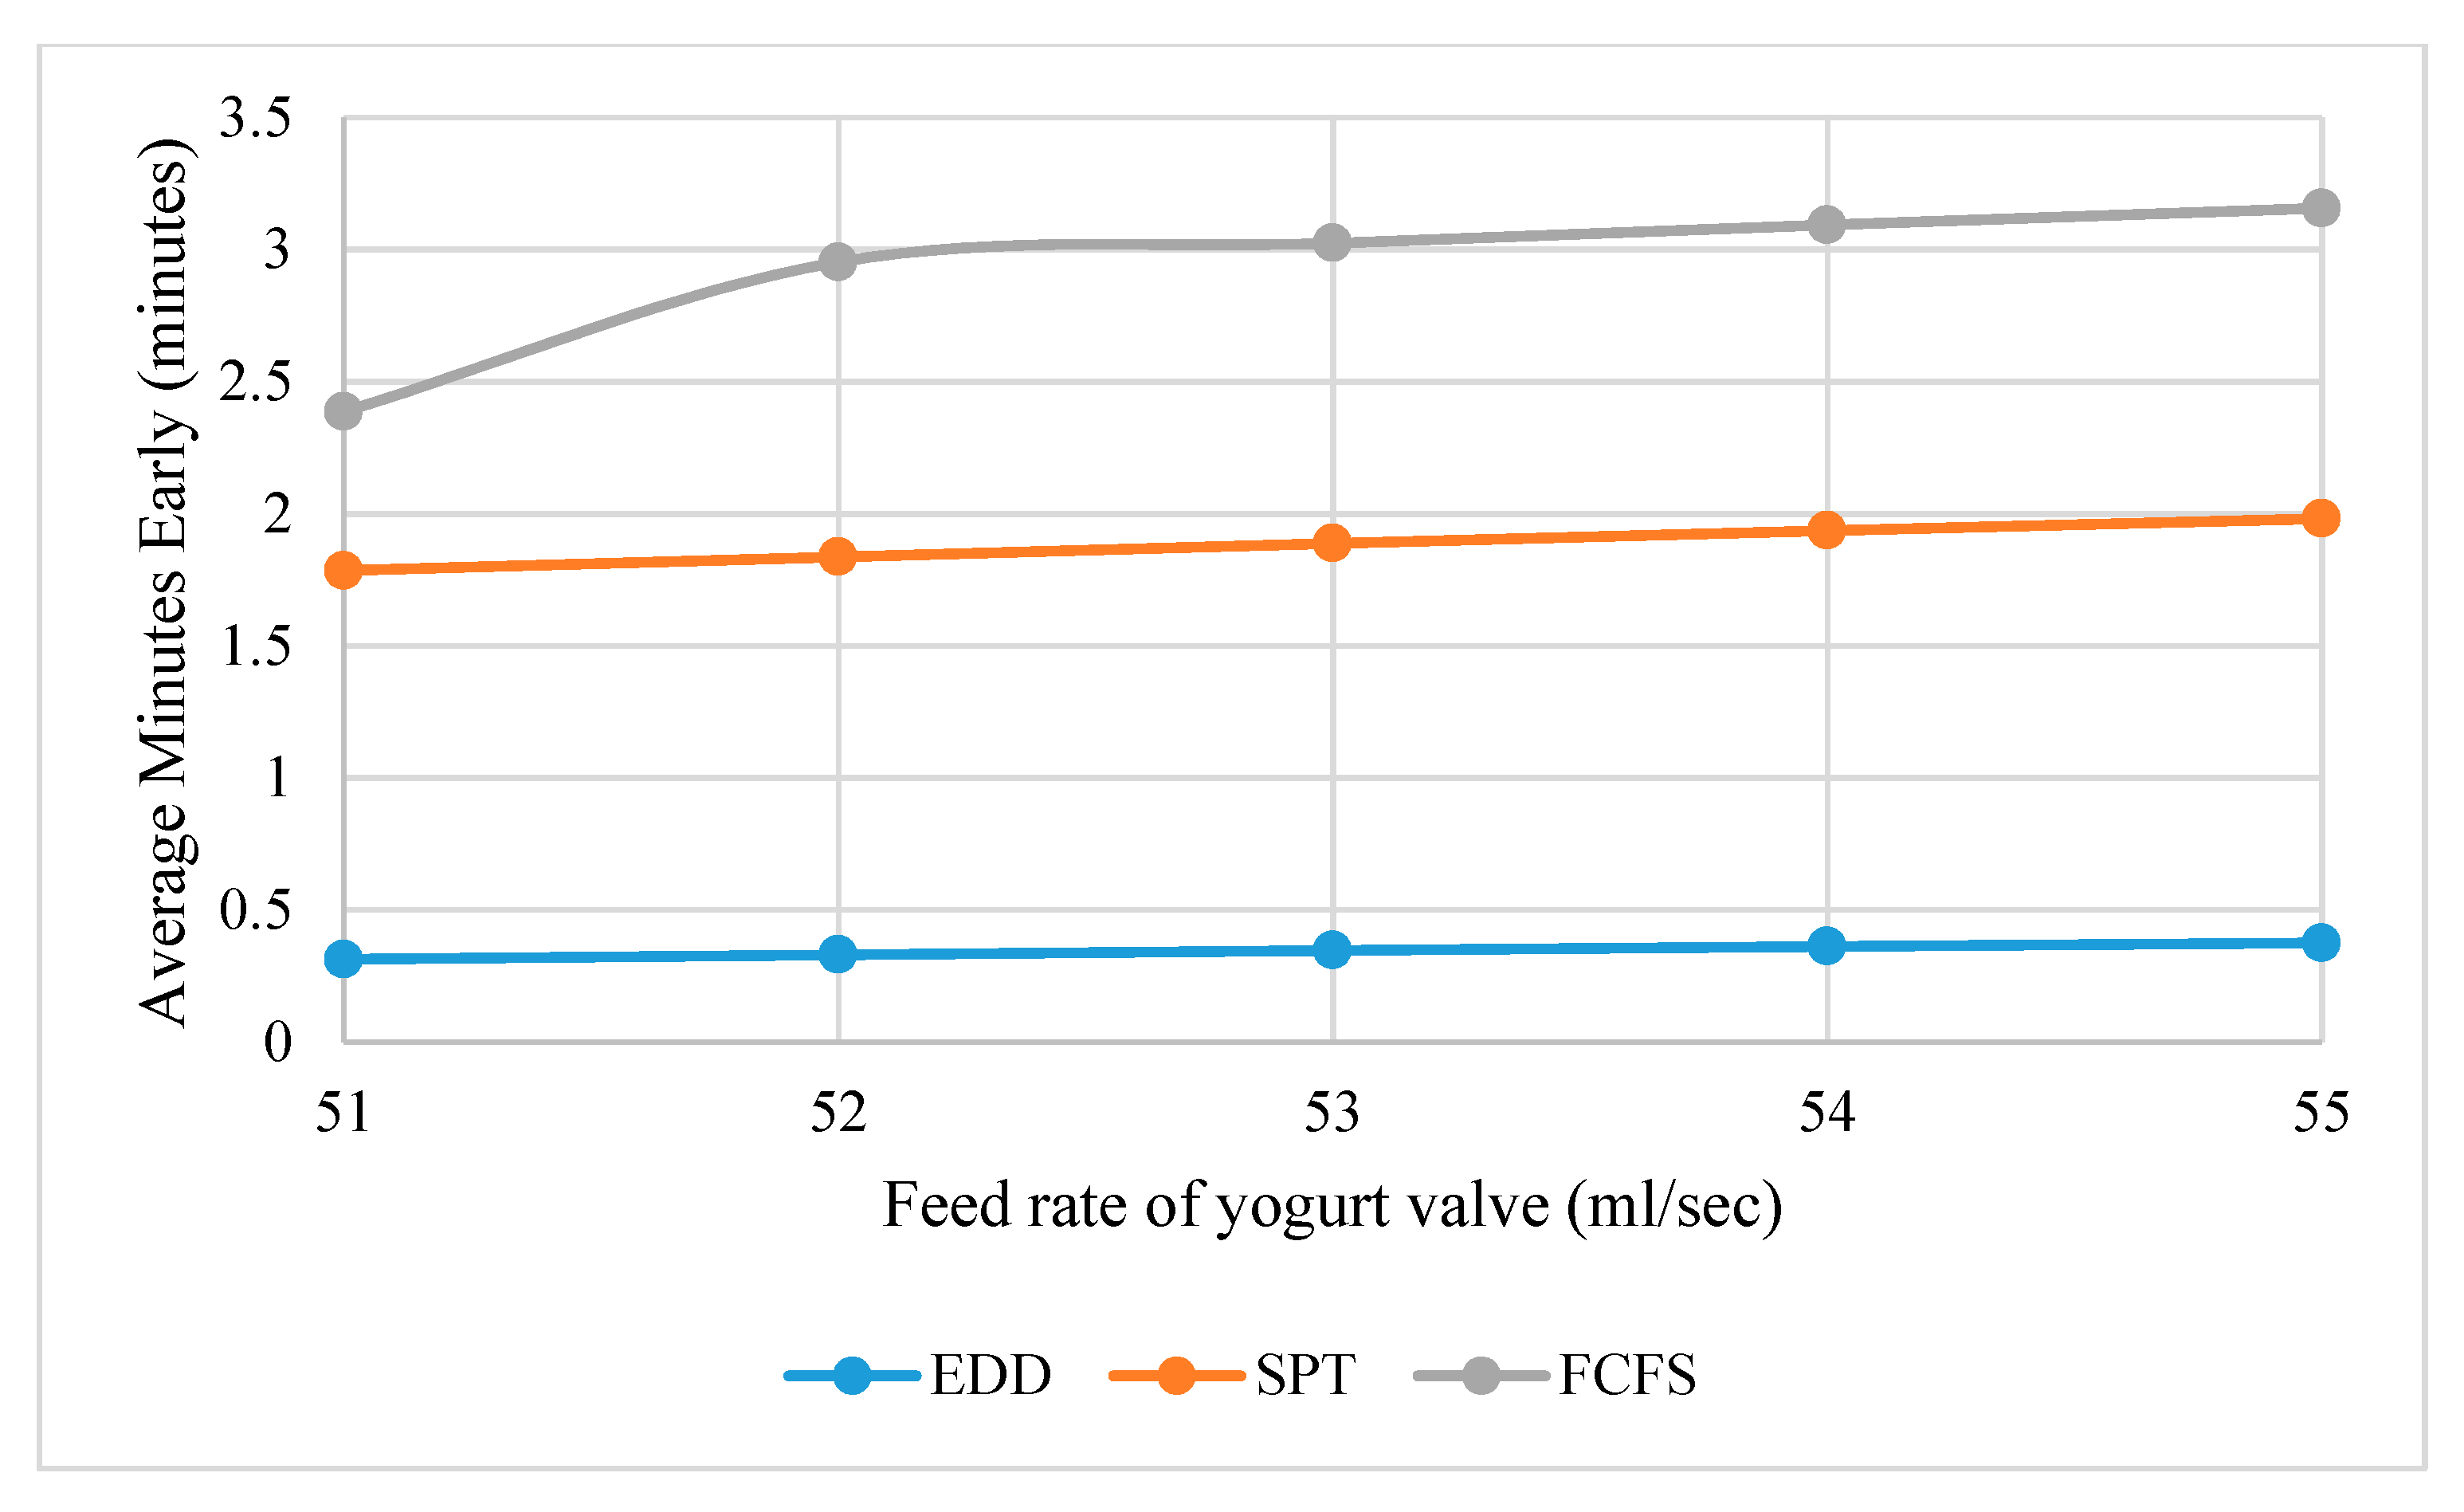
The second performance measure (average minutes early) was investigated, and it increases with the increase in the feed rate of the yogurt valve, as shown in
Figure 10. The average minutes early, in the case of FCFS, is higher than SPT and EDD. Initially, there is a sudden increase in the average minutes early, but then it is uniformly changing with the change in yogurt feed rate. Moreover, the change in average minutes early per unit change in yogurt feed rate is greater in the case of FCFS than EDD and SPT.
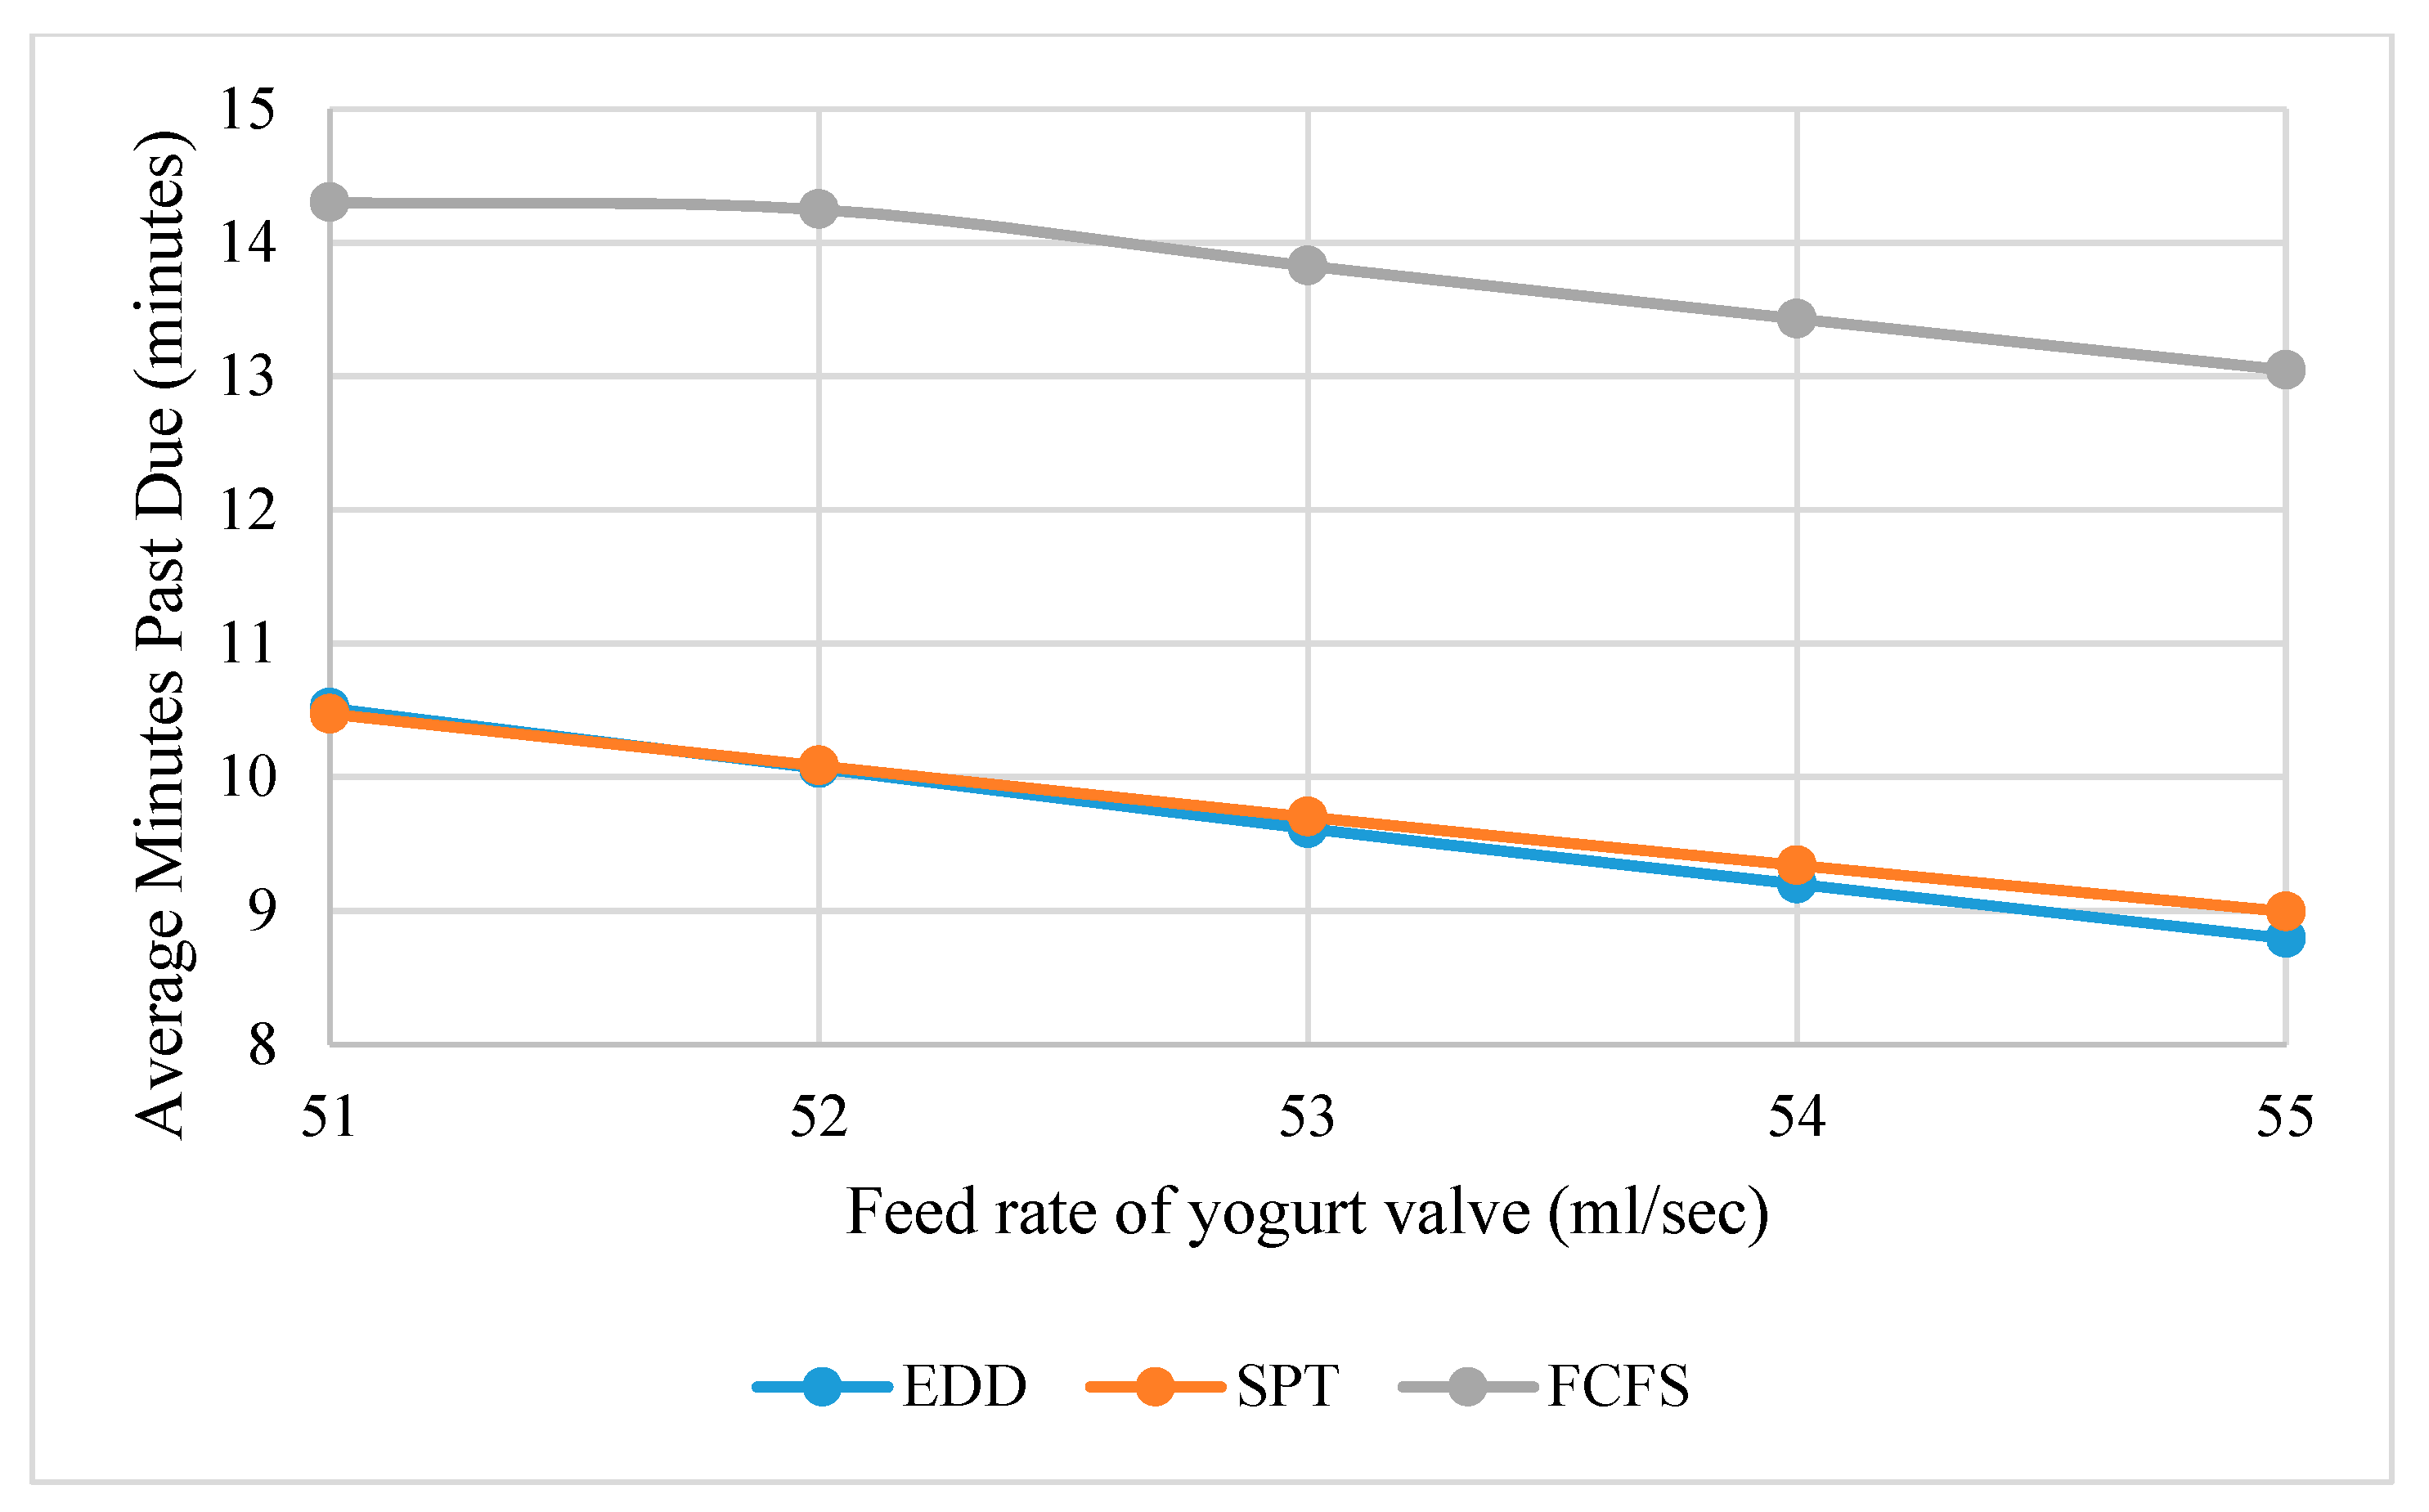
The average minutes past due decreases with an increase in the feed rate of the yogurt valve. It is higher in the case of FCFS than EDD and SPT, as depicted in
Figure 11. Comparing EDD and SPT, initially, the average minutes past due are greater in the case of EED than SPT, but then its valve is lower than SPT with an increase in the feed rate of yogurt.
The three performance measures were investigated while sequencing the cups on the three single-dimensional rules. In the above investigation, the SPT rule is better than EDD and FCFS with respect to average flow time, while FCFS is better than EDD and SPT with respect to average minutes early. Similarly, EDD is better than SPT and FCFS with respect to average minutes past due. As all performance measures are calculated for the single-dimensional rules, the choice of management is to value the average minutes past due (keeping promises to customers) the most, and its lowest values in most cases are in the EDD rule.
5.2. The Effect of Change in Length of Conveyor Belt on Decision Variable, Parameter, Different Times and Performance Measures
The effect of change in length of the conveyor belt on the feed rate of flavor valve, speed of conveyor belt, waiting time of the last cup of an order for processing, the processing time for a cup, the total processing time of an order, and performance measures (average flow time, average minutes early, average minutes past due) was investigated. The length between any two points (placement to yogurt filling, yogurt filling to flavor filling, flavor filling to exit) on the conveyor belt changes from 28 cm with a decrement of two units to 20 cm. The maximum feed rate of the yogurt is set at 50 mL/sec.
It was noted that the change in length of the conveyor belt has no effect on the feed rate of the flavor valve, waiting time of the last cup of an order for processing, the processing time for a cup, and the total processing time of an order as long as the maximum allowable feed rate of yogurt valve is kept at 50 mL/sec. As can be seen in
Table 2, the feed rate of the flavor valve is 3.76 mL/sec for any length of the conveyor belt in order 1. Similarly, the values of waiting time of the last cup of an order for processing, the processing time for a cup, and the total processing time of an order are 552.42, 27.9, and 580.32, respectively, for any length of conveyor belt in order 1. The values of other orders for any length of the conveyor belt remain constant and are provided in
Table 7.
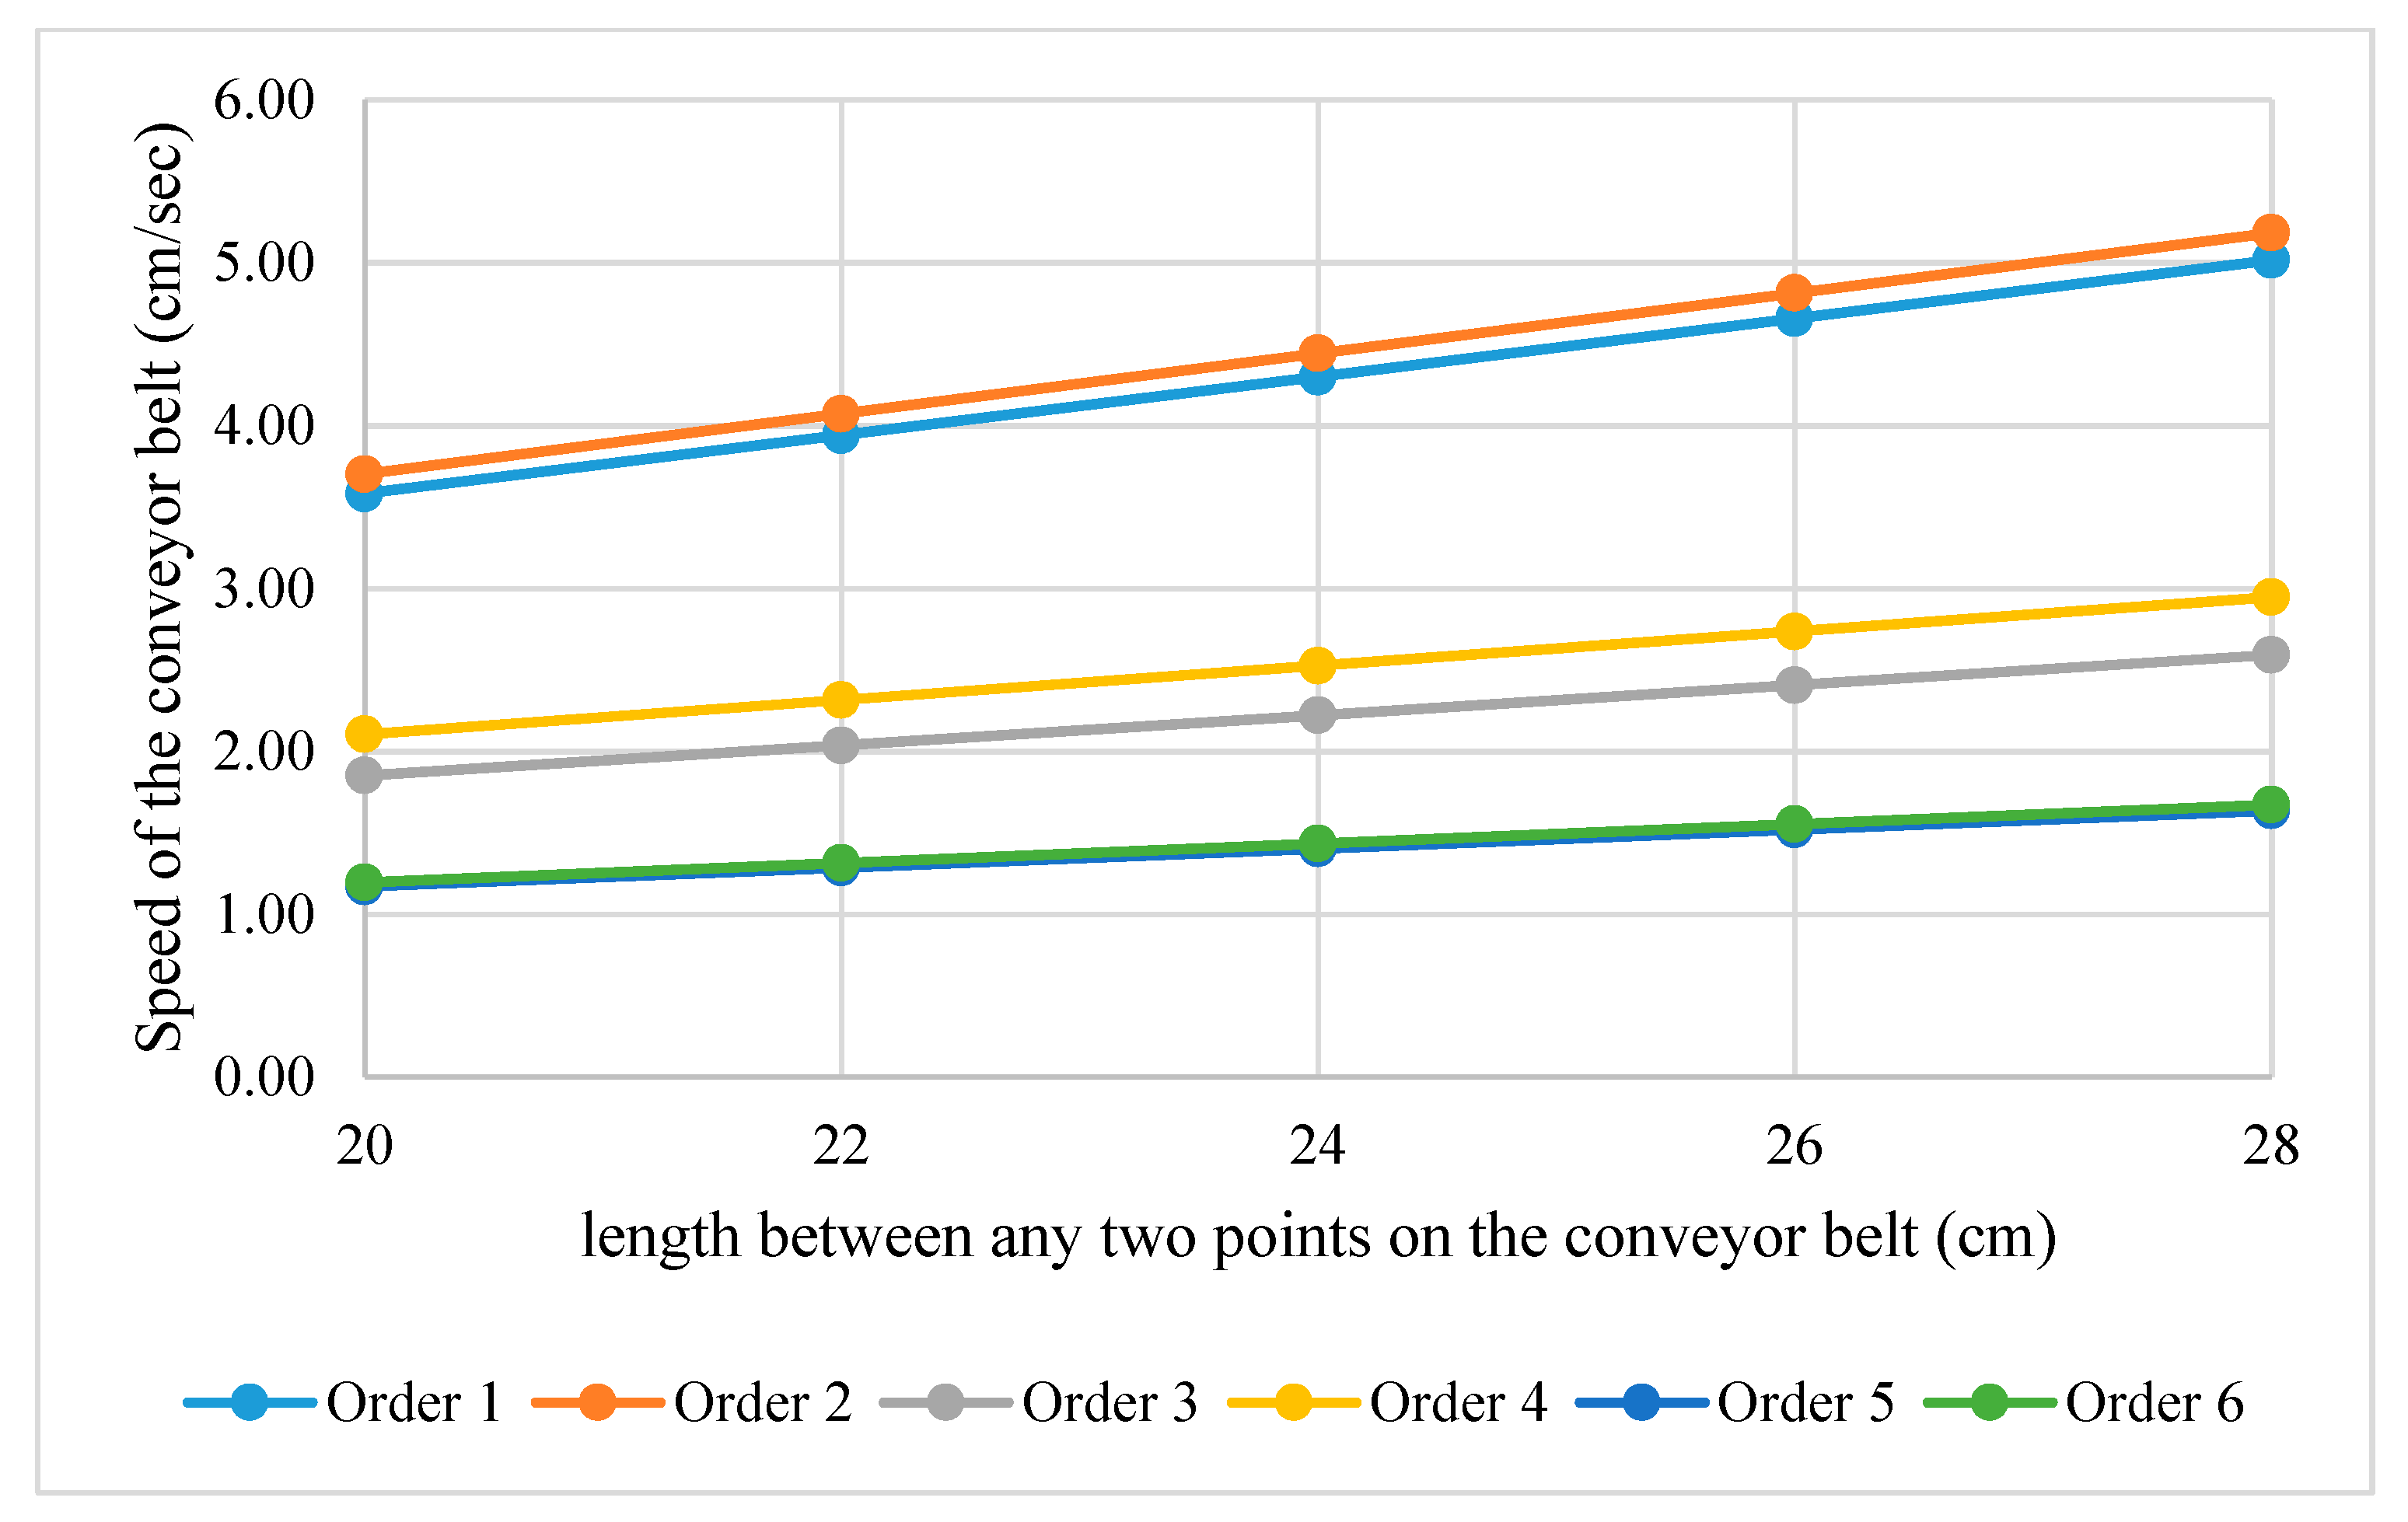
The change in length of the conveyor belt affects the speed of the conveyor belt. The speed increases almost linearly with an increase in the length of the conveyor belt. As depicted in
Figure 12, the speed and change in speed of the conveyor belt are higher in orders 1 and 2 (small volumes) in comparison to orders 5 and 6 (large volumes).
The values of all performance measures for the one-dimensional rules are provided in
Table 8. These values were noted for lengths 28, 26, 24, 22, and 20 cm of the conveyor belt. It was also noted that the performance measure values are independent of the length.
In the above cases, the SPT rule is better than EDD and FCFS with respect to average flow time and average minutes past due, while FCFS is better than SPT and EDD with respect to average minutes early. As mentioned in the previous subsection, it depends on the choice of management that is valued the most. As average minutes past due is valued the most, its lowest value is in the SPT rule.
6. Conclusions
In this article, a mathematical model was developed for Industry 4.0 based yogurt filling machine in the Laboratory of Computer Integrated Manufacturing, Industrial Engineering Department, King Saud University, Saudi Arabia. The objective of the model is to maximize the speed of the conveyor belt while satisfying the constraints of the maximum speed of the conveyor belt, maximum feed rates of yogurt and flavor valves, and the availability of orders at a given time. The model was solved optimally by the data of a set of orders from customers. The results were then considered for single-dimensional priority rules, and the average values of different performance measures were found for decision purposes. From the presented research, pertinent conclusions drawn are the following:
The feed rate of the yogurt valve is the controlling and main decision variable. The speed of the conveyor belt, the feed rate of the flavor valve, the waiting and processing times, and all three performance measures depend on the feed rate of the yogurt valve. The speed of the conveyor belt is maximized by maximizing the feed rate of the yogurt valve, and hence the throughput is increased. Moreover, the feed rate should be within a safe limit to avoid splashes;
The change in length of the conveyor belt affects the speed of the conveyor belt, but as long as the feed rate of the yogurt valve is constant, the feed rate of the flavor valve, the waiting and processing times, and all three performance measures remain unchanged. As the distance between any two points on the conveyor belt is decreased, the speed of the conveyor belt decreases. The reason is that the mathematical model allows a cup to reach from one point to another point in a time equal to the yogurt of flavor filling time;
Normally, the percentage of yogurt in a cup is close to 100, and the model allows equal yogurt and flavor filling time; hence, a flavor valve of a smaller size is required in the system. The size of the flavor valve depends on the percentage of flavor in a cup;
The results of the model were used in single-dimension rules, and three performance measures were calculated. The choice of the management is to value the average minutes past due (keeping promises to customers) the most. In case of changing the feed rate of the yogurt valve and keeping the length of the conveyor belt constant, the EDD rule resulted in lower values of average minutes past due, while in case of changing the length of the conveyor belt and keeping the feed rate of yogurt valve constant, the SPT rule resulted in lowest value of average minutes past due.
In the future, an automatic yogurt filling system with all nozzles (yogurt valve and flavor valves) at a single point will be compared with the existing system to establish which one provides the best desired results.


