Article

Creating a Diagnostic Assistance System for Diseases in Kampo Medicine

1
Division of Creative Engineering, Graduate School of Science and Engineering, Chiba 263-8522, Japan
2
Kampo Clinical Center, Department of General Medicine, Hiroshima University Hospital 1-2-3, Kasumi, Minami-ku, Hiroshima 734-8551, Japan
3
Department of Otolaryngology, Head and Neck Surgery, Kanazawa University Hospital, Kanazawa 920-8641, Japan
4
Honjo Waseda Clinic, Saitama 367-0030, Japan
5
Senrioka Kagayaki Clinic, Osaka 565-0816, Japan
6
Department of Japanese Traditional (Kampo) Medicine, Kanazawa University Hospital, Kanazawa 920-8641, Japan
7
Graduate School of Engineering, Chiba University, Chiba 263-8522, Japan
*
Author to whom correspondence should be addressed.
Appl. Sci. 2021, 11(21), 9716; https://doi.org/10.3390/app11219716
Submission received: 27 August 2021 / Revised: 4 October 2021 / Accepted: 9 October 2021 / Published: 20 October 2021

Abstract

:
The aim of this study was to propose a method to assess images of the tongue captured using a polarized light camera for diagnostic use in Kampo medicine. Glossy and non-glossy images of the tongue were captured simultaneously using a polarizing camera and a polarizing plate. Data augmentation was performed by modulating the color and gloss, resulting in an increase in the number of images from 11 to 275. To create a data set, the values for which diseases were evaluated by Kampo doctors for all tongue images were taken as the correct values and combined with the features extracted from the tongue images. Using this data set, we constructed a diagnostic support module to evaluate diseases. The resulting mean absolute error of the assessment was 0.44 for qi deficiency, 0.42 for blood deficiency, 0.33 for blood stagnation, 0.36 for yin deficiency, and 0.55 for fluid stagnation, suggesting that the diagnostic assistance module was accurate, and our proposed learning and data augmentation methods were effective.

1. Introduction

The general medical care received in hospitals worldwide is based on Western medicine. However, in China and other East Asian countries, the field of traditional medicine—called Kampo medicine in Japan—has developed over the past 1500 years. Western medicine and Kampo medicine differ greatly in their diagnostic methods. In Kampo medicine, the pathology is assessed using the three elements of “qi,” “blood,” and “fluid” that comprise the qi, blood, and fluid theory [1]. A healthy state is one in which these three elements circulate normally and in sufficient quantities. Qi represents the energy of the entire body, blood represents the blood and its flow through the body, and fluid represents fluids other than the blood (such as lymph and digestive fluids) and its flow through the body. The conditions in which qi, blood, and fluid are “insufficient” are called “qi deficiency,” “blood deficiency,” and “yin deficiency,” respectively, and those in which qi, blood, and fluid are “stagnated” are called “qi stagnation,” “blood stagnation,” and “fluid stagnation,” respectively [2].
Doctors practicing Kampo medicine diagnose diseases via inspection, inquiry, palpation, and aural and olfactory examinations [3]. Inspection, especially visual examination, is among the most important diagnostic methods in Kampo medicine but is rarely applied in Western medicine. One reason for this is that it is not possible to make a quantitative diagnosis because inspection is subjective and based on the doctor’s experience.
To solve this problem, a quantitative descriptive diagnosis method has been formulated using image processing in recent years [4,5]. By using a computer to perform an advisory diagnosis based on images of the face and tongue, it is possible to quantify the diagnosis without prior experience and identify the relevant disease.
In addition, Kampo medicine contains many concepts useful for preventive medicine. The qi deficiency, blood deficiency, blood stagnation, yin deficiency, and fluid stagnation that we evaluated indicate imbalances in the body. In Kampo medicine, doctors take appropriate treatments to adjust these imbalances in order to prevent diseases. There are no clear distinction between healthy people and patients; in this study, the closer to 0, the better the condition is, and the closer to 4, the worse the condition is. About 0 indicates a healthy state, 1 and 2 indicate conditions that require follow-up, and 3 and 4 indicate conditions that require treatment., but there are individual differences among doctors.
Table 1 lists diseases that can be diagnosed based on an inspection of the face and tongue of the patient using Kampo medicine. To computerize descriptive diagnosis, Matsushita et al. [6] proposed a method to assess diseases of Kampo medicine using the facial images of patients. Blood deficiency, blood stagnation, and yin deficiency can be diagnosed using facial images. However, this facial image assessment might not be sufficient to achieve a Kampo medical diagnosis. Observations of the patient’s tongue increases the number of conditions that can be diagnosed using computer image analysis. By observing the color, fluid content, and shape of the tongue, and the condition of the tongue coating, five of the six conditions—qi stagnation, qi deficiency, blood deficiency, blood stagnation, yin deficiency, and fluid stagnation—can be diagnosed.
As the tongue is closely related to the internal organs with exposed mucous membranes, it is regarded as an important indicator of many diseases in Kampo medicine. The tongue is very glossy under normal lighting conditions owing to its moist surface, which makes it difficult to obtain accurate information on the color of the tongue with normal imaging methods. However, Kampo doctors consider gloss to be just as important as color information in making a diagnosis. Therefore, to perform a computerized tongue-based diagnosis, it is necessary to use an imaging method that can accurately acquire information on both color and gloss.
In the latest study of diagnosis from the tongue, Xu et al. [7] collected tongue images from about 1000 people using a device that can perform gloss removal imaging to diagnose diabetes. Kainuma et al. [8] conducted a study to estimate the Frequency scale for the symptoms of gastroesophageal reflux disease from images of the tongue. However, these recent studies have the problem of gloss removal: in these studies, the gloss of the tongue was completely removed, which is different from the Kampo doctor’s observation. To solve this problem, Nakaguchi et al. [9] used a combination of the integrating sphere method and directional illumination to capture images of glossy and non-glossy tongues in order to estimate the moisture content of the tongue. However, because the integrating sphere is large and expensive, it is not appropriate for personal use.
In the present study, we photographed the tongue using a polarizing camera that simultaneously captures glossy and non-glossy images with more compact and cheaper equipment than an integrating sphere which is conventionally used. In addition, to collect tongue images more efficiently, we proposed a physiologically compensated and effective data augmentation method. We then used these images to assess each patient’s diseases. A system of quantitative evaluation was constructed by machine learning of the values and features obtained from the tongue images. The accuracy of the evaluation system was verified via comparison with the distribution and variability of the assessments by four Kampo medicine specialists.
This research provided a quantitative diagnostic method for Kampo diseases from the tongue using image processing and machine learning techniques. The contributions and novelty of this paper are therefore as follows:
  • We proposed a tongue imaging method using a polarized light camera that is simpler and more effective than the conventional method. In particular, the use of polarized light cameras provided accurate gloss information and showed their effectiveness in diagnosing yin deficiency and fluid stagnation, conditions closely related to fluid content, as shown in Section 2
  • We proposed a physiologically compensated and effective data augmentation method. We show that the proposed data augmentation method improved the distribution of correct values in Section 4. In addition, the estimation accuracy was improved by the data augmentation. These results indicate the effectiveness of our method.

2. Materials and Methods

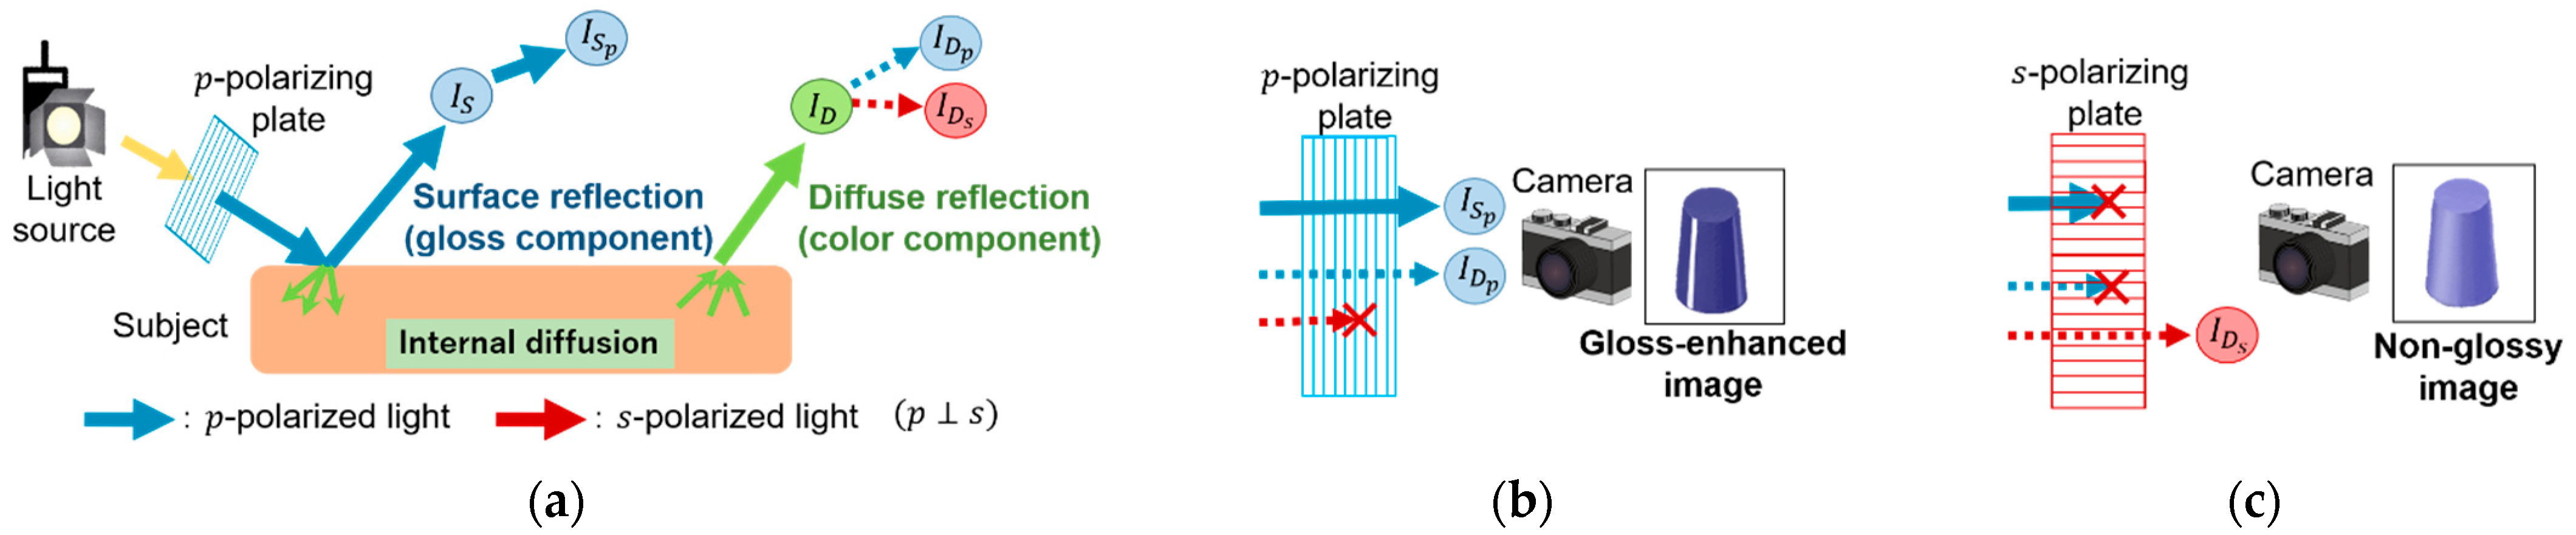
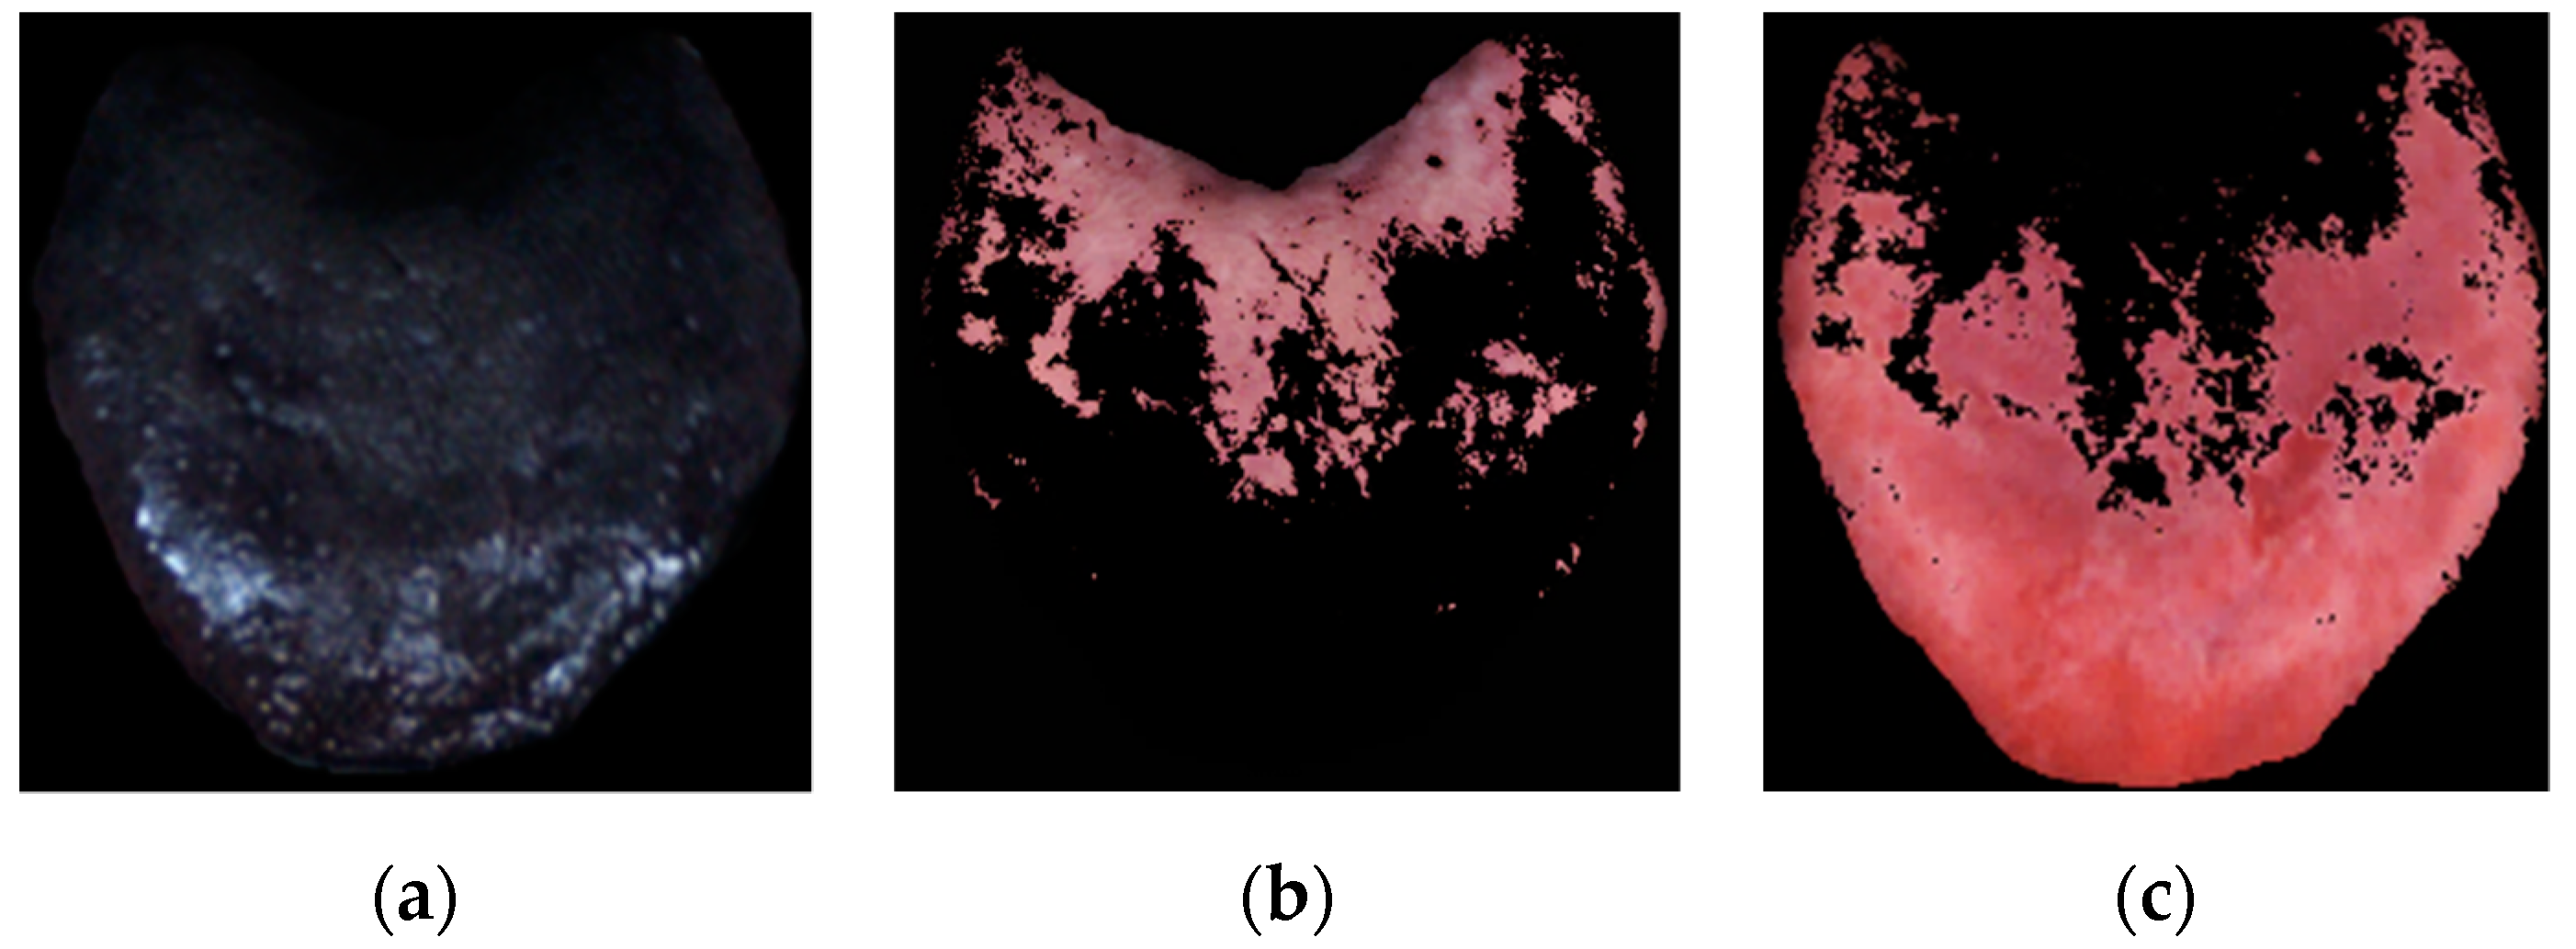
2.1. Capturing Glossy and Non-Glossy Images Using Polarized Light

Incident light from a source is reflected from the surface of an object. This reflection of the light is classified into two types: surface reflection, where the angles of incidence and reflection of light are the same with respect to the surface of reflection, and internal diffuse reflection caused by the scattering of the incident light inside the object. The human eye and a camera perceive the color and luster of an object by capturing the reflected light. In general, an object appears colored owing to internal diffuse reflection, while luster is caused by surface reflection. Light is an electromagnetic wave that oscillates in a direction perpendicular to its direction of travel, and normal light is in an unpolarized or partially polarized state, which is a mixture of light oscillating in all directions. Polarization, conversely, refers to light that oscillates only in a certain direction. Passing ordinary unpolarized light through an optical filter called a polarizing plate creates polarized light in a direction identical to that of the polarizing plate.
This property of polarization has important links to the surface reflection and internal diffusion. Light is reflected while the polarization of the incident light is maintained; when the incident light is reflected off the surface of the object, it is linearly polarized in the direction of the polarizing plate, as in the case of incident light. Conversely, internal diffuse light is unpolarized even if the incident light is linearly polarized when internally reflected, because the incident light is reflected in various directions and the light is scattered. We used this property to obtain glossy and non-glossy images.
Figure 1 shows the method used to obtain an image with enhanced gloss and one with reduced gloss using two orthogonal polarizing plates. S indicates the surface-reflected light, D indicates diffuse reflected light, and the subscripts p and s indicate the directions of orthogonal polarization. Since S in Figure 1a maintains the same polarization as the incident light, the relationship between the intensity of S and that of the p-polarization component ( S p ) of S is shown in Equation (1), where I x indicates the intensity of x:
I S = I S p
The diffuse component (D) in Figure 1a is the loss of polarization of the incident light. The ratio of intensity of the p-polarization component ( D p ) to that of the s-polarization component ( D s ) in D is 1:1, and can be expressed as:
I D = I D p + I D s = 2 I D p = 2 I D s
Figure 1b shows the setup used to attain a gloss-enhanced image by placing a second polarizing plate between the object and the camera. When light passes through the p-polarizing plate, the component of s-polarization in the vertical direction cannot pass through the p-polarizing plate. Thus, the internally reflected light (D), which contains D s , has half the intensity; however, S p , which has only the p-polarization component, can pass through the p-polarizing plate illumination and the object. In the present study, we used a polarizing camera instead of a second polarizing plate placed in front of the camera. The polarizing camera can capture 0°, 45°, 90°, and 145° polarization images simultaneously, enabling the capture of a gloss-enhanced image from a 0° polarization image and a non-glossy image from a 90° polarization image simultaneously.

2.2. Separating the Tongue Coating from the Tongue Body

The surface of the tongue can be categorized into the coating and the body. The coating of the tongue refers to the part coated with food debris, mucosal cells, and bacteria on tissues called filamentous papillae, and in the gaps between protrusions on the surface of the tongue. The body of the tongue refers to the part that is not covered by the coating of the tongue [10]. The color of the lichen of the tongue can be white, yellow, gray, and black, while the body of the tongue can be light-red, red, crimson, and purple. As the lichen and body of the tongue show different color changes, it is necessary to distinguish between them when evaluating tongue color.
Xu et al. [11] focused on the fact that the tongue has a large proportion of red and so the R component of the RGB color space tends to be prominent, whereas the lichen of the tongue does not have a prominent R component. This previous study calculated I for all pixels in the tongue image using the following equation:
I = R 1.5 G + 0.5 B 2 .
All pixels were classified as belonging to the body or coating of the tongue according to Equation (4). Taking I b o d y as the mean value of I classified as belonging to the body of the tongue, Mean( I b o d y ) as the mean value of I classified as belonging to the tongue body, and Mean( I c o a t i n g ) as the mean value of I classified as belonging to the tongue coating, I m is determined to maximize Equation (5):
I = { I b o d y   ( i f   I I m ) I c o a t i n g   ( i f   I < I m ) ,
M a x i m i z e ( I m ) :   | M e a n ( I b o d y ) M e a n ( I c o a t i n g ) | .

2.3. Extracting Feature Values from Tongue Images

We then extracted feature values from the tongue images for machine learning. The first step is to manually extract the tongue region from whole image. After that, as mentioned above, the two images with and without gloss were used to obtain three images—(a) gloss component, (b) tongue coating, and (c) tongue body—as shown in Figure 2. From (a), we obtained the mean, standard deviation, and maximum, minimum, and median values of L * in the L * a * b * color space of the glossy area and the percentages of the total area of the tongue by gloss. Since the area and brightness of the gloss on the tongue surface changes with the amount of fluid, features that indicate these changes are obtained from the gloss image. From (b) and (c), we obtained the mean, standard deviation, and maximum, minimum, and median values of a * and b * in the L * a * b * color space of the tongue coating. Changes in blood status can be seen in the color of the tongue body. In addition, the area and color of the tongue coating changes with physical condition and lifestyle. Therefore, we obtained the feature values that represent the color and coating area. As shown in Table 2, a total of 27 types of feature values were obtained.

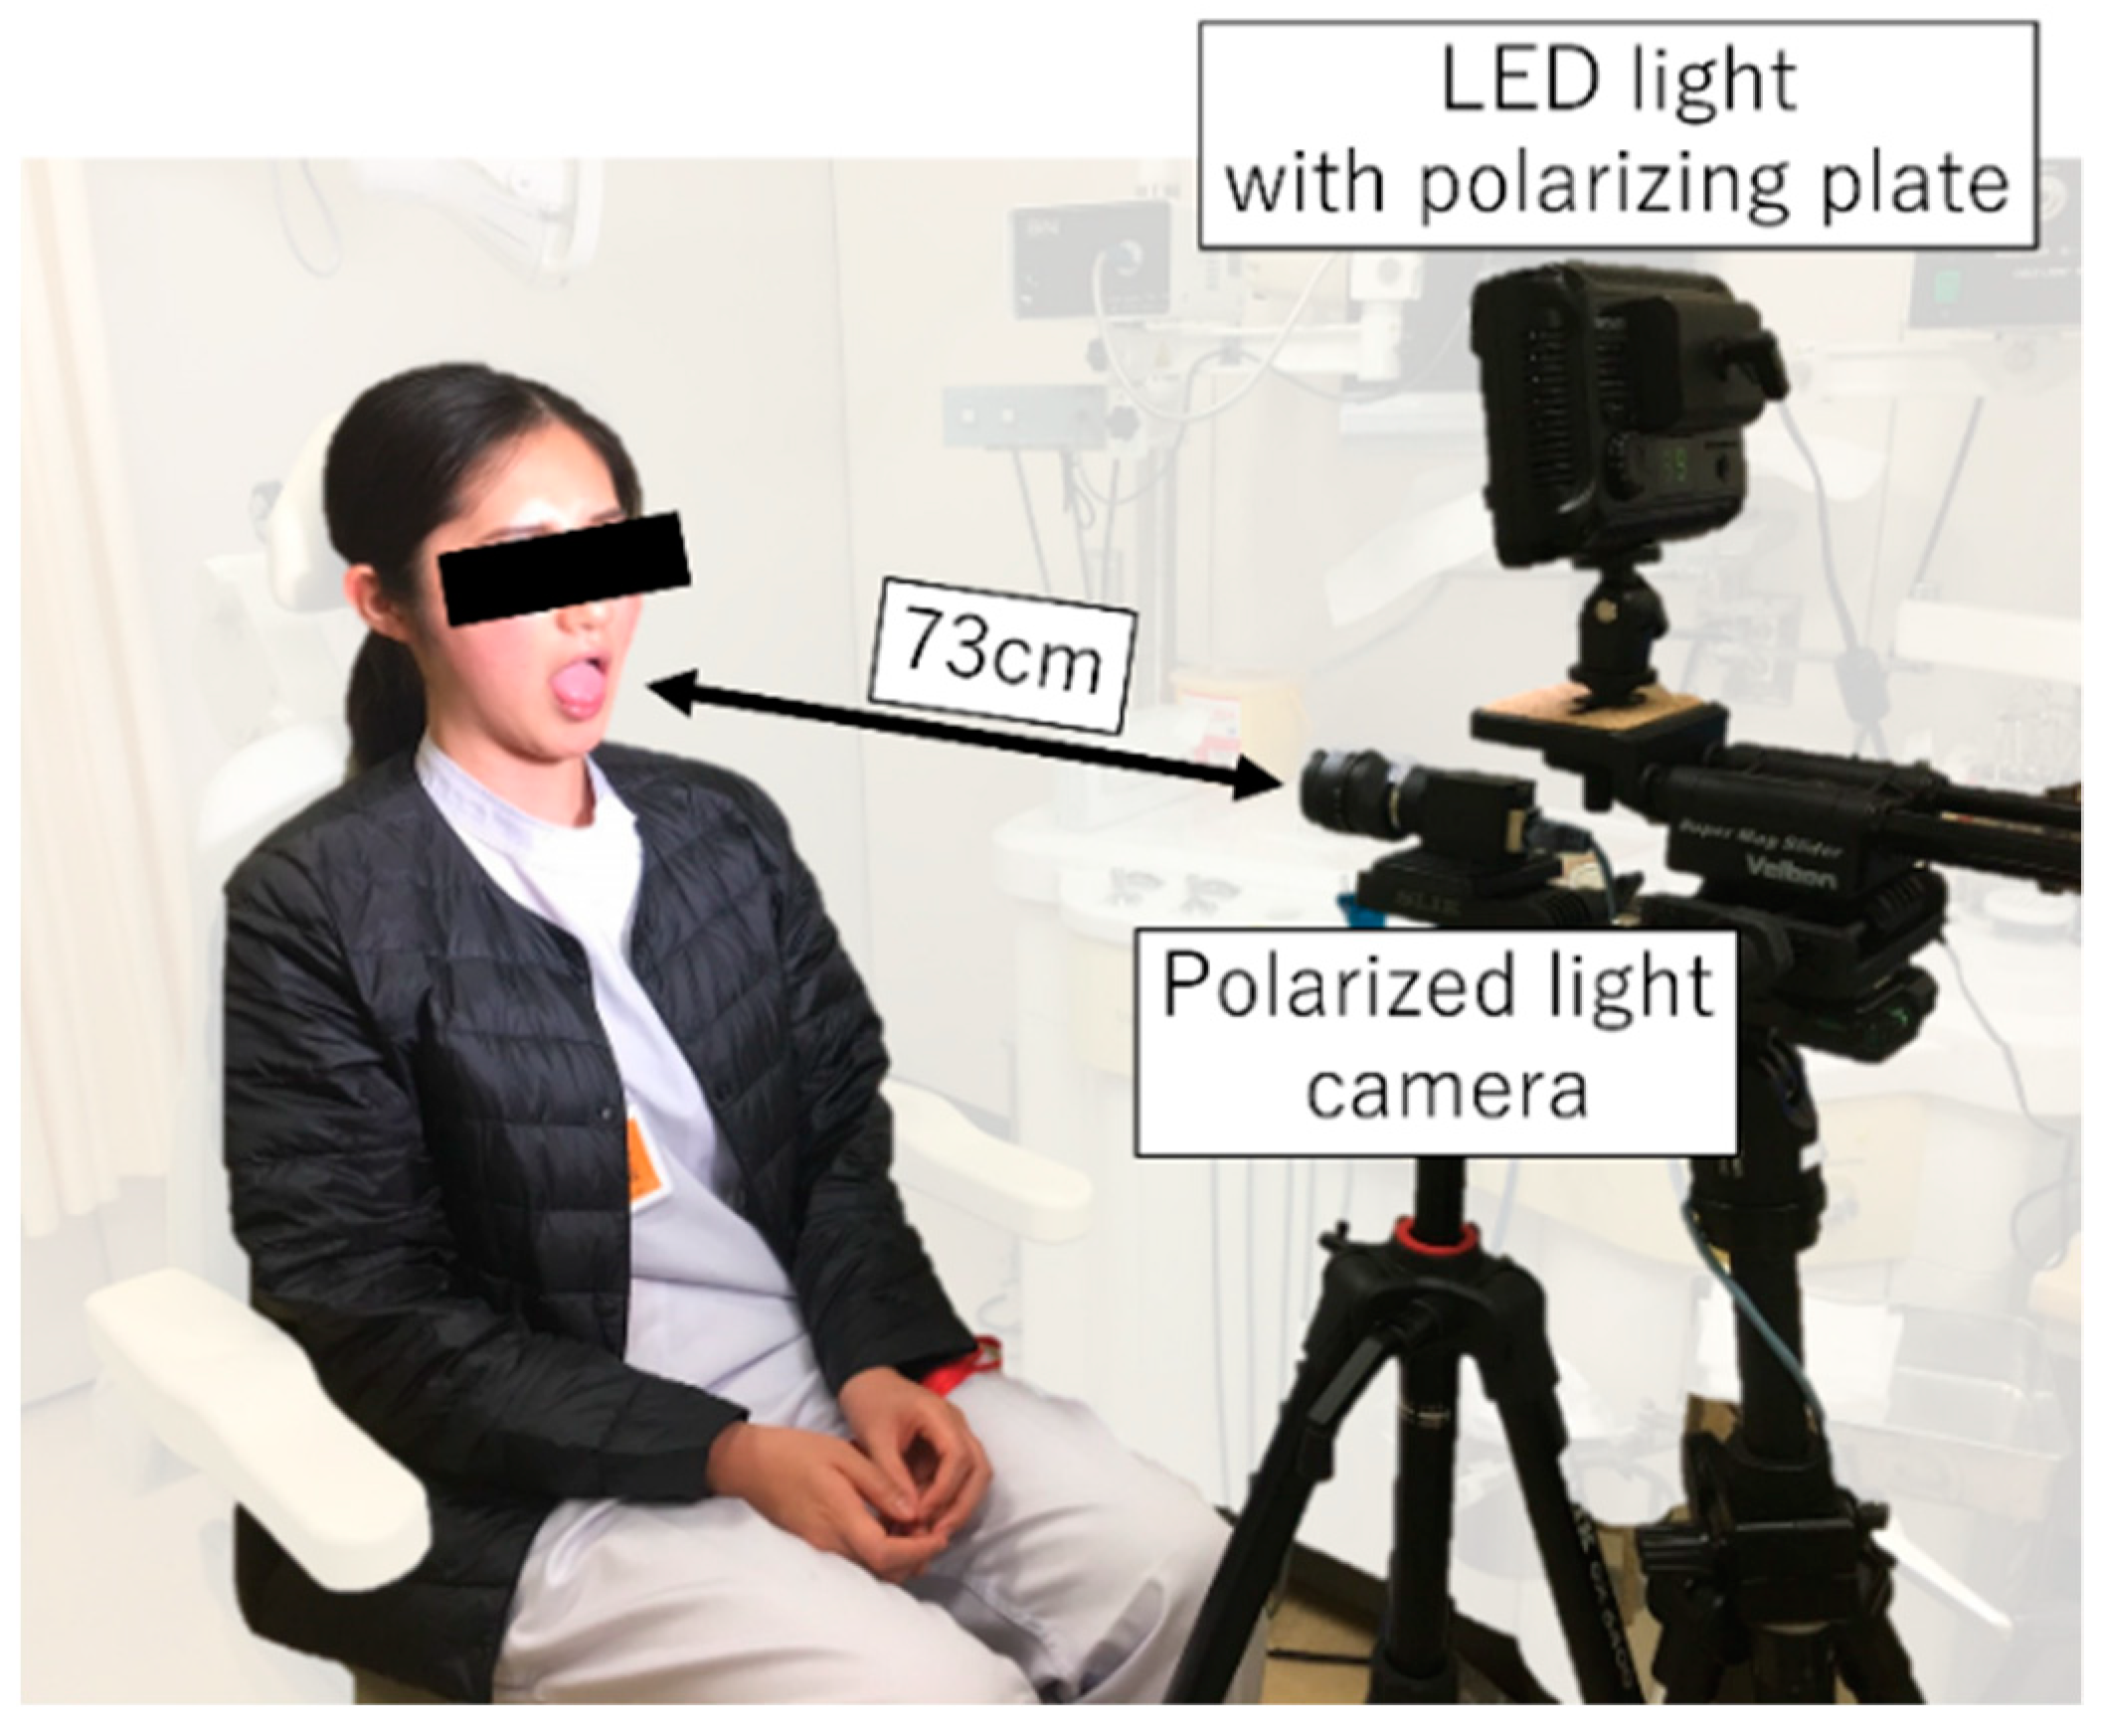
2.4. Set-Up for Capturing Tongue Images

Figure 3 shows the photographic environment in which the learning data were collected. A polarizing camera (Lucid, PHX050S-Q) was used, with a resolution per polarized image of 1224 × 1024 pixels, bit depth of 16 bits, exposure time of 8000 µs, and distance between the camera and the subject of 73 cm. The images were taken in a dark room with an LED light source (Neewer, PT-176S) with a polarizing plate. Eleven healthy subjects were photographed.

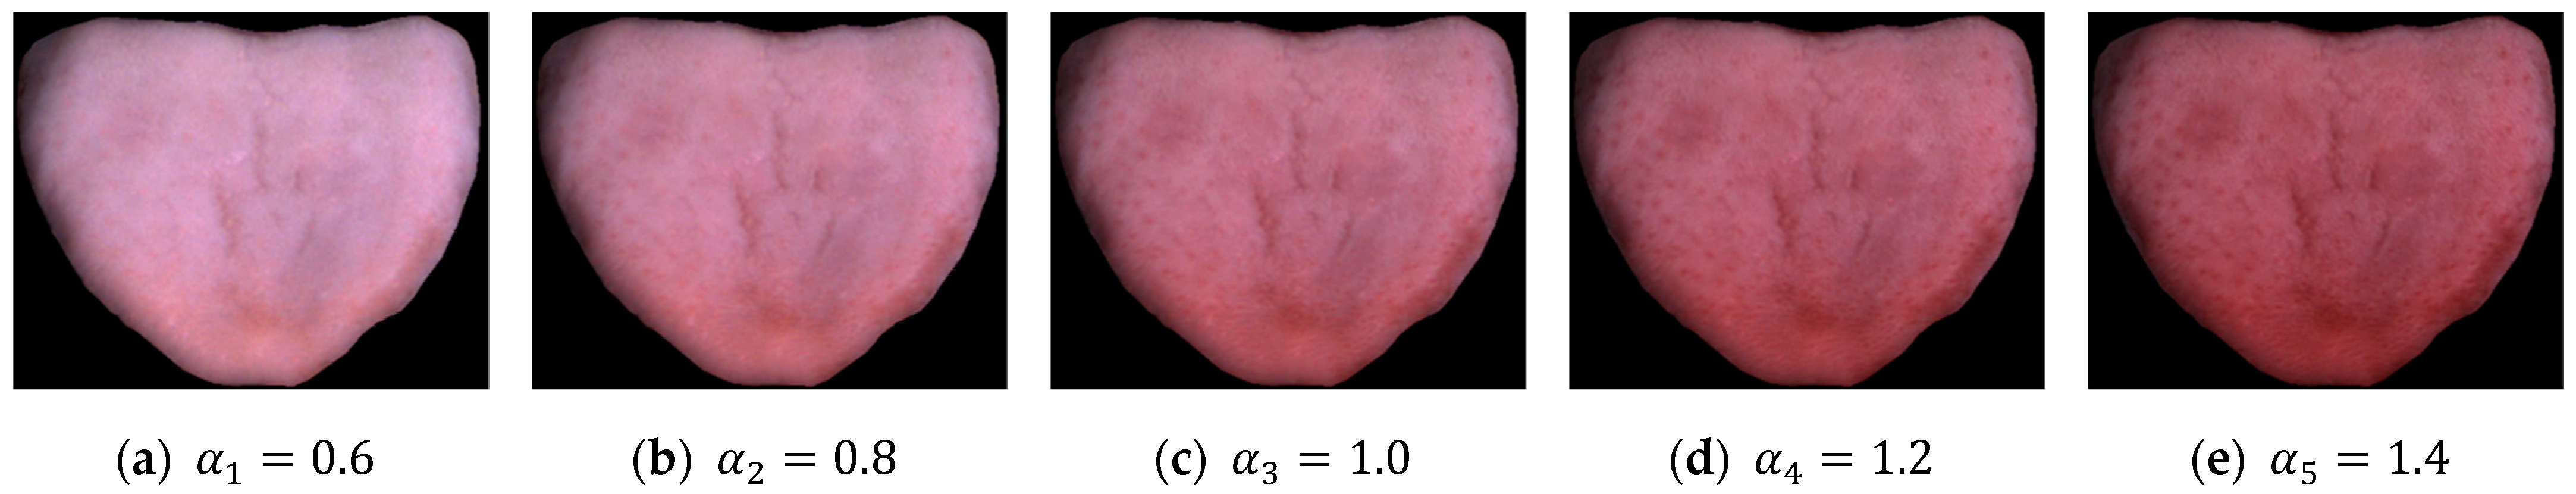
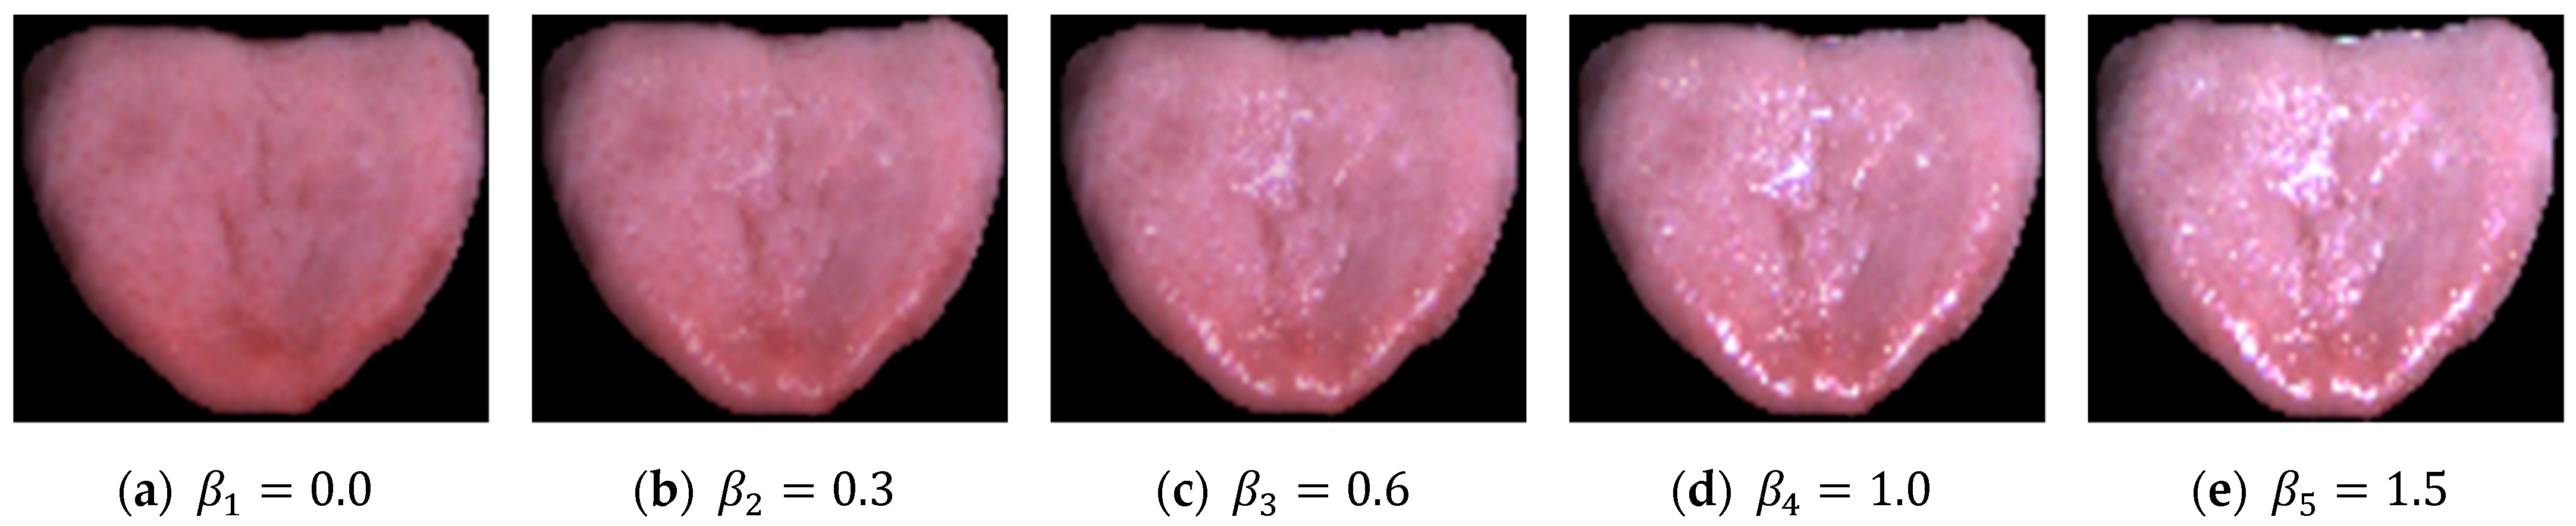
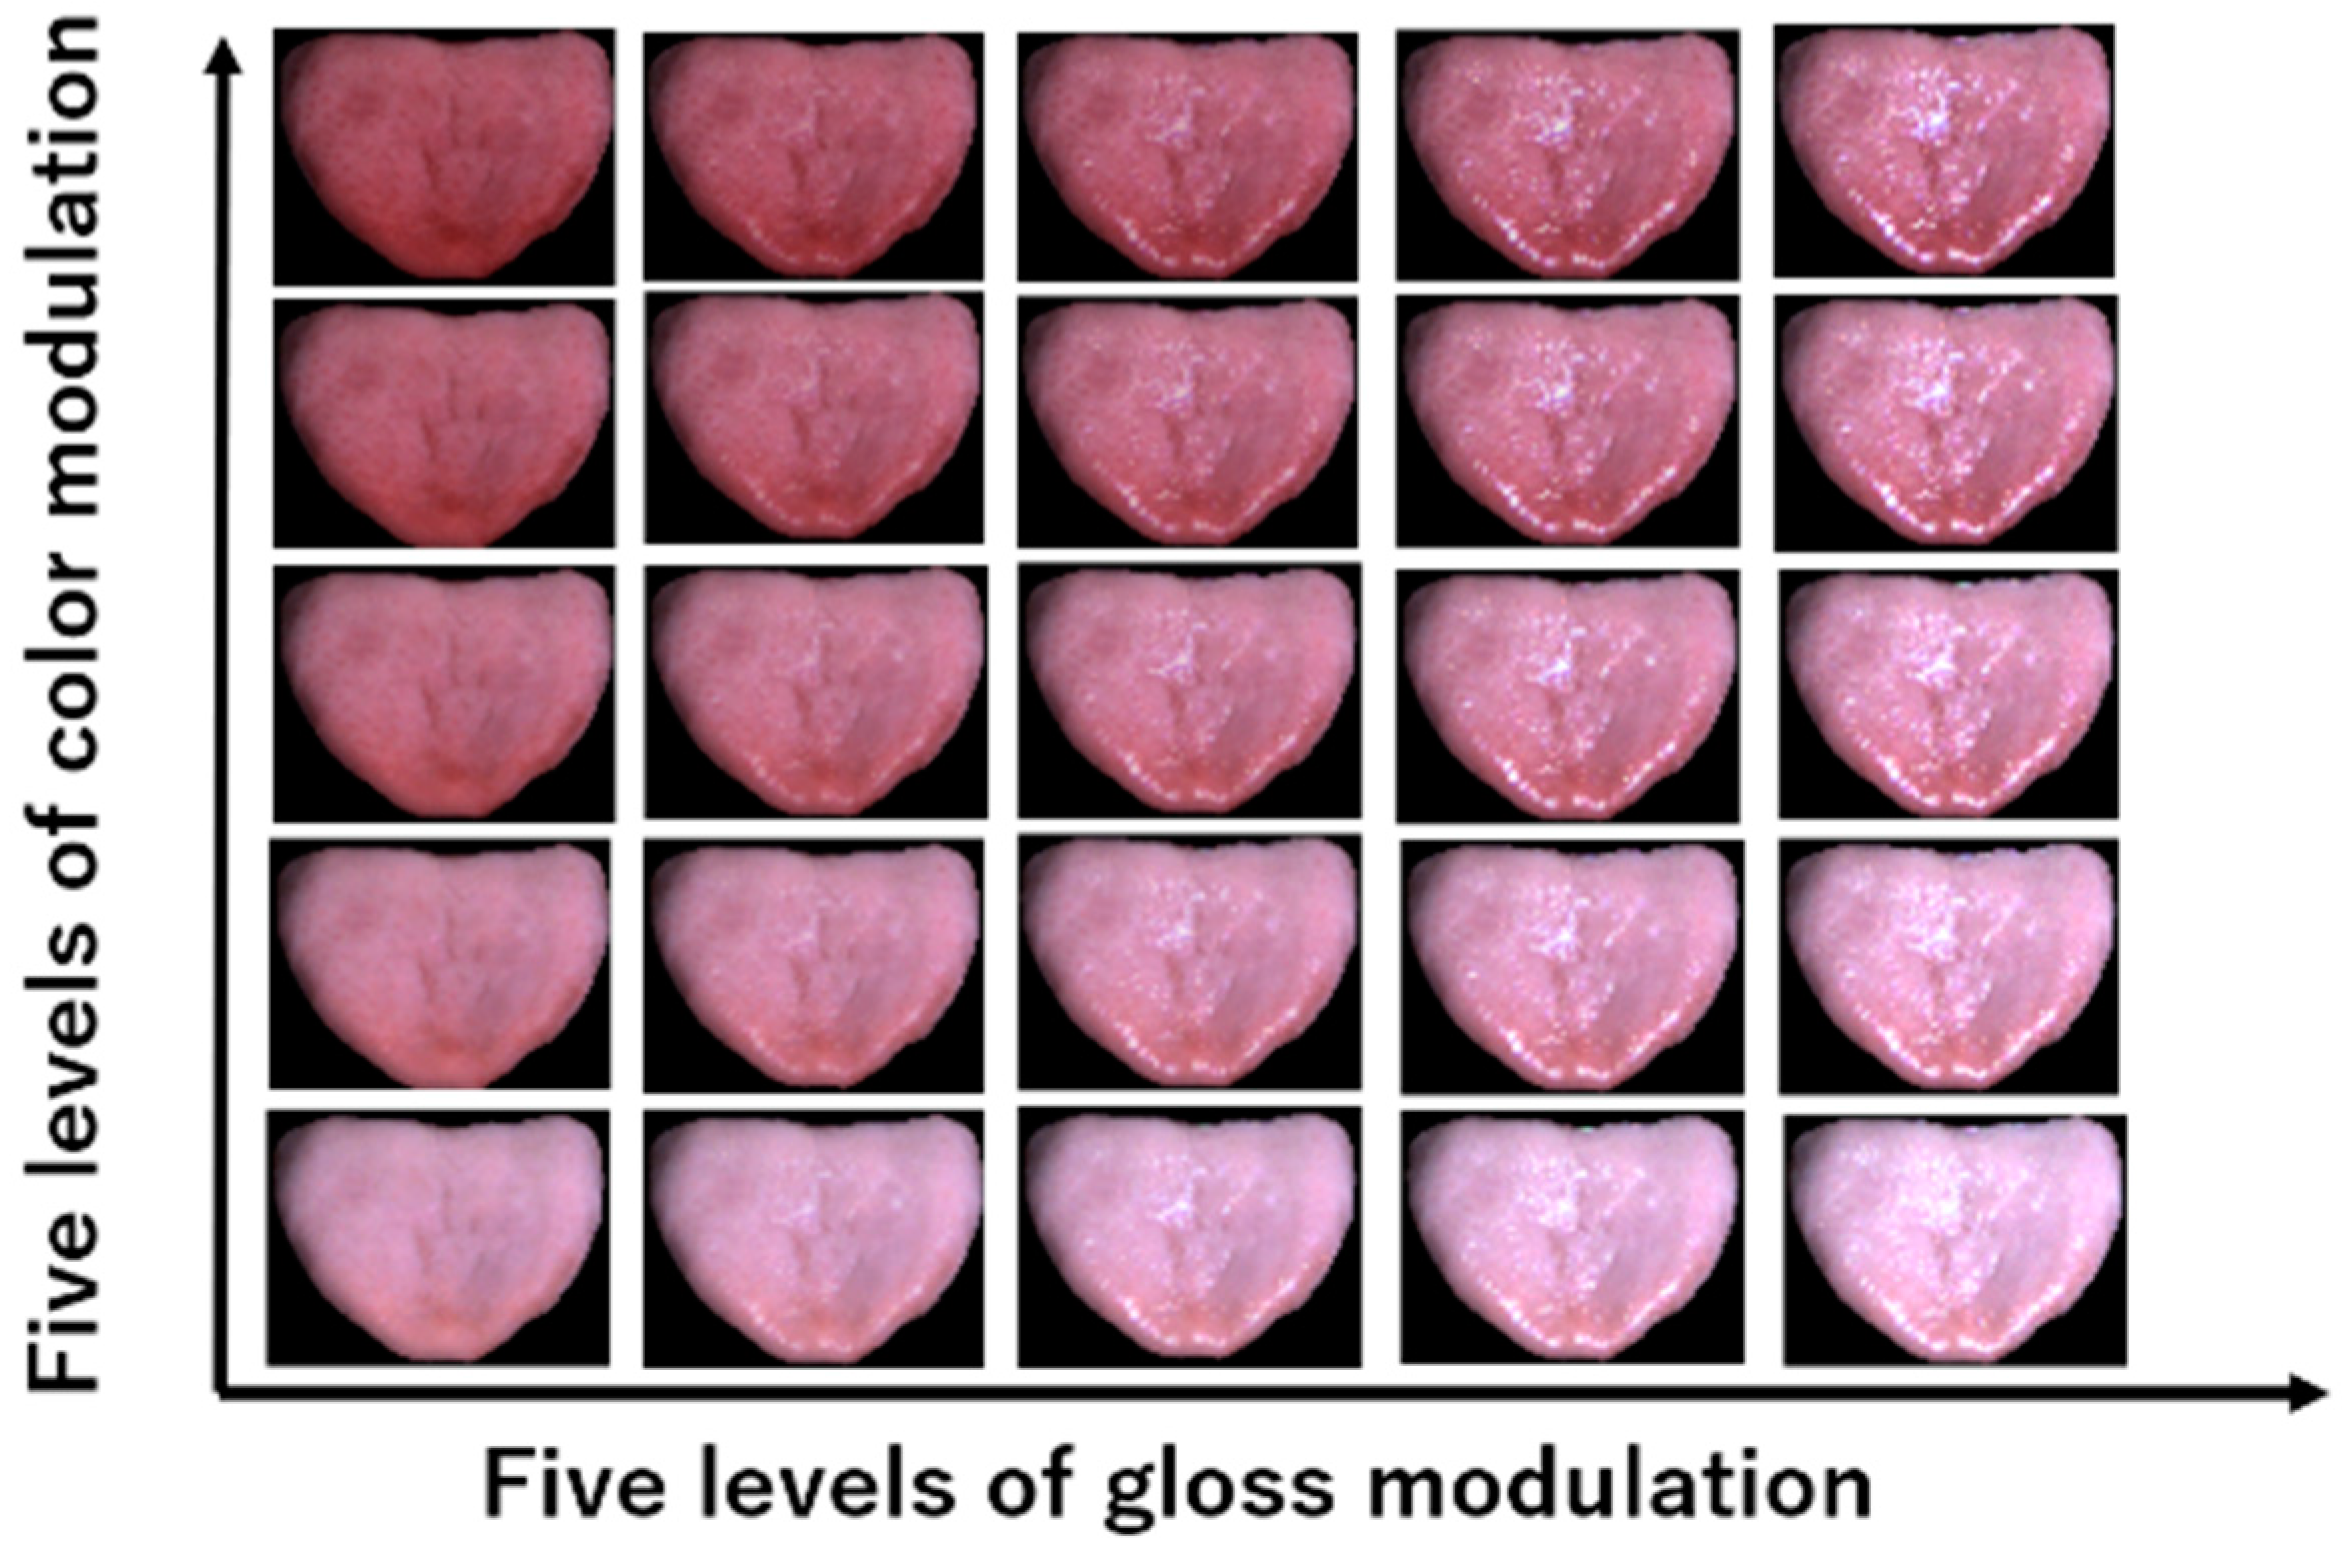
2.5. Data Augmentation by Color and Gloss Modulation

As the number of captured tongue images was insufficient for machine learning, we performed a physiologically corrected modulation of each sample to produce more training data. Data augmentation was performed by applying color and gloss modulation to each captured image.
The color of the tongue is determined by the amount of hemoglobin in the blood. Therefore, modulating the hemoglobin components enables the creation of images with different tongue colors. To extract the components of hemoglobin from non-glossy tongue images, we separated the components of pigmentation using the method proposed by Tsumura et al. [12]. The color-modulated images of the tongue were obtained by multiplying the hemoglobin component by the color modulation factor ( α i ) in log space and resynthesizing the components of melanin and shading by reverse processing the separation of the pigment component. Figure 4a–e shows color-modulated images with ( α 1 ,   α 2 ,   α 3 ,   α 4 ,   α 5 ) = (0.6, 0.8, 1.0, 1.2, 1.4), respectively.
As both the glossy and non-glossy images were captured simultaneously, the glossy component was easily extracted by subtracting the non-glossy image from the glossy image. The image of the tongue with modulated gloss was obtained by multiplying the extracted components of gloss with the gloss modulation factor ( β j ), as well as the color modulation, and resynthesizing the image with no gloss. Figure 5a–e shows the gloss-modulated images for ( β 1 ,   β 2 ,   β 3 ,   β 4 ,   β 5 ) = (0.0, 0.3, 0.6, 1.0, 1.5), respectively. As shown in Figure 6, by combining these two modulation methods, the number of original images of the tongue was augmented by a factor of 25.

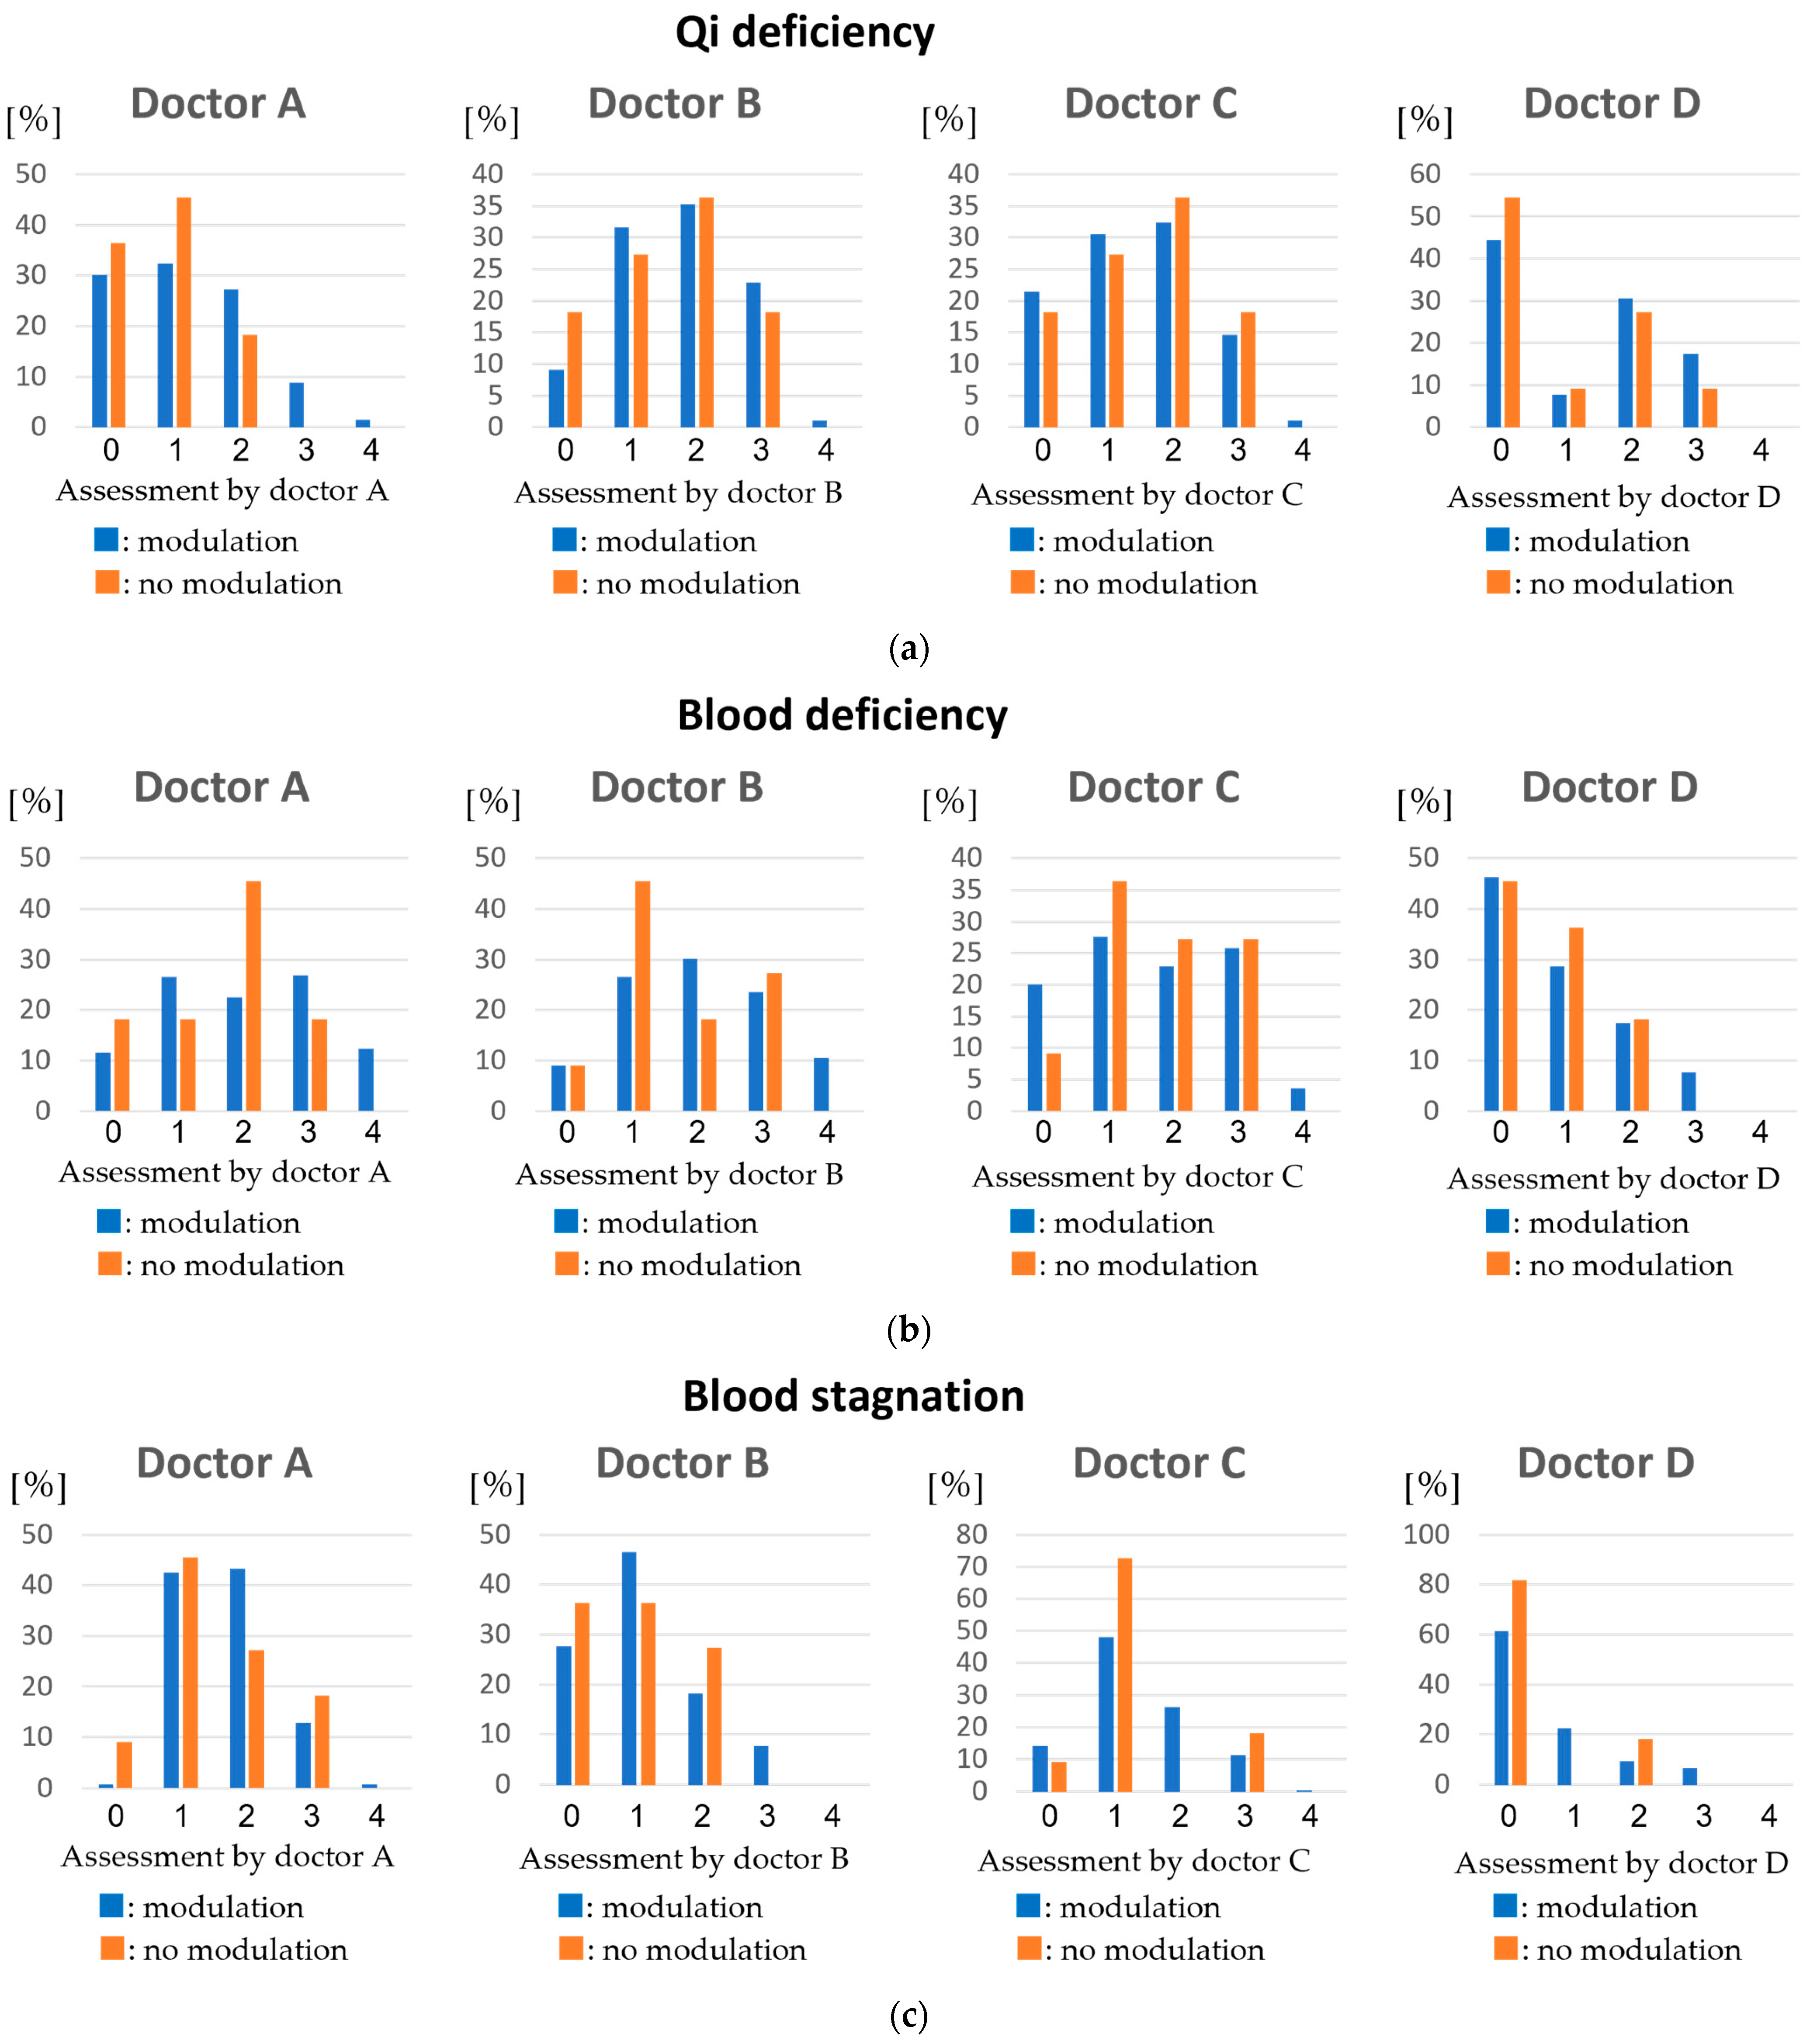
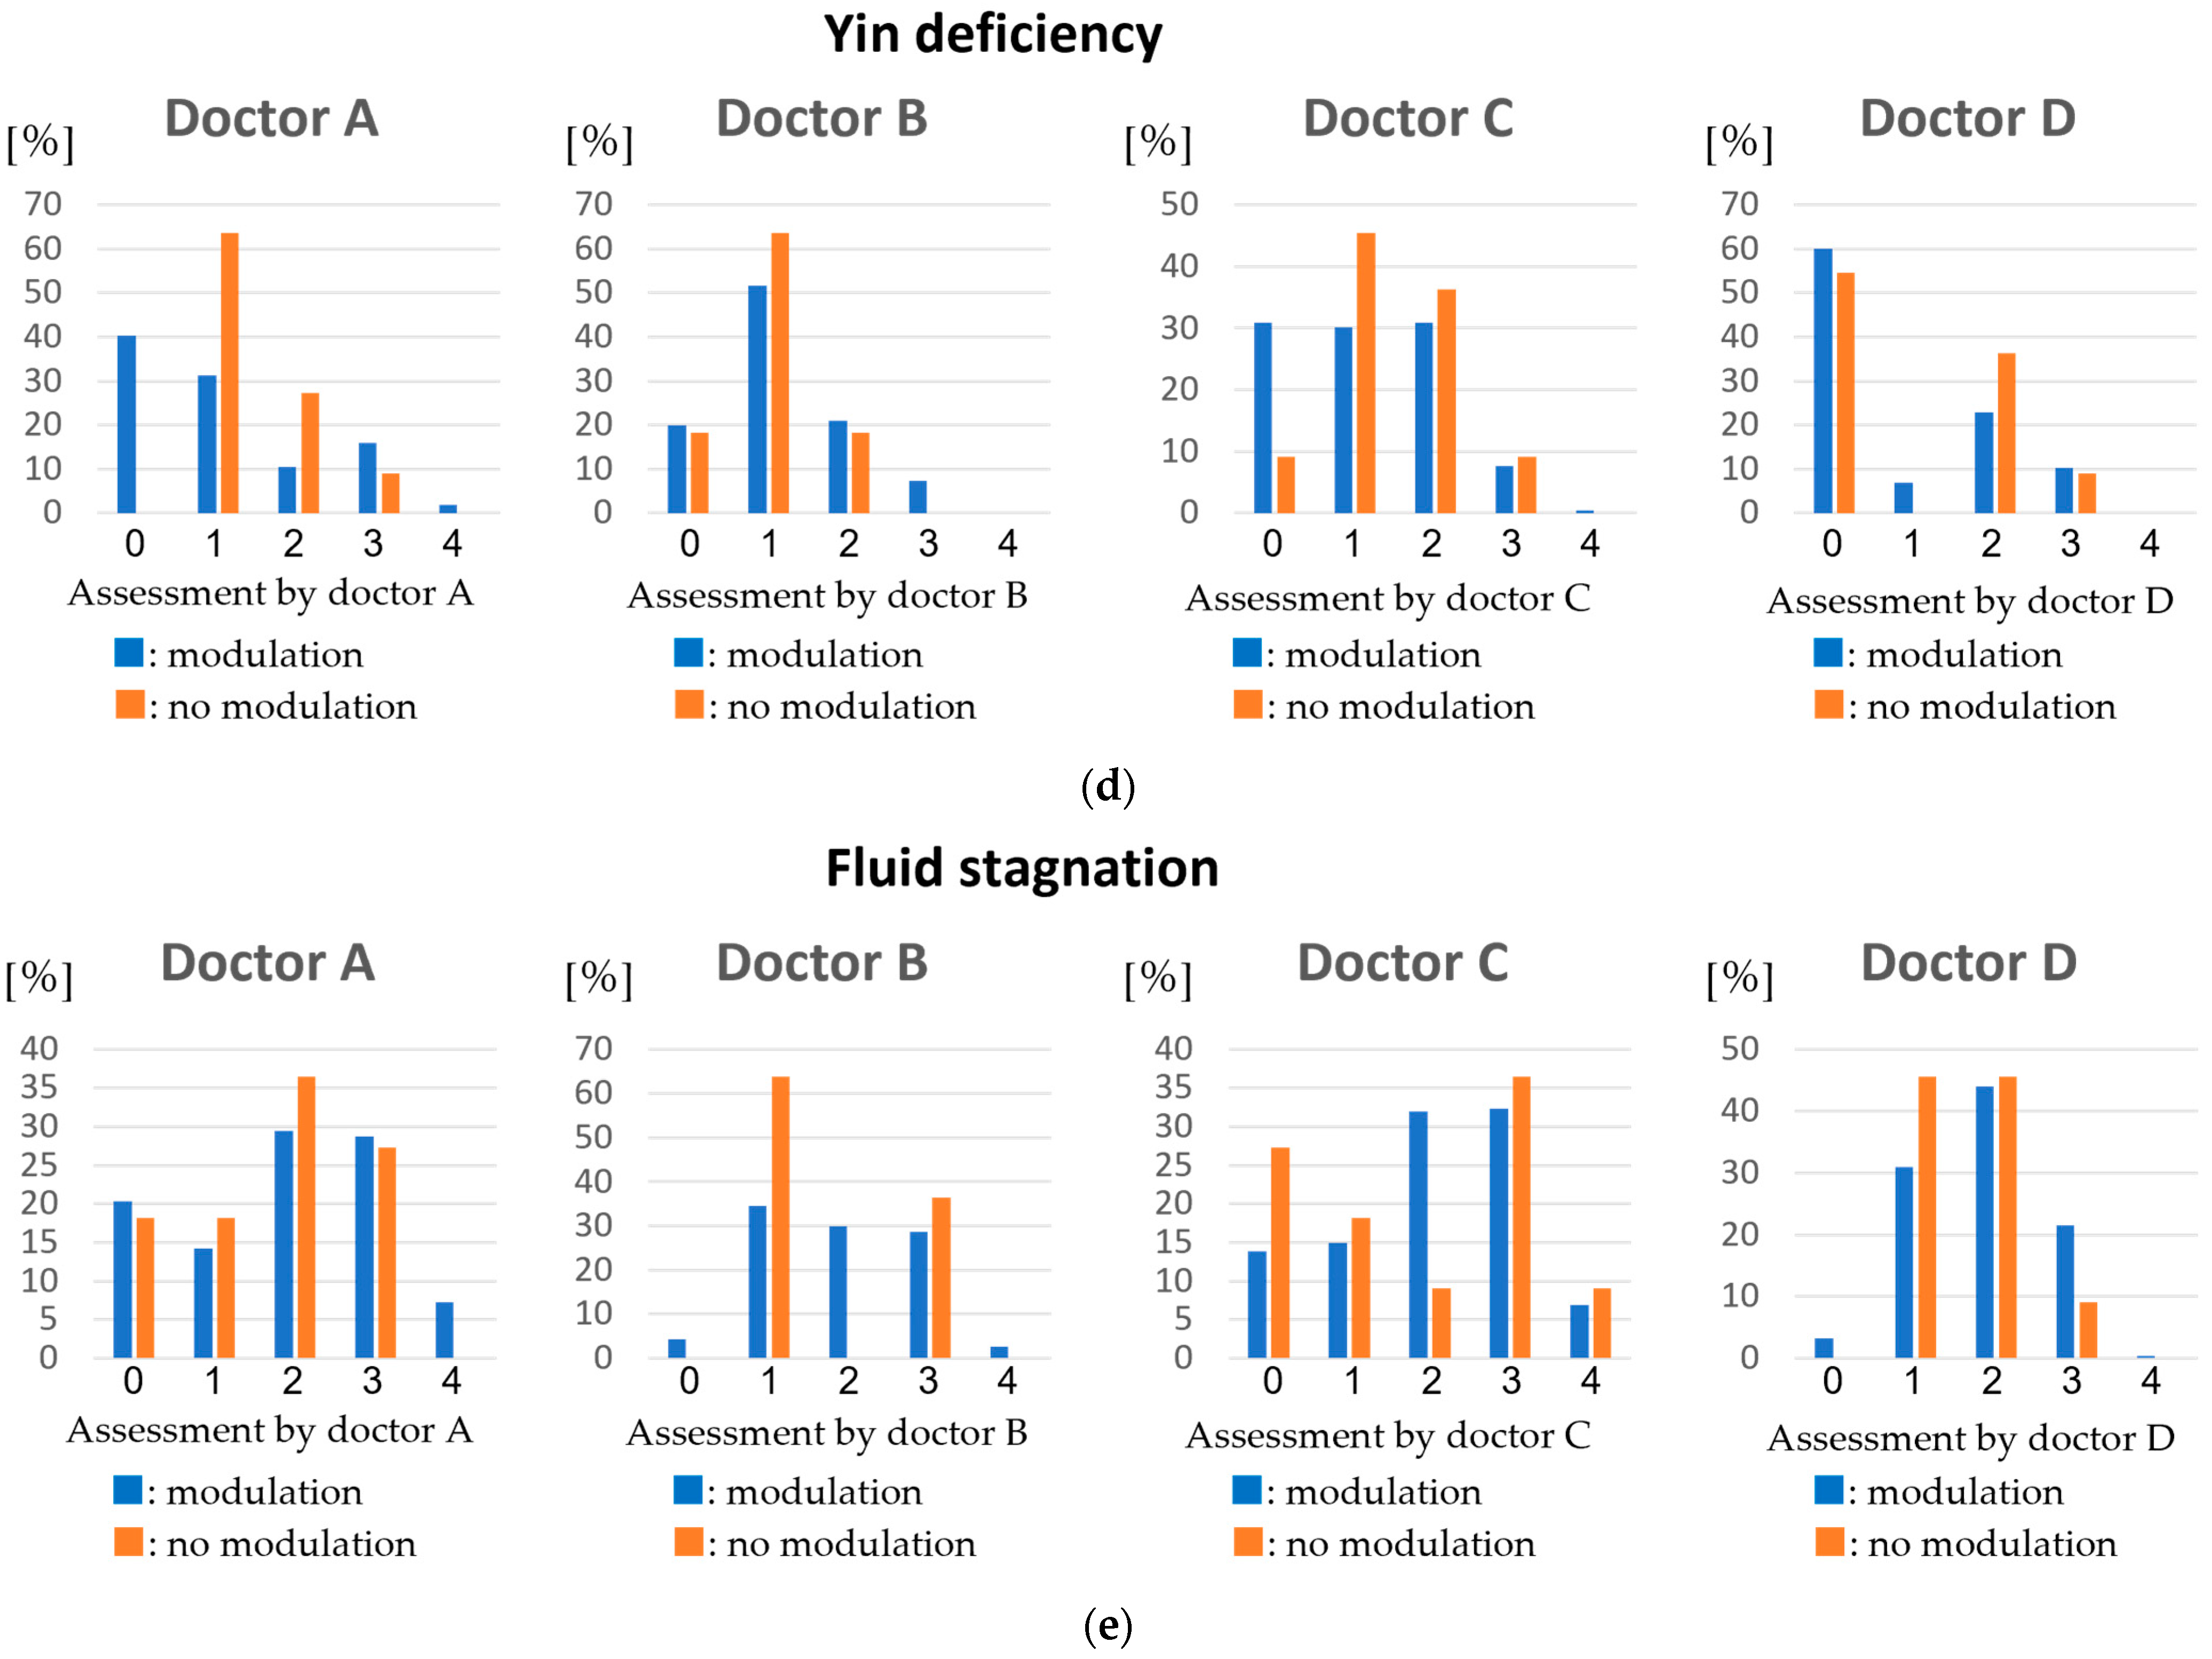
2.6. Subjective Evaluation of Diseases by Kampo Doctors Using Tongue Images

One doctor who specialized in Kampo medicine (the evaluator) evaluated each tongue image to diagnose the subjects. The evaluation was performed in a darkened room, with 80 cm between the display and the evaluator, and a display size of 51 cm. The screen was displayed in device-independent sRGB color. There was no other lighting in the darkened room, and the Kampo doctor evaluated the results using only the display light. The evaluator assessed the five conditions that can be diagnosed from images of the tongue—qi deficiency, blood deficiency, blood stagnation, yin deficiency, and fluid stagnation—as values of 0, 1, 2, 3, and 4, with smaller values indicating greater severity. As the data were augmented by modulation, this produced some images of tongues that were unrepresentative; tongue images judged as unrepresentative based on the experience of the doctor were excluded. The display showed images of the tongue randomly extracted from a set of unexamined images. The evaluator evaluated the images, and the display turned dark when the evaluation ended. Four seconds later, the randomly selected images were displayed again. This was repeated until the entire collection of tongue images had been assessed. To prevent a decline in evaluation capability due to fatigue, the evaluator was allowed to take appropriate breaks. Interruptions in the experiment were timed to complete the evaluation of all five conditions for the immediately preceding sample, and the display was darkened during the interruption. Since the experiment was conducted in two locations and it was difficult to unify the light, the experiment was conducted in a dark room. By using the above method for assessment, the environment was unified among all the evaluators, and the assessment was not affected by factors other than the tongue image. This makes machine learning of disease diagnosis from tongue images work effectively. Evaluations were then conducted by four other Kampo doctors. Figure 7 shows the percentages of correct values assigned by each of the four doctors for each condition when data modulation was not performed, and the percentages when modulation was performed. As the data were obtained from generally healthy subjects, the percentage of correct answers was biased before data modulation, but this bias decreased after modulation for many conditions. The percentage of each correct value was calculated using Equation (6):
P e r c e n t a g e   o f   c o r r e c t   v a l u e s   ( % ) = N u m b e r   o f   e a c h   e v a l u a t i o n   v a l u e N u m b e r   o f   i m a g e s × 100
We used a dataset of 275 pairs obtained by modulating the images of the tongues of 11 subjects for machine learning, and to assess its accuracy.

2.7. Feature Selection from 27 Features

As a pre-processing step for machine learning, the following Equation (7) was used to standardize the acquired features:
X s t n = X X m e a n X s t d
where X is the feature to be standardized, X s t n is the feature after standardization, X m e a n is the mean value of the feature to be standardized, and X s t d is the standard deviation of the feature to be standardized.
Support vector regression (SVR) was used for machine learning [13]. In machine learning, training with ineffective features may reduce the accuracy of estimation compared with training using only the optimal features. This is because generalization performance decreases due to over-learning, and the selection of optimal features plays an important role in improving the diagnostic accuracy of machine learning. We used the step-forward selection (SFS) [14] method to choose the best combination of features to evaluate each disease. SFS selects features using the following procedure: the computer learns and independently evaluates each image using all features, and then chooses the ones with the highest evaluation accuracy; it then adds one of the remaining features to the selected feature and learns and evaluates it. This process was repeated for all features. Features were added until the evaluation accuracy no longer increased.
The SVR parameters used for training were C = 100, γ = 0.1, and ε = 0.1. Features that were determined to be optimal for the evaluation of each disease are shown in Table 3. The average of the four evaluators was used as the correct value for learning. Table 4 shows the mean absolute error (MAE) between the values of the correct answers by the Kampo doctors and the estimated values obtained by SVR before and after feature selection. The evaluation accuracy increased when feature selection was used. Thus, the feature selection was appropriate. The MAE can be calculated from Equation (8):
M A E = 1 n i = 0 n 1 | y i y ^ i |
where n is the number of evaluations made, y i is the i th evaluation value given by the doctor, and y ^ i is the i th prediction value.

3. Results

Table 5 shows the MAE of the correct and estimated values before and after data modulation when the evaluation value of each Kampo doctor was taken as the correct value. Each disease was diagnosed using features selected through the SFS method and the parameters were optimized by grid searching. Data modulation improved the accuracy of the diagnosis of most diseases.

4. Discussion

The correct answers were assigned a value from 0 to 4, with adjacent values having close meanings. Therefore, this method yielded good diagnostic performance when the MAE was less than 1. Table 5 shows that the highest accuracy was achieved by using the average assessment of the four Kampo doctors as the correct value. As shown in Table 6, RMSE also showed high accuracy. This can be attributed to the fact that taking the average suppressed the degree of error and lessened the subjectivity. Also shown in Table 6 is the accuracy of the evaluation using RMSE (root mean squared error), with the average value of the evaluation of the four Kampo doctors as the correct value. As in Table 5, it was shown that the accuracy was improved by modulation and high accuracy was obtained. The distribution of the ratings of the Kampo doctors shown in Figure 7 indicates some evaluation error between doctors. The proposed method was accurate because the error in its results was smaller than 1, and the neighboring assessment values had very close meanings. The features chosen by feature selection were closely related to the aspects of evaluation attended to by the Kampo doctors. The most important features were the tongue gloss, color, and shape in the diagnosis of qi deficiency; color and shape for blood deficiency; color for blood stagnation; gloss for yin deficiency; and shape for fluid stagnation. This shows that the features that were considered important by the Kampo doctors had been selected by the proposed method. However, we did not use the features of form (for example, size and tooth marks). Therefore, it was not possible to determine the dominant features of fluid stagnation, which is highly influenced by form. This was also evident in the final diagnostic results. The diagnostic accuracies for the detection of qi deficiency and fluid stagnation, where shape is important, were worse than those for the other diseases. These results suggest that the addition of new features related to shape may improve the diagnostic accuracy.
In this study, tongue images were taken from healthy subjects. However, we were able to efficiently generate tongue data that could be diagnosed as score 4 (sick) by data augmentation. The doctors who evaluated the tongue images commented that the evaluation images were realistic, but some of the tongue colors were not realistic. In the future, we would like to improve this point in cooperation with doctors.
The data set created in this study contains only a small number of subjects and only Japanese subjects. In the future, we would like to collect data from more races to create a meaningful dataset that can be released to the public.
The limitations of this study are therefore:
  • Some modulated data for data augmentation were not naturally observed tongue data.
  • A polarization camera is required instead of a regular camera.

5. Conclusions

We developed an evaluation system that considers the gloss and color components of images of the tongue taken by a polarizing camera to diagnose diseases according to the principles of Kampo medicine.
The number of samples was increased from 11 original images to 275 images by modulating the color and gloss. A total of 27 gloss- and color-related features were obtained and combined with subjective evaluation by a Kampo doctor to generate the training data. The MAE of SVR was 0.44 for qi deficiency, 0.42 for blood deficiency, 0.33 for blood stagnation, 0.36 for yin deficiency, and 0.55 for fluid stagnation, when the parameters were optimized by grid searching. The evaluation errors for all diseases were less than 1, indicating reasonable evaluation accuracy.
As in Matsushita et al. [6], after each of the four Kampo doctors made a diagnosis, machine learning was performed using each evaluation as the ground truth. In this study, it was found that individual differences were generated among doctors in their evaluation of tongue images. The highest accuracy was obtained by taking the average of the evaluation values of the doctors as the ground truth. This is because errors and blur caused by one doctor’s diagnosis and knowledge were reduced by taking the average. By using machine learning to reproduce the average of multiple doctors’ evaluations, it is hoped that quantitative diagnosis that eliminates the subjective blurring of individual doctors will become possible.
The results of feature selection were consistent with the evaluation values assigned by the Kampo doctors, indicating their correctness. As the diagnosis of fluid stagnation requires numerous features, no useful set of features was available for this condition. Adding the shape of the tongue as a feature may improve the accuracy of the diagnosis.
The advantage of this study is that the equipment is simple and easy to reproduce, and the number of data can be easily collected through data augmentation. The results of this study indicate that the polarization camera can be used to diagnose the condition of individual patients. By collecting more data and improving the accuracy of the system, it can be expected to develop into a system that allows doctors to monitor the condition of patients and provide appropriate care without having to diagnose all patients.
As for the issues, the later assessments may have been more accurate as the Kampo doctors became familiar with the evaluation of tongue images. Future research should include more stable subjective evaluation methods, such as multiple practice sessions for the Kampo doctors.
In future work, more tongue images should be collected and re-evaluated because some of the pathological conditions were biased, as described above. In addition, by adding the features of tongue shape, the accuracy of the proposed method can be improved for the diseases with low diagnostic accuracy in the present study. Another option is to incorporate continuous learning, as implemented by Pianykh et al. [15]. By building a system that can continuously learn from the opinions of more physicians and tongue data with new cases, we can make more objective diagnoses with better generalization performance.

Author Contributions

Conceptualization, R.K. and K.O.-O.; formal analysis, R.K.; investigation, K.O.-O., A.S., K.H., J.A. and H.L.; methodology, R.K., K.O.-O. and H.L.; software, R.K.; supervision, N.T.; validation, A.S., K.H. and J.A.; writing—original draft, R.K.; writing—review and editing, K.O.-O., A.S., K.H., J.A. and N.T. All authors have read and agreed to the published version of the manuscript.

Funding

This research received no external funding.

Institutional Review Board Statement

This study was approved by the Ethical Board of Kanazawa University, School of Medicine (2018-154). All participants agree to the publication of the results obtained from the study. All results are decoded. Individual results cannot be tracked.

Informed Consent Statement

Informed consent was obtained from all subjects involved in the study.

Data Availability Statement

The data presented in this study are available on request from the corresponding author. The data are not publicly available due to we have not received permission from the subjects to do so.

Acknowledgments

We thank Sakura Matsumoto and Mako Iwahashi for providing the facilities and collecting tongue images. We also thank Kelly Zammit, BVSc, for editing a draft of this manuscript.

Conflicts of Interest

The authors declare no conflict of interest.

References

  1. Sato, Y. Introduction to Kampo: Japanese Traditional Medicine; The Japan Society for Oriental Medicine: Tokyo, Japan, 2005. [Google Scholar]
  2. Mitani, K. The lecture for the diagnosis of Kampo medicine: Boshin, especially for the diagnosis of tongue. Kampo Med. 2007, 58, 673–685. [Google Scholar] [CrossRef] [Green Version]
  3. Satoh, H. An introduction to Kampo medicine. Folia Pharmacol. Jpn. 2008, 132, 260–264. [Google Scholar] [CrossRef] [PubMed] [Green Version]
  4. Yamamoto, S.; Ishilawa, Y.; Nakaguchi, T.; Ogawa-Ochiai, K.; Tsumura, N.; Kasahara, Y.; Namiki, T.; Miyake, Y. Temporal Changes in Tongue Color as Criterion for Tongue Diagnosis in Kampo Medicine. Forsch. Komplementmed. 2012, 19, 80–85. [Google Scholar] [CrossRef] [PubMed]
  5. Wang, Y.; Zhou, Y.; Yang, J.; Xu, Q. An image analysis system for tongue diagnosis in traditional Chinese medicine. Comput. Inf. Sci. 2005, 3314, 1181–1186. [Google Scholar]
  6. Matsushita, F.; Kiyomitsu, K.; Ogawa, K.; Tsumura, N. Evaluation of Kampo disease states using facial images. Artif. Life Robot. 2019, 24, 44–51. [Google Scholar] [CrossRef] [Green Version]
  7. Zhang, J.; Xu, J.; Hu, X.; Chen, Q.; Tu, L.; Huang, J.; Cui, J. Diagnostic method of diabetes based on support vector machine and tongue images. BioMed Res. Int. 2017, 2017, 7961494. [Google Scholar] [CrossRef] [PubMed] [Green Version]
  8. Kainuma, M.; Furusyo, N.; Urita, Y.; Ikezaki, H.; Ura, K.; Nakaguchi, T.; Namiki, T. Objective tongue color and gastroesophageal reflux disease: Cross-sectional study. Tradit. Kampo Med. 2019, 6, 19–25. [Google Scholar] [CrossRef] [Green Version]
  9. Nakaguchi, T.; Ishilawa, Y.; Oji, T.; Yamamoto, S.; Tsumura, N.; Ueda, K.; Nagamine, K.; Namiki, T.; Miyake, Y. Proposal for a new noncontact method for measuring tongue moisture to assist in tongue diagnosis and development of the tongue image analyzing system, which can separately record the gloss components of the tongue. BioMed Res. Int. 2015, 2015, 249609. [Google Scholar] [CrossRef] [PubMed]
  10. Danser, M.M.; Mantilla Gomez, S.; Van der Weijden, G.A. Tongue coating and tongue brushing: A literature review. Int. J. Dent. Hyg. 2003, 1, 151–158. [Google Scholar] [CrossRef] [PubMed]
  11. Xu, J.; Tu, L.; Zhang, Z.; Zhou, C. The region partition of quality and coating for tongue image based on color image segmentation method. In Proceedings of the 2008 IEEE International Symposium on IT in Medicine and Education, Xiamen, China, 12–14 December 2008; pp. 817–821. [Google Scholar]
  12. Tsumura, N.; Ojima, N.; Sato, K.; Shiraishi, M.; Shimizu, H. Image-based skin color and quality analysis/synthesis by extracting hemoglobin and melanin information in the skin. ACM Trans. Graph. 2003, 22, 770–779. [Google Scholar] [CrossRef]
  13. Burges, C.J. A Tutorial on support vector machines for pattern recognition. Data Min. Knowl. Discov. 1998, 2, 121–167. [Google Scholar] [CrossRef]
  14. Leslie, K.P. An Introduction to Variable and Feature Selection. J. Mach. Learn. Res. 1998, 3, 1157–1182. [Google Scholar]
  15. Pianykh, O.S.; Langs, G.; Dewey, M.; Enzmann, D.R.; Herold, C.J.; Schoenberg, S.O.; Brink, J.A. A tutorial on support vector machines for pattern recognition. Radiology 2020, 297, 6–14. [Google Scholar]
Figure 1. Acquisition of surface and internal reflection using polarizing plate. (a) Polarization component of surface reflection and diffuse reflection; (b) Taking a gloss-enhanced image; (c) Taking a non-glossy image.
Applsci 11 09716 g001
Figure 2. Separation of the tongue into three components: (a) glossy image, (b) tongue coating, and (c) tongue body.
Applsci 11 09716 g002
Figure 3. Experimental setup used to capture the tongue images.
Applsci 11 09716 g003
Figure 4. Five levels of color modulation using the modulation coefficient α i .
Applsci 11 09716 g004
Figure 5. Five levels of gloss modulation using the modulation coefficient β i .
Applsci 11 09716 g005
Figure 6. Data augmentation by color and gloss modulation.
Applsci 11 09716 g006
Figure 7. Percentage of values evaluated by each of the four Kampo doctors (A, B, C, and D) for each disease after data modulation (blue bars), and without data modulation (orange bars): (a) Percentage of each correct value for qi deficiency; (b) Percentage of each correct value for blood deficiency; (c) Percentage of each correct value for blood stagnation; (d) Percentage of each correct value for yin deficiency; (e) Percentage of each correct value for fluid stagnation.
Applsci 11 09716 g007aApplsci 11 09716 g007b
Table 1. Body parts (tongue and face) used to diagnose each of the six diseases in Kampo medicine.
QiBloodFluid
DeficiencyTongueFace
Tongue
Face
Tongue
Stagnation Face
Tongue
Tongue
Table 2. Total (27) features obtained from each separated image.
From Glossy ImageFrom Tongue CoatingFrom Tongue Body
Mean of gloss L * Mean of coating a * , b * Mean of body a * , b *
Max of gloss L * Max of coating a * , b * Max of body a * , b *
Min of gloss L * Min of coating a * , b * Min of body a * , b *
Median of gloss L * Median of coating a * , b * Median of body a * , b *
Std of gloss L * Std of coating a * , b * Std of body a * , b *
Gross areaCoating area
Table 3. Features selected by step-forward selection for each disease.
Diseases
Qi DeficiencyBlood DeficiencyBlood StagnationYin DeficiencyFluid Stagnation
Median of body b *
Max of gloss L *
Mean of body b *
Median of body b *
Max of gloss L *
Mean of body b * Std of gloss L *
Mean of gloss L *
Min of gloss L *
Min of body b *
Min of gloss L *
Max of gloss L *
Median of gloss L *
Table 4. Mean absolute error between the correct value assigned by the Kampo doctors and the estimated value by SVR before and after feature selection for each disease.
Diseases
Qi DeficiencyBlood DeficiencyBlood StagnationYin DeficiencyFluid Stagnation
Using all features0.510.520.490.500.60
Using selected features0.440.420.330.360.55
Table 5. Mean absolute error between the correct value (using the value assigned by each Kampo doctor) and the value estimated by support vector regression for each disease using data with no modulation (no modu.) and modulation (modu.).
Diseases
Qi deficiencyBlood DeficiencyBlood StagnationYin DeficiencyFluid Stagnation
Doctor.Ano modu.0.940.750.911.000.62
modu.0.640.710.620.550.77
Doctor.Bno modu.0.990.900.800.850.84
modu.0.700.730.550.570.75
Doctor.Cno modu.1.010.930.820.940.73
modu.0.840.990.640.810.90
Doctor.Dno modu.0.950.760.620.910.65
modu.0.830.710.600.860.56
Average of all doctorsno modu.0.590.610.530.580.68
modu.0.440.420.330.360.55
Table 6. Root mean squared error between the correct value (using average of values assigned by each Kampo doctor) and the value estimated by support vector regression for each disease using data with no modulation (no modu.) and modulation (modu.).
Diseases
Qi DeficiencyBlood DeficiencyBlood StagnationYin DeficiencyFluid Stagnation
Average of all doctorsno modu.0.710.730.620.670.77
modu.0.530.500.410.430.56
Publisher’s Note: MDPI stays neutral with regard to jurisdictional claims in published maps and institutional affiliations.

