
A Composite Velocity Map Imaging Spectrometer for Ions and 1 keV Electrons at the Shanghai Soft X-ray Free-Electron Laser

 ,
,
Abstract
:1. Introduction
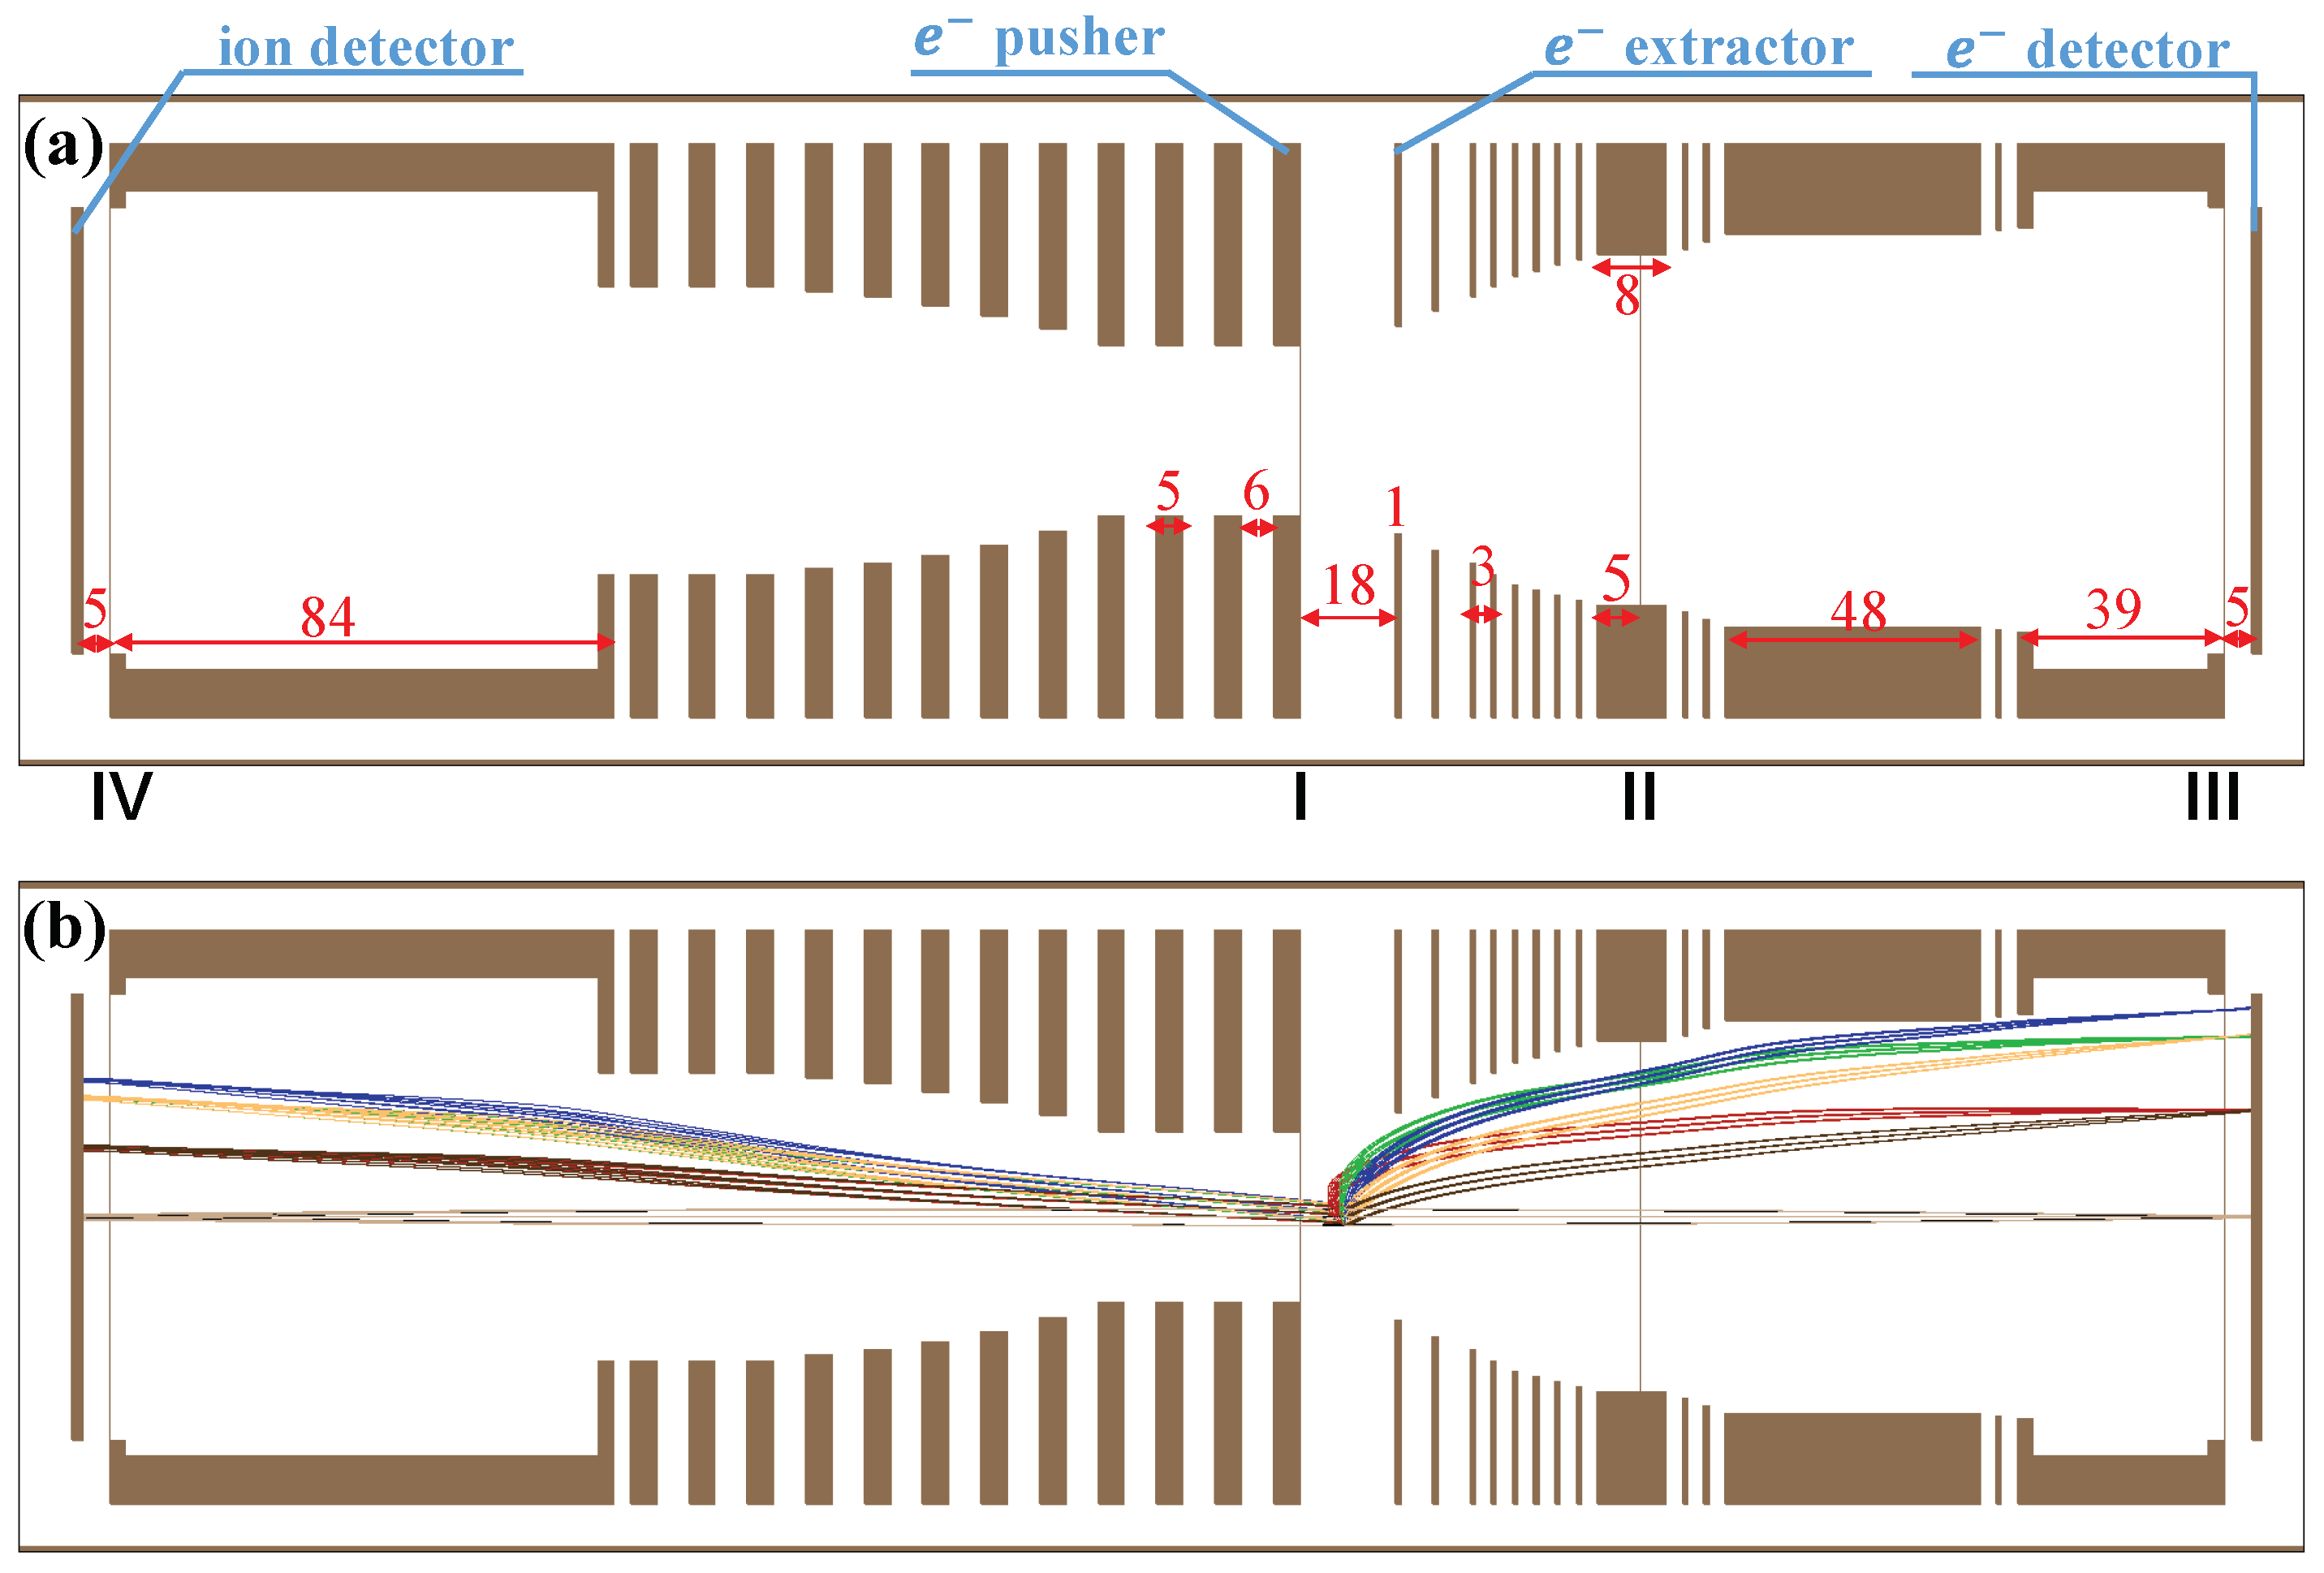
2. Structure of Spectrometer
3. Lens Design
4. Experimental Results
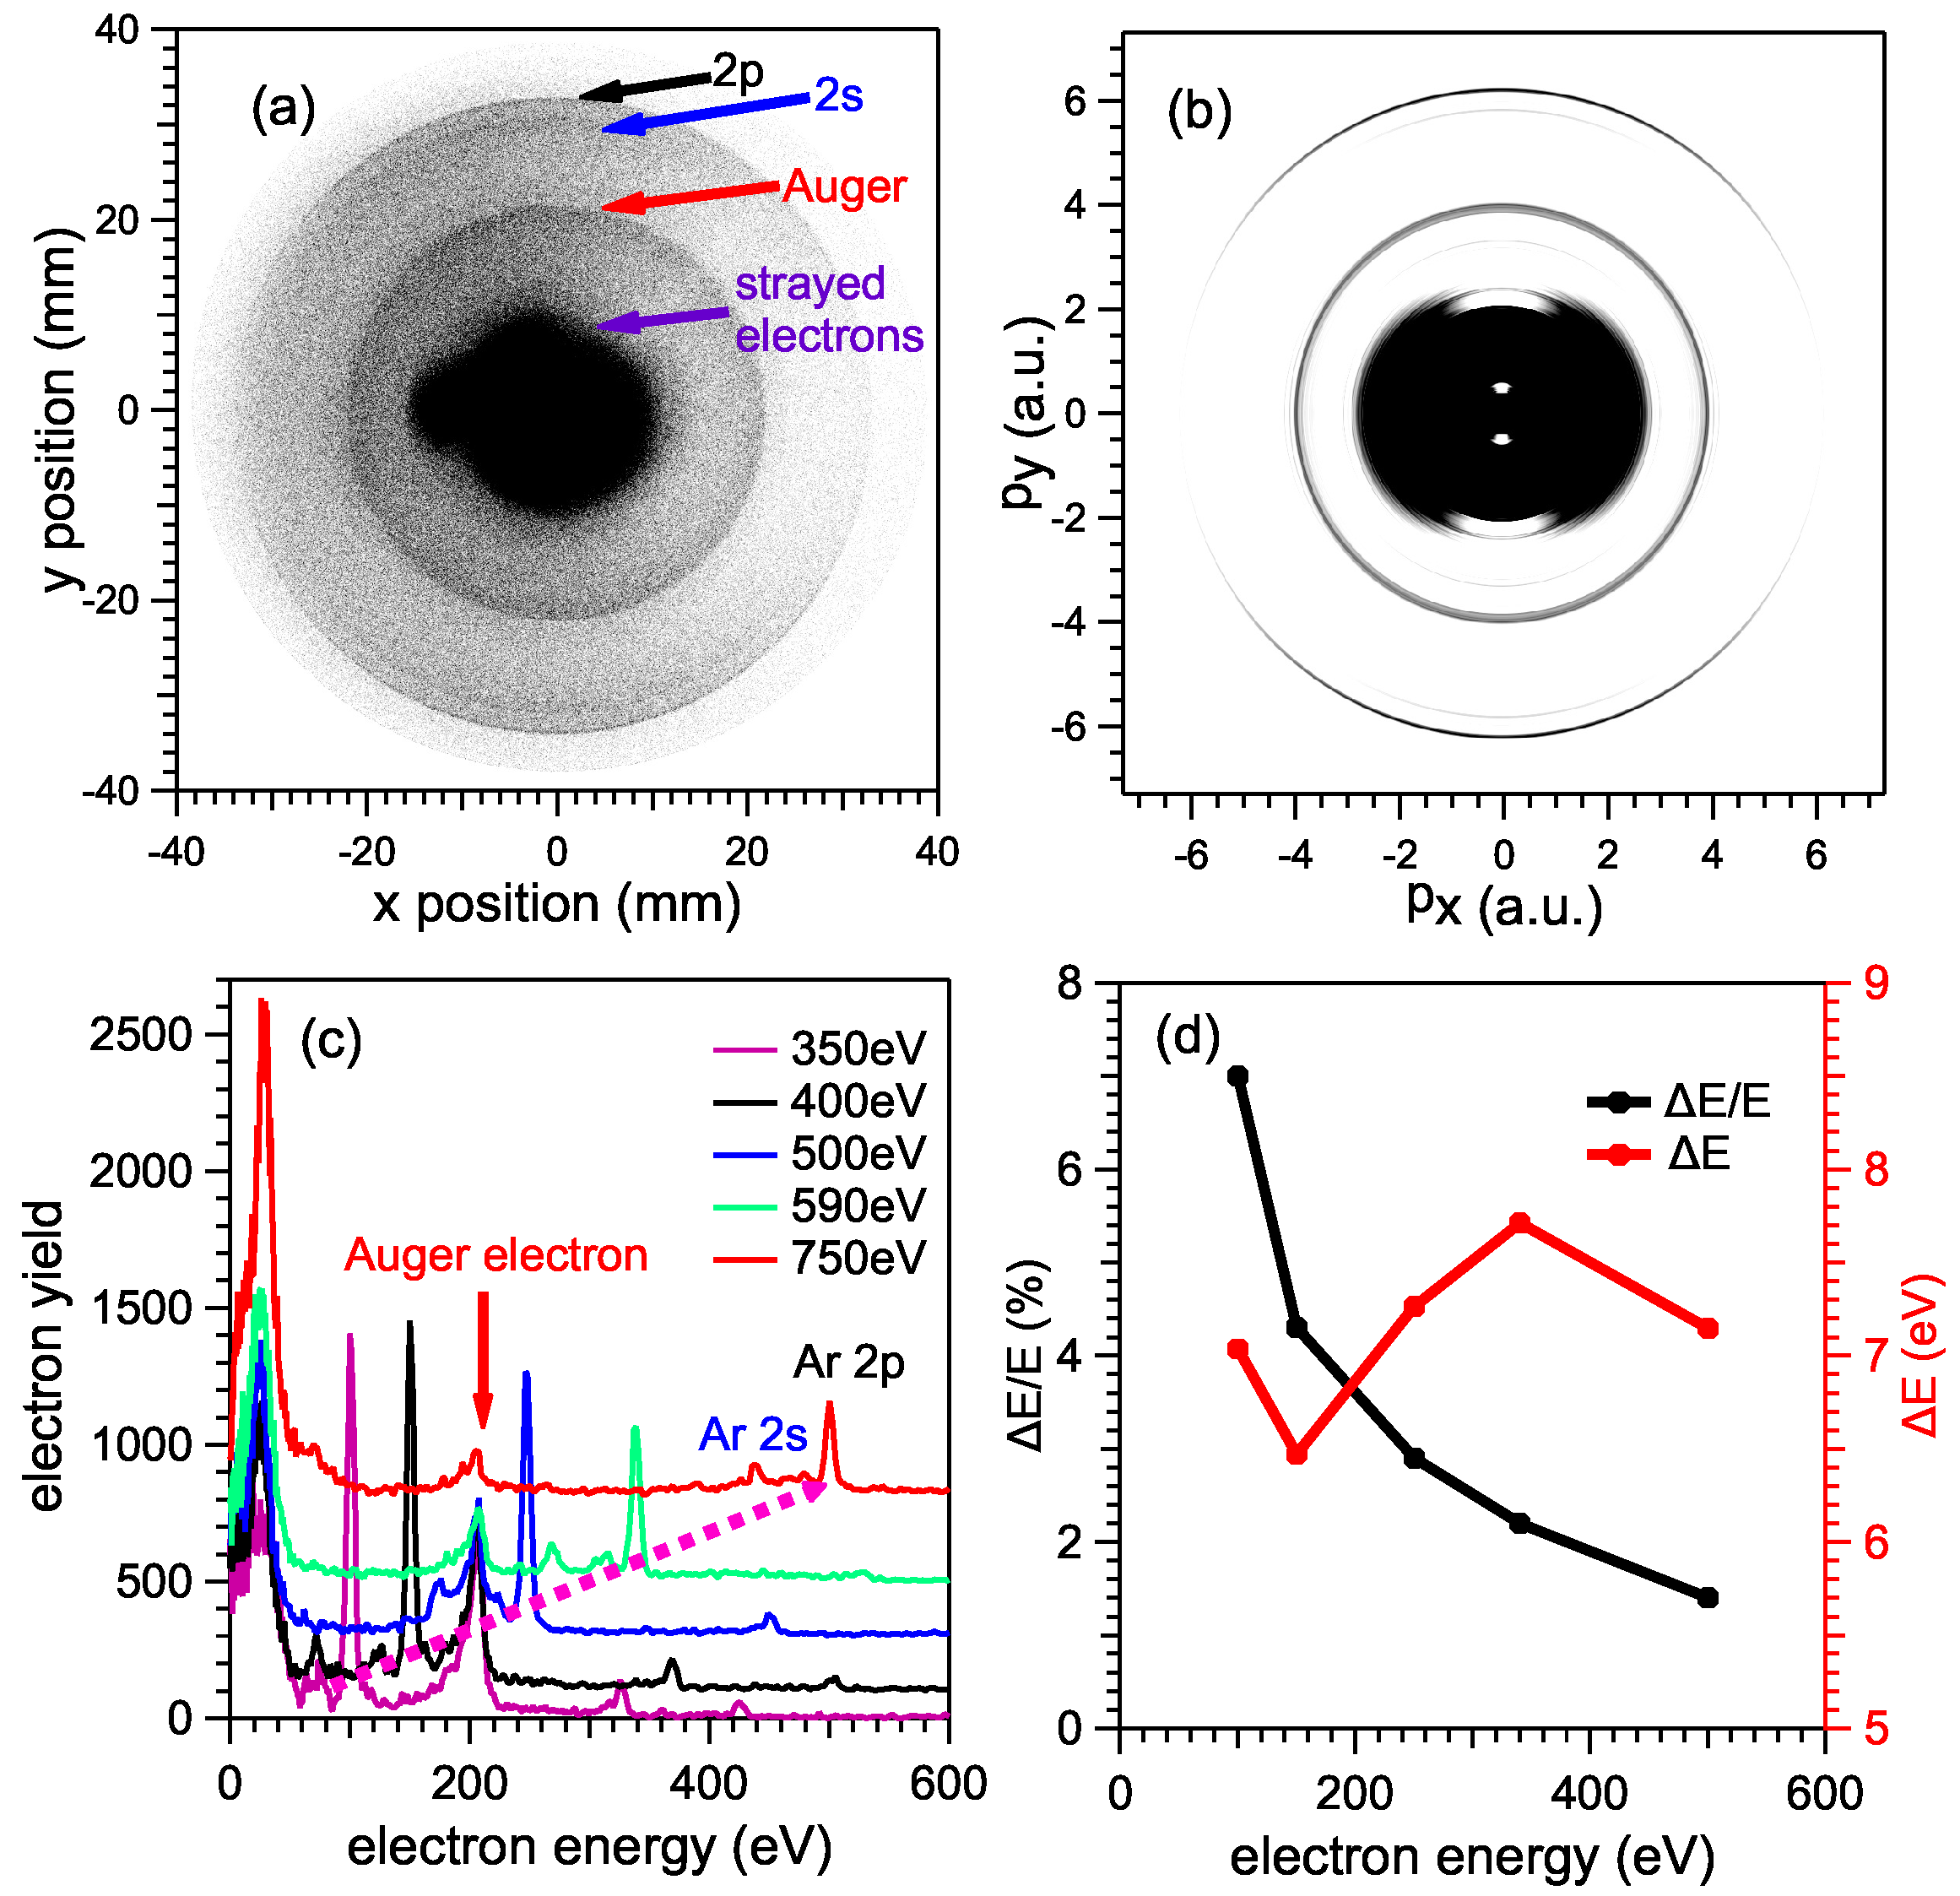
4.1. Electron Arm
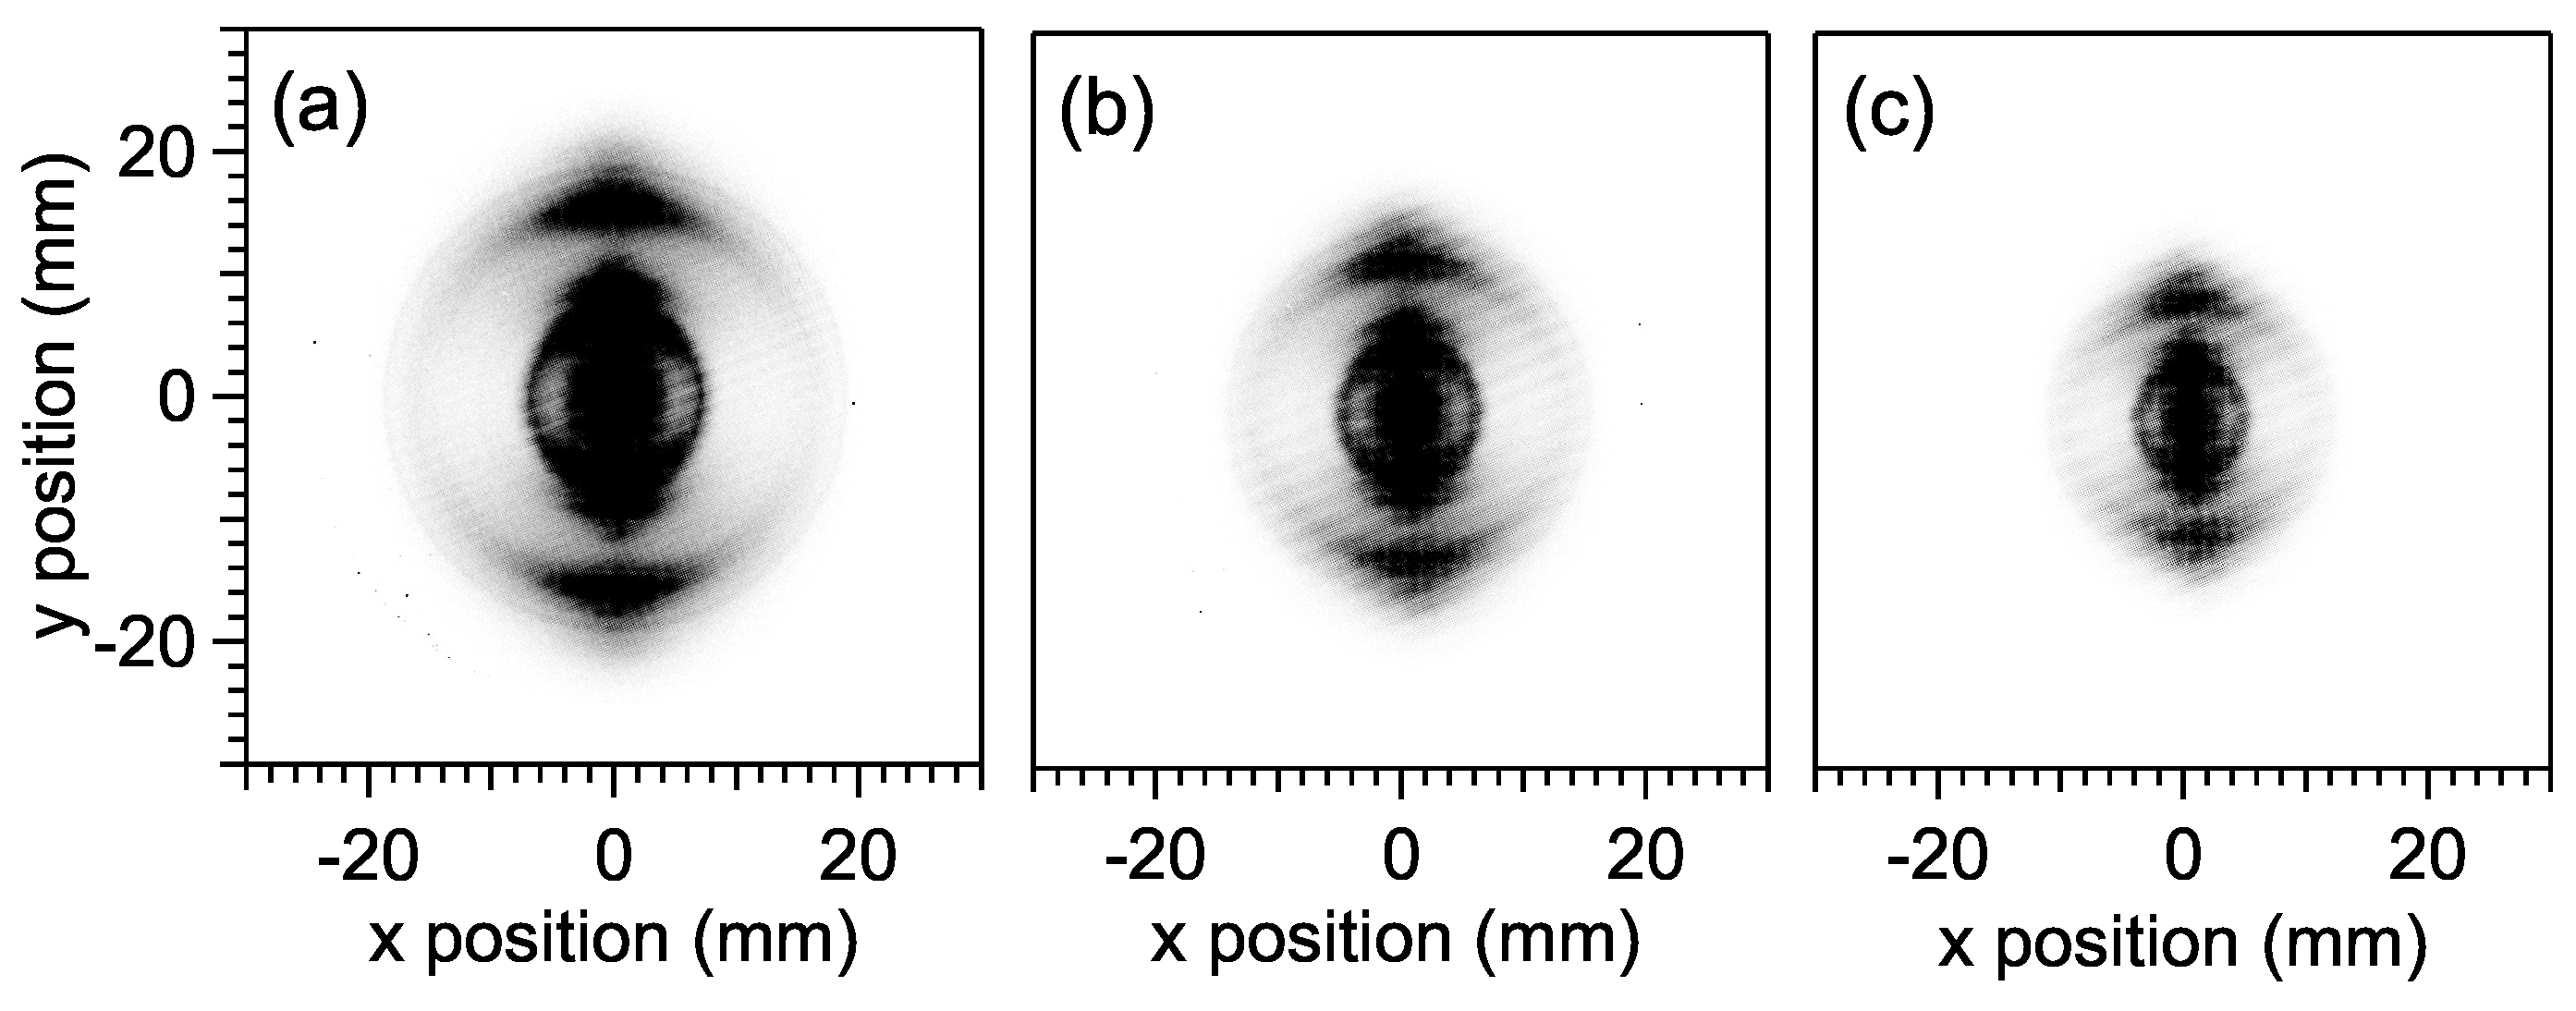
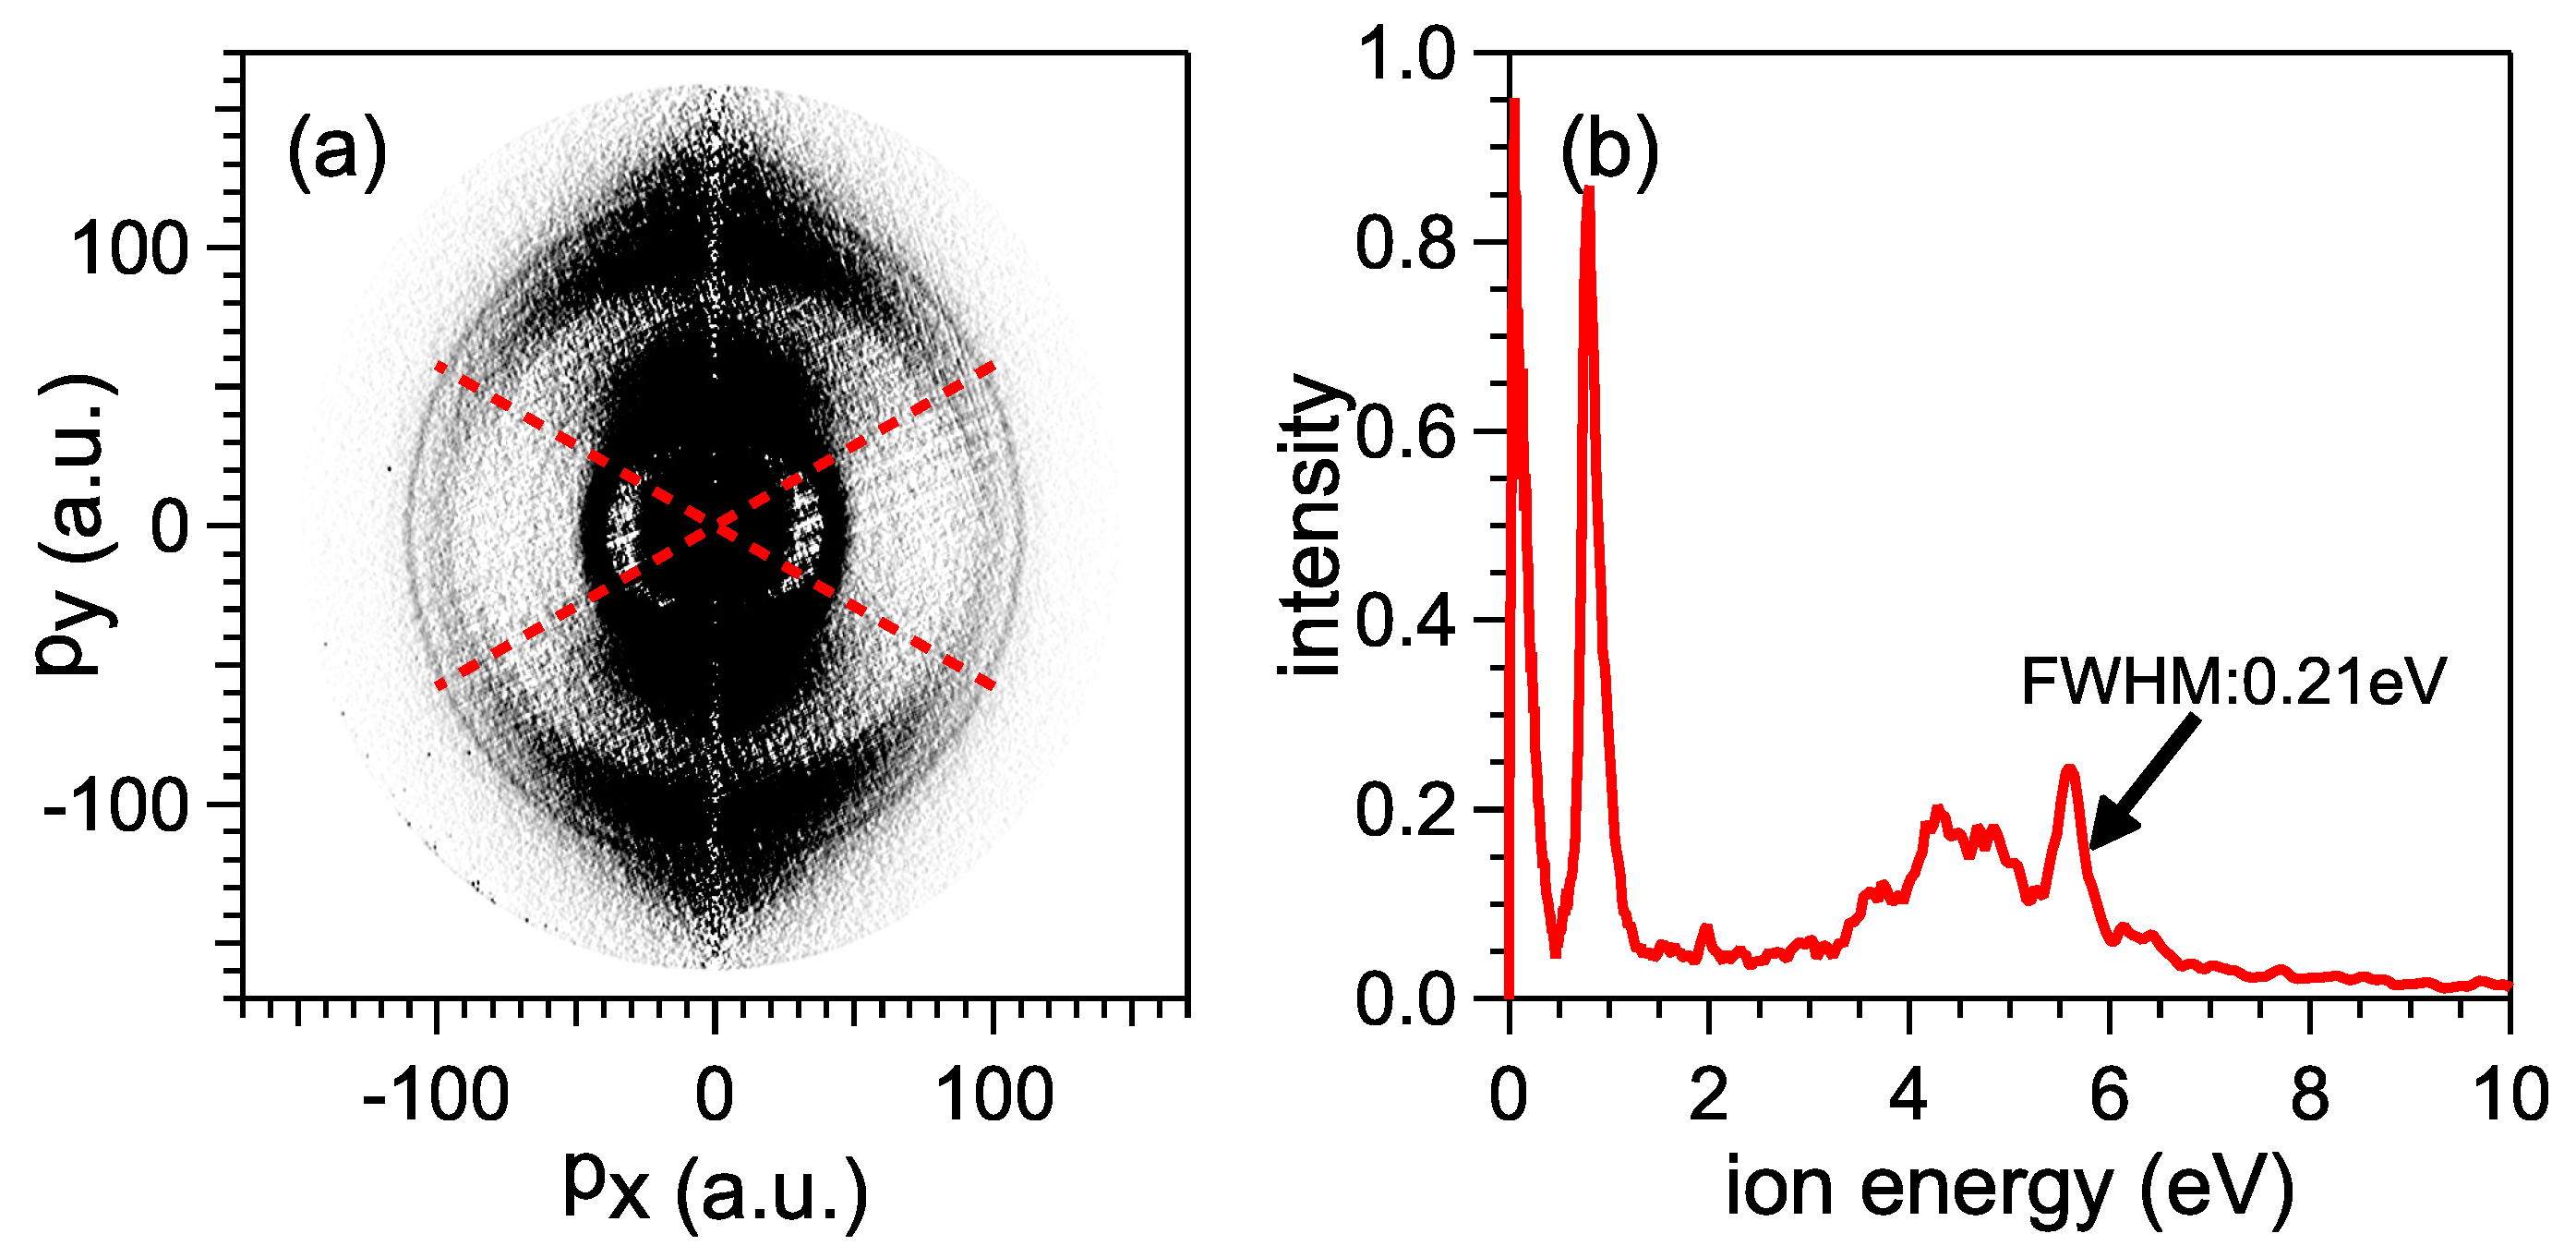
4.2. Ion Arm
5. Conclusions
Author Contributions
Funding
Acknowledgments
Conflicts of Interest
References
- Eppink, A.T.J.B.; Parker, D.H. Velocity map imaging of ions and electrons using electrostatic lenses: Application in photoelectron and photofragment ion imaging of molecular oxygen. Rev. Sci. Instrum. 1997, 68, 3477–3484. [Google Scholar] [CrossRef]
- Blaga, C.I.; Xu, J.; DiChiara, A.D.; Sistrunk, E.; Zhang, K.; Agostini, P.; Miller, T.A.; DiMauro, L.F.; Lin, C.D. Imaging ultrafast molecular dynamics with laser-induced electron diffraction. Nature 2012, 483, 194–197. [Google Scholar] [CrossRef] [PubMed]
- Agostini, P.; DiMauro, L.F. The physics of attosecond light pulses. Rep. Prog. Phys. 2004, 67, 813–855. [Google Scholar] [CrossRef]
- Fukuzawa, H.; Nagaya, K.; Ueda, K. Advances in instrumentation for gas-phase spectroscopy and diffraction with short-wavelength free electron lasers. Nucl. Instrum. Methods Phys. Res. Sect. A 2018, 907, 116–131. [Google Scholar] [CrossRef]
- Callegari, C.; Grum-Grzhimailo, A.N.; Ishikawa, K.L.; Prince, K.C.; Sansone, G.; Ueda, K. Atomic, molecular and optical physics applications of longitudinally coherent and narrow bandwidth Free-Electron Lasers. Phys. Rep. 2021, 904, 1–59. [Google Scholar] [CrossRef]
- Meckel, M.; Comtois, D.; Zeidler, D.; Staudte, A.; Pavičić, D.; Bandulet, H.C.; Pépin, H.; Kieffer, J.C.; Dörner, R.; Villeneuve, D.M.; et al. Laser-Induced Electron Tunneling and Diffraction. Science 2008, 320, 1478–1482. [Google Scholar] [CrossRef] [Green Version]
- Murphy, B.F.; Osipov, T.; Jurek, Z.; Fang, L.; Son, S.K.; Mucke, M.; Eland, J.H.D.; Zhaunerchyk, V.; Feifel, R.; Avaldi, L.; et al. Femtosecond X-ray-induced explosion of C60 at extreme intensity. Nat. Commun. 2014, 5, 4281. [Google Scholar] [CrossRef] [PubMed] [Green Version]
- Kazama, M.; Fujikawa, T.; Kishimoto, N.; Mizuno, T.; Adachi, J.I.; Yagishita, A. Photoelectron diffraction from single oriented molecules: Towards ultrafast structure determination of molecules using X-ray free-electron lasers. Phys. Rev. A 2013, 87, 063417. [Google Scholar] [CrossRef]
- Yagishita, A. Photoelectron angular distributions from single oriented molecules: Past, present and future. J. Electron Spectrosc. Relat. Phenom. 2015, 200, 247–256. [Google Scholar] [CrossRef]
- Öhrwall, G.; Karlsson, P.; Wirde, M.; Lundqvist, M.; Andersson, P.; Ceolin, D.; Wannberg, B.; Kachel, T.; Dürr, H.; Eberhardt, W.; et al. A new energy and angle resolving electron spectrometer—First results. J. Electron Spectrosc. Relat. Phenom. 2011, 183, 125–131. [Google Scholar] [CrossRef]
- Patanen, M.; Svensson, S.; Martensson, N. Electron spectroscopy using ultra brilliant synchrotron X-ray sources. J. Electron Spectrosc. Relat. Phenom. 2015, 200, 78–93. [Google Scholar] [CrossRef] [Green Version]
- Kothe, A.; Metje, J.; Wilke, M.; Moguilevski, A.; Engel, N.; Al-Obaidi, R.; Richter, C.; Golnak, R.; Kiyan, I.Y.; Aziz, E.F. Time-of-flight electron spectrometer for a broad range of kinetic energies. Rev. Sci. Instrum. 2013, 84, 023106. [Google Scholar] [CrossRef] [PubMed] [Green Version]
- Hikosaka, Y.; Sawa, M.; Soejima, K.; Shigemasa, E. A high-resolution magnetic bottle electron spectrometer and its application to a photoelectron—Auger electron coincidence measurement of the L2,3VV Auger decay in CS2. J. Electron Spectrosc. Relat. Phenom. 2014, 192, 69–74. [Google Scholar] [CrossRef]
- Laksman, J.; Buck, J.; Glaser, L.; Planas, M.; Dietrich, F.; Liu, J.; Maltezopoulos, T.; Scholz, F.; Seltmann, J.; Hartmann, G.; et al. Commissioning of a photoelectron spectrometer for soft X-ray photon diagnostics at the European XFEL. J. Synchrotron Rad. 2019, 26, 1010–1016. [Google Scholar] [CrossRef]
- O’Keeffe, P.; Feyer, V.; Bolognesi, P.; Coreno, M.; Callegari, C.; Cautero, G.; Moise, A.; Prince, K.C.; Richter, R.; Sergo, R.; et al. A velocity map imaging apparatus for gas phase studies at FERMI@Elettra. Nucl. Instrum. Methods Phys. Res. Sect. B 2012, 284, 69–73. [Google Scholar] [CrossRef]
- Tang, X.; Garcia, G.A.; Gil, J.F.; Nahon, L. Vacuum upgrade and enhanced performances of the double imaging electron/ion coincidence end-station at the vacuum ultraviolet beamline DESIRS. Rev. Sci. Instrum. 2015, 86, 123108. [Google Scholar] [CrossRef]
- Rading, L.; Lahl, J.; Maclot, S.; Campi, F.; Coudert-Alteirac, H.; Oostenrijk, B.; Peschel, J.; Wikmark, H.; Rudawski, P.; Gisselbrecht, M.; et al. A Versatile Velocity Map Ion-Electron Covariance Imaging Spectrometer for High-Intensity XUV Experiments. Appl. Sci. 2018, 8, 998. [Google Scholar] [CrossRef] [Green Version]
- Osipov, T.; Bostedt, C.; Castagna, J.C.; Ferguson, K.R.; Bucher, M.; Montero, S.C.; Swiggers, M.L.; Obaid, R.; Rolles, D.; Rudenko, A.; et al. The LAMP instrument at the Linac Coherent Light Source free-electron laser. Rev. Sci. Instrum. 2018, 89, 035112. [Google Scholar] [CrossRef]
- Ghafur, O.; Siu, W.; Johnsson, P.; Kling, M.F.; Drescher, M.; Vrakking, M.J.J. A velocity map imaging detector with an integrated gas injection system. Rev. Sci. Instrum. 2009, 80, 033110. [Google Scholar] [CrossRef]
- Ablikim, U.; Bomme, C.; Osipov, T.; Xiong, H.; Obaid, R.; Bilodeau, R.C.; Kling, N.G.; Dumitriu, I.; Augustin, S.; Pathak, S.; et al. A coincidence velocity map imaging spectrometer for ions and high-energy electrons to study inner-shell photoionization of gas-phase molecules. Rev. Sci. Instrum. 2019, 90, 055103. [Google Scholar] [CrossRef]
- Garcia, G.A.; Nahon, L.; Harding, C.J.; Mikajlo, E.A.; Powis, I. A refocusing modified velocity map imaging electron/ion spectrometer adapted to synchrotron radiation studies. Rev. Sci. Instrum. 2005, 76, 053302. [Google Scholar] [CrossRef]
- Skruszewicz, S.; Passig, J.; Przystawik, A.; Truong, N.X.; Köther, M.; Tiggesbäumker, J.; Meiwes-Broer, K.H. A new design for imaging of fast energetic electrons. Int. J. Mass Spectrom. 2014, 365–366, 338–342. [Google Scholar] [CrossRef] [Green Version]
- Kling, N.G.; Paul, D.; Gura, A.; Laurent, G.; De, S.; Li, H.; Wang, Z.; Ahn, B.; Kim, C.H.; Kim, T.K.; et al. Thick-lens velocity-map imaging spectrometer with high resolution for high-energy charged particles. J. Instrum. 2014, 9, P05005. [Google Scholar] [CrossRef]
- Schomas, D.; Rendler, N.; Krull, J.; Richter, R.; Mudrich, M. A compact design for velocity-map imaging of energetic electrons and ions. J. Chem. Phys. 2017, 147, 013942. [Google Scholar] [CrossRef] [PubMed] [Green Version]
- Li, S.; Champenois, E.G.; Coffee, R.; Guo, Z.; Hegazy, K.; Kamalov, A.; Natan, A.; O’Neal, J.; Osipov, T.; Owens, M.; et al. A co-axial velocity map imaging spectrometer for electrons. AIP Adv. 2018, 8, 115308. [Google Scholar] [CrossRef] [Green Version]
- Wiley, W.C.; McLaren, I.H. Time-of-Flight Mass Spectrometer with Improved Resolution. Rev. Sci. Instrum. 1955, 26, 1150–1157. [Google Scholar] [CrossRef]
- Meng, X.; Guo, Z.; Wang, Y.; Zhang, H.; Han, Y.; Zhao, G.; Liu, Z.; Tai, R. Design and performance of bending-magnet beamline BL02B at the SSRF. J. Synchrotron Rad. 2019, 26, 543–550. [Google Scholar] [CrossRef] [PubMed]
- Dick, B. Inverting ion images without Abel inversion: Maximum entropy reconstruction of velocity maps. Phys. Chem. Chem. Phys. 2014, 16, 570–580. [Google Scholar] [CrossRef] [PubMed]
- Voss, S.; Alnaser, A.S.; Tong, X.M.; Maharjan, C.; Ranitovic, P.; Ulrich, B.; Shan, B.; Chang, Z.; Lin, C.D.; Cocke, C.L. High resolution kinetic energy release spectra and angular distributions from double ionization of nitrogen and oxygen by short laser pulses. J. Phys. B At. Mol. Opt. Phys. 2004, 37, 4239–4257. [Google Scholar] [CrossRef] [Green Version]
- Hickstein, D.D.; Gibson, S.T.; Yurchak, R.; Das, D.D.; Ryazanov, M. A direct comparison of high-speed methods for the numerical Abel transform. Rev. Sci. Instrum. 2019, 90, 065115. [Google Scholar] [CrossRef] [PubMed]
- Zhao, A.; van Beuzekom, M.; Bouwens, B.; Byelov, D.; Chakaberia, I.; Cheng, C.; Maddox, E.; Nomerotski, A.; Svihra, P.; Visser, J.; et al. Coincidence velocity map imaging using Tpx3Cam, a time stamping optical camera with 1.5 ns timing resolution. Rev. Sci. Instrum. 2017, 88, 113104. [Google Scholar] [CrossRef] [PubMed]
- Debrah, D.A.; Stewart, G.A.; Basnayake, G.; Nomerotski, A.; Svihra, P.; Lee, S.K.; Li, W. Developing a camera-based 3D momentum imaging system capable of 1 Mhits/s. Rev. Sci. Instrum. 2020, 91, 023316. [Google Scholar] [CrossRef] [PubMed]


Publisher’s Note: MDPI stays neutral with regard to jurisdictional claims in published maps and institutional affiliations. |
© 2021 by the authors. Licensee MDPI, Basel, Switzerland. This article is an open access article distributed under the terms and conditions of the Creative Commons Attribution (CC BY) license (https://creativecommons.org/licenses/by/4.0/).
Share and Cite
Ding, B.; Xu, W.; Wu, R.; Feng, Y.; Tian, L.; Li, X.; Huang, J.; Liu, Z.; Liu, X. A Composite Velocity Map Imaging Spectrometer for Ions and 1 keV Electrons at the Shanghai Soft X-ray Free-Electron Laser. Appl. Sci. 2021, 11, 10272. https://doi.org/10.3390/app112110272
Ding B, Xu W, Wu R, Feng Y, Tian L, Li X, Huang J, Liu Z, Liu X. A Composite Velocity Map Imaging Spectrometer for Ions and 1 keV Electrons at the Shanghai Soft X-ray Free-Electron Laser. Applied Sciences. 2021; 11(21):10272. https://doi.org/10.3390/app112110272
Chicago/Turabian StyleDing, Bocheng, Weiqing Xu, Ruichang Wu, Yunfei Feng, Lifang Tian, Xiaohong Li, Jianye Huang, Zhi Liu, and Xiaojing Liu. 2021. "A Composite Velocity Map Imaging Spectrometer for Ions and 1 keV Electrons at the Shanghai Soft X-ray Free-Electron Laser" Applied Sciences 11, no. 21: 10272. https://doi.org/10.3390/app112110272
APA StyleDing, B., Xu, W., Wu, R., Feng, Y., Tian, L., Li, X., Huang, J., Liu, Z., & Liu, X. (2021). A Composite Velocity Map Imaging Spectrometer for Ions and 1 keV Electrons at the Shanghai Soft X-ray Free-Electron Laser. Applied Sciences, 11(21), 10272. https://doi.org/10.3390/app112110272