Article

Personalization of a Human Body Model Using Subject-Specific Dimensions for Designing Clothing Patterns

1
New Technologies—Research Centre, University of West Bohemia, Univerzitní 8, 201 00 Plzeň, Czech Republic
2
Faculty of Applied Sciences, University of West Bohemia, Univerzitní 8, 201 00 Plzeň, Czech Republic
3
Faculty of Education, University of West Bohemia, Univerzitní 8, 201 00 Plzeň, Czech Republic
4
Tianjin Technician Institute of Mechanical & Electrical Technology, Yaguan Road 17, Haihe Education Park District, Tianjin 300350, China
*
Author to whom correspondence should be addressed.
Appl. Sci. 2021, 11(21), 10138; https://doi.org/10.3390/app112110138
Submission received: 17 September 2021 / Revised: 20 October 2021 / Accepted: 26 October 2021 / Published: 29 October 2021

Abstract

:

Featured Application

Proving the considerable diversity in anthropometry variations over different population groups, the paper extends the existing scaling algorithm to a virtual biomechanical human body model by a personalization method leading to the development of subject-specific human body models. Such models serve to assess the injury risk and optimize personal protective equipment (PPE) for a specific person using a virtual approach and numerical simulation.

Abstract

Virtual human body models contribute to designing safe and user-friendly products through virtual prototyping. Anthropometric biomechanical models address different physiques using average dimensions. In designing, e.g., personal protective equipment, orthopedic tools, or vehicle safety systems, biomechanical models with the correct geometry and shape shall play a role. The presented study shows the variations of subject-specific anthropometric dimensions from the average of the different population groups in the Czech Republic and China as a background for the need for personalized human body models. The study measures a set of dimensions used to design clothing patterns of Czech children, Czech adolescents, Czech adults, and Chinese adults and compares them to the corresponding age average, which is represented by a scaled anthropometric human body model. The cumulative variation of the dimensions used to design the clothing patterns increases the further the population group is from the average. It is smallest for the Czech adults at 7.54 ± 6.63%; Czech adolescents report 7.93 ± 6.25%; Czech children differ be 9.52 ± 6.08%. Chinese adults report 10.86 ± 11.11%. The variations from the average of the particular dimensions used to design clothing patterns prove the necessity of having personalized subject-specific models. The measured dimensions used to design the clothing patterns serve as the personalization of particular body segments and lead to a subject-specific virtual model. The developed personalization algorithm results in the continuous body surface desired for contact applications for assessing body behavior and injury risk under impact loading.

1. Introduction

Virtual prototyping enables fast product design and optimization using numerical calculation [1]. Virtual human body models play an important role in the design of human-friendly and safe personal products [2]. Addressing the wide population, customized human body models [3,4] have a wide range of applications. Subject-specific human body models with a realistic shape are a powerful tool used in various fields including computer graphics, ergonomics, and garment and personal protective equipment (PPE) design [3]. In biomechanics, a virtual human body model with biofidelity can also serve to assess injuries caused by external impacts [5].
It can be difficult to experimentally assess optimization and design tasks taking into account wide populations (EU, U.S., ASEAN) with varying anthropometry. Hence, such a virtual approach towards injury risk assessment is useful for the development of safe products addressing autonomous driving, leisure riding, sports activities, sportswear and activewear, and many other fields.
There are two main steps in generating a customized virtual human body model, namely the scaling and the personalization of a reference model. The scaling procedure implements a reference model and updates its global dimensions to describe an average representative of the population group with the given anthropometry [6,7,8]. Whilst scaling changes only the global dimensions (anthropometry, mass, and stiffness) based on the general anthropometric parameters [6,7], personalization updates the local geometrical and biomechanical details of the particular human body segments [9,10,11] and so leads to a particular subject-specific model. In general, geometrically, the reference model is usually described by a cloud of nodes connected to elements creating the surface mesh. The personalization of such a model is usually based on mesh morphing [12], which needs to have a considerable number of corresponding landmarks defined on both the reference and the target models [13,14].
Both approaches are based on a reference model [15], which is a necessary starting point for the development of a subject-specific model. The scaling approach is simpler as it addresses only global (averaged) anthropometric dimensions for target population groups [7]. Scaling is a convenient tool for creating generic human body models representing a population group for virtual prototyping [8] as they have the correct mass distribution and body flexibility to cover a wide spectrum of the population. However, if we want to address the designing of PPE for a particular person, a subject-specific (personalized) approach is needed as scaling does not provide the details of the particular subject even inside a particular population group. Additionally, the anthropometry of particular segments might be unrealistic for different population groups when using only scaling. Therefore, personalization brings an additional value to improve the anthropometry of the particular dimensions of the particular subject, especially for pairing the human body with clothing, PPE, and the external environment in general.
The purpose of the paper is firstly to measure subject-specific anthropometric dimensions for different population groups, on the basis of which the personalization algorithm to develop a subject-specific human body model is developed as the second step. The anthropometric dimensions were inspired by the clothing industry where they are used for designing protective garments [16].
The subject-specific dimensions were compared to the average anthropometry, which was obtained by scaling the reference anthropometry [17] using the average anthropometric data for the population group [18]. Based on the measured dimensions, a personalization algorithm for creating a subject-specific human body model using only the dimensions used to design clothing patterns (body dimensions) was developed.
There are also other initiatives [19] and options (e.g., 3D scanning) to generate a subject-specific model using three-dimensional scanning; however, the paper benefits from the existing scalable validated biomechanical virtual human body and extends the scaling algorithm by the personalization to develop a mathematical model to be used for numerical simulations in Visual Performance Solution (VPS) [20].

2. Materials and Methods

2.1. Participants

Four population groups including adults, adolescents, and children were identified to show the variations in the particular anthropometric dimensions taking the territorial difference into account. The anthropometric measurements were carried out on Czech adults, employees of the University of West Bohemia, Czech children, and Czech adolescents during sports activities. The total number of subjects was 152 ranging in age from 6 y to 56 y. The Chinese adults were employees of the Tianjin Technician Institute of Mechanical & Electrical Technology. Their total number was 68, ranging in age from 24 y to 60 y. The males and females were equally represented.
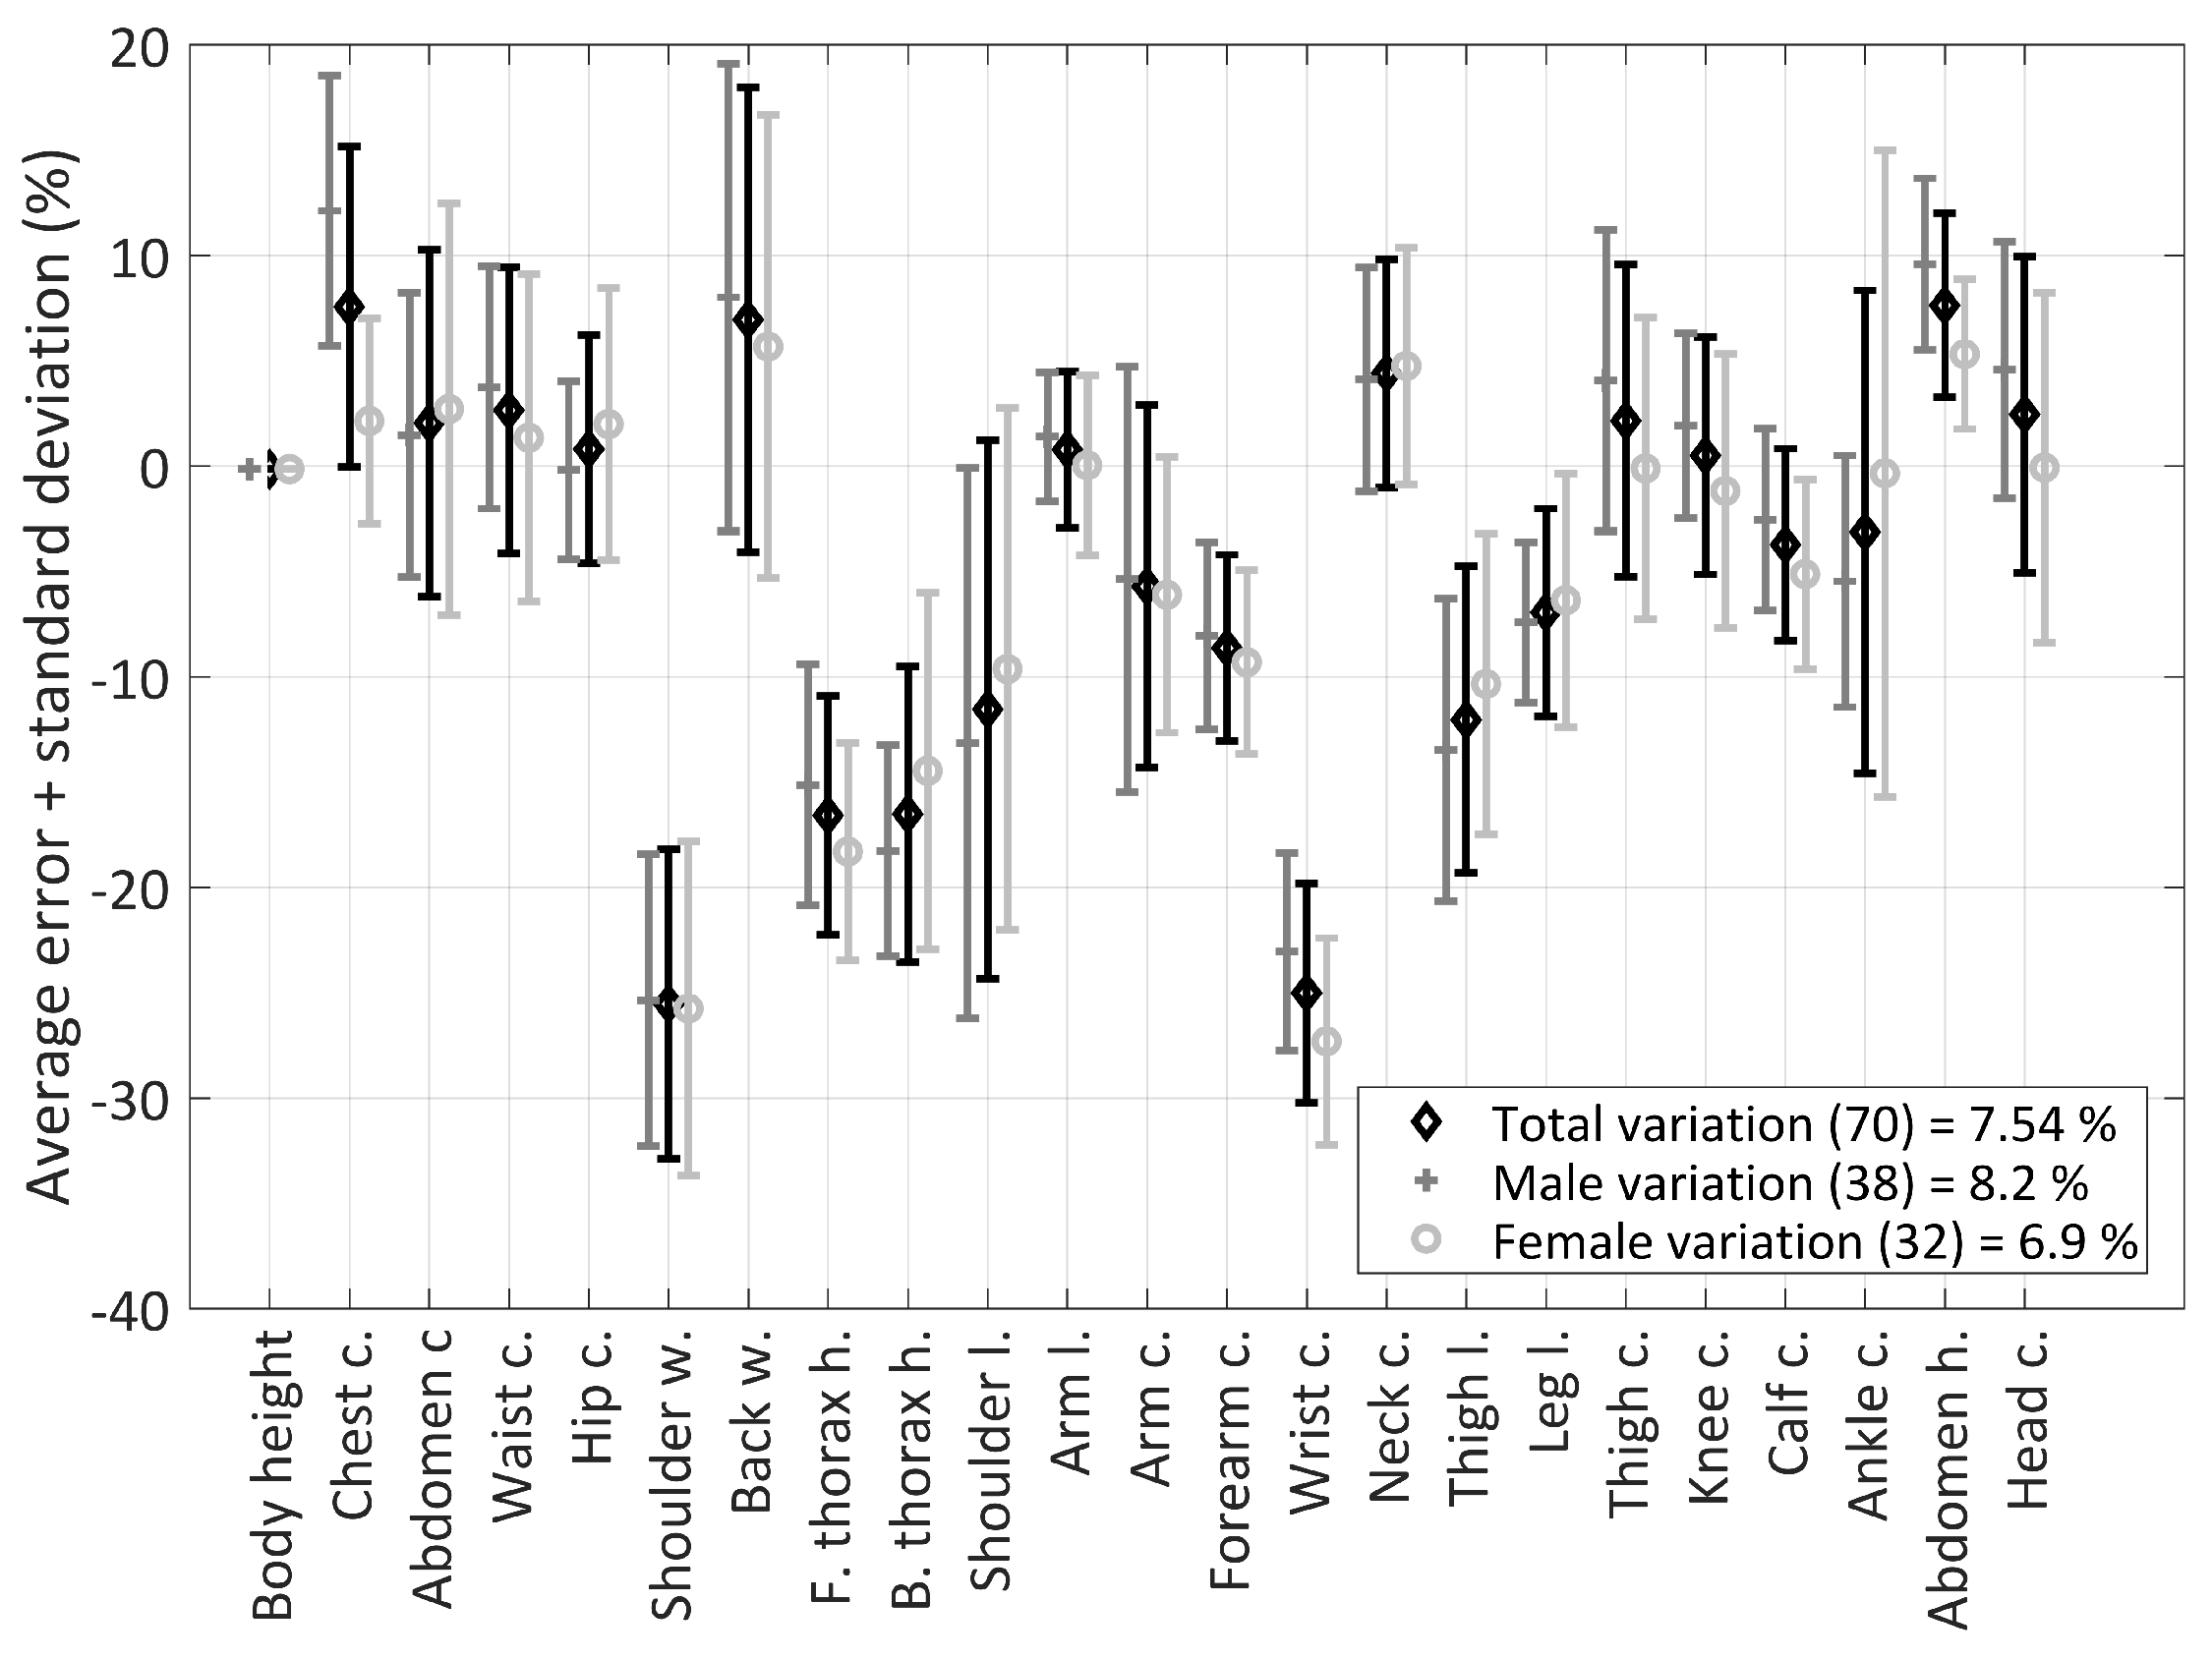
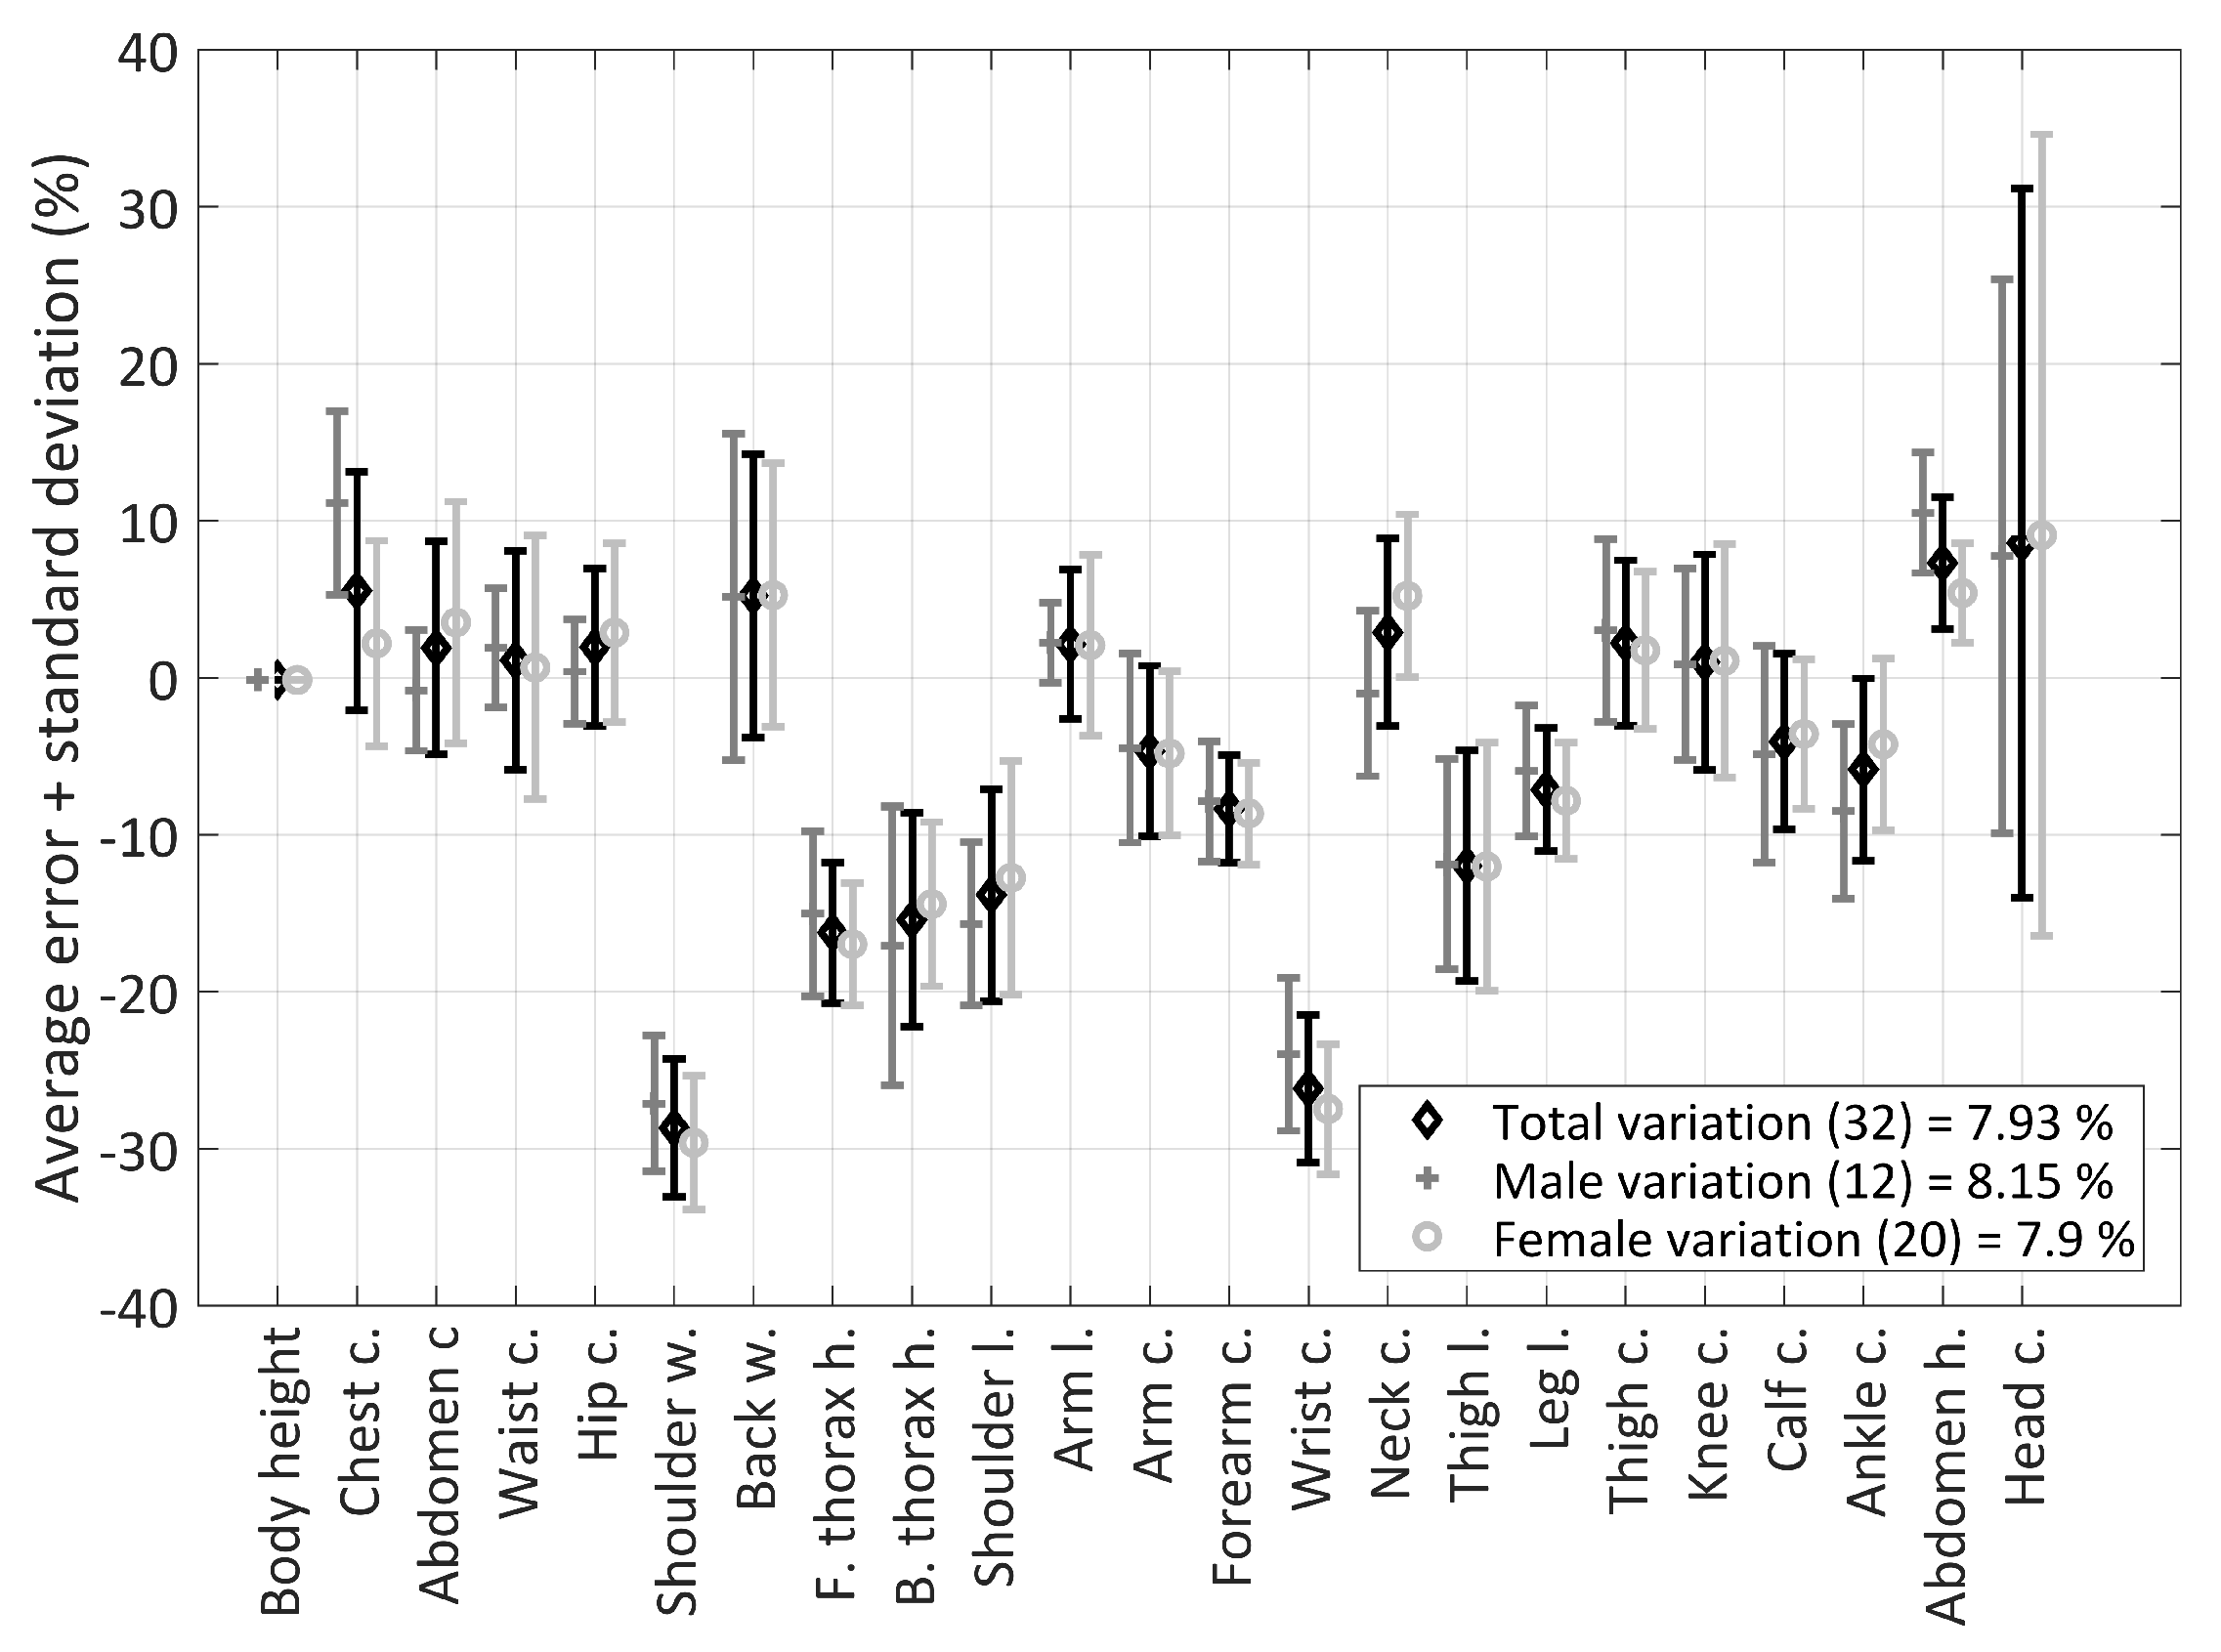
The measurements were carried out on adult students and adult employees (N = 70, of which 38 males and 32 females, aged between 20 y and 56 y, weight between 47 kg and 105 kg, and height between 159 cm and 193 cm) from the Faculty of Applied Sciences, the Faculty of Education, and the New Technologies—Research Centre, all three entities of the University of West Bohemia. The employees were members of the biomechanical team from the Faculty of Applied Sciences, the Faculty of Education, and the New Technologies—Research Centre at the University of West Bohemia, and the students were those participating in subjects related to biomechanics. Further, informed employees of the University of West Bohemia carried out the measurements on children (N = 50, of which 30 were boys and 20 girls, aged between 5.5 y and 7.5 y, weight between 18.3 kg and 35.6 kg, and height between 110 cm and 134 cm) from kindergartens cooperating with the Faculty of Education of the University of West Bohemia and on adolescents (N = 32, of which 12 were males and 20 females, aged between 10 y and 19 y, weight between 35 kg and 90 kg, and height between 144 cm and 188 cm) who were students or children of employees of the University of West Bohemia, during sports courses or at home. These children and adolescents participated in the regular sports courses under professional guidance by the physical education team from the Faculty of Education of the University of West Bohemia. Additional measurements were carried out on adult employees of the Tianjin Technician Institute of Mechanical & Electrical Technology (N = 68, of which 33 were males and 35 females, aged between 24 y and 60 y, weight between 49 kg and 110 kg, and height between 155 cm and 184 cm) in China at their workplaces, which were recruited from the teaching staff.
All recruitment was carried out on a voluntary basis. The Chinese participant were chosen in order to emphasize the anthropometric variations between populations from considerably different territories. All participants were measured wearing only underwear. The operators performing the measurements were instructed by the physical education experts from the Faculty of Education of the University of West Bohemia to ensure the accuracy and repeatability. Table 1 summarizes the measured subjects involved in the study.

2.2. Anthropometric Measurements

The clothing industry anthropometric dimensions [21,22] as shown in Figure 1 were measured using a tailor measuring tape on the particular body segments, except the body height, which was measured as a rectilinear measurement, when the subject was standing upright by a wall.
The anthropometric dimensions are described in Table 2. The dimensions are mentioned by their number in the parenthesis in the further text. The age and the total weight of each subject are also reported.
The measurements of the body dimensions of the particular body segments concerned the torso, the head-neck area, and the extremities.

2.3. Data Analysis

The subject-specific body dimensions were measured and analyzed for each of the four population groups including the Czech children, the Czech adolescents, the Czech adults, and the Chinese adults. For each dimension, the minimum value, the mean value, and the maximum value were calculated. The standard deviation for assessing the variation within the group completed the analysis.
Each subject-specific dimension was compared to its counterpart in the average anthropometry for the particular population group, which was obtained by scaling the reference model to the particular subject; see Section 2.3.1. The scaling of the reference model to the subject-specific human body model was based on gender, age, height, and weight using the previously developed and published algorithm [7,15].
The variation of the subject-specific dimensions from the average anthropometry in the particular population group was calculated as the average difference of all 23 body dimensions between the scaled anthropometry and the measured subject. The dimensions corresponding to the pair segments (the upper and the lower extremities) were addressed only once for the variation calculation.

2.3.1. Reference Model

The reference model was a previously developed and published virtual biomechanical human body model [15] already implemented in a computational environment for assessing the risk of injury during an impact. Figure 2 shows the reference model representing an average human body based on the CEASAR database [17] corresponding to the hardware dummies Hybrid III and THOR-50M used for vehicle frontal crash testing [23].
The model was hybrid as it coupled the basic multibody structure with deformable segments, performed in a short calculation time, and it was validated as being robust and biofidelic, meaning it converged for complex loading patterns (multidirectional) and had the correct mass distribution, stiffness, and biomechanical behavior [15]. As the dynamical simulation used finite element discretization, each segment of the model was discretized by nodes forming elements to cover the external surface. Additionally, there were internal free nodes inside each segment to define the center of gravity, principal inertial axis, and joint locations.

2.4. Personalization

The personalization method developed in the paper upgraded the existing scaling algorithm [7] by addressing the measured body dimensions to the firstly scaled reference body model shown in Figure 2, and so, it developed a subject-specific virtual human body model. The algorithm benefited from the implementation of the body dimensions that are essential to design comfortable PPE. The presented personalization approach needed only basic subject-specific body dimensions, which are simply measurable. The external body shape was personalized using polynomial functions to secure the continuous and smooth body surface, which is desired mainly for applications where the human body comes into contact with other subjects or external objects.

2.5. Personalization Algorithm

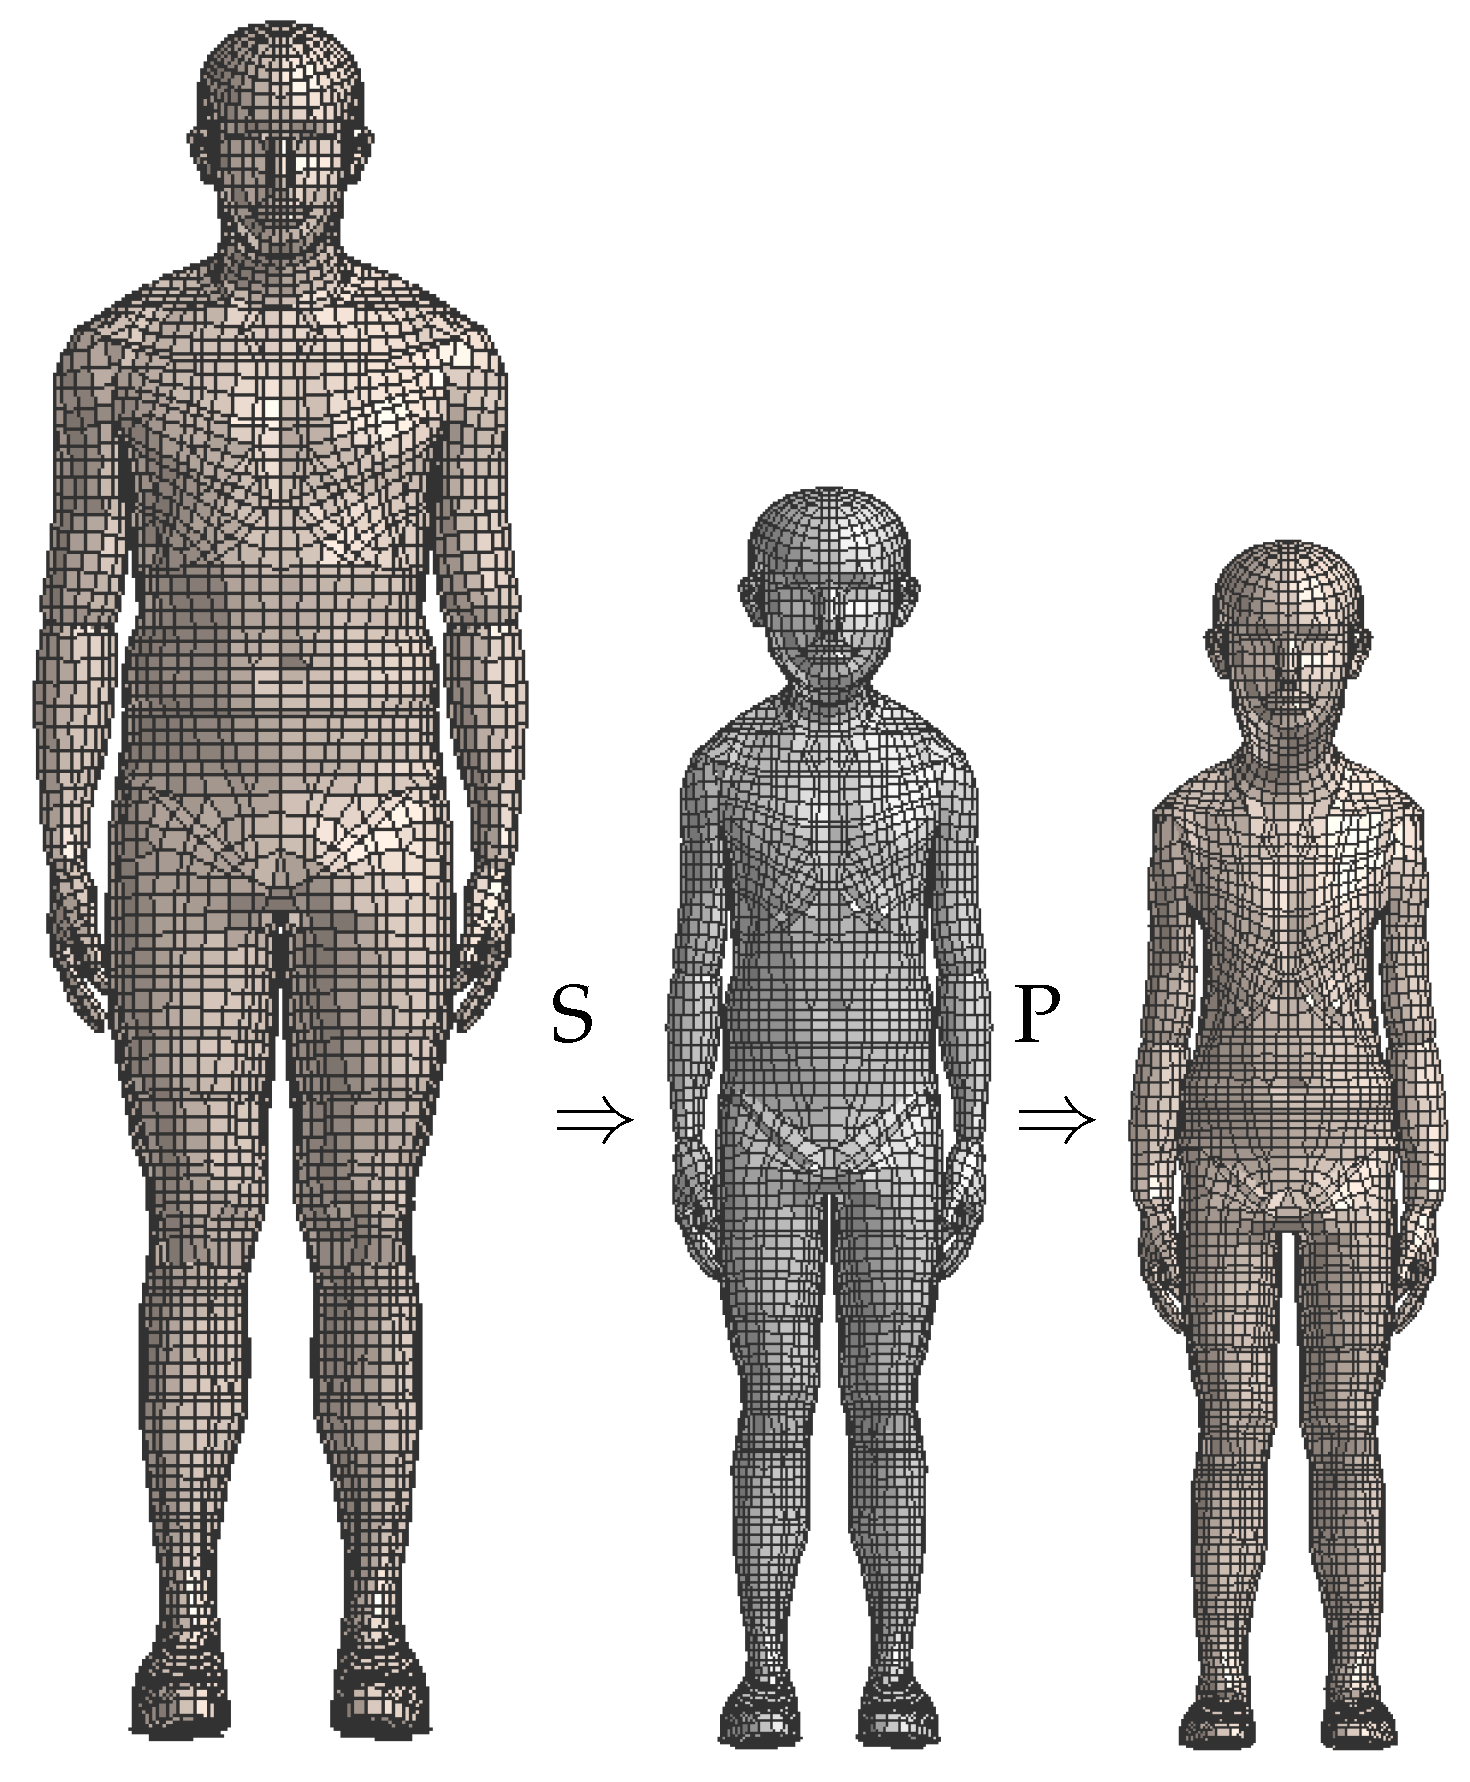
The personalization provided the local geometrical and biomechanical details of the human body. Firstly, the scaling [7] was performed for each subject to target the given gender, age, height, and weight. Having the scaled model, the personalization to provide the correct anthropometric dimensions was carried out. The two-step approach is described as:
T = S + P T X = S X + Δ S X X T = X S + Δ X S
meaning T (target) equals S (scaling) plus P (personalization) where X T describes the coordinates of any point of the subject-specific (target) model referring to the same point X in the reference model, which is firstly scaled to a semistate X S in the scaled model. X refers to a spatial point in the global coordinate system with the origin in the H-point (the point in the middle between the hip joints) with the axis x (defining the depth) pointing anteriorly to the front. The sagittal plane is the plane x z (the axis z defining the height points cranially to the head), and the axis y (defining the width) is directed laterally from the right to the left forming the right-hand side system.
Personalization was the next step after scaling. Scaling is a necessary step to have a model with global dimensions for the particular human body size before applying the mathematical operation to refine the surface locally. As the scaling algorithm was published previously, this paper does not address it, referring to the work by Hynčík et al. [
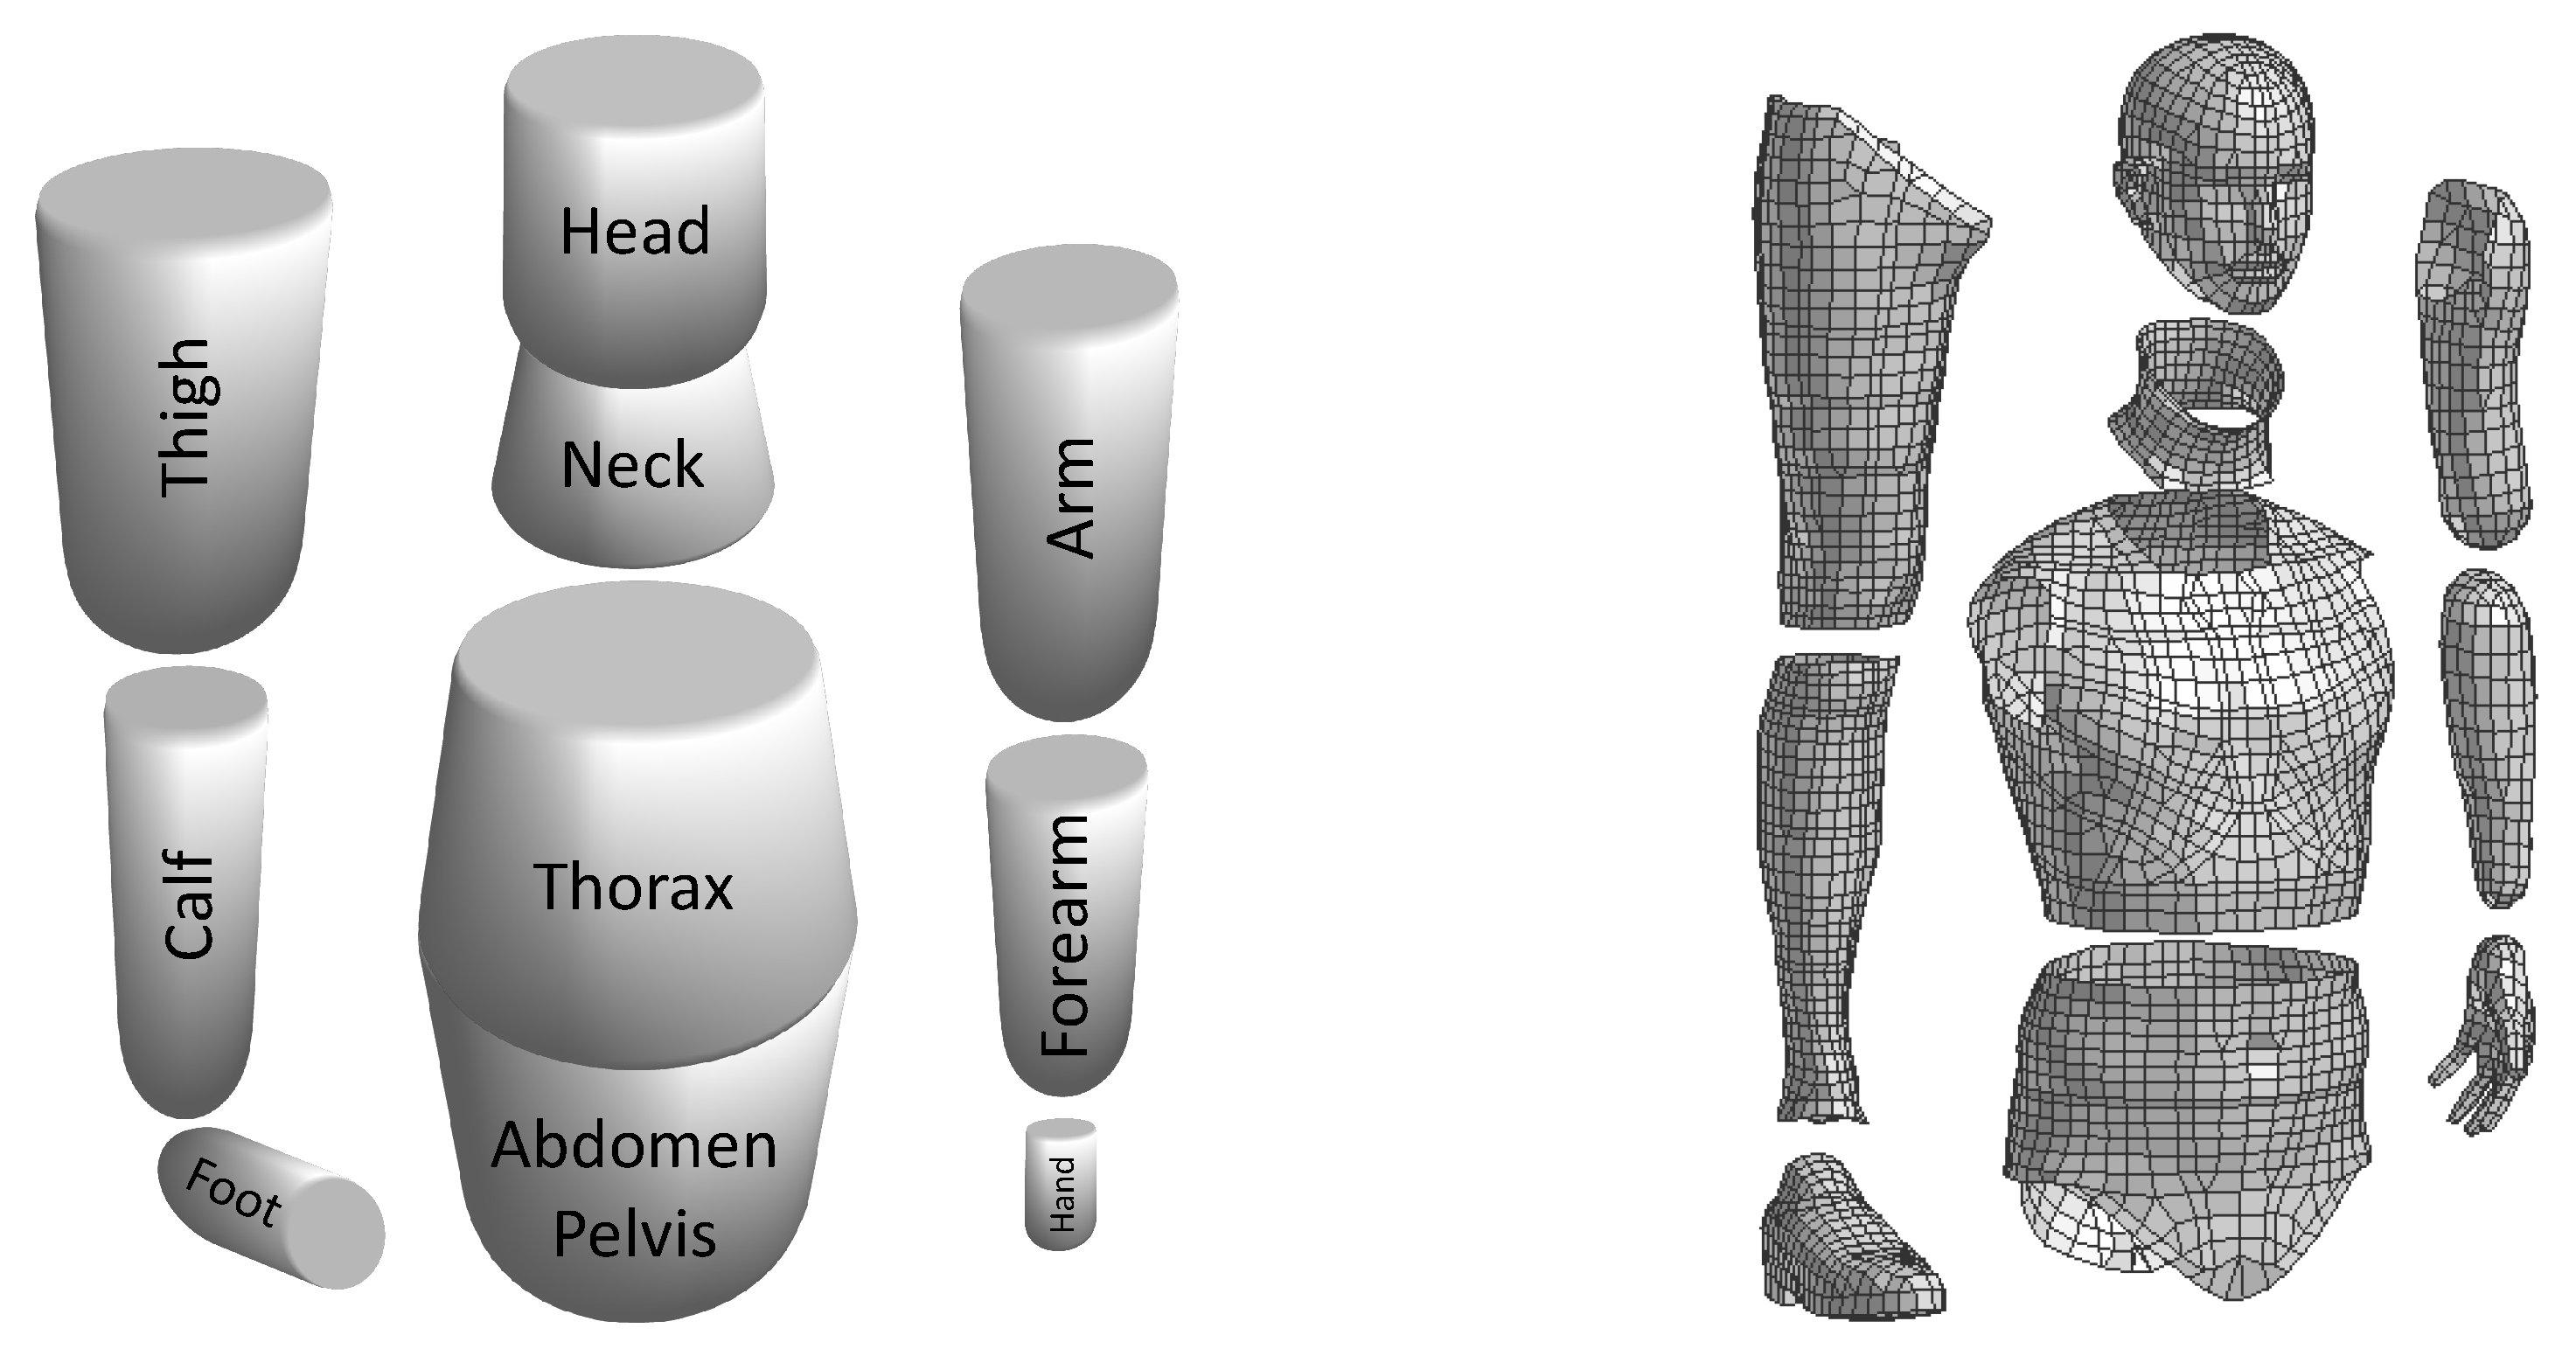
7]. For personalization purposes, the scaled model was divided into segments summarized in Table 3 and schematically shown in 
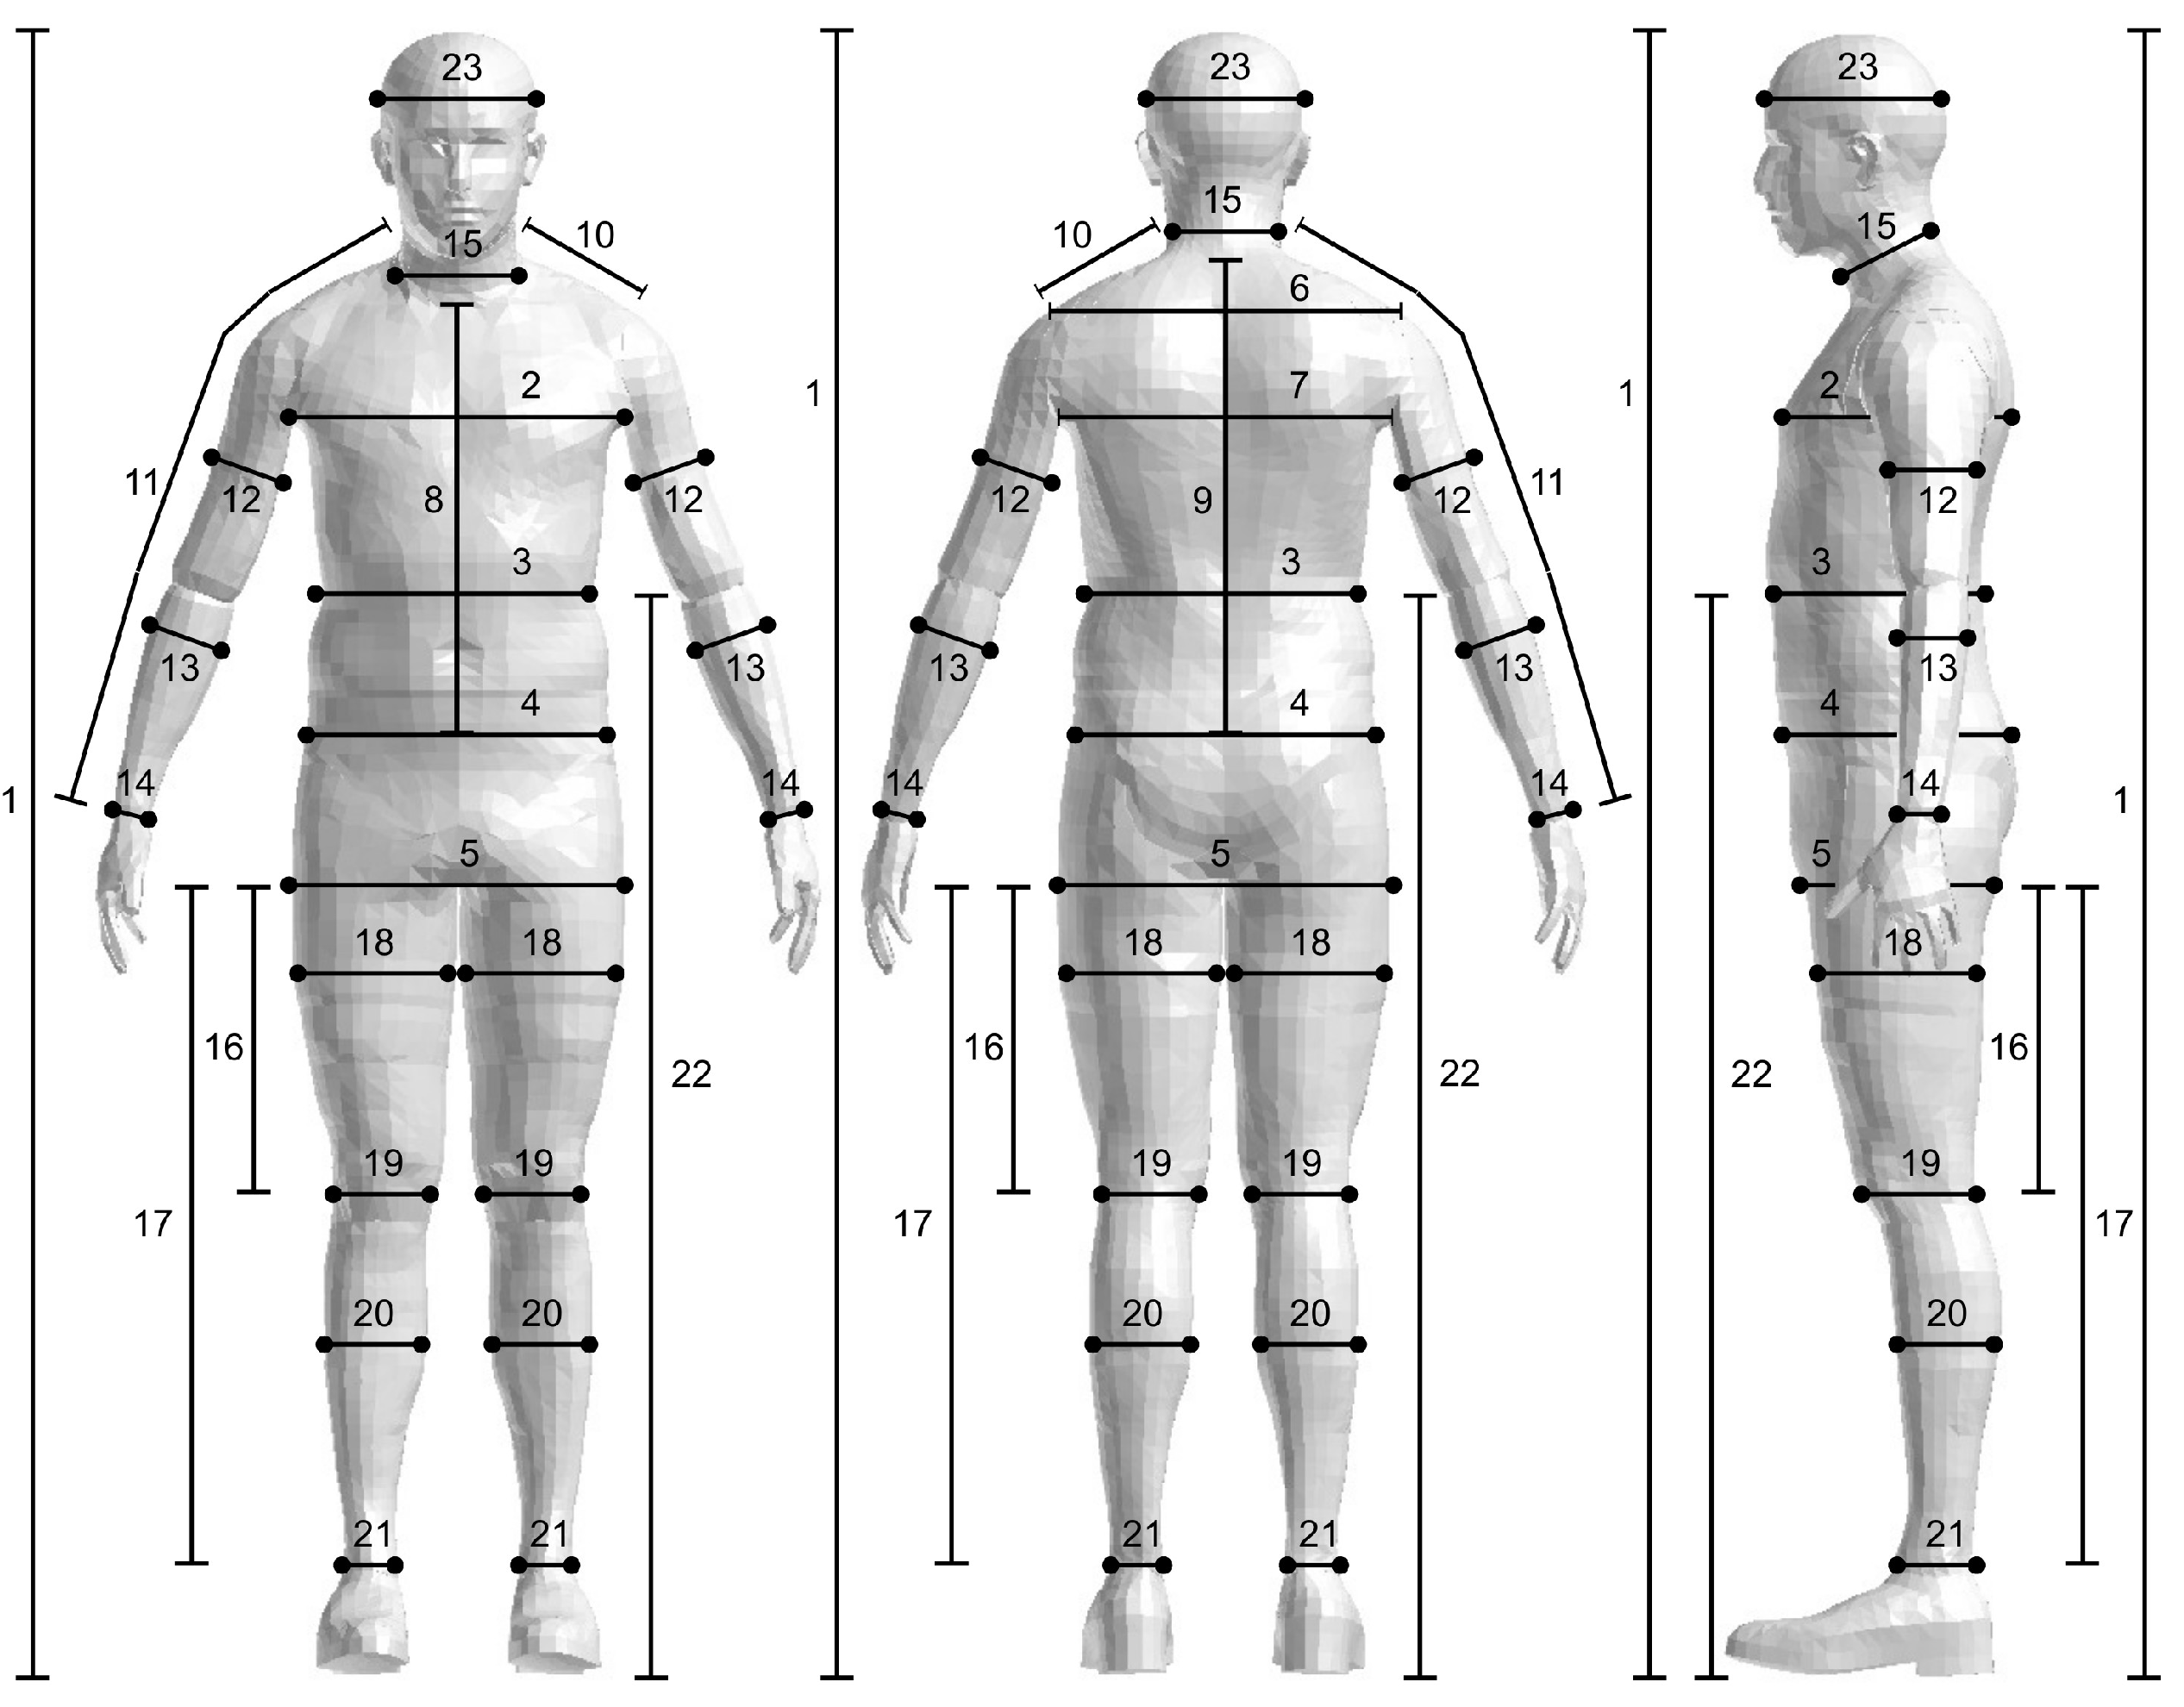
Figure 3. Each segment can be described by the anthropometric dimensions from Table 2 displayed in Figure 1. The personalization algorithm ran independently of each of the 16 subject-specific segments defined in Table 3 using the corresponding dimensions from Table 2. There was a reference node X S 0 s chosen on each segment as a local coordinate system origin, against which it was personalized, which also served to connect the neighboring segments following the open-tree segment system in the multibody structure. This is usually the joint connecting the neighboring segments [
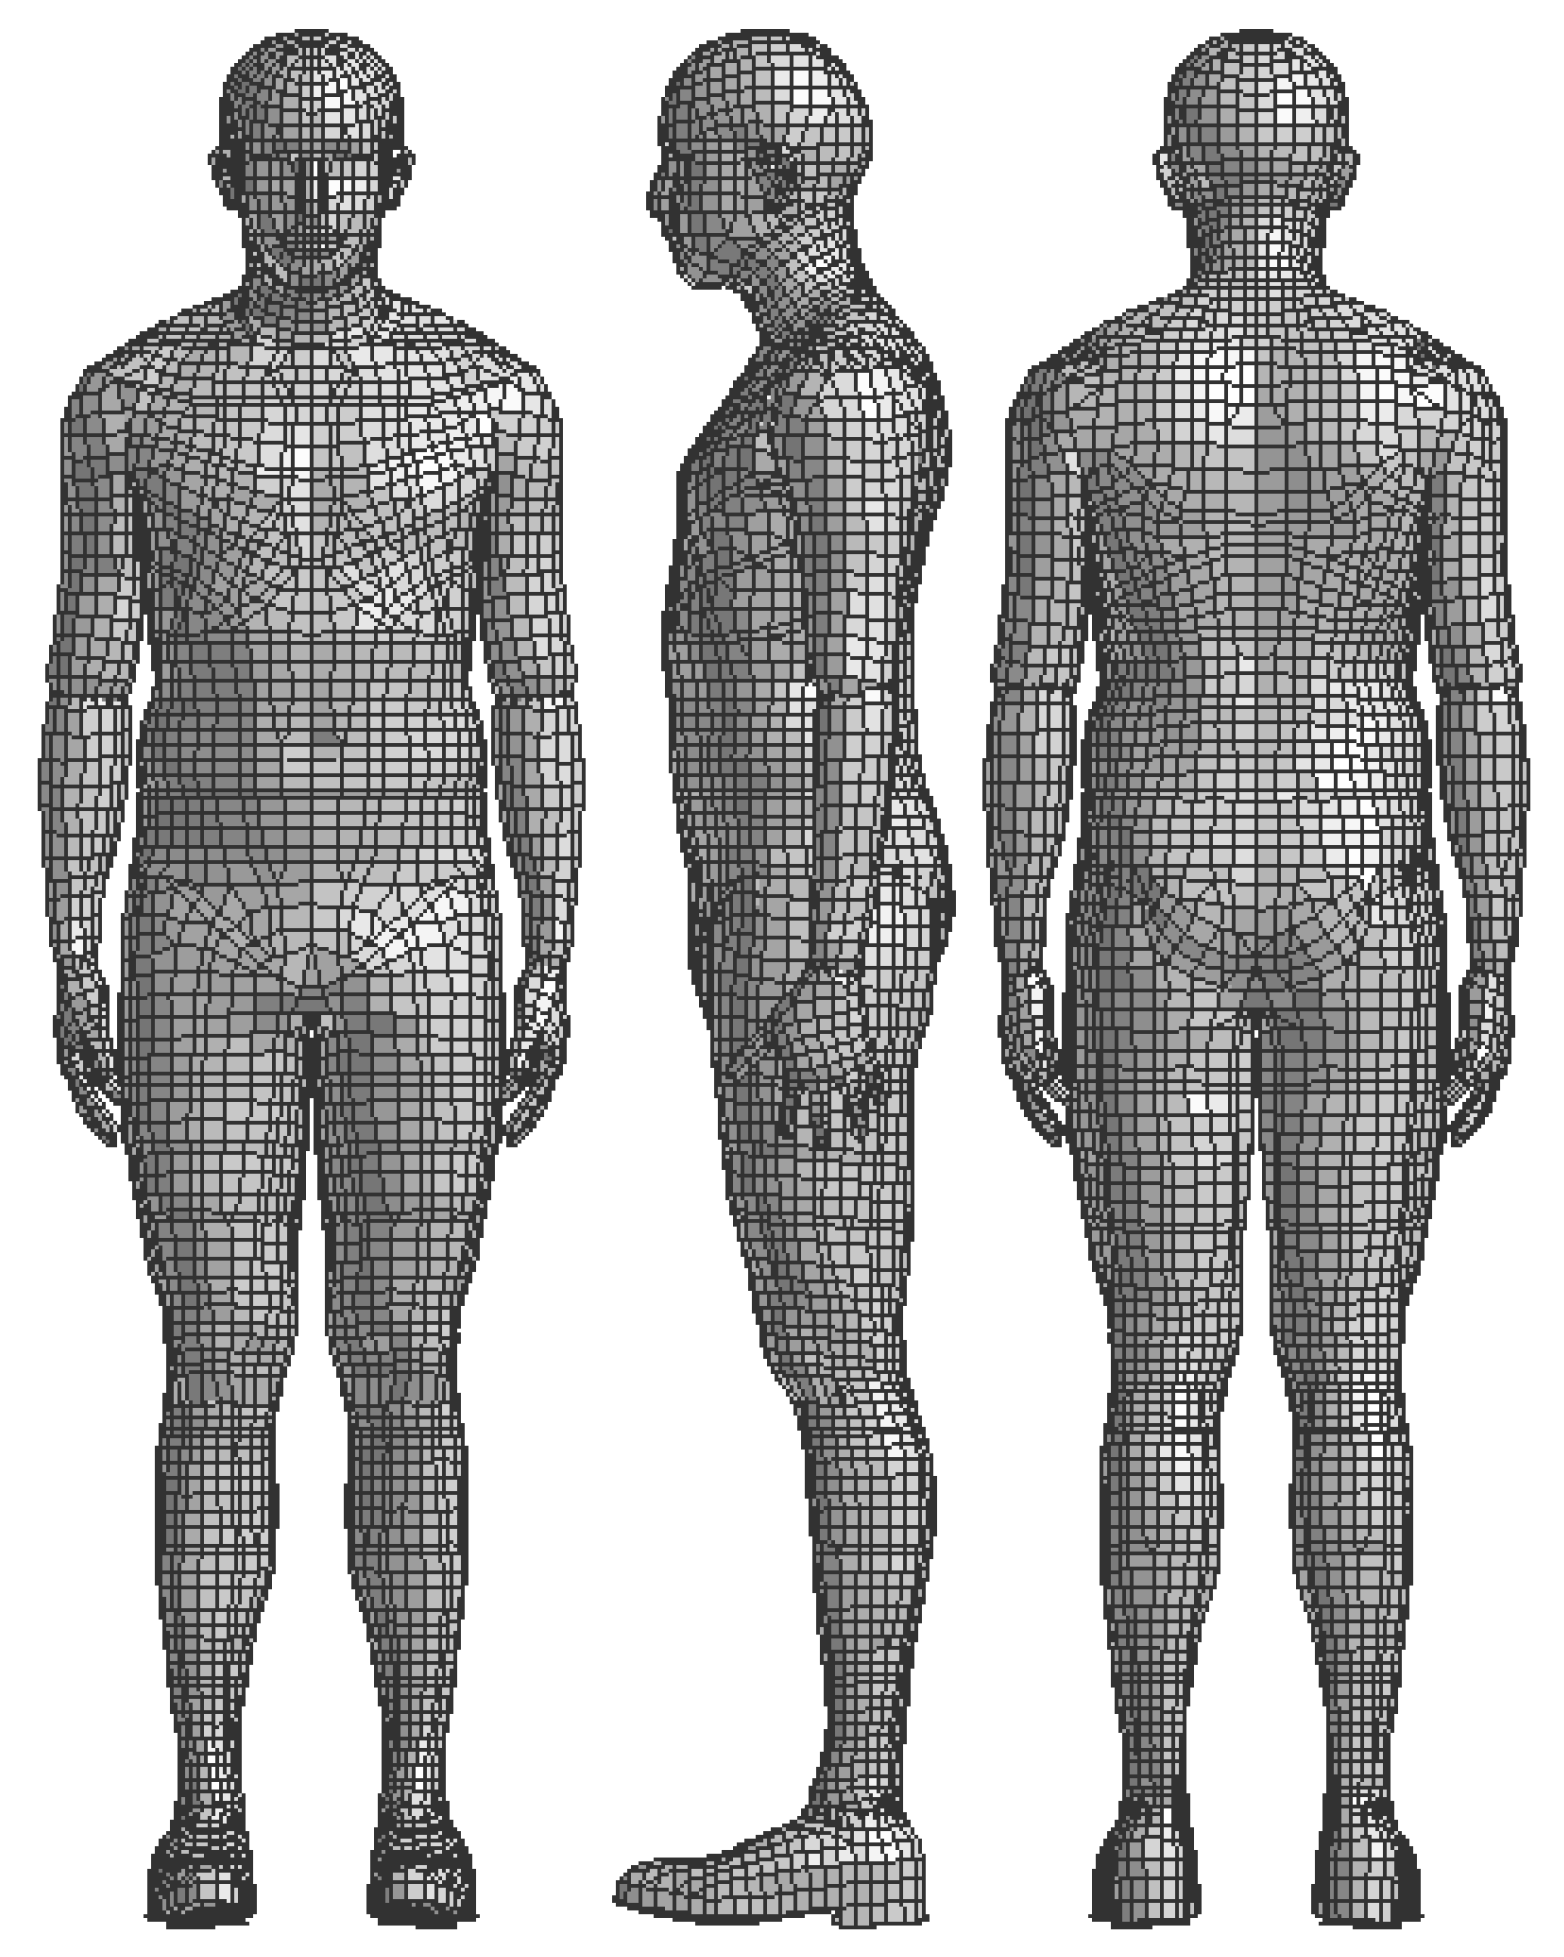
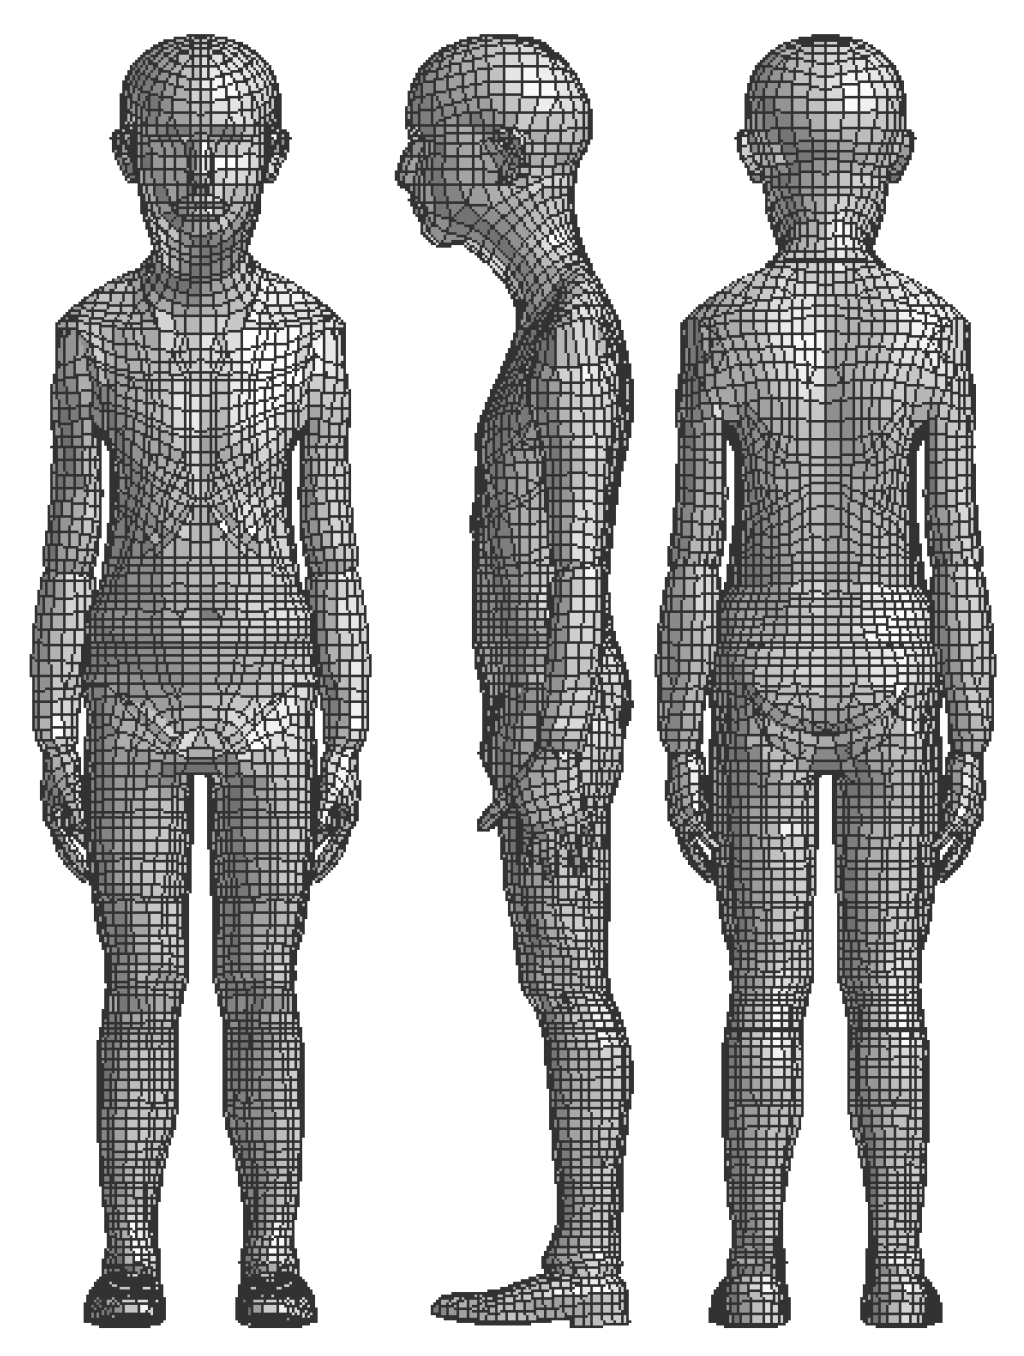
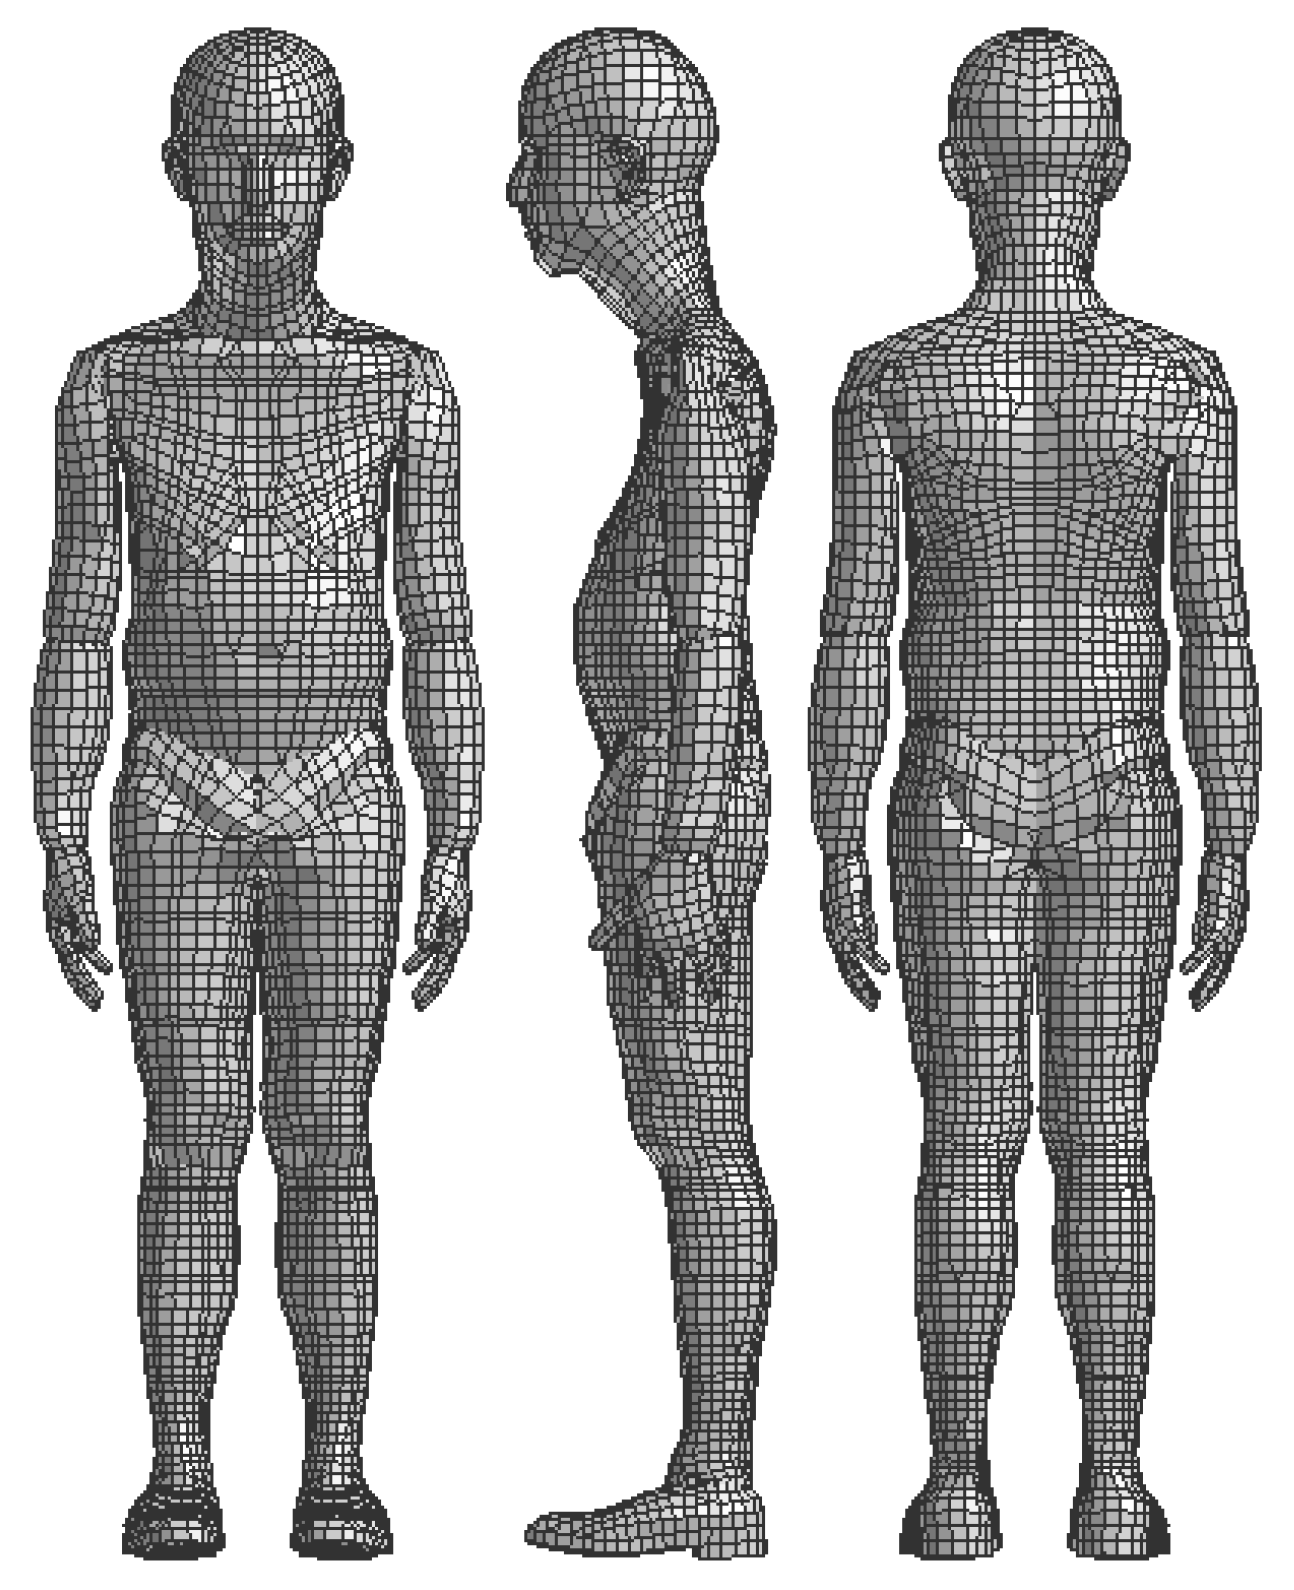
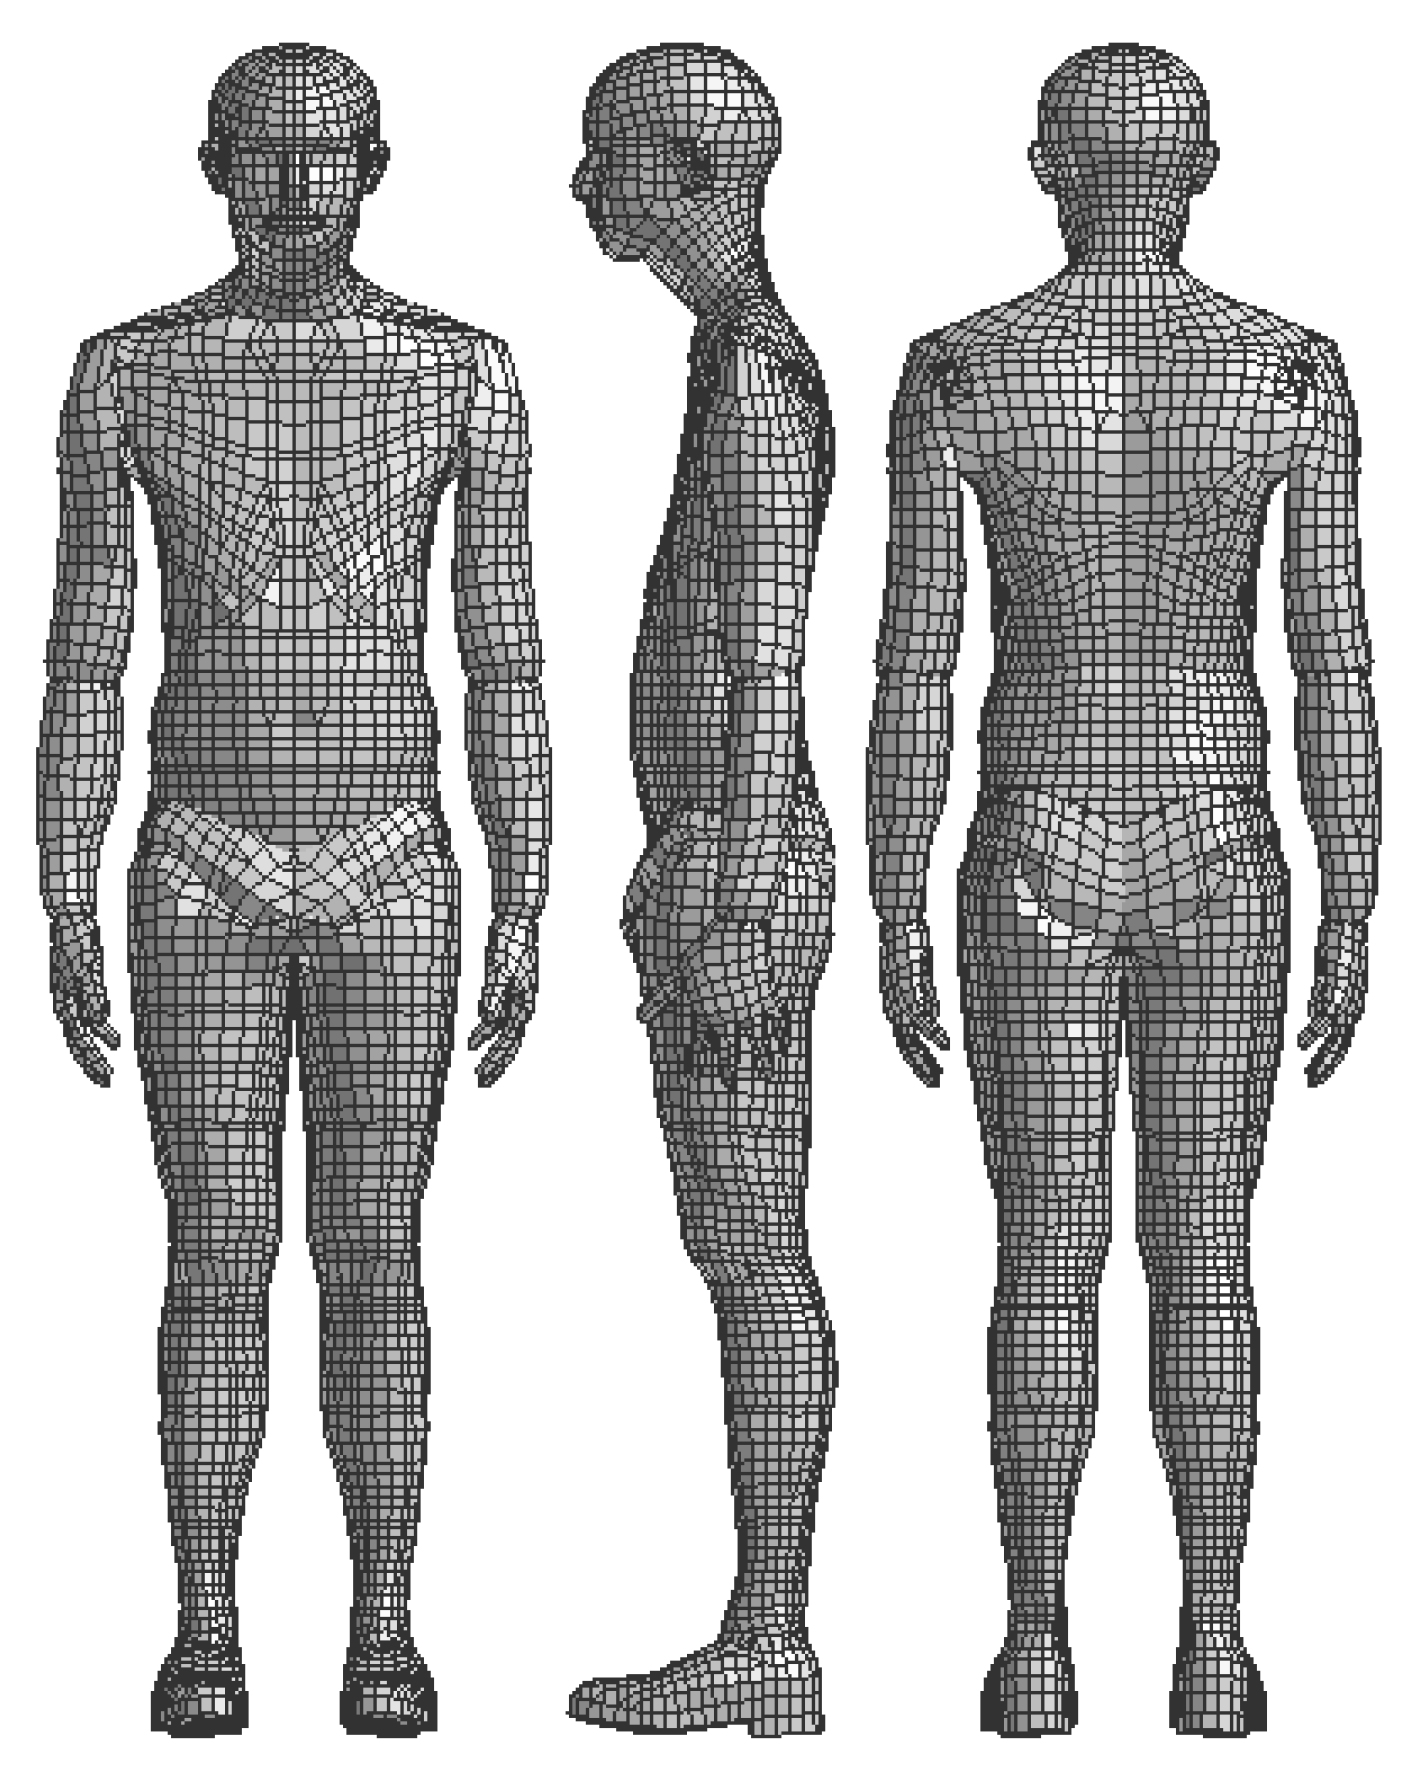
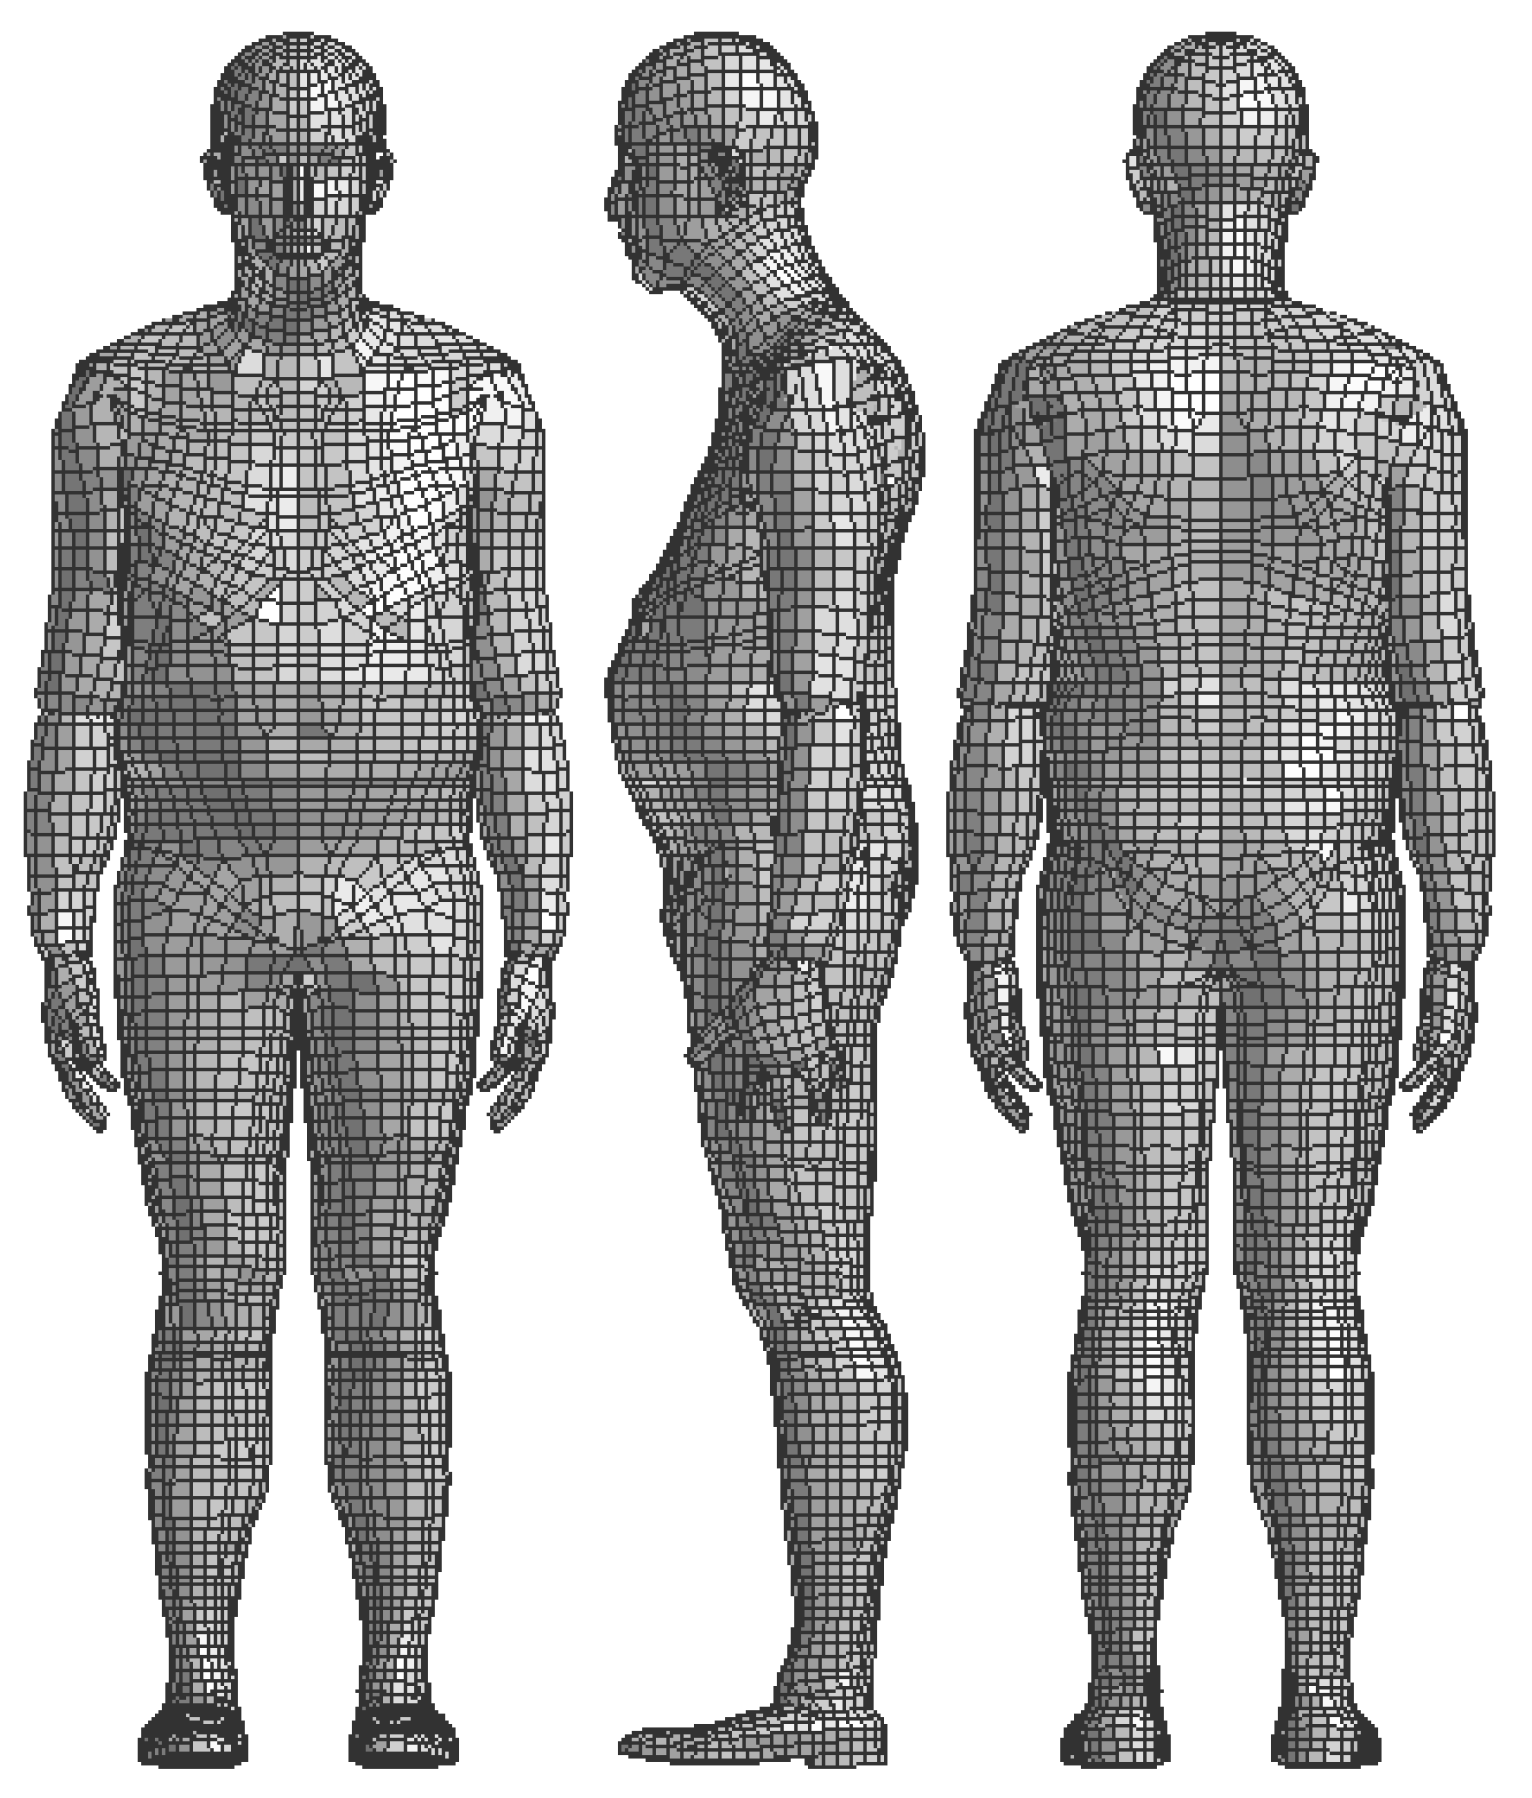
15]. The personalization benefited from the open-tree structure hierarchy, so the base body (to be personalized first) was the abdomen followed by the thorax, neck, and head upwards and the left and right thighs, the left and right calves, and the left and right feet downwards. The thorax was followed by the left and right arms, left and right forearms, and left and right palms. The reference model stood upright so that the local coordinate systems of all segments were aligned to the global coordinate system. The geometry and shape of a particular segment were given by the reference model; see Figure 2.
Any node X S i s , i { 1 , , m } (m being the numbers of nodes on the segment s) on the scaled model S is personalized as:
X T i s = R s X S i s X S 0 s + X S 0 s
where X T i s is the personalized node on target model T and R s = R s X is the transformation matrix for particular segment s depending on the spatial node position X . Although the personalization in Equation (2) holds for all segments, the transformation matrix R s contains the local scaling (personalization) coefficients to personalize a particular segment s { 0 , , 15 } numbered according to Table 3. For each segment s { 0 , , 15 } , R s is a diagonal matrix with the space-dependent personalization coefficients in the global coordinate system, so that:
R s = p x s ( X ) 0 0 0 p y s ( X ) 0 0 0 p z s ( X )
where p i s for i { x , y , z } are the personalization coefficients at location X in the global coordinate system for segment s. We used polynomials of degree n i s in the form:
p i s ( i ) = k = 0 n i s c i k s i k = P i s ( D j 1 , , D j n s + 1 )
to interpolate the personalization coefficient along each axis i { x , y , z } . A lower index j r for r { 1 , , n s + 1 } was chosen from set { 1 , , 23 } as numbered according to Table 2. Vector c i s = c i 0 s , , c i n s contains the polynomial coefficients for segment s { 0 , , 15 } in direction i { x , y , z } . Generally, indication P ( D j 1 , , D j n + 1 ) means the interpolation polynomial of degree n interpolating the personalization coefficient as the ratios of n + 1 anthropometric dimensions (see Figure 1) as:
D j = ( j ) T ( j ) S
where lower indexes T and S mean target (personalized) and scaled dimensions, respectively, and j { 1 , , 23 } is the dimension number as numbered according to Table 2 and shown in Figure 1. For simplification in the further text, we indicate the personalization coefficient D j = j . In particular, for example, 15 means the neck circumference and 17–16 means the calf height (as it must be calculated by subtracting the thigh length from the leg length). For example, polynomial P(23) indicates a constant polynomial calculated as the ratio:
( 23 ) T ( 23 ) S ,
polynomial P(17–16) indicates a constant polynomial calculated as the ratio:
( 17 ) T ( 16 ) T ( 17 ) S ( 16 ) S ,
polynomial P(13,14) indicates a linear polynomial interpolating the personalization coefficient between points:
( 13 ) T ( 13 ) S , ( 14 ) T ( 14 ) S ,
and polynomial P(6,7,3,4,5) indicates a polynomial of degree 4 interpolating the personalization coefficient between points:
( 6 ) T ( 6 ) S , ( 7 ) T ( 7 ) S , ( 3 ) T ( 3 ) S , ( 4 ) T ( 4 ) S , ( 5 ) T ( 5 ) S .
The polynomial interpolation might suffer from inaccuracy and unrealistic overshoots in the polynomial shape if we interpolate incomparable values, which is why the scaling was carried out in the first step to approach the target shape, which was refined by personalization.
For each segment, we firstly personalized the height based on the vertical dimensions (1), (8), (9), (10), (11), (16), (17), and (22), as shown in Figure 1 by means of numbering according to Table 2. The height of each segment was personalized constantly, meaning that:
p z s ( X ) = P ( D j )
is the constant personalization coefficient for the particular segment height.
The frontal (segment depth) and lateral (segment width) personalization depended on the circumference dimension of the particular segment. The circumference dimensions were (2), (3), (4), (5), (12), (13), (14), (15), (18), (19), (20), (21), and (23), as shown in Figure 1 by means of numbering according to Table 2. As many segments were described by circumference at the different horizontal location, the polynomials of the degree n > 0 interpolated the personalization coefficient along axes x and y depending on axis z, which led to the exact circumferences according to Figure 1 in the personalized model, so:
p i s = P i s ( D 1 , , D n s + 1 )
where i { x , y } and n s is the polynomial degree. We used the same polynomial degree n s for axes x and y for segment s, because the polynomials were formed by the same number of circumference dimensions for each segment.
Figure 1 also defines additional width dimensions, in particular (6) and (10), which were useful as additional measures for personalization. The personalization of each segment is described in detail in the following paragraphs.

2.5.1. Abdomen

The abdomen was the reference segment to be personalized first after the scaling. The reference point was the H-point. According to Figure 1, the height was personalized by a constant coefficient calculated as the ratio (between the target and scaled models) of the abdominal height (22), from which we subtracted the length from the crotch to the ankle (17) and the ankle height (51). (51) is a new dimension, which is not addressed in the clothing industry, so we took it from the scaled model. As the abdomen and the thorax form a continuous segment, the polynomials interpolating the personalization coefficient in depth and width were formed together along the abdomen and the thoracic height. They were of degree 4 as they addressed 5 circumference dimensions. The depth was personalized along axis z from the hip circumference at the widest point (5) over the waist circumference at the point of the trousers (4), the waist circumference at the narrowest point (3), and the thoracic circumference at the widest point (7) to the neck circumference (15), where the neck circumference seemed to be a good measure for the upper thoracic depth. The width was personalized along axis z from the hip circumference at the widest point (5) over the waist circumference at the point of the trousers (4), the waist circumference at the narrowest point (3), and the back width (7) to the shoulder width (6).

2.5.2. Thorax

The thorax follows the abdomen at the joint between vertebrae T12 and L1 [21], which was also the reference point. As the thorax height was defined by 2 dimensions in the sternum, and on the back, the height was personalized linearly between the front length from the neck to the waist (8) and the back length from the neck to the waist (9), according to Figure 1. The depth and width were personalized using the same polynomials as for the abdomen.

2.5.3. Neck

The neck follows the thorax at the joint between vertebrae C7 and T1 [21], which was also the reference point. According to Figure 1, the height was personalized by a constant coefficient calculated as the ratio of the total body height without shoes (1), from which we subtracted the back length from the neck to the waist (9) and the abdominal height (22). As height 1–9–22 is the total height of the neck and the head, the same personalization coefficient was used for the head height. The depth was personalized by a constant coefficient using the neck circumference (5). The width was personalized along axis z from the bottom neck using the neck circumference (15) over the neck circumference (15) to the head, where the personalization coefficient held the neck circumference ratio (15). Sixty-two is a new dimension, which is not addressed in the clothing industry, so we took it as the double shoulder length (10) subtracted from the back width (6).

2.5.4. Head

The head follows the neck at the clivus [21]. As height 1–9–22 is the total height of the neck and the head, the same personalization coefficient was used for the head height. The height personalization used the same personalization coefficient as the neck used. The head size is not typically measured for the means of the clothing industry, so the coefficients were missing. Therefore, the depth and width were personalized by a constant coefficient using the head circumference (23), which was measured.

2.5.5. Arm

The arm follows the thorax in the shoulder joint [21]. The height (actually the length of the arm) was personalized using a constant coefficient defined by subtracting the shoulder length (10) from the sleeve length from neck to wrist (11). The depth was personalized by a parabolic polynomial based on the arm circumference (12). The polynomial held the arm circumference ratio (12) in the elbow and the thoracic width ratio (6) at its height, which brought a realistic shape to the personalized arm. The width was personalized by a constant coefficient based on the arm circumference (12).

2.5.6. Forearm

The forearm follows the arm at the elbow joint [21]. The height personalization used the same personalization coefficient as the arm used. The depth and width were personalized using the same linear polynomials interpolating the ratios between the forearm circumference (13) and the wrist circumference (14).

2.5.7. Palm

As the palm is not typically measured in the clothing industry and its small size, mass, and inertial effects do not influence any dynamical action considerably, the palm was not personalized, and only the dimensions arising from of the scaling were taken into account.

2.5.8. Thigh

The thigh follows the abdomen in the hip joint [21]. According to Figure 1, the height was personalized by a constant coefficient addressing the ratio of the length from crotch to knee (16). The depth and width were personalized using the same cubic polynomials interpolating the ratios between the hip circumference at the widest point (5), the thigh circumference (18), and the knee circumference (19).

2.5.9. Calf

The calf follows the thigh in the knee joint [21]. The height was personalized by a constant coefficient defined by subtracting the length from the crotch to the knee (16) from the length from the crotch to the ankle (17). The depth and width were personalized linearly using the same polynomials interpolating the ratios between the calf circumference (20) and the ankle circumference (21).

2.5.10. Foot

The foot follows the calf in the hip ankle joint [21]. As the foot is not typically measured in the clothing industry and its small size, mass, and inertial effects do not considerably influence any dynamical action, the foot was not personalized, and only the dimensions arising from of the scaling were taken into account.
As the human body is expected to be symmetric, the personalization of the left and right arms, forearms, palms, thighs, calves, and feet was the same. Table 4 summarizes the personalization of all segments using the polynomial interpolation of the personalization coefficients along the coordinate axes.
As the reference human body model was developed for dynamical analysis, the last step was updating the masses and inertias of the particular segments concerning the shape change, as well as the ranges of the particular joints concerning the age using the same approach as described and published by Hynčík et al. [7].
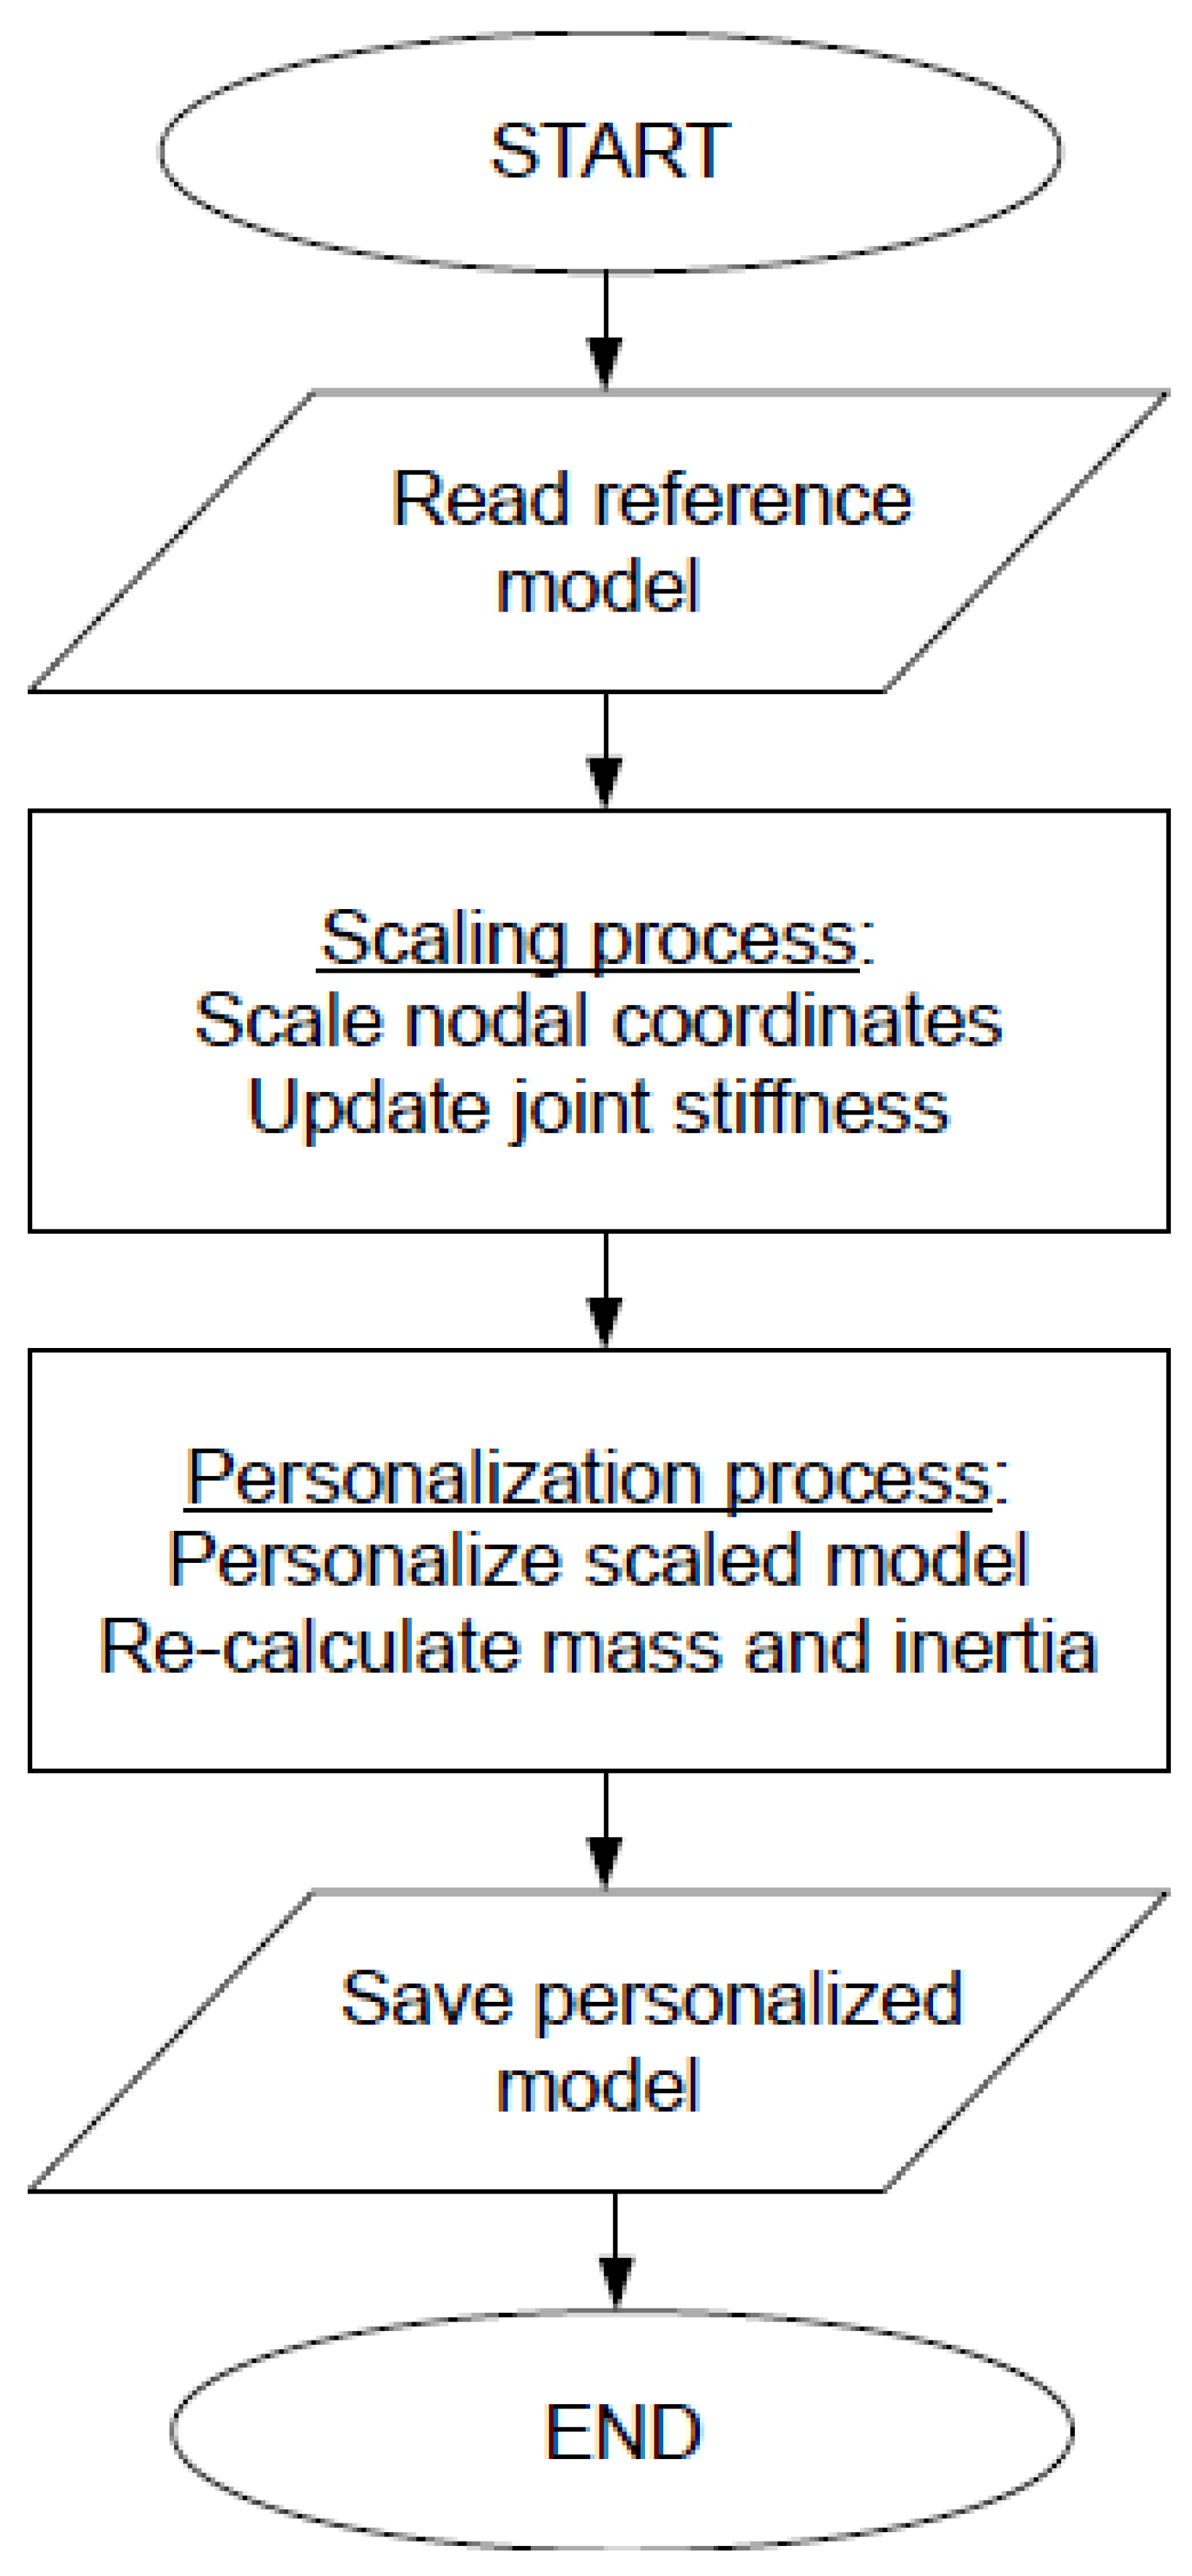
The personalization process was implemented in Python. The Python script first reads the structure of the reference model as the finite element model [15]. The structure concerns the multibody system, which separates the particular segments and their nodes representing the geometry into rigid bodies. The next step was the scaling of nodal coordinates and updating the stiffness of the joints, which was updated independently using the approach previously developed and published [7,25].
After the scaling of each segment, the personalization ran. Then, the segment masses and inertia were recalculated based on the particular segment volume and shape change using the approaches previously developed and published [7]. After that, the segments were connected back together, as the volume and shape changes affected the location of the joints. Finally, the new model was saved using the updated nodal coordinates, rigid bodies, and joints. The joint stiffness was updated in parallel. The elements defining the body surface were kept as they followed the change of their nodal coordinates. The process flowchart is as follows:
  • Read reference model;
  • Scale reference model;
    (a)
    Scale nodal coordinates [7];
    (b)
    Update joint stiffness [7,25];
  • Personalize scaled model;
    (a)
    Personalize nodal coordinates according to Equation (2);
    (b)
    Re-calculate mass and inertia [7];
  • Save personalized model.
The optimization loop is illustrated in Appendix A as a flowchart.

3. Results

The body dimensions for the four groups of Czech children, Czech adolescents, Czech adults, and Chinese adults were measured and analyzed. Besides the body dimensions, the age (a) in years and the total weight (m) in kilograms of each subject are reported. The analysis concerned each particular population group (all), as well as the subgroups of males and females. Table 5 shows the mean values and the standard deviations. Table 6 shows the minimum and the maximum values. The standard deviation assesses the variation within the group.
All the measured subjects were reconstructed by scaling using the previously developed and published scaling algorithm [7] and the reference model [15]. The following figures compare the subject-specific dimensions obtained by scaling for different groups of subjects. Particular dimensions from Figure 1 were calculated based on the scaled reference model. The scaling variance was calculated as the average difference of all 23 personalized dimensions between the scaled model and the measured subject. The pair segments were addressed only once.
The average variations and the standard deviations for the group of 70 Czech adults are displayed in Figure 4, the group of 32 Czech adolescents in Figure 5, the group of 50 Czech children in Figure 6, and the group of 68 Chinese adults in Figure 7.
Based on the developed personalization algorithm, representatives of the particular population groups are displayed further. The personalization process is shown on Figure 8 using the model personalized in Figure 9. Firstly, the reference model shown in the left was scaled to became the scaled model, which is shown in the middle. The scaling algorithm updated the general dimensions and anthropometry, which was refined by the personalization, leading to the correct model.
Figure 9, Figure 10, Figure 11 and Figure 12 show the performance of the personalization algorithm for various subjects addressing the different anthropometry among the groups of children, adolescents, and adults. The polynomial interpolation ensured that the personalized model corresponded exactly to the measured subjects by means of the body dimensions.
The displayed models were set to scale so that they could be compared with each other. By the nature of the personalization algorithm targeting the particular dimensions from Table 2, the developed subject-specific virtual human body models fit to their real subject by those dimensions.

4. Discussion

The presented study showed the variations of the subject-specific anthropometric dimensions from the average for different population groups in the Czech Republic and China as a background for the need for personalized human body models. The study showed variations in all dimensions except the total height, as it is one of the basic parameters for anthropometric modeling.
The variation of the Czech adults from the average (Figure 4) was the lowest in all groups and was around 7.54% (8.2% for males and 6.9% for females). This was probably caused by the fact that the reference model was an average European subject, which was close to the adult anthropometric group. The greatest variation was in the shoulder width (6), followed by the wrist circumference (14) and the frontal shoulder height (8). The great variation in the thoracic circumferences and the frontal thoracic height was probably due to the fact that the real shape distribution can be affected by the muscle mass or the breast size of the particular subject. The lowest variation was in the knee circumference (19), followed by the arm circumference (12) and the hip circumference (5), meaning that those dimensions can be well described by average anthropometry.
Decreasing the age, there was a slightly greater variation equal to 7.93% (8.15% for males and 7.9% for females) for the Czech adolescents (Figure 5). The adolescents, as well as the adults were well described by the average European subject. The greatest variation here was again in the shoulder width (6), followed by the wrist circumference (14) and the frontal thoracic height (8). Again, all these measures can be affected by muscle mass. The lowest variation was in the knee circumference (19), followed by the waist circumference (4) and the abdominal circumference (3).
The average variation for the Czech children (Figure 6) equaled 9.52% (9.57% for males and 9.49% for females). Here, the variation was greater as the children had different anthropometry and segment proportions compared to the adults. However, the variation was not so great with the biggest in the wrist circumference (14), followed by the shoulder width (6) and the ankle circumference (21). The lowest variation was in the head circumference (23), followed by the shoulder length (10) and the thigh length (16).
The greatest average variation was seen in the group of Chinese adults (Figure 7) and was equal to 10.86% (13.8% for males and 8.16% for females). This average variation was even greater than in the case of the Czech children, meaning the different anthropometric proportions in the population. The standard deviation showed considerable differences even inside the group. The Chinese anthropometry was different from the European one, which caused the variation in the dimensions’ average. The greatest variation was in the wrist circumference (14), followed by the frontal thoracic height (8) and the back thoracic height (9). The lowest variation was in the chest circumference (2), followed by the neck circumference (15) and the thigh circumference (16).
In general, for all groups, the variation was over the average for males, whilst females reported variation under the average. This was probably caused by the anthropometric reference model, which represented both male and female groups, where males were usually more robust compared to females. The lowest variation was usually reached at dimensions that were not affected by the local musculature too much.
The personalization algorithm enabled developing a subject-specific human body model just addressing a reference model. The advantage of this approach, e.g., comparing to the 3D body scanning, was a considerable decrease of the time consumption taking into account that only 23 body dimensions were measured without any special devices. Additionally, there is an easy connection to software for further analysis by numerical calculation using the virtual human body models.
Thanks to the polynomial interpolation of the body surface based on the particular body dimensions, the personalized model corresponded exactly to the measured subjects by means of the body dimensions. The previously developed scaling algorithm [7] ensured the correct mass and inertia distributions. Therefore, the validation of the personalized models was based directly on the mathematical expressions in Equations (2)–(4) and the mass redistribution [7] for their development.

5. Conclusions

The current paper provided a measurement of 23 major body dimensions on 220 human subjects including children, adolescents, and adults in the Czech Republic and China. The number of Czech subjects was 152, ranging in age from 6 y to 56 y. Additional measurements on 68 Chinese adults ranging in age from 24 y to 60 y were carried out. The males and females were equally represented.
Using a single reference model, the subject-specific human body model was developed. On each subject, the scaling procedure was carried out to develop the generic scaled model related to the particular gender, age, height, and weight. The anthropometric dimensions adopted from the clothing industry were compared to the measured ones. Measured subjects reported variations in body dimensions when compared to an average subject of the same age. The cumulative variation of body dimensions increased the further the population group was from the average. The Czech subjects showed lower variance than the Chinese subjects as the reference model was from the European database.
The study proved the variation of the particular anthropometric dimensions by comparison to the average anthropometric data, which might cause inaccuracies in virtual prototyping when developing PPE. Taking the results of the study into account, the development of personal protective systems should adopt the subject-specific models due to the variations from the average. Therefore, a personalization algorithm to develop a subject-specific biomechanical human body model was developed, and the chosen subjects from the anthropometric study were shown by means of their personalized models.
Scaling is a convenient tool for creating generic human body models representing a population group for virtual prototyping, such as developing safety systems in mobility or PPE. Modern technologies enable personalized products to be designed, so if we want to address a subject-specific approach for designing PPE, personalization refines the model towards the subject-specific anthropometry. As virtual prototyping saves development time, subject-specific human body models have a huge potential in the industry, e.g., by designing personalized safety systems in future mobility, and in health care, by addressing a personalized approach to a medical treatment.
The personalized models, which provided the correct anthropometric dimensions, were based on the reference model surface mesh, where the so-called problem of downscaling occurred. A weak point of the personalization algorithm occurred when the subjects had considerably different dimensions of two neighboring parts. Here, the shapes might be slightly unrealistic, which was caused by connecting shapes developed by an uncontinuous polynomial; see, e.g., the neck problem in Figure 10. These limitations of the study did not affect any dynamical calculation; however, the future development plans a remeshing of particular body parts and the measurement of other population groups. Another limitation of the study is that it focused only on limited groups in two territories. Even with such a limitation, the study proved the variation of the particular anthropometric dimensions, which might cause inaccuracy in virtual prototyping when designing, e.g., personal protective equipment, orthopedic tools, or vehicle safety systems.

Author Contributions

Conceptualization, L.H.; methodology, L.H., G.K. and P.Š.; software, L.H. and H.Č.; validation, L.H.; formal analysis, L.H., H.Č., T.B., G.K., P.Š. and H.M.; investigation, L.H., T.B., G.K., P.Š., V.H. and H.M.; resources, T.B., G.K., P.Š., V.H. and H.M.; data curation, H.Č., T.B., G.K., P.Š., V.H. and H.M.; writing—original draft preparation, L.H., H.Č., T.B., G.K. and P.Š.; writing—review and editing, L.H., H.Č., T.B., G.K., P.Š., V.H. and H.M.; visualization, L.H.; supervision, L.H., G.K. and P.Š.; project administration, L.H.; funding acquisition, L.H. All authors have read and agreed to the published version of the manuscript.

Funding

This research was funded by the European Regional Development Fund-Project (Grant Number CZ.02.1.01/0.0/0.0/17_048/0007280) and by the University of West Bohemia Student Grant System (Grant Number SGS-2019-002).

Institutional Review Board Statement

The study was conducted according to the guidelines of the Declaration of Helsinki and approved by the Ethics Committee of the New Technologies for Information Society of the Faculty of Applied Sciences of the University of West Bohemia (No. ZCU 011486/2017) from 23 January 2017, updated by the Annex dated 29 April 2019, related to extending the approval for a consequent project.

Informed Consent Statement

Informed consent was obtained from each participant. In the case of the children, their legal representatives signed the informed consent as approved by the Ethics Committee.

Data Availability Statement

The data presented in this study are openly available in zenodo at https://doi.org/10.5281/zenodo.5607141.

Acknowledgments

The authors would like to thank all the subjects for their participation and their kind involvement in this study and the company PSí Hubík for providing samples and identifying the dimensions of the personal protective garments.

Conflicts of Interest

The authors declare no conflict of interest.

Abbreviations

The following abbreviations are used in this manuscript:
PPE   personal protective equipment
VPS   Visual Performance Solution

Appendix A

Figure A1. Iteration Process Flowchart.
Applsci 11 10138 g0a1

References

  1. Klug, C.; Ellway, L. Pedestrian Human Model Certification; Technical Report; European New Car Assessment Programme: Leuven, Belgium, 2020. [Google Scholar]
  2. Haug, E.; Choi, H.-Y.; Robin, S.; Beaugonin, M. Human Models for Crash and Impact Simulation. Handb. Numer. Anal. 2004, 12, 1–11. [Google Scholar] [CrossRef]
  3. Gao, Y.; Xiajun, J. The Customized Human Body Modeling and Its Application in Damage Model Simulation. In Proceedings of the Asian Simulation Conference SCS Autumn Simulation Multi-Conference, Beijing, China, 8–11 October 2016; pp. 1–11. [Google Scholar] [CrossRef]
  4. Koo, B.Y.; Park, E.J.; Choi, D.K.; Kim, J.J.; Choi, M.H. Example-based statistical framework for parametric modeling of human body shapes. Comput. Ind. 2015, 72, 23–38. [Google Scholar] [CrossRef]
  5. Ayache, P.G. Computational Models for the Human Body; Elsevier B.V.: Amsterdam, The Netherlands, 2004; Volume XII. [Google Scholar]
  6. Happee, R.; van Haaster, R.; Michaelsen, L.H.R. Optimisation of vehicle passive safety for occupants with varying anthropometry. In Proceedings of the ESV Conference 1998, Windsor, ON, Canada, 1–4 June 1998; ESV Technical Paper 98-S9-O-03. pp. 1–6. [Google Scholar]
  7. Hynčík, L.; Čechová, H.; Kovář, L.; Bláha, P. On Scaling Virtual Human Models. In Proceedings of the Asia Pacific Automotive Engineering Conference, Bangkok, Thailand, 1–3 April 2013; SAE Technical Paper 2013-01-0074. pp. 1–8. [Google Scholar] [CrossRef]
  8. Hynčík, L.; Špička, J.; Maňás, J.; Vychytil, J. Stature Based Approach towards Vehicle Safety. In Proceedings of the Symposium on International Automotive Technology 2015, Pune, India, 21–24 January 2015; SAE Technical Paper 2015-26-0209. pp. 1–7. [Google Scholar] [CrossRef]
  9. Hwang, E.; Hallman, J.; Klein, K.; Rupp, J.; Reed, M.; Hu, J. Rapid Development of Diverse Human Body Models for Crash Simulations through Mesh Morphing. In Proceedings of the SAE 2016 World Congress and Exhibition, Detroit, MI, USA, 12–14 April 2016. SAE Technical Paper 2016-01-1491. [Google Scholar] [CrossRef]
  10. Ma, L.; Zhang, K.; Lu, D. Research and application of personalized human body simplification and fusion method. EURASIP J. Image Video Process. 2018, 55, 1–10. [Google Scholar] [CrossRef]
  11. Liu, S.; Beillas, P.; Ding, L.; Wang, X. Morphing an Existing Open Source Human Body Model into a Personalized Model for Seating Discomfort Investigation. In Proceedings of the WCX SAE World Congress Experience, Detroit, MI, USA, 21–23 April 2020; SAE Technical Paper 2020-01-0874. pp. 1–8. [Google Scholar] [CrossRef]
  12. Alexa, M. Recent Advances in Mesh Morphing. Comput. Graph. Formum 2002, 21, 173–197. [Google Scholar] [CrossRef]
  13. Reed, M.P.; Raschke, U.; Tirumali, R.; Parkinson, M.B. Parametric Human Body Models in Ergonomics Software. In Proceedings of the 3rd International Digital Human Modeling Symposium, Odaiba, Tokyo, 20–22 May 2014; pp. 1–8. [Google Scholar]
  14. Sigal, I.A.; Hardistya, M.R.; Whynea, C.M. Mesh-morphing algorithms for specimen-specific finite element modeling. J. Biomech. 2008, 41, 1381–1389. [Google Scholar] [CrossRef] [PubMed]
  15. Vychytil, J.; Maňas, J.; Čechová, H.; Špirk, S.; Hynčík, L.; Kovář, L. Scalable multi-purpose virtual human model for future safety assessment. In Proceedings of the SAE 2014 World Congress & Exhibition, Detroit, MI, USA, 8–10 April 2014; SAE Technical Paper 2014-01-0534. pp. 1–22. [Google Scholar] [CrossRef]
  16. PSí Hubík. The Ready-Made Sizes. 2020. Available online: https://www.psihubik.cz/en/size-tables (accessed on 6 November 2020).
  17. Robinette, K.; Blackwell, S.; Daanen, H.A.M.; Boehmer, M.; Fleming, S.; Brill, T.; Hoeferlin, D.; Burnsides, D. Civilian American and European Surface Anthropometry Resource (CAESAR), Final Report. Volume 1. Summary; Technical Report; Air Force Research Laboratory: Wright-Patterson Air Force Base, OH, USA, 2002. [Google Scholar]
  18. Bláha, P. Anthropometry of Czech and Slovak Population from 6 till 55 Years. Technical Report. 1986. Available online: https://ipac.kvkli.cz/arl-li/cs/detail-li_us_cat-c057197-Antropometrie-ceskoslovenske-populace-od-606-do-55-let (accessed on 28 October 2021).
  19. Janák, T.; Lafon, Y.; Petit, P.; Beillas, P. A Method to Use Kriging with Large Sets of Control Points to Morph Finite Element Models of the Human Body. J. Biomech. Eng. 2020, 143, 1–17. [Google Scholar] [CrossRef]
  20. ESI Group International. VPS User’s Manual; ESI Group International: Rungis, France, 2020. [Google Scholar]
  21. Williams, P.L. Gray’s Anatomy; Churchill Livingstone: London, UK, 1995. [Google Scholar]
  22. Simmons, K.P.; Istook, C.L. Body measurement techniques: Comparing 3D body-scanning and anthropometric methods for apparel applications. J. Fash. Mark. Manag. 2003, 7, 306–332. [Google Scholar] [CrossRef]
  23. Humanetics. Anthropomorphic Test Devices (ATD). 2021. Available online: https://humanetics.humaneticsgroup.com/products/anthropomorphic-test-devices (accessed on 11 June 2021).
  24. Bońkowski, T.; Hynčík, L.; Lv, W. PTW Passive Safety: Numerical Study of Standard Impact Scenarios with Rider Injury Risk Assessment. In Proceedings of the WCX SAE World Congress Experience, Detroit, MI, USA, 21–23 April 2020; SAE Technical Paper 2020-01-0930. pp. 1–25. [Google Scholar] [CrossRef]
  25. Araújo, C.G. Flexibility assessment: Normative values for flexitest from 5 to 91 years of age. Arq. Bras. Cardiol. 2008, 90, 257–263. [Google Scholar] [CrossRef] [PubMed] [Green Version]
Figure 1. Dimensions used to design the clothing patterns. Identified body dimensions were adopted from the protective garment clothing industry [16].
Applsci 11 10138 g001
Figure 2. Reference model. Front (left), side (middle), and back (right) views. The reference model represents the average European anthropometry close to the Hybrid III 50% or Eurosid II dummies in terms of body dimensions. The reference model is a male with a weight equal to 77 kg and a height equal to 176 cm [24].
Applsci 11 10138 g002
Figure 3. Human body segmentation. Methodology (left) and corresponding segmentation of the reference model (right).
Applsci 11 10138 g003
Figure 4. Czech adults. Average variations and the standard deviations.
Applsci 11 10138 g004
Figure 5. Czech adolescents. Average variations and the standard deviations.
Applsci 11 10138 g005
Figure 6. Czech children. Average variations and the standard deviations.
Applsci 11 10138 g006
Figure 7. Chinese adults. Average variations and the standard deviations.
Applsci 11 10138 g007
Figure 8. Personalization process. Reference model (left), scaled model (middle), and personalized model (right).
Applsci 11 10138 g008
Figure 9. Subject-specific Czech child model. Female, 6 y, 118 cm, 19 kg. Front (left), side (middle), and back (right) views.
Applsci 11 10138 g009
Figure 10. Subject-specific Czech adolescent model. Male, 10 y, 144 cm, 35 kg. Front (left), side (middle), and back (right) views.
Applsci 11 10138 g010
Figure 11. Subject-specific Czech adolescent model. Female, 14 y, 160 cm, 46 kg. Front (left), side (middle), and back (right) views.
Applsci 11 10138 g011
Figure 12. Subject-specific Czech adult model. Male, 45 y, 176 cm, 85 kg. Front (left), side (middle), and back (right) views.
Applsci 11 10138 g012
Table 1. Subjects involved in the study. The number of participants in a particular group.
GenderCzech ChildrenCzech AdolescentsCzech AdultsChinese Adults
Male38301233
Female32202035
All70503268
Table 2. Clothing anthropometric dimensions. Lengths between particular external body points and the circumference of particular segments.
No.Short NameDimensionDescription
1Body heightTotal body heightThe distance between the top of the head and the bottom of the heel.
2Chest c.Chest circumference (widest)The circumference on the horizontal plane at the widest part of the thorax.
3Abdomen cWaist circumference (narrowest)The circumference on the horizontal plane at the narrowest part of the waist.
4Waist c.Waist circumference (trousers)The measurement on the horizontal section of the trousers.
5Hip c.Hip circumference (widest)The circumference on the horizontal plane at the widest part of the hips.
6Shoulder w.Shoulder widthThe distance between the shoulders equal to the biacromial breath.
7Back w.Back widthThe thoracic width at the location of the chest circumference (2).
8F. thorax h.Front length from neck to waistThe distance from the neck bottom to the horizontal plane of the abdominal circumference (3).
9B. thorax h.Back length from neck to waistThe distance from the C7 vertebra on the horizontal plane of the abdominal circumference (3).
10Shoulder l.Length from neck to shoulderThe distance from the side neck bottom to the shoulder acromion.
11Arm l.Sleeve length from neck to wristThe measurement on the horizontal plane a finger width above the eyebrow.
12Arm c.Arm circumferenceThe sleeve length from the neck to the location of the wrist circumference (14).
13Forearm c.Forearm circumferenceThe circumference around the widest biceps muscle.
14Wrist c.Wrist circumferenceThe circumference around the widest forearm muscle.
15Neck c.Neck circumferenceThe measurement at the wrist section.
16Thigh l.Length from crotch to kneeThe measurement around the middle section of the neck.
17Leg l.Length from crotch to ankleThe distance between the crotch and the knee circumference (19).
18Thigh c.Thigh circumferenceThe distance between the crotch and the ankle circumference (21).
19Knee c.Knee circumferenceThe circumference around the widest section of the quadriceps muscle.
20Calf c.Calf circumference (widest)The circumference in the patella section.
21Ankle c.Ankle circumferenceThe circumference around the widest horizontal section of the calf muscle.
22Abdomen h.Length from waist to groundThe circumference around the ankle section.
23Head c.Head circumferenceThe distance from the waist circumference to the ground.
Table 3. Segment numbers. Numbering of segments for the personalization algorithm equations.
SegmentLeftRight
Head3
Neck2
Thorax1
Abdomen0
Arm47
Forearm58
Palm69
Thigh1013
Calf1114
Foot1215
Table 4. Personalization coefficients of particular segments. The numbers in brackets denote the particular dimension.
SegmentAbdomenThoraxNeckHeadArmForearmPalmThighCalfFoot
HeightP(22–17–51)P(8,9)P(1–9–22)P(1–9–22)P(11–10)P(11–10)1P(16)P(17–16)1
DepthP(5,4,3,7,15)P(5,4,3,7,15)P(5)P(23)P(72,12,12)P(13,14)1P(5,18,19)P(20,21)1
WidthP(5,4,3,52,6)P(5,4,3,52,6)P(62,15,15)P(23)P(12)P(13,14)1P(5,18,19)P(20,21)1
Table 5. Average dimensions. Mean value (⊘) and the standard deviation ( σ ) for each dimension (d). The age (a) is reported in years, the mass (m) in kilograms, and the length dimensions in centimeters.
dCzech ChildrenCzech AdolescentsCzech AdultsChinese Adults
AllMaleFemaleAllMaleFemaleAllMaleFemaleAllMaleFemale
σ σ σ σ σ σ σ σ σ σ σ σ
a6.20.56.20.46.20.51921831913811381238102582362710
m2342442236311711358771158013621071137811629
112351245121517110177111676170817641644175818061686
2595605583876908865991410715927928958896
3565575544717776675891610114799779808727
46256366048178587959515105128510867896847
56556656449269399141051211113998968976949
6313323293464485453446486403475504444
7233243233334363323375395353354374334
8292292282393404392499557437413413403
9322322322455486433509575447475493445
10819181131141131164192143145156132
114834824736857156646286310615714743683
12182192182263283252326356284296318273
13181182181242262231266305233253272242
14131131131151161151195215162161171151
15271281261333372311374403343353372322
16233233233394415394375385365404423384
174934935037868087756396210647806835776
18345346343544534544566596535556554567
19262272262362362352403413393373372373
2025325324236337435242363944550373373363
21201202191242262232253273232253262233
2269570569510151025101510161036997104510551025
23522521522537556528573593562552562552
Table 6. Minimum and maximum values. Minimum (∧) and maximum values (∨) for each dimension. The age (a) is reported in years, the mass (m) in kilograms, and the length dimensions in centimeters.
dCzech ChildrenCzech AdolescentsCzech AdultsChinese Adults
AllMaleFemaleAllMaleFemaleAllMaleFemaleAllMaleFemale
a5.57.55.575.57.5101910191419246026592460205620452056
m1836193618303590359046704911060110499047105621054781
1110134115134110129144188144188158178155184168184155174159193166193159179
252765276546470104701047793821358713582118781188311878106
348735073486157916391577766131781316610363103691036388
4517855785165649564957086641368813664104681067810668100
5588058805874701067010685102901409514090130761178811776113
6253925392535345334533751366540653654386243623851
7182819281827274230422740295033502942264730472641
8243424342531274427443442346236623460344834483546
9283830372838285228523649336644663360355541553552
106106106101115121511144261423426105011501017
11435444544352557558755571508250825073627969796274
12152315231622213423342129234627462339227325732234
13162216221621212921292125164125411628203123312028
14111512151114141814181416143215321424131913191317
15243125312428293933392933244736472443284233422836
16163017301628284828483145275128492751324836483247
17415741574255598959896684288528815285599375935988
18215321533040436543594765467449744662447545664475
19233323332429324132403241354936493546314633413146
2019321932202729482948303930332334930332314432433144
21172318231723212821282127203321332030122922291228
22608060806174901129010893112791139111379110911179611791110
23485550554855275837582756506555655059515952595159
Publisher’s Note: MDPI stays neutral with regard to jurisdictional claims in published maps and institutional affiliations.

