Article

An Experimental Study on Cold-Bending Stress and Its Reverse-Coupling Effect with the Uniform Load on Cold-Bent SGP Laminated Glass

1
College of Civil Engineering and Architecture, Guangxi University, Nanning 530004, China
2
Key Laboratory of Engineering Disaster Prevention and Structural Safety of China Ministry of Education, Guangxi University, Nanning 530004, China
3
Guangxi Key Laboratory of Disaster Prevention and Mitigation and Engineering Safety, Guangxi University, Nanning 530004, China
*
Author to whom correspondence should be addressed.
Appl. Sci. 2021, 11(21), 10073; https://doi.org/10.3390/app112110073
Submission received: 1 October 2021 / Revised: 18 October 2021 / Accepted: 25 October 2021 / Published: 27 October 2021
(This article belongs to the Section Civil Engineering)

Abstract

:
SentryGlas® Plus (SGP) laminated glass is a novel type of safety glass with high strength and stiffness. On the other hand, cold bending is a novel technique to build curved glass curtain walls, and is advantageous in terms of its greater energy efficiency and cost-effectiveness as well as its simple construction processes. The cold bending of SGP laminated glass could result in broad applications for the material and provide huge economic benefits in the field of glass curtain wall construction. To study cold-bending stress and its reverse-coupling effect with the uniform load in SGP laminated glass panels, single-corner cold-bending tests, uniform load tests, and ultimate capacity tests were conducted on eight pieces of such panels with different cold-bending curvatures and interlayer thicknesses. The results revealed that cold-bending stress in the glass panels under single-corner cold bending demonstrated a saddle-shaped distribution, with the maximum and second-largest cold-bending stresses located near the corner of the short side and the long side adjacent to the cold-bending corner, respectively. The cold-bending stress and coupling stress increased nonlinearly as the cold-bending curvature rose and the interlayer thickness became greater. Moreover, cold-bending curvature was a factor that affected the cold-bending stress and coupling stress more significantly than the interlayer thickness. The ultimate capacity and ultimate deflection of the glass panels decreased as the cold-bending curvature and interlayer thickness grew.

1. Introduction

To improve aesthetics and expand the range of structural design concepts, curved profiles are extensively used as constructional elements for architectural structures such as windows and building facades/fronts, including sunshades and light shelves [1,2]. The combination of curved glass and architectural structure provides more possibilities for the interactions between space and light. As compared to other design industries, the construction industry shows a greater tendency towards the use of large-area glass curtain walls with relatively small curvatures to obtain the utmost permeability and space fluidity. The curved glass curtain wall is thus becoming a popular structure in the construction industry because of its excellent daylight acquisition and beautiful appearance.
Heat bending, plane fitting, and cold bending are three typical techniques for building curved glass curtain walls [3]. More specifically, heat bending is a procedure that requires a high temperature (usually above 550 °C) [4] and many molds, making the procedure costly and time-consuming. On the other hand, plane fitting works by constructing a rough curved surface through plane splicing, and the outcome for this procedure is often unsatisfactory. However, cold bending can be used to create a curved glass curtain wall with a smooth texture through the unrestricted use of tempered glass. This technique can be used to bend plane glass without any mold, and it is significantly advantageous compared to the other two techniques due to its low energy consumption, high cost-effectiveness, and simple processes [5]. The principle of cold bending is to make full use of the elasticity of the glass itself. At the construction site and under ambient temperature conditions, glass panels can form the designed shape by applying a force perpendicular to the outside of the plane, and a piece of freeform curved glass is obtained [6,7].
Indeed, cold bending is an attractive technique for building curved glass curtain walls. However, current research on the mechanical properties of cold-bent laminated glass is still limited. Galuppi et al. [8,9,10,11] conducted cold-bending tests on hyperbolic paraboloid polyvinyl butyral (PVB) laminated glass and found that the principal stress of the glass became asymmetrical when the principal curvatures were large. The authors proposed a method to calculate the principal stress and deformation of laminated glass with single-corner cold bending. Spagnoli et al. [12] investigated the geometrically non-linear problem of the anticlastic bending of panels with an example of the application of cold-bent laminated glass panels in curved building façades. Belis et al. [13,14] studied the behavior of cold-bent laminated glass units with a single curvature and two layers of fully toughened glass that were bound together with different types of PVB. Their results showed that the mechanical behavior of these units was dependent on three aspects, namely the type and thickness of the interlayer, the speed of load application, and the temperature during the bending process. Moreover, a complete cycle of cold-bent glass from cold bending to spring-back and relaxation was analyzed by Fildhuth et al. [15], in which the corresponding numerical analysis results were compared against the test results. The authors found that elastic spring-back and long-term recovery of the PVB glass panels at room temperature exhibited a non-linear loss of the initial deformation. Quaglini et al. [16] investigated the mechanical response of glass shells cold-bent into hyperparaboloid shapes with a focus on two subjects, namely the application of cold-bending procedures to vertically oriented panels instead of horizontal ones (which allowed for the minimization of the disturbance from the initial deflection due to self-weight), and the impact of wind load on curved glass panels installed on glazing façades. Nehring et al. [17] performed a numeric and experimental study on the parameters relevant to the load-bearing capacity of cold-bent glass (e.g., time- and temperature-dependent material behaviors, geometry, and other supporting conditions), and proposed a design method for two exemplary cold-bent structures (uniaxial or double curved). Schlösser [18] studied the production procedure of cold-bent laminated thin glass panels and transformed the glass panels into sinusoidal shapes with molds. The authors used experimental and numerical simulation strategies to study the mechanical properties and post-breakage behavior of these glass panels.
The studies described above suggest that many scientific problems remain to be studied with respect to cold-bent laminated glass. Most previous research focuses on the stress caused by cold bending, but research on the coupling of cold bending and uniform load is relatively scarce. The deformation caused by cold bending could produce permanent cold-bending stress in the glass panels, and such stress could be affected by many other factors, including cold-bending curvature, interlayer thickness, and boundary conditions. The cold-bending stress exists even before the cold-bent glass panels bear a uniform load. After the uniform load is applied, the cold-bending stress in the glass panels will be coupled with a kind of new stress generated by the load, which can be considered a stress problem of a thin plate with initial stress [19]. The interlayer within laminated glass deforms and interacts with the glass during cold bending, resulting in difficult theoretical analysis and complex prediction of the overall stress [20]. As a result, practical experiments are needed to reveal cold-bending stress and its coupling effect with the uniform load in cold-bent SGP laminated glass panels.
SGP laminated glass, a novel type of safety glass, is a composite structure manufactured by combining two or more pieces of glass together with one or more plies of SGP [21,22]. It provides higher strength and rigidity than PVB laminated glass [23]. Therefore, in recent years SGP laminated glass has been extensively used in building curved glass curtain walls. In this paper, rectangular SGP laminated glass panels were taken as the research object, and eight sample panels were subject to single-corner cold-bending tests, uniform load tests, and ultimate capacity tests. The effects of different cold-bending curvatures and interlayer thicknesses on the cold-bending stress and its reverse-coupling effect with the uniform load were considered in this study. Reverse loading, which is defined as the situation where the directions of the uniform load and cold bending are opposite to each other, is the most unfavorable to the bearing capacity of cold-bent glass panels; however, such an unfavorable situation could be a promising pathway to accurate determinations of the bearing capacity of cold-bent SGP laminated glass panels. More importantly, single-corner cold bending of rectangular glass panels provides more free forms and greater architectural freedom to the panels, which could help fit most curved glass curtain walls into complex shapes.

2. Experiments

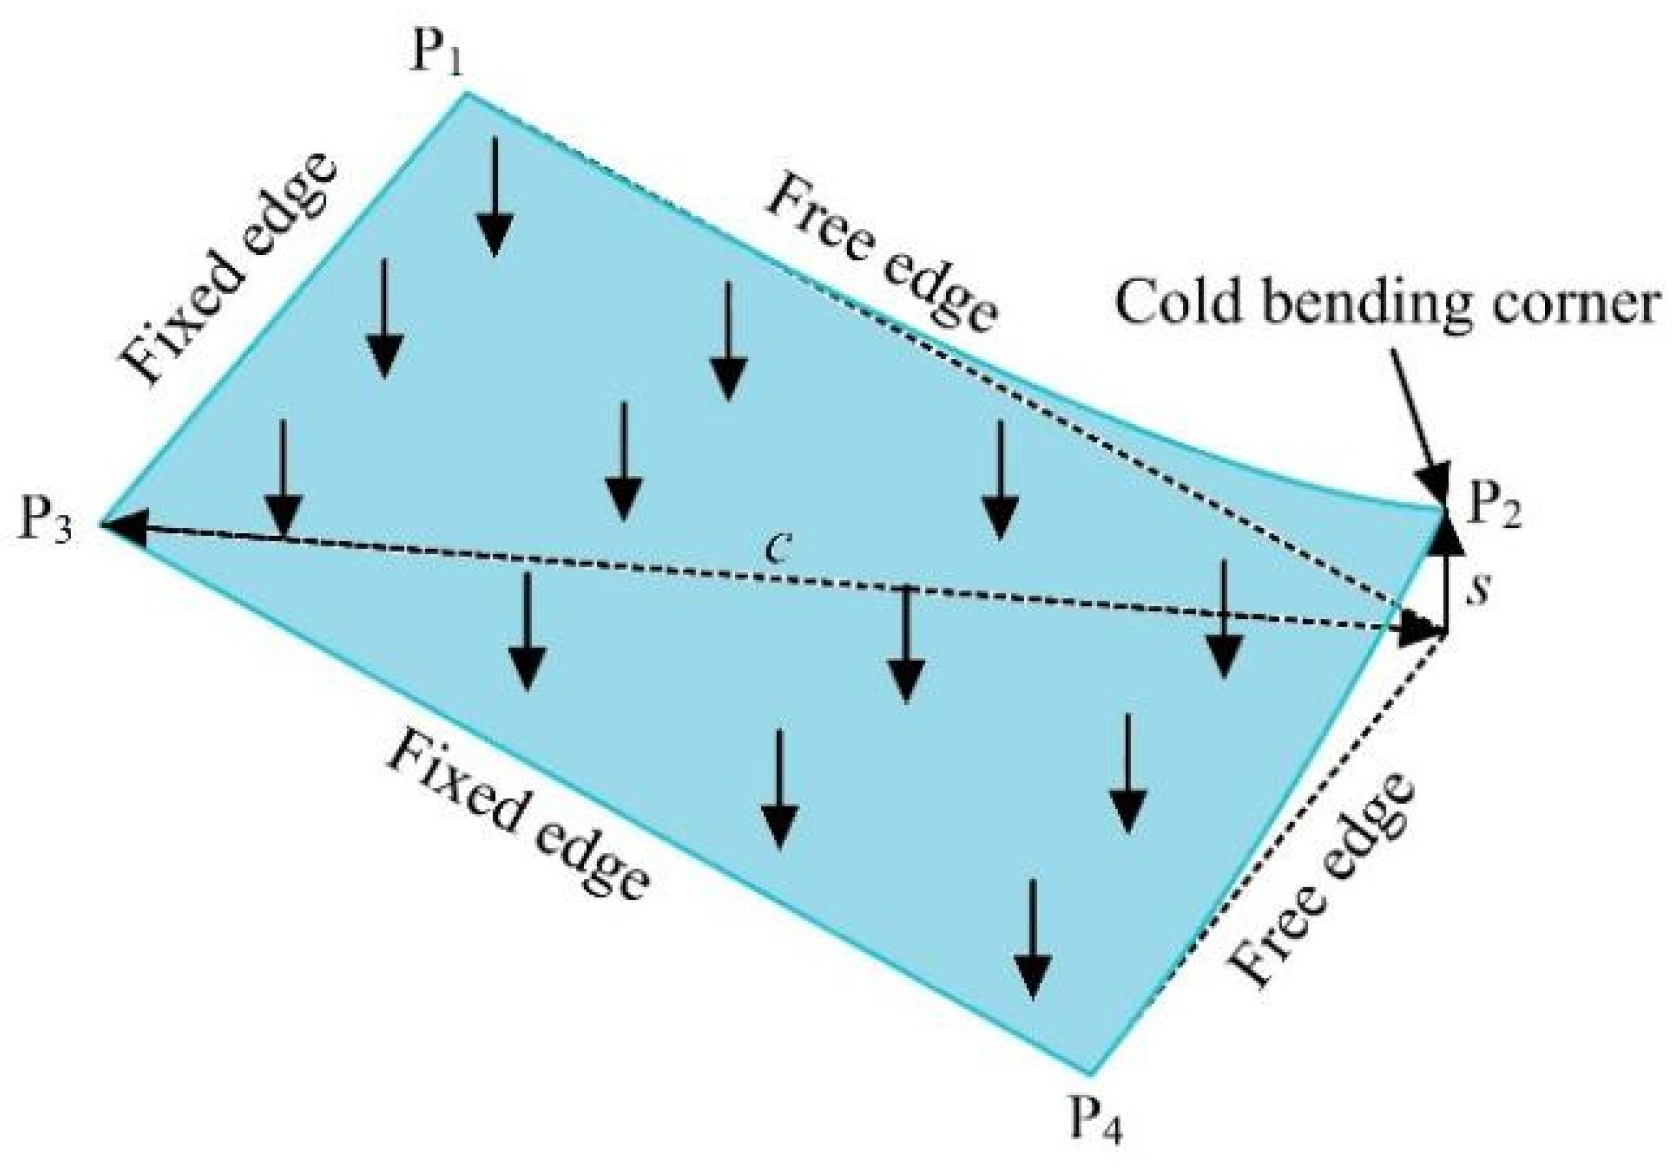
2.1. Specimen Design

To investigate the impact of different cold-bending curvatures and interlayer thicknesses on cold-bending stress and its reverse-coupling effect with the uniform load on SGP laminated glass, single-corner cold-bending tests, uniform load tests, and ultimate capacity tests were performed on 8 tempered laminated glass panels with different cold-bending curvatures and interlayer thicknesses. All the glass panels were 2200 × 1200 mm in planar size, and were composed of 2 pieces of tempered glass with a thickness of 5 mm and an inserted SGP layer. Because there is no precise description of the index of anticlastic cold bending [20], to describe the degree of cold bending of the glass panels we referred to the warpage measurement of PCB board in the IPC-TM-650 test methods manual and define the cold-bending curvature as:
β = s 2 c   ×   100 %  
where ‘β’ is the cold-bending curvature; ‘s’ is the maximum cold-bending displacement of the cold-bending corner; and ‘c’ is the diagonal length of the glass panel.
The geometric parameters in the test programs included interlayer thicknesses (ts = 1.14 mm, 1.52 mm) and cold-bending curvatures (β = 0.4%, 0.6%, 0.8%, 1.0%). The geometric parameter values and dimensions of test specimens are shown in Table 1. All the test specimens were manufactured in factories. The Young’s modulus and Poisson ratio of the tempered glass were set as 72 GPa and 0.22, respectively.

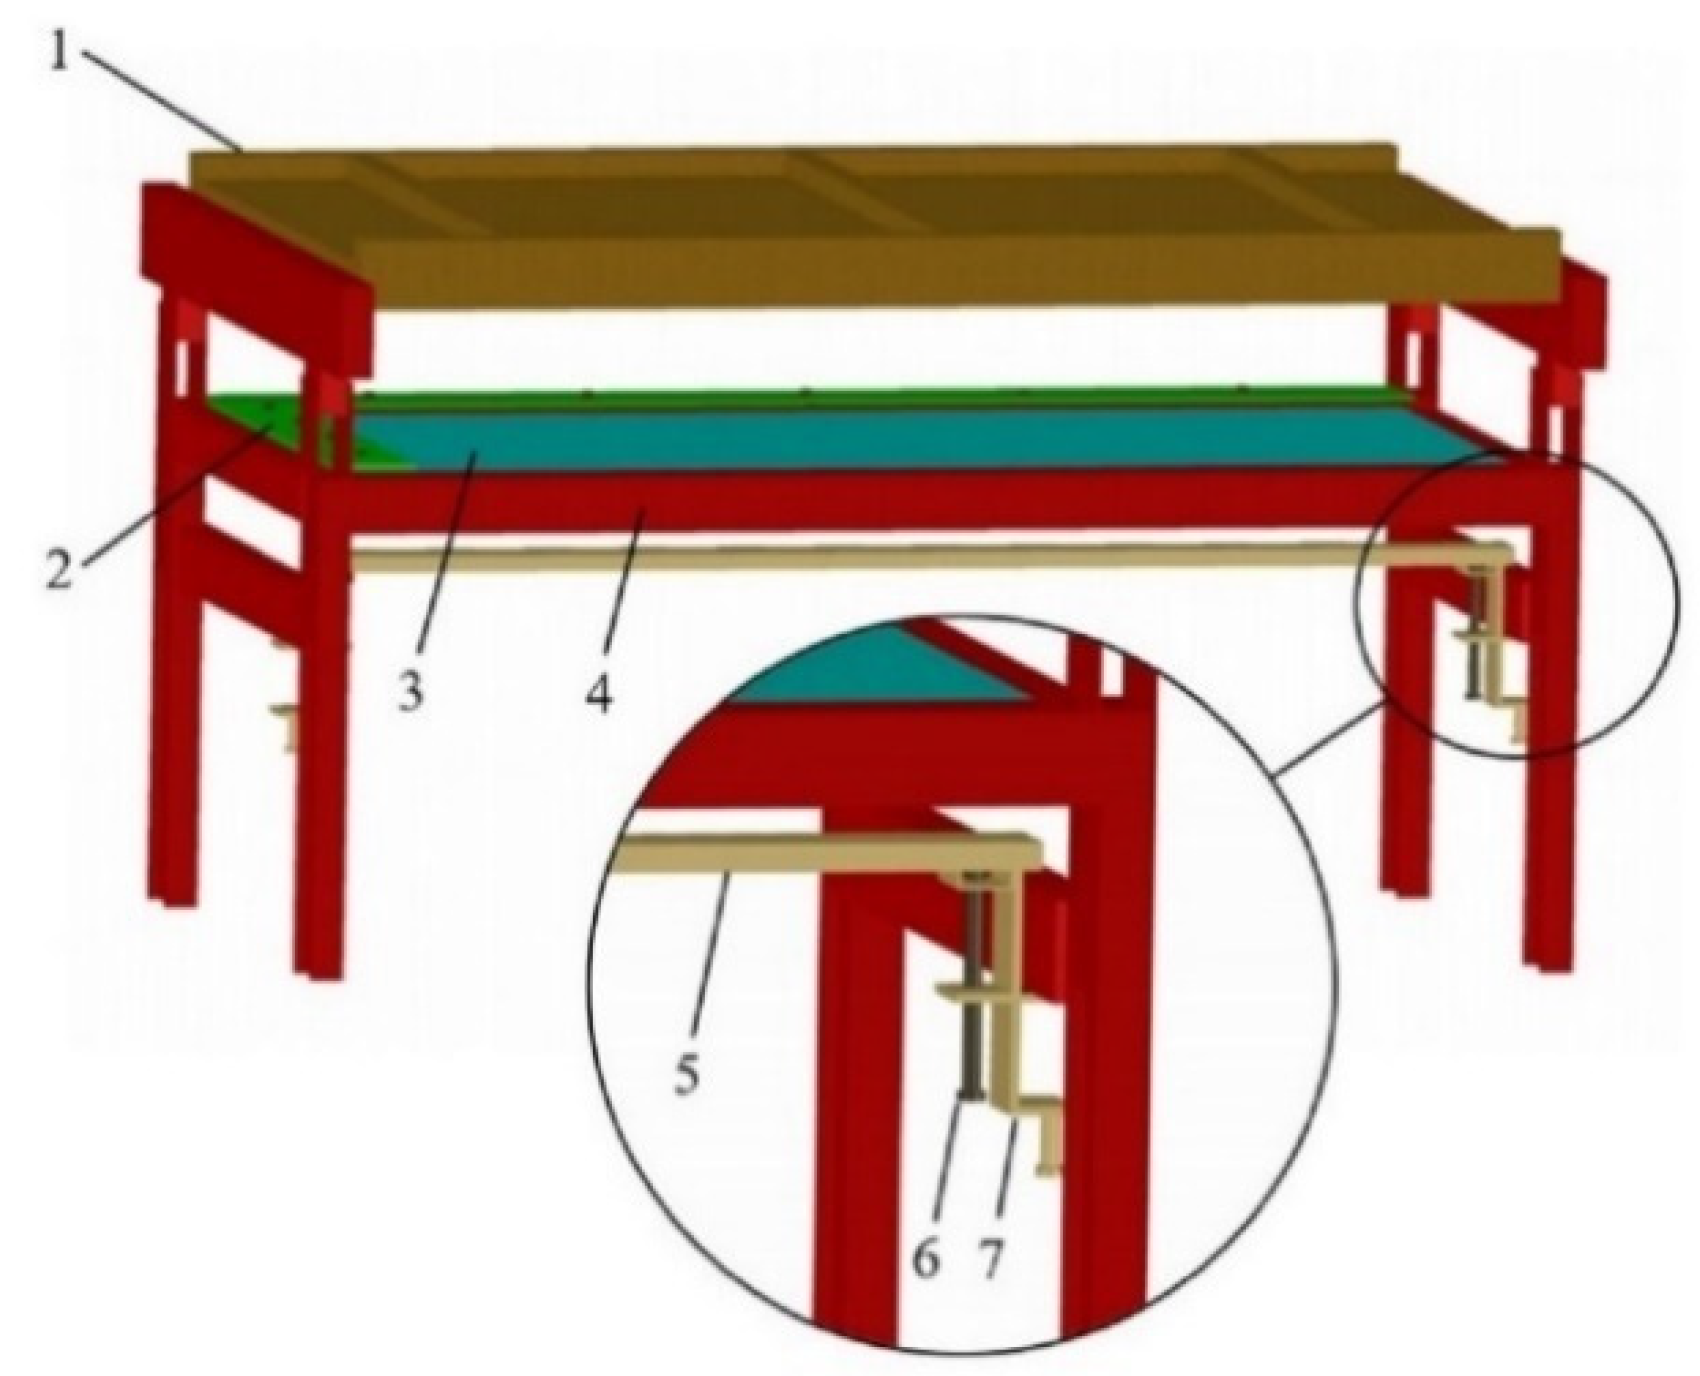
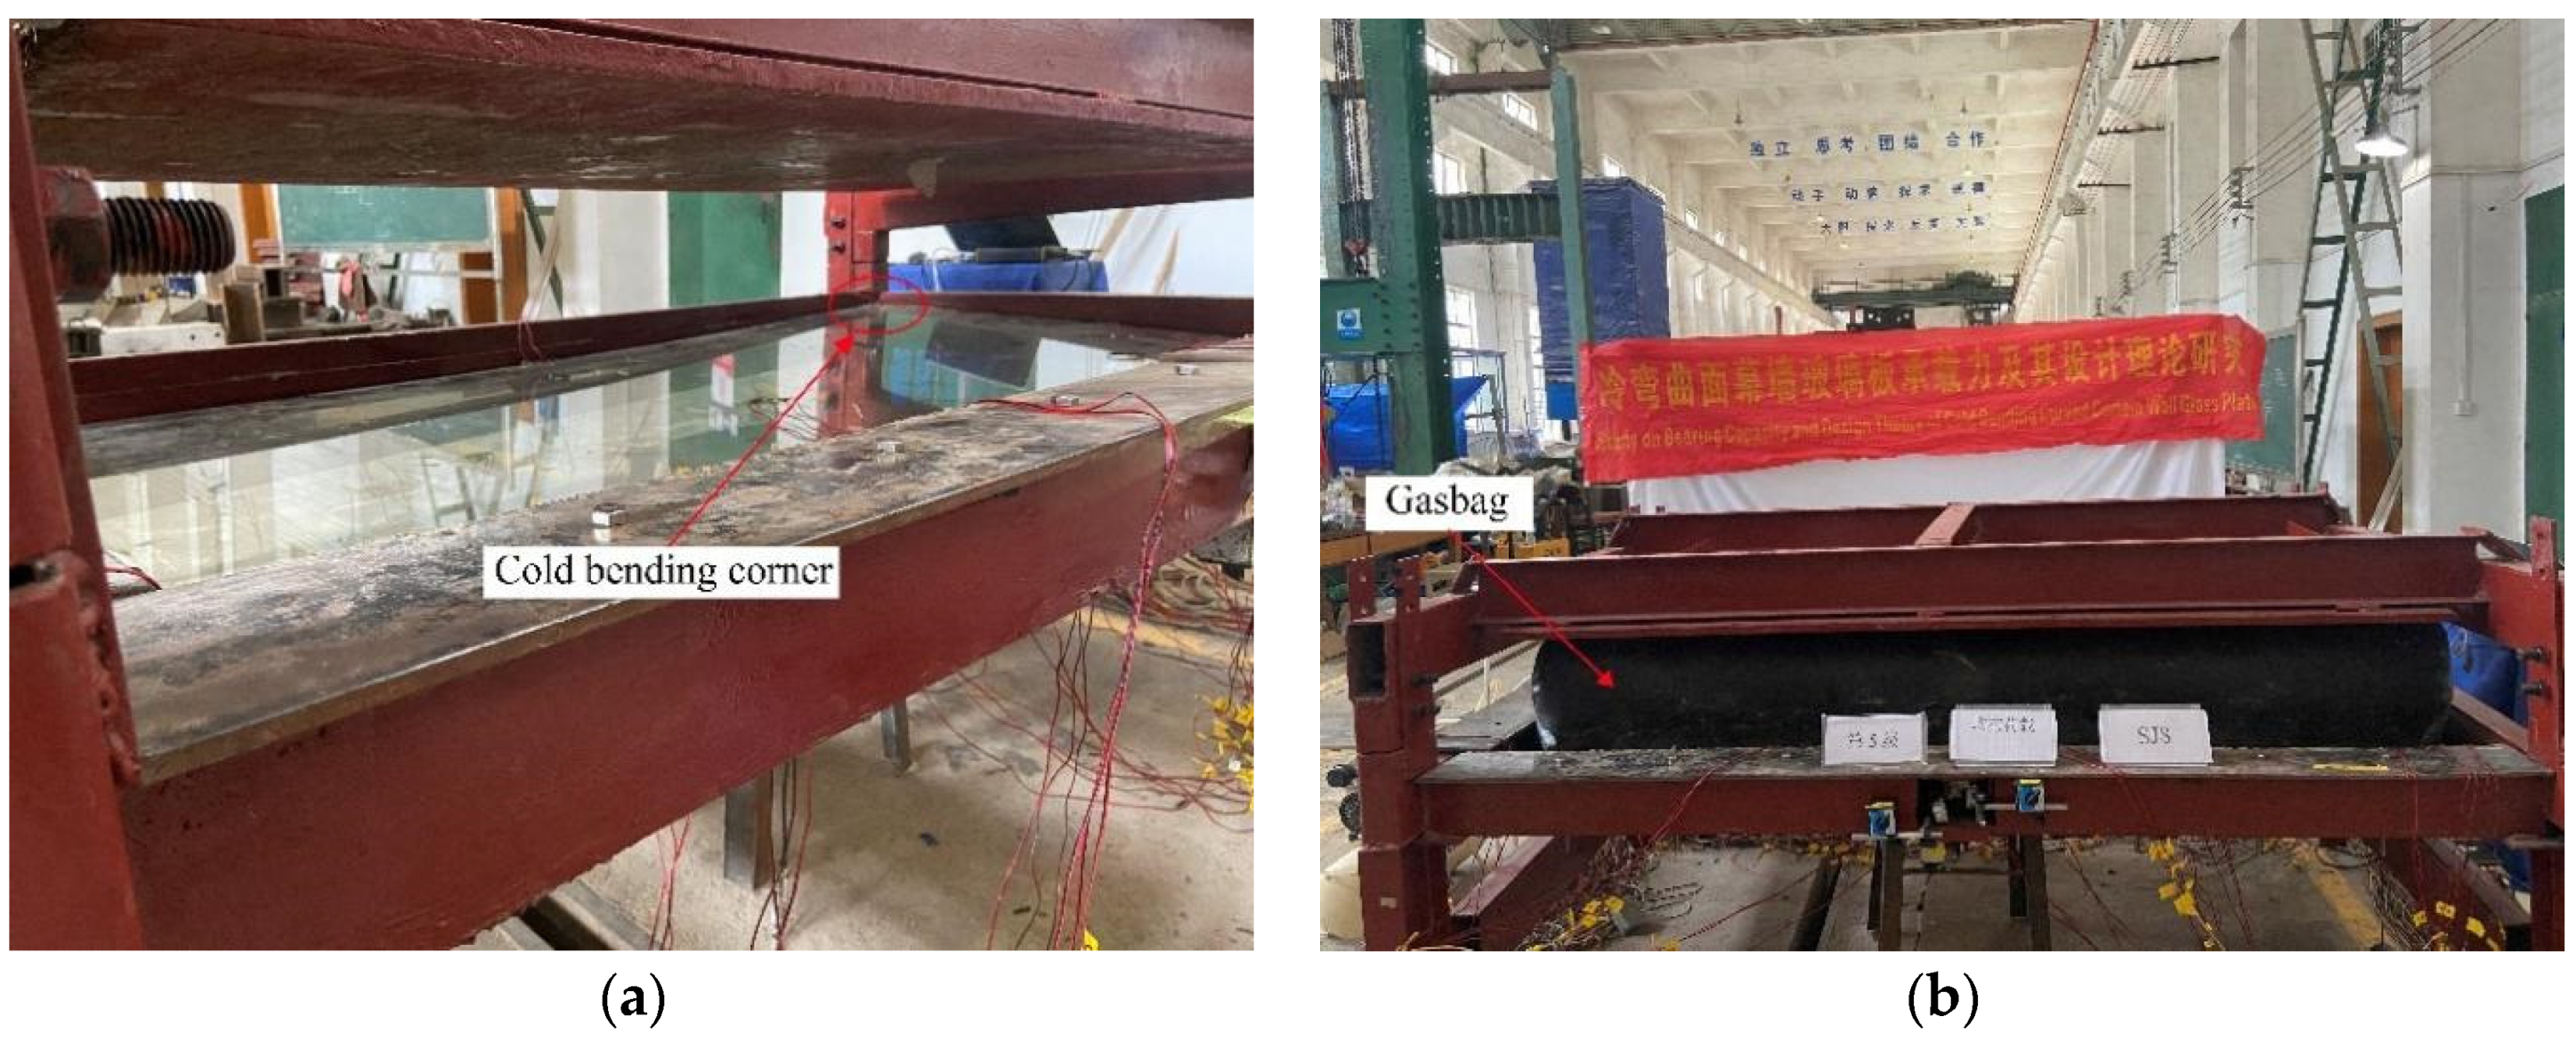
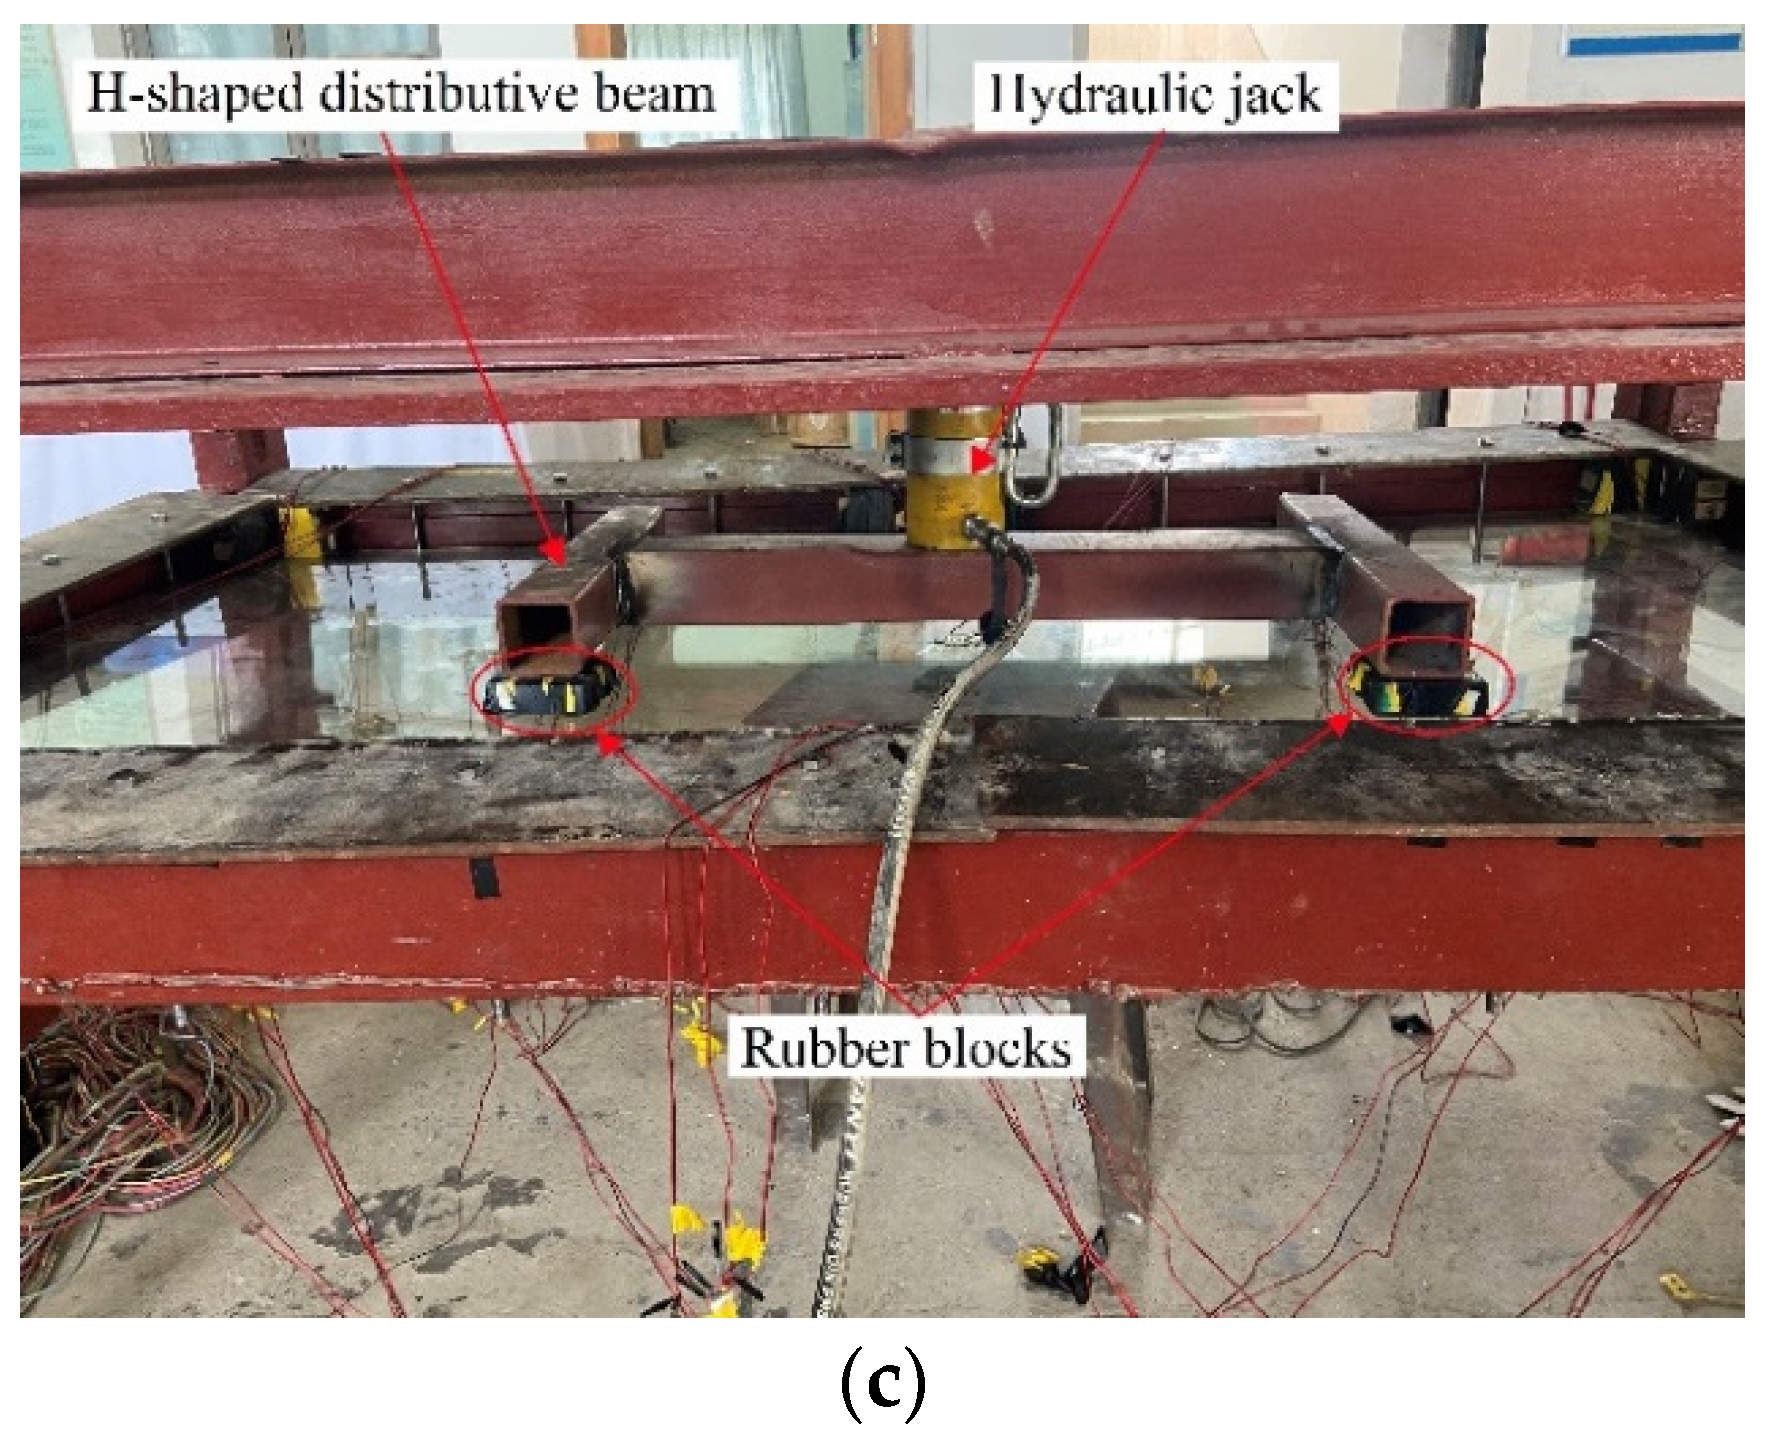
2.2. Experimental Device and Procedures

During the tests, the corner point P2 on the glass panel was taken as the cold-bending corner, and its adjacent 2 sides were designated as free edges. The other 2 sides were fixed edges and kept on the same plane by fixed steel plates. The schematic diagram of cold bending and uniform load is shown in Figure 1.
A special test device was designed and manufactured to cater to the objective of this study. It is capable of performing cold-bending tests, uniform load tests, and ultimate capacity tests on the frame-supported glass panels, as shown in Figure 2. It consists of a reaction frame, several fixed steel plates, a support frame, and a cold-bending loading device. The cold-bending loading device is symmetric at both ends, consisting of a square steel pipe, 2 screws, and 2 fixed buckles. It is fixed under the support frame by the 2 fixed buckles at both ends, with 1 end below the cold-bending corner P2 and the other below the fixed corner P1. When the cold-bending loading device was used to load the glass panel, the square steel pipe under the fixed corner end remained stationary. By twisting the screw under the cold-bending corner end of the square steel pipe, P2 is driven to different displacements, creating different cold-bending curvatures on the glass panel. Additionally, the reaction frame provides the opposite force for the glass panel in uniform load tests and ultimate capacity tests. Rubber gaskets were placed between the glass panel and test device to avoid damage due to local stress concentrations.
The tests were carried out in 3 stages. The first stage involved cold-bending tests to study the cold-bending stress of glass panels during cold bending. The second stage involved uniform load tests to study the reverse-coupling effect of cold-bending and uniform load by simulating the static wind load. The third stage consisted of ultimate capacity tests to investigate the ultimate capacity, ultimate deflection, and damage phenomena with a hydraulic jack and an H-shaped distributive beam to load the cold-bent SGP laminated glass panel.
In the cold-bending tests, the glass panel was placed on the support frame, and the 2 fixed edges of the panel were fixed by the fixed steel plates. After that, the cold-bending displacement at P2 was produced by twisting the screws on the cold-bending loading device. The cold-bending tests are shown in Figure 3a. The glass panel was loaded with displacement-controlled loading, which was evenly divided into 5 levels, with each being 20% of the maximum cold-bending displacement. Each level was maintained for 15 min, and the cold-bending displacements at P2 were measured by a displacement sensor.
Following the cold-bending tests, the uniform load tests were performed. For this, 2 wedge-shaped inclined braces were placed between the support frame and the 2 free edges of the glass panel to make sure the panel remained cold-bent with the 4 edges of the frame being supported. Subsequently, a gasbag was installed between the reaction frame and the glass panel. To simulate the wind load, a uniform load was applied to the glass panel by the gasbag and a gas pump. The uniform load tests are shown in Figure 3b. According to [20], the wind load is 5 kPa when the wind load resistance of the exterior window reaches the highest level. Based on this idea, the uniform load was divided into 5 levels (each at 1 kPa) and maintained for 15 min. The load was measured by the barometer on the gas pump.
The ultimate capacity tests started 24 h after the uniform load tests ended. Since the loading capacity of the gasbag is limited, the glass panel cannot be loaded to failure, so a hydraulic jack and an H-shaped distributive beam were used as the loading devices in the ultimate capacity tests. Firstly, after the gasbag was removed, the hydraulic jack and the distributive beam were placed at the center of the glass panel for 4-point loading. The ultimate capacity tests are shown in Figure 3c. To avoid direct contact between the glass panel and the distributive beam, 4 rubber blocks were located under the 4 corners of the distributive beam. The self-weight of the loading devices and rubber blocks were taken as the load of the first level (0.6 kN). Subsequently, the glass panel was loaded with step loads. Each step was as large as 1 kN and was maintained for 15 min. When the glass panel failed, the ultimate capacity tests would end, and the loading values would be measured by the digital pressure gauge on the hydraulic jack.
The displacement and strain of the glass panels at each loading stage were measured and recorded by the Chinese-made DH3821 static strain test system (which consists of several strain acquisition instruments and a software operation terminal) with a sampling frequency of 2 Hz. Before the tests, the displacement sensor, static strain test system, gas pump, hydraulic jack, and other relevant instruments were calibrated by Guangxi Academy of Measurement and Testing in Guangxi Autonomous Region, China. The measurements of these instruments can be traced back to the Chinese Standard of Metrology, and all the tests were carried out at 28~32 °C.

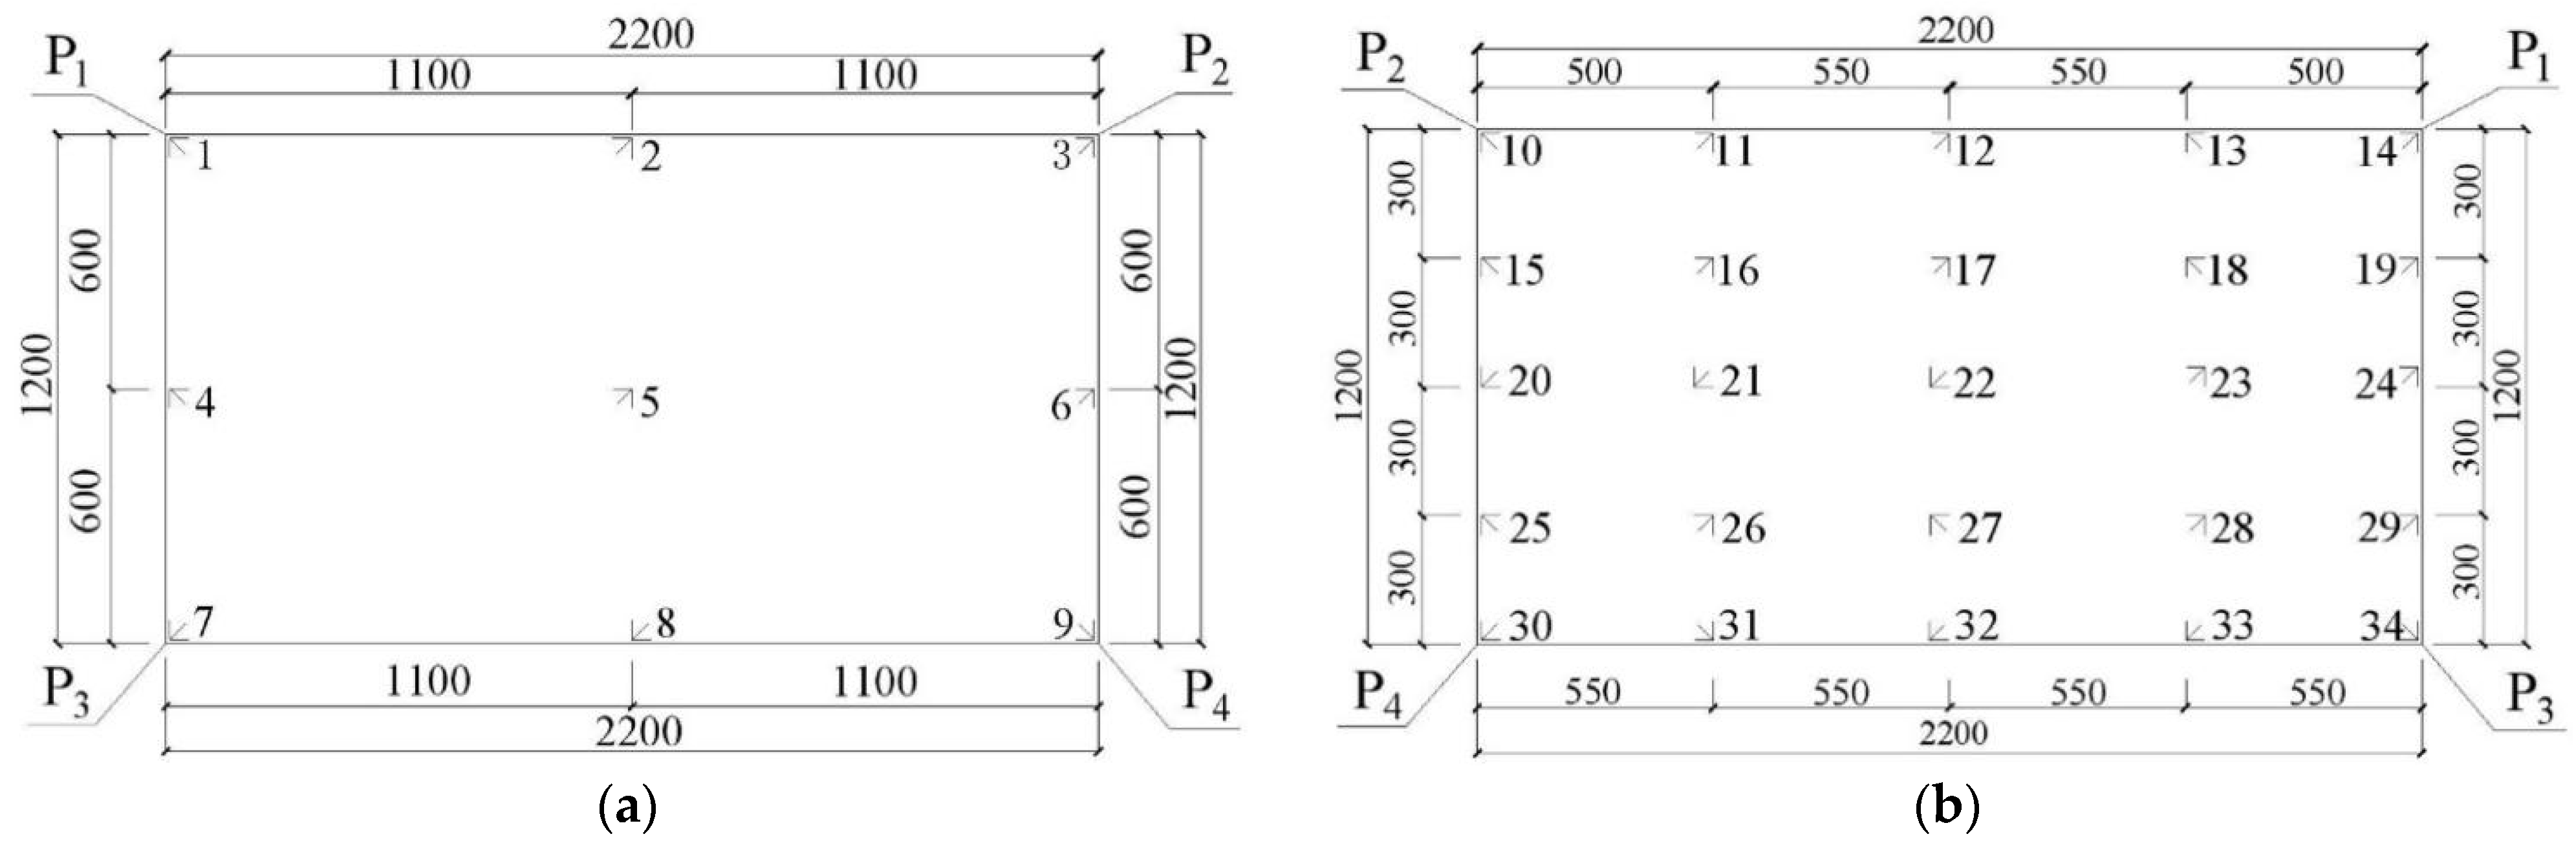
2.3. Arrangement of Testing Points

Strain gauges were attached on the upper and lower surfaces of the glass panel to obtain the stress distribution on the surface of the glass panel during the tests. Through these gauges, strain data could be automatically and accurately recorded and monitored by the static strain test system mentioned above. The upper surface of the glass panel, where 9 strain gauges (S1–S9) are attached, was subjected primarily to compressive stress during the tests. Meanwhile, the lower surface, where 25 strain gauges (S10–S34) are located, was mainly subject to tensile stress. Since the bearing capacity of glass panels is primarily dependent on the maximum tensile strength, more testing points were assigned on the lower surface. The direction of the principal stress was uncertain, so right-angle strain rosettes were adopted at all stress testing points. The linear strains of the 3 directions of each right-angle strain rosette were collected by the static strain test system. Then, the static strain test system automatically calculated the first main stress and the second main stress of each testing point, and the maximum of the 2 was the maximum principal stress of each testing point. The arrangements of the strain gauges are shown in Figure 4a,b. Additionally, 9 displacement testing points were arranged on the lower surface of the glass panel to monitor the displacement changes in the key positions of the glass panel during the tests. The distribution of these testing points is depicted in Figure 4c. The strain-type displacement sensors were installed on these displacement testing points to measure the displacement, and the displacement data were recorded and monitored by the static strain test system.

3. Cold-Bending Test Results and Discussion

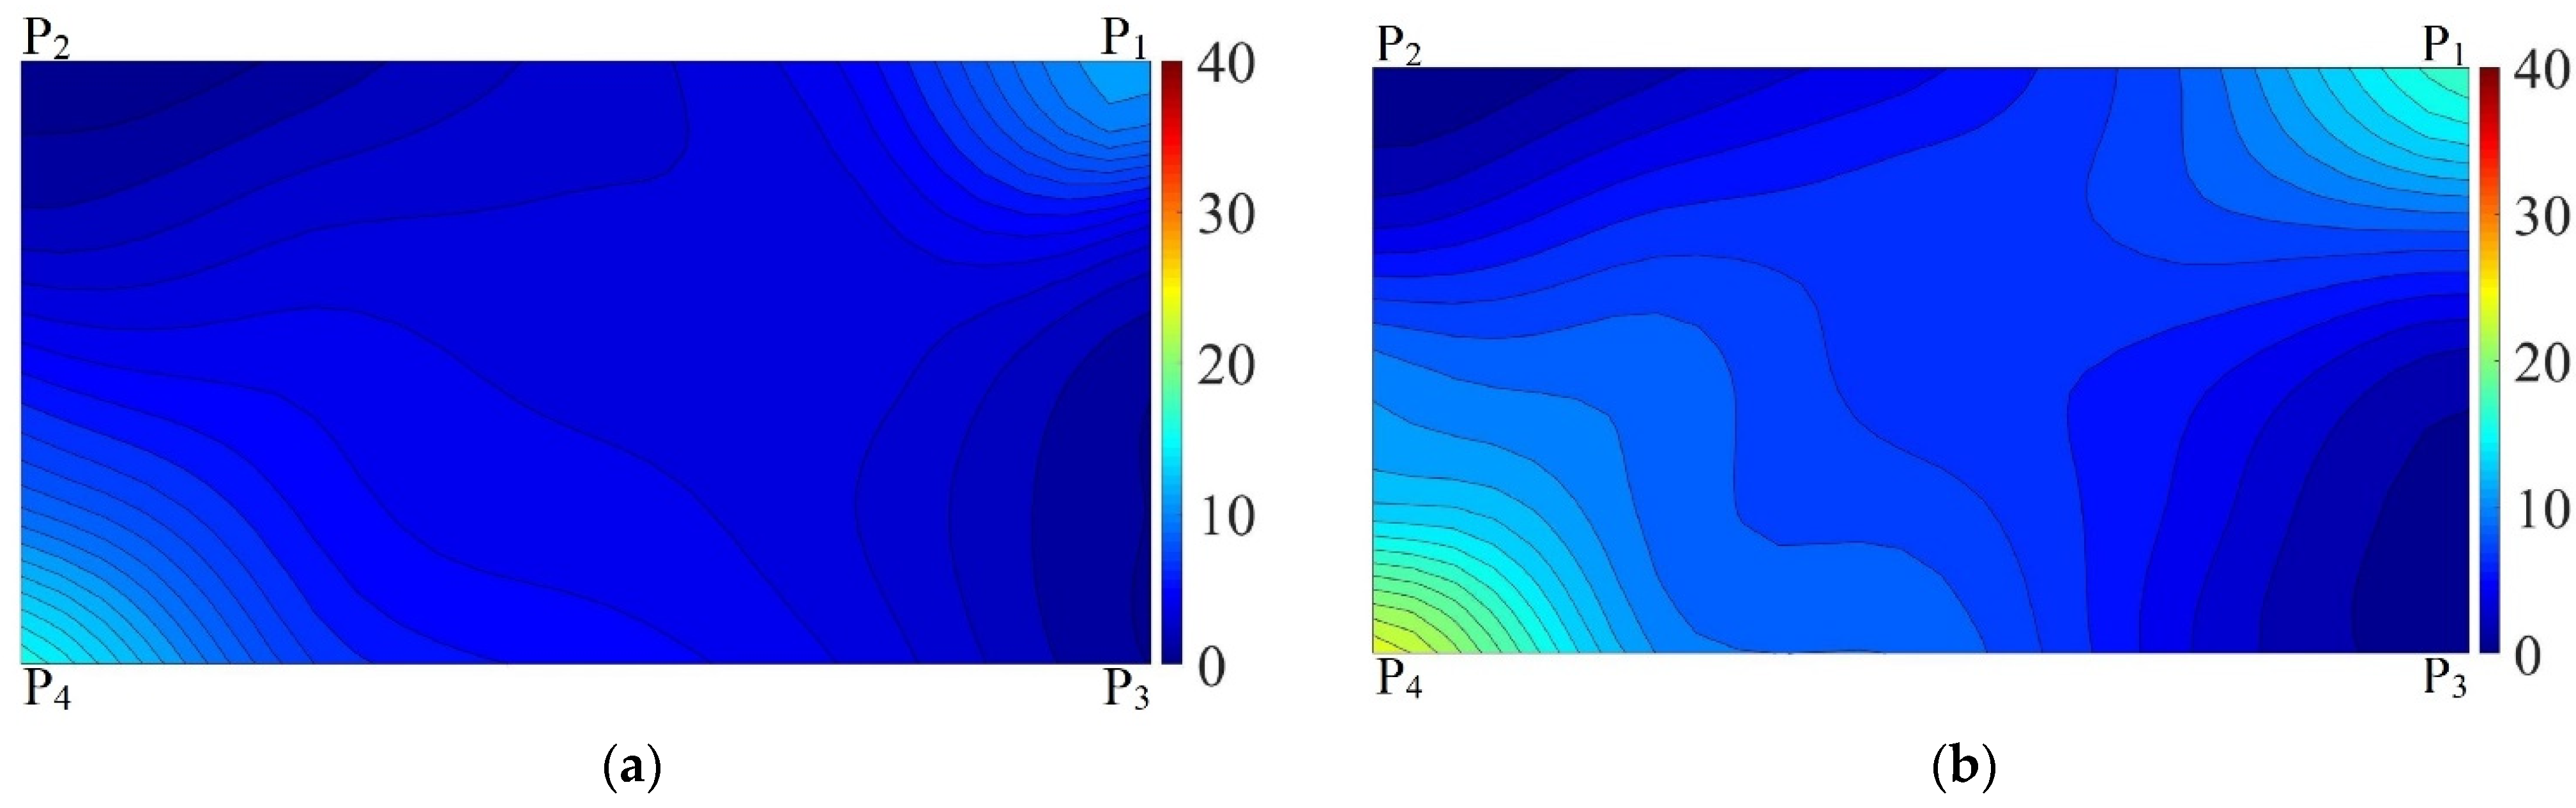
3.1. The Cold-Bending Stress Distribution

After inputting the coordinates and stress values of each testing point, MATLAB generated the cold-bending stress nephograms and continuous stress contours on the lower surface of the glass panels, as shown in Figure 5. It can be seen from the figure that the cold-bending stress distribution on the lower surface of the specimens was uneven, with the smallest stress being observed at the corner points P2 and P3, with relatively small stress at the panel center. The maximum cold-bending stress appeared near the corner of the short-side direction adjacent to the cold-bending corner, which was the position of testing point S30, and the second-largest cold-bending stress appeared near the corner of the long-side direction adjacent to the cold-bending corner, which was the position of testing point S14. The average value of the second-largest cold-bending stress values across specimens was calculated to be 71.1% of the average value of the maximum cold-bending stress values. The two adjacent edges of P3 were fixed, while the two adjacent edges of P2 were free. Consequently, when the displacement occurred at P2, the curvature radius on the long side became larger than that of the short side, leading to smaller cold-bending stress on the long side.
The cold-bending stress along the diagonal P1–P4 was greater than that along the diagonal P2–P3. More specifically, the stress along the diagonal P1–P4 was larger at both ends but smaller in the middle, whereas the opposite situation occurred along the diagonal P2–P3. It is noteworthy that the overall shape of the cold-bending stress nephogram was like a saddle. As the bearing capacity of the panel edges was smaller than that in the middle and the cold-bending stress values at P4 and P1 were large, the cold-bending stress at these two points should be monitored and restricted with top priority during cold bending.

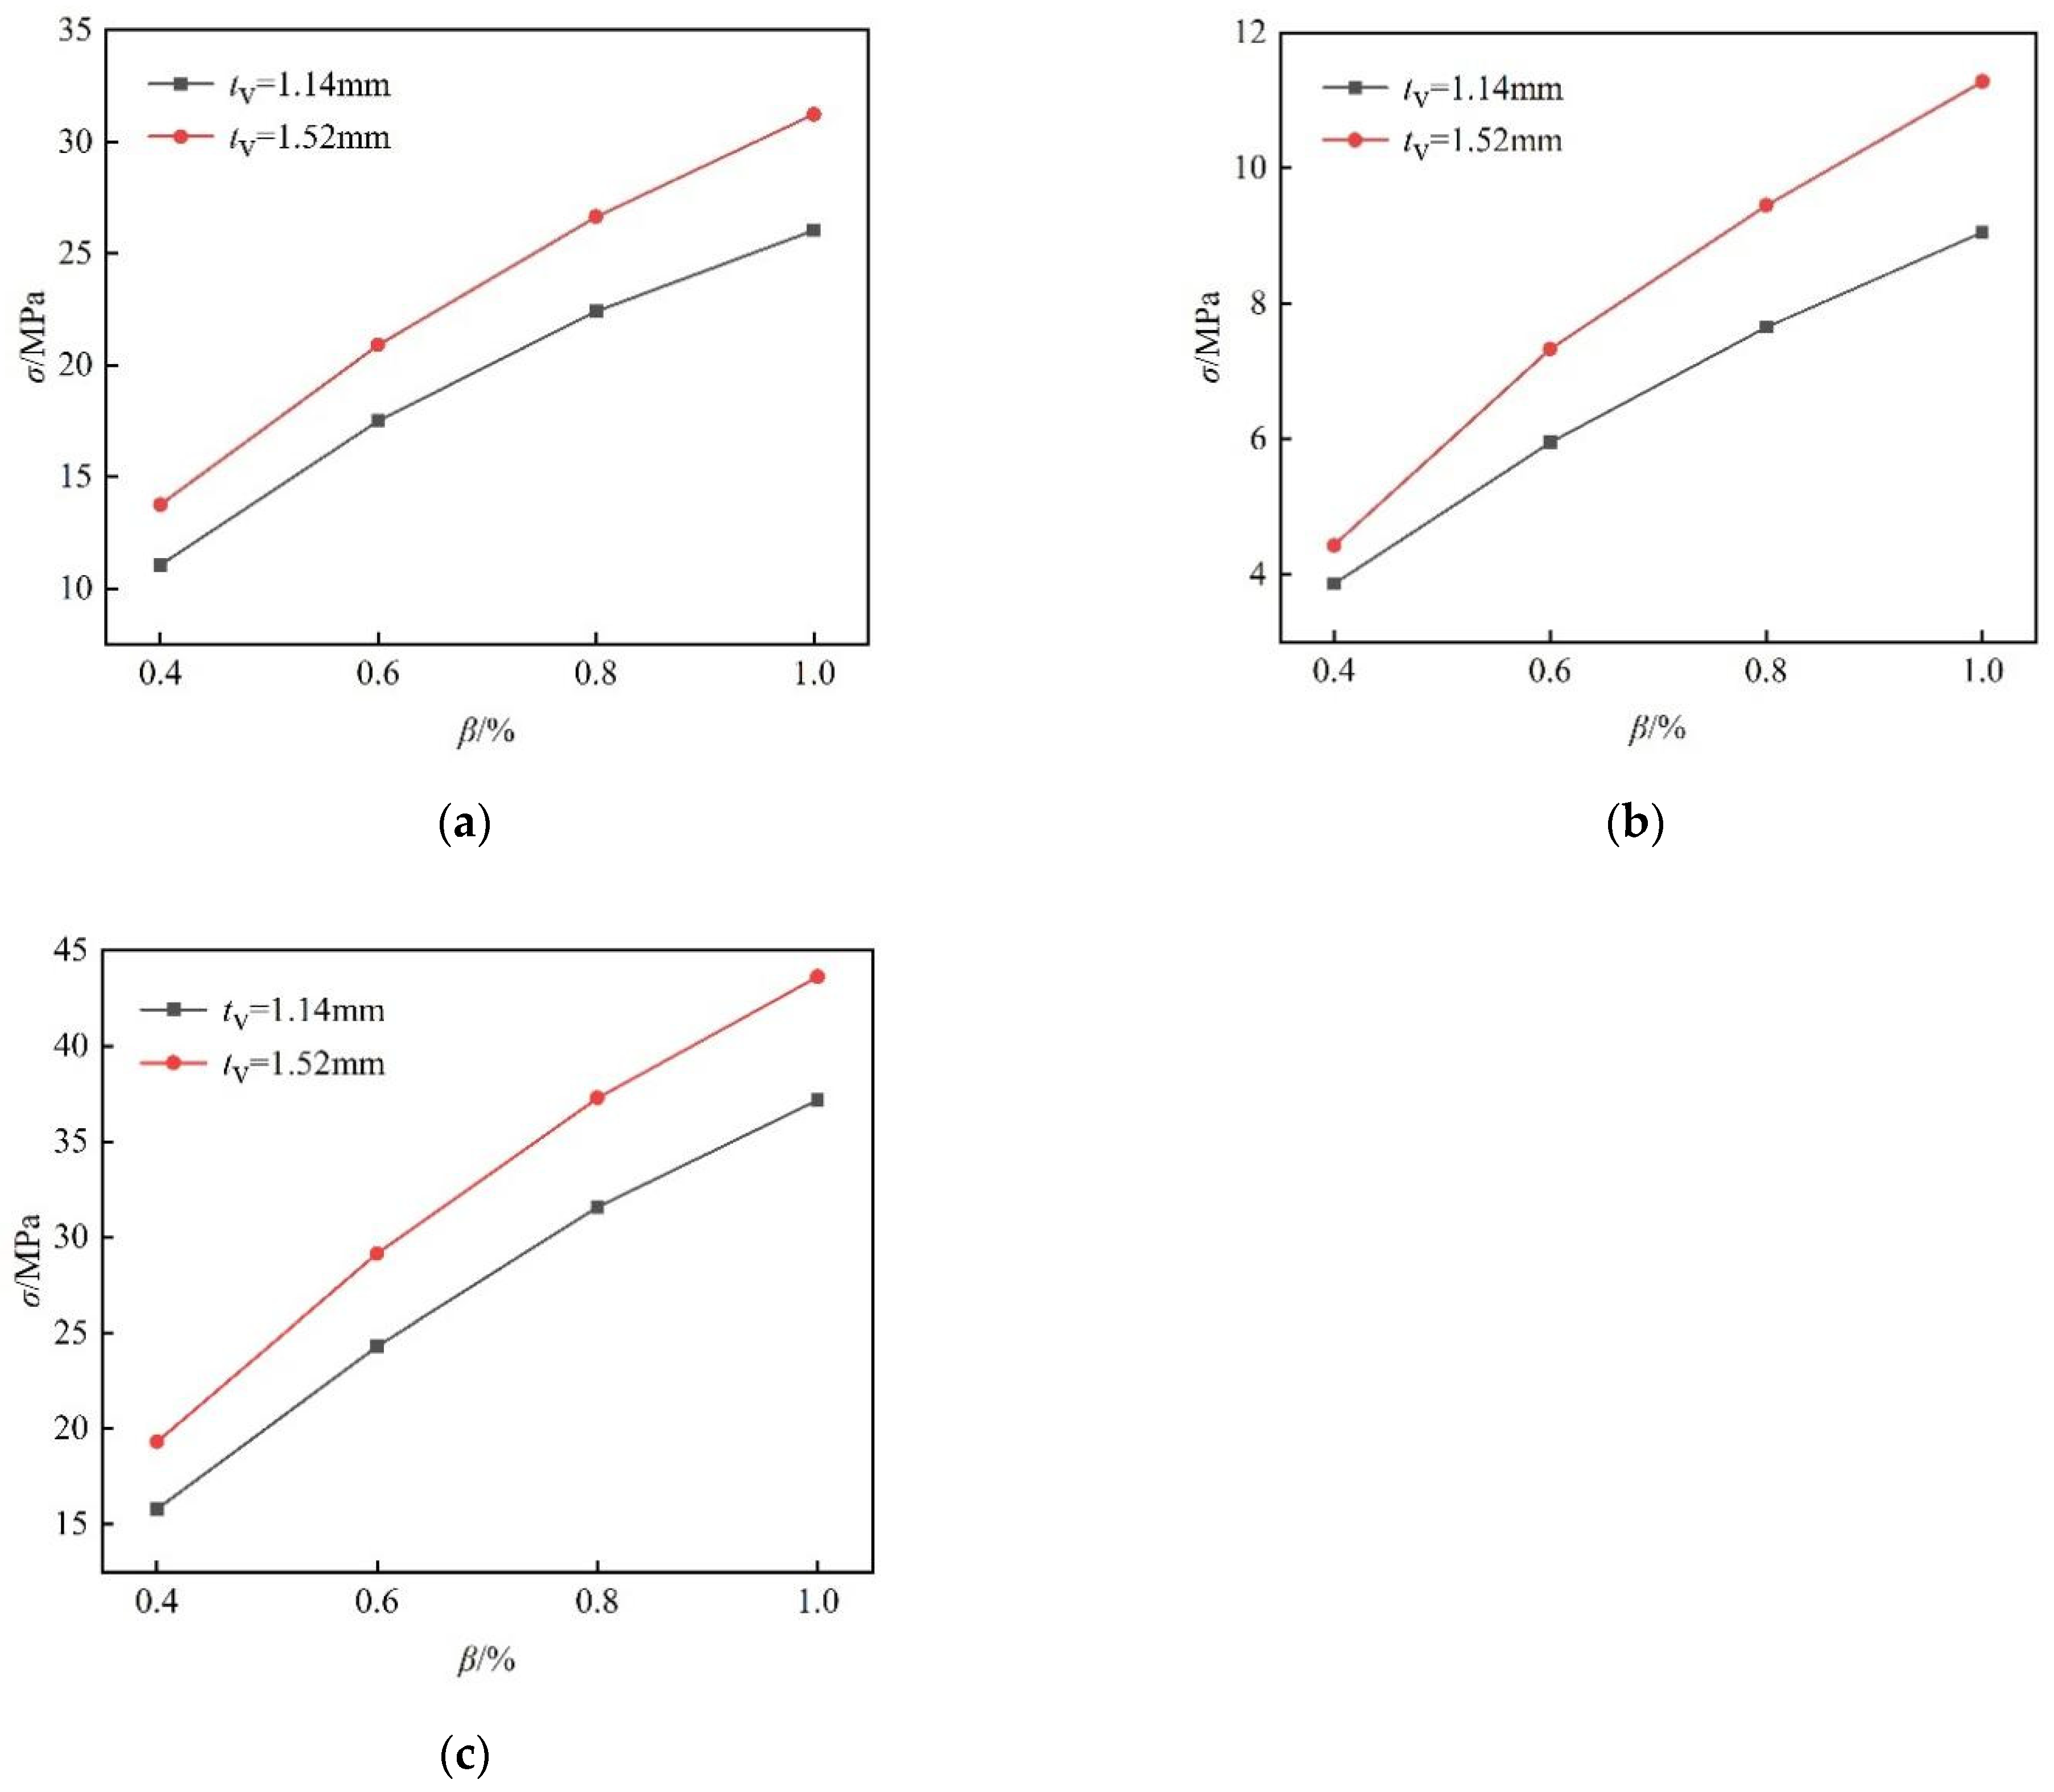
3.2. Influence of Cold-Bending Curvature on Cold-Bending Stress and Its Distribution

By comparing the cold-bending stress nephograms of specimens with the same interlayer thickness and different cold-bending curvatures in Figure 5, it could be concluded that as the cold-bending curvature became larger, the cold-bending stress at the two adjacent corner points of the cold-bending corner increased significantly, and the cold-bending stress distribution on the glass panels became more polarized while keeping a saddle-like shape.
The cold-bending stress values of the key points on the tensile (lower) surface of each specimen are listed in Table 2. Because the maximum coupling stress in the uniform load tests was located at the panel center, the cold-bending stress of testing point S22 was also included.
Judging from Table 2, when the interlayer thickness remained unchanged, the cold-bending stress rose with greater cold-bending curvature. More specifically, when the cold-bending curvature increased by 0.2%, the maximum cold-bending stress also rose by 33% on average, demonstrating a significant correlation between the two values.
The relationships between the cold-bending curvature and the cold-bending stress at testing points S14, S22, and S30 are drawn in Figure 6 to give a more intuitive demonstration. Due to the geometrical nonlinearity caused by the cold bending, the cold-bending stress showed an increase with declining growth rates along greater cold-bending curvatures, suggesting that the effect of cold-bending curvature on the cold-bending stress is stronger at the early stage of cold-bending loading.

3.3. Influence of Interlayer Thickness on Cold-Bending Stress and Its Distribution

Judging from Figure 5, the cold-bending stress nephograms of glass panels with identical cold-bending curvatures but different interlayer thicknesses exhibit few differences. Therefore, the impact of interlayer thickness on the cold-bending stress distribution of the glass panels is minimal.
However, by comparing the cold-bending stress of specimens with the same cold-bending curvature but different interlayer thicknesses in Table 2, it can be inferred that the cold-bending stress increased with a thicker SGP interlayer. Since SGP is a much stronger material than other interlayer materials [24], the large interlayer thickness would bring greater combined stiffness and cold-bending stress to the glass panel. More specifically, when the interlayer thickness increased from 1.14 mm to 1.52 mm, the maximum cold-bending stress of the glass panels was calculated to rise by 19.4% on average. Consequently, interlayer thickness is a less relevant factor affecting the cold-bending stress than the cold-bending curvature.
The relation curves with large interlayer thicknesses in Figure 6 had a large inclination angle and were located above other relation curves with smaller interlayer thicknesses, and the vertical distances between the curves increased with greater cold-bending curvature. Consequently, the glass panel with a larger interlayer thickness is indicated to exhibit greater cold-bending stress and faster rates of stress growth.

4. Uniform Load Test Results and Discussion

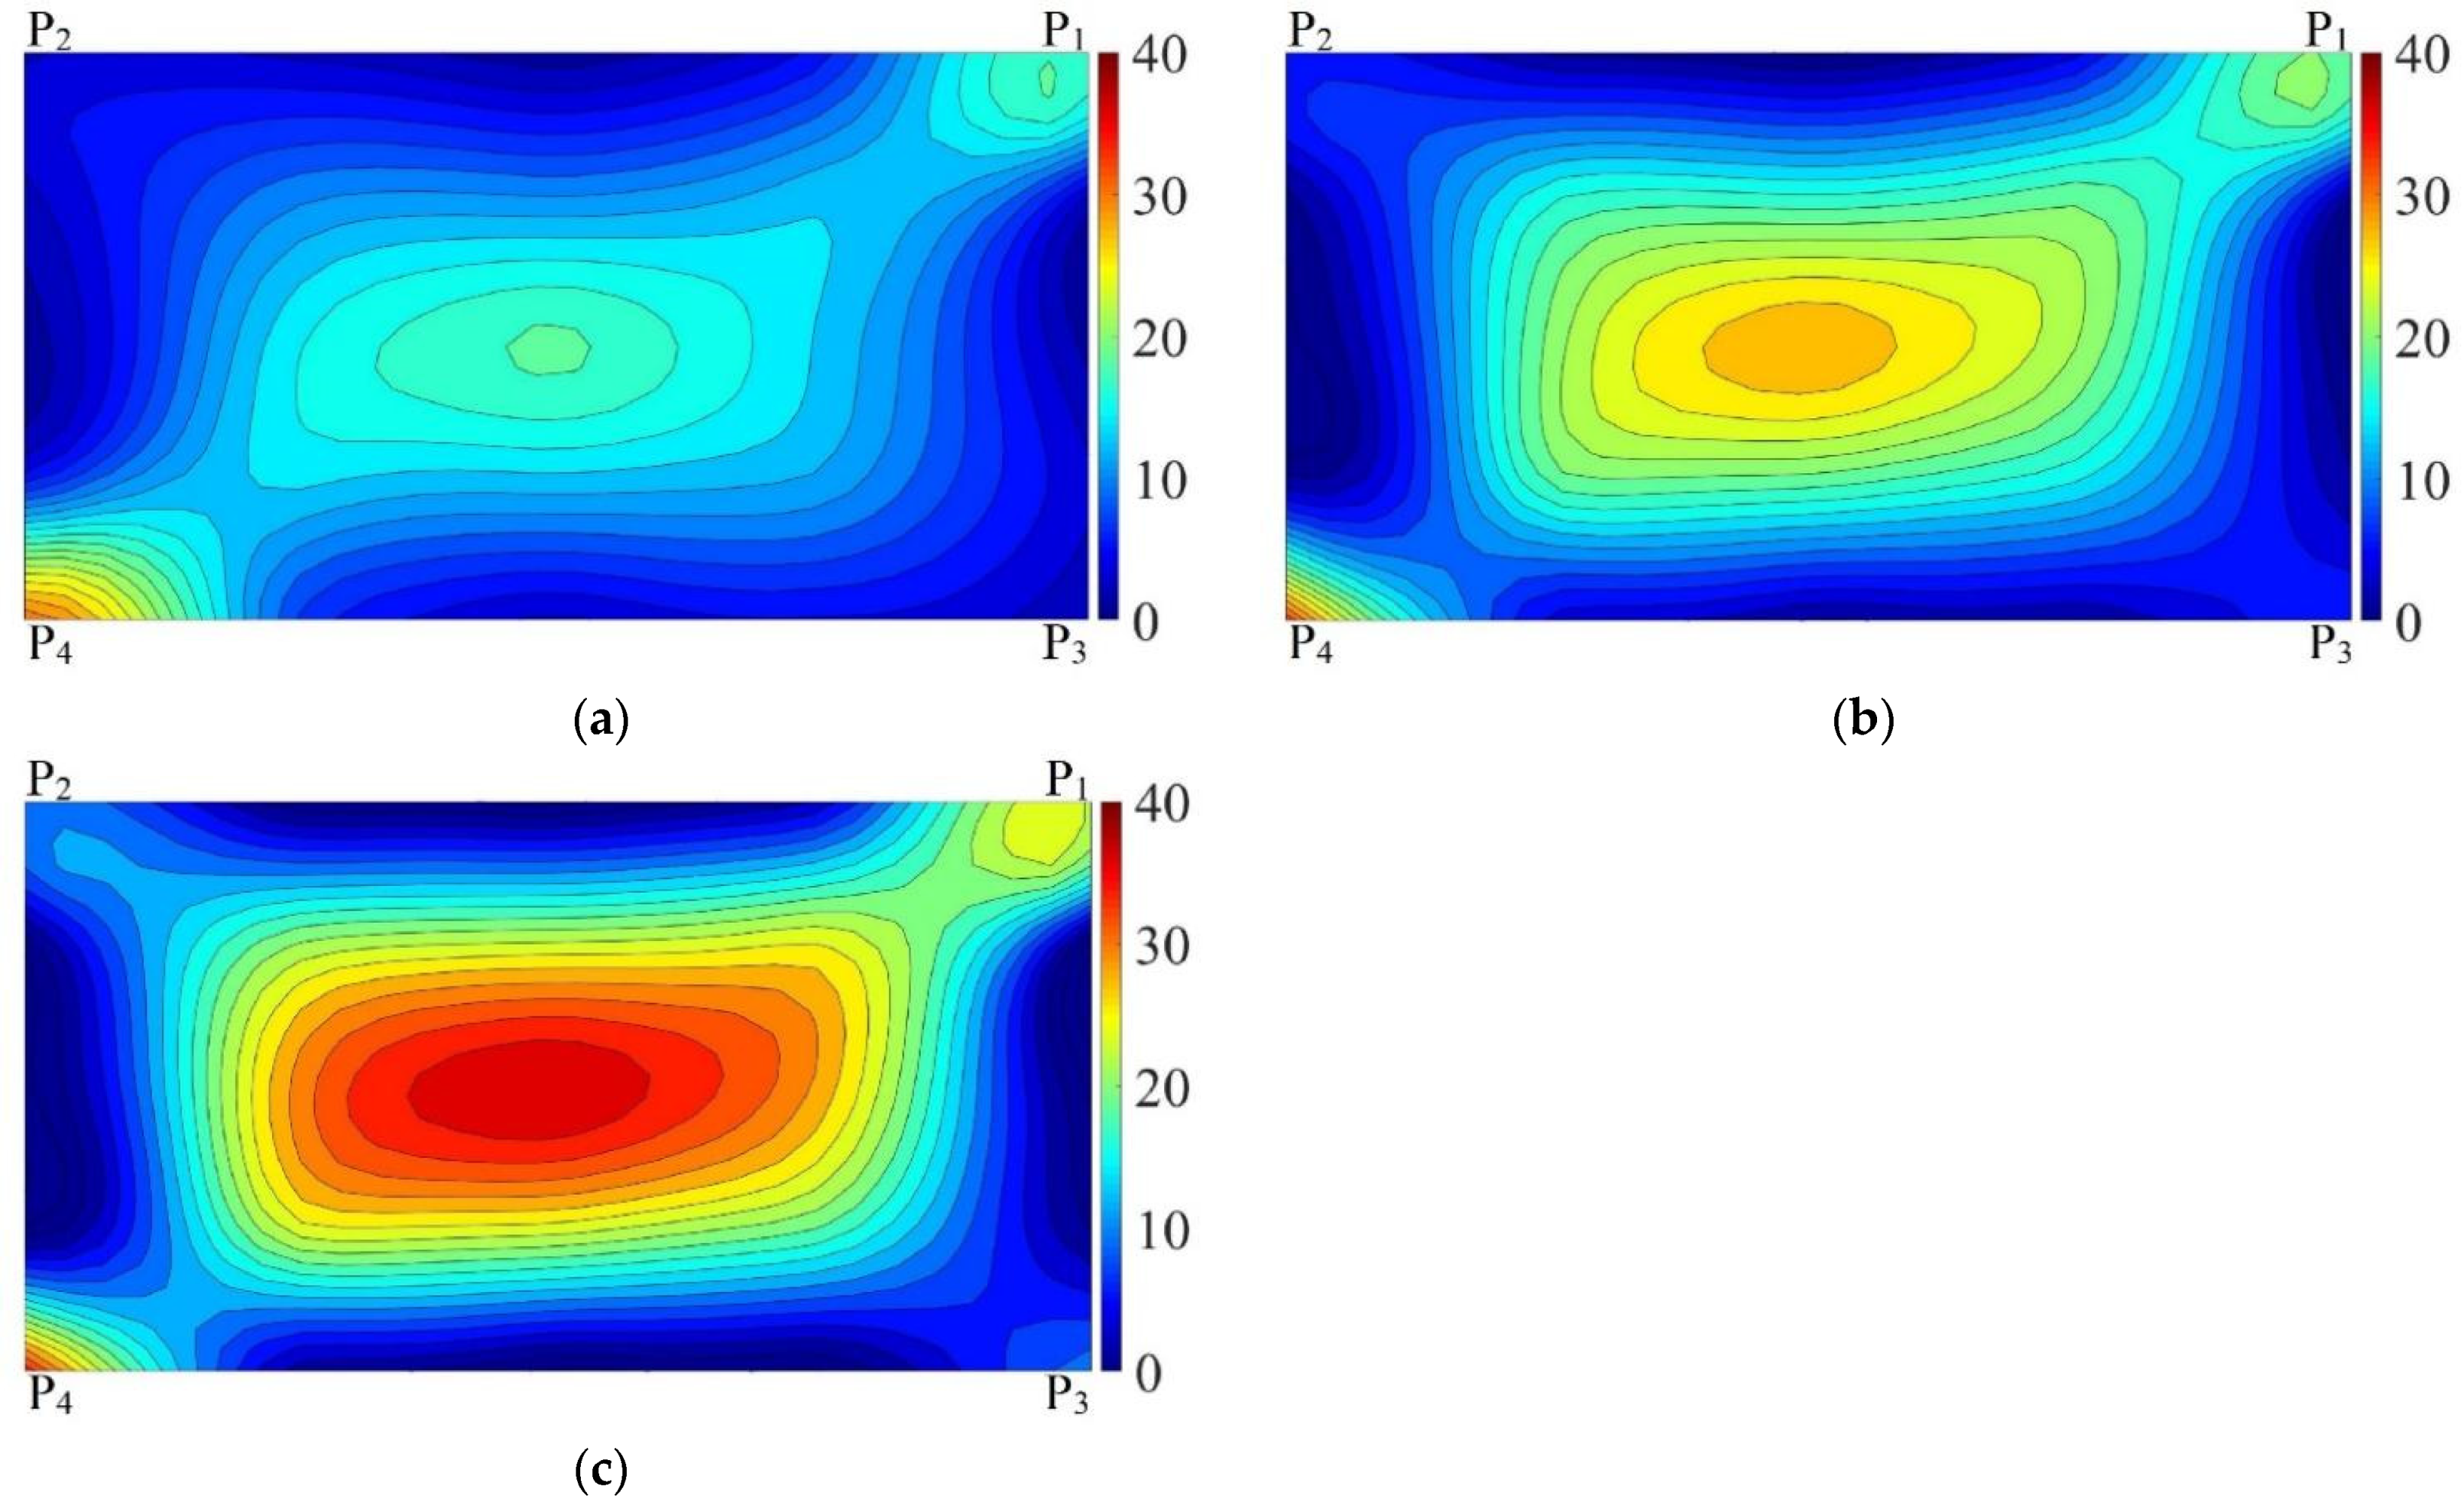
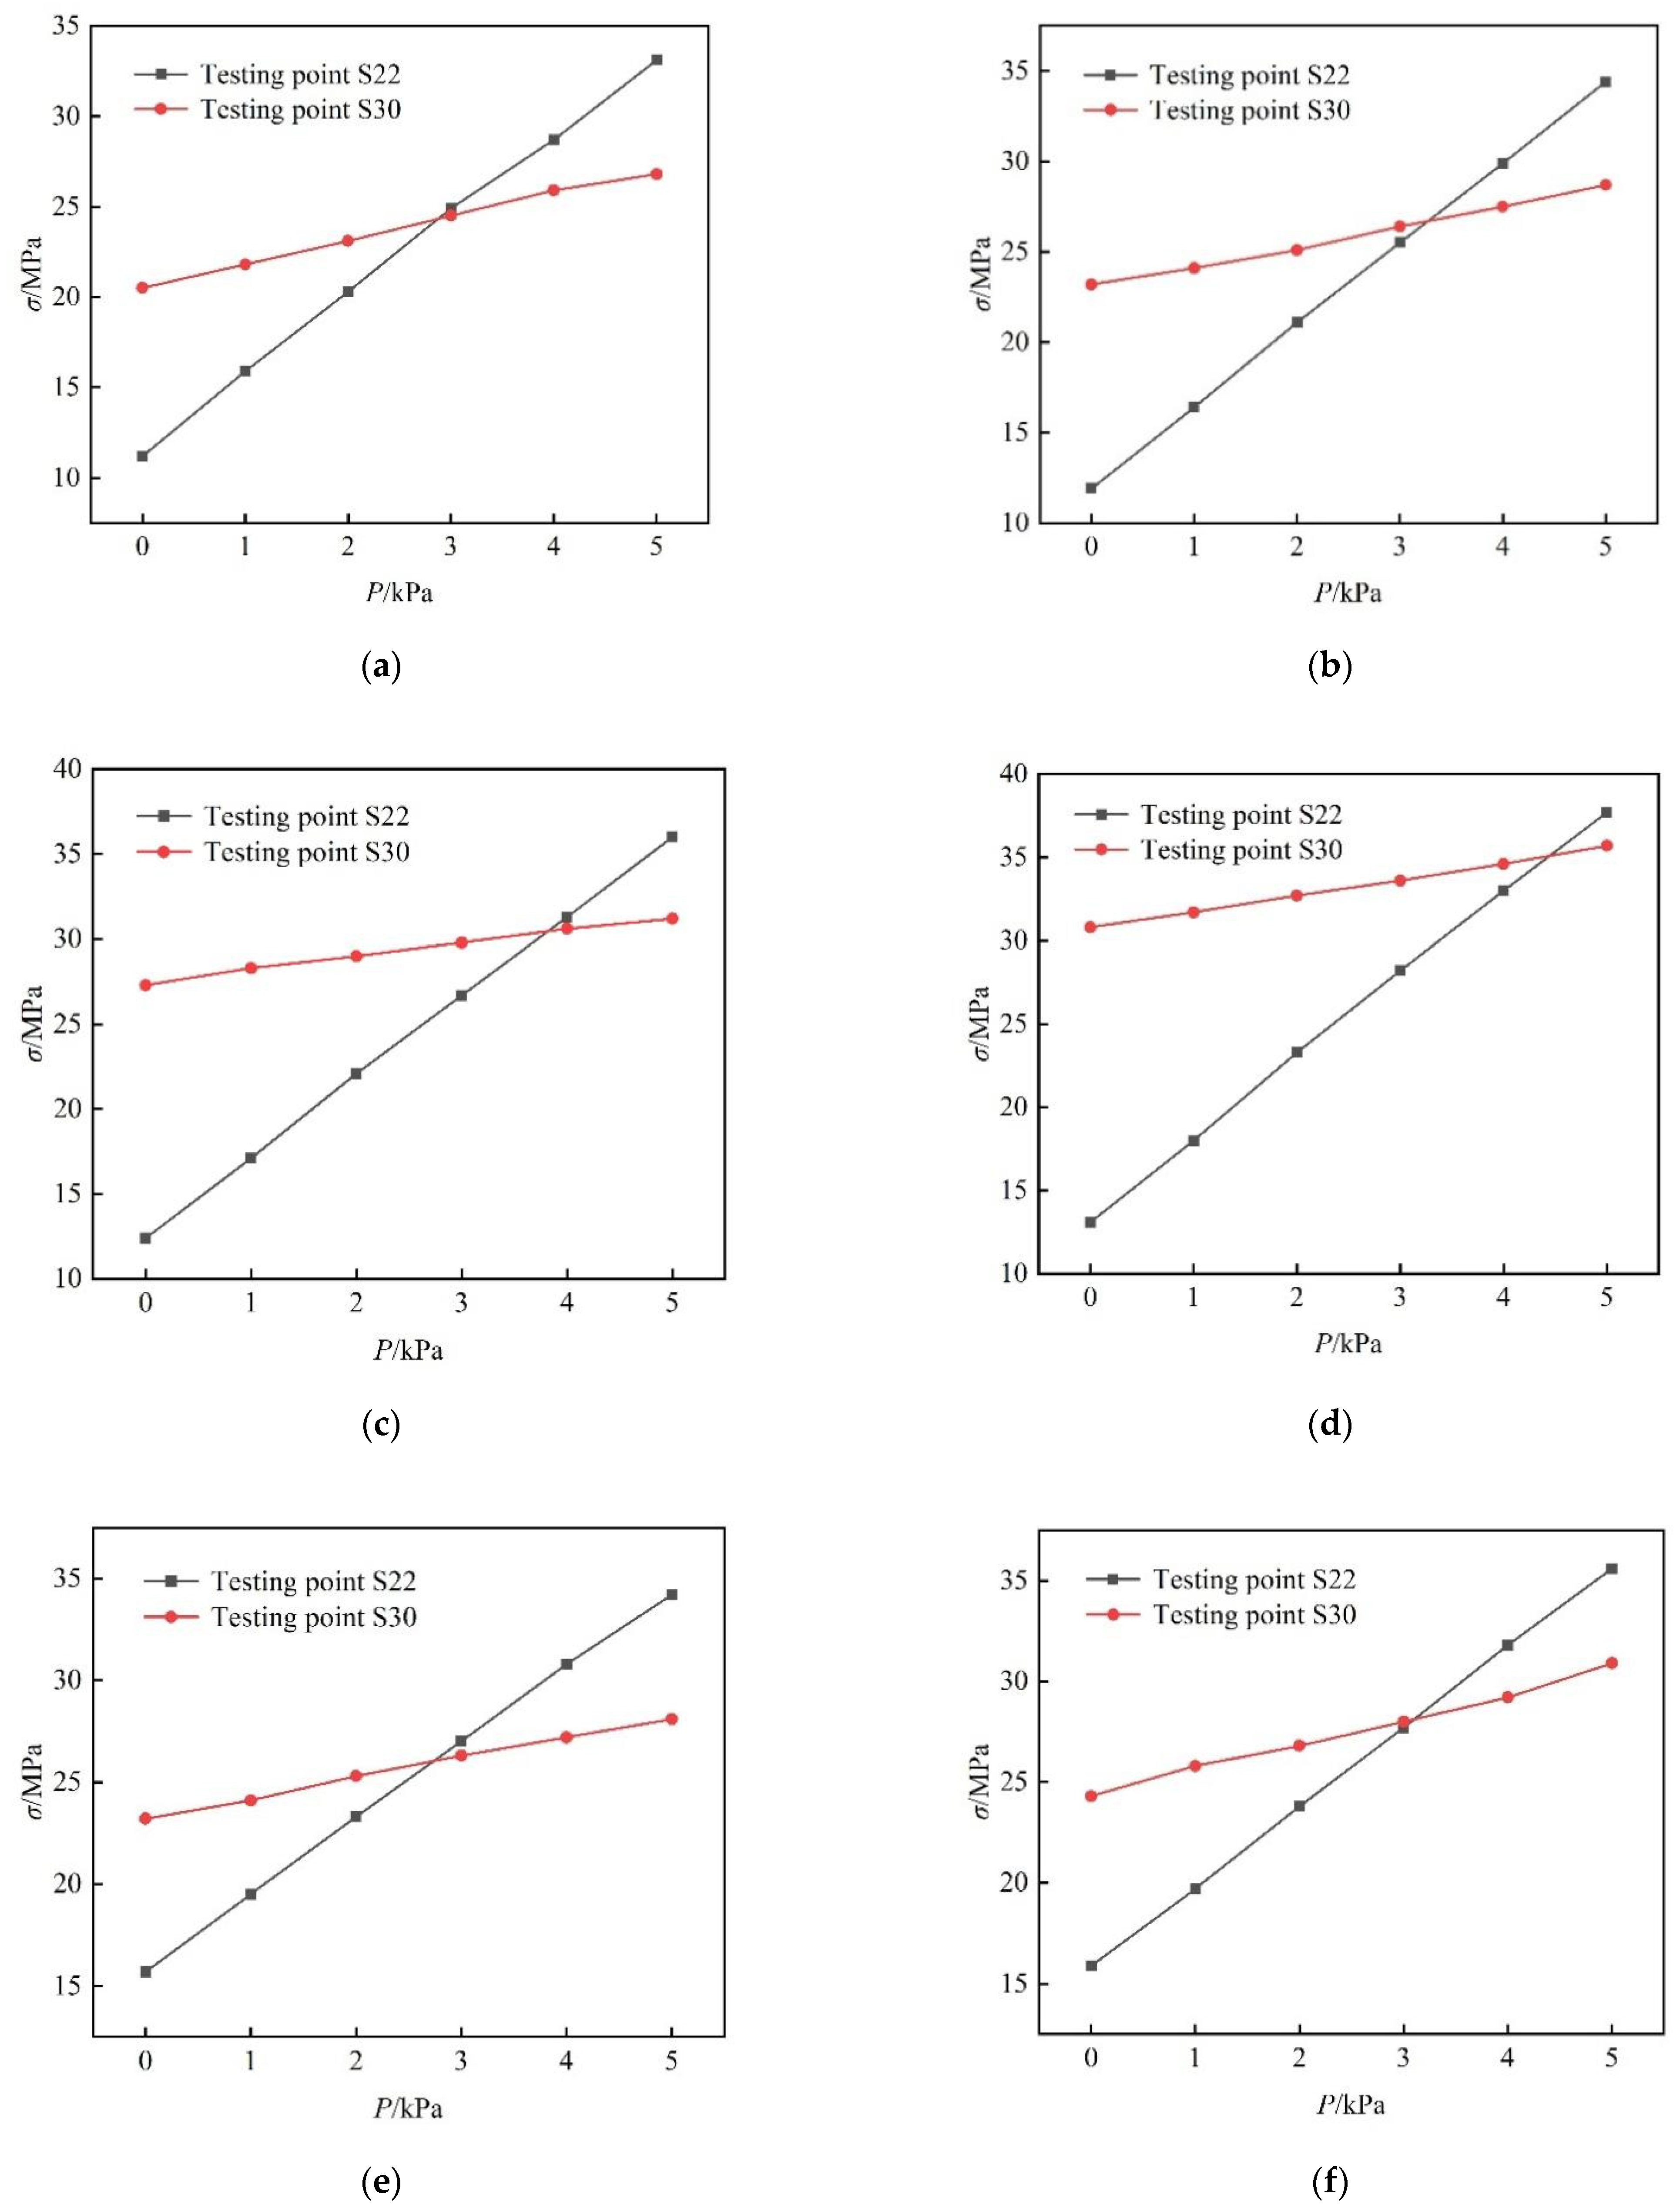
4.1. Coupling Effect of Cold Bending and Uniform Load

The coupling stress distribution produced by the coupling effect of cold bending and uniform load on cold-bent SGP laminated glass panels was significantly different to that on the flat glass. Hence, stress nephograms were used to analyze the coupling stress distribution and its changes on the cold-bent SGP laminated glass panels under a uniform load.
The coupling stress distribution and its changes on SJ4 are given as a nephogram in Figure 7, which is similar in shape compared to those obtained from other specimens (not given in this paper). It can be inferred from Figure 7 that as the uniform load rose from 1 to 5 kPa, the coupling stress distribution changed from a cold-bending stress distribution to a quadrilateral stress distribution. At a uniform load of 1 kPa, the location of maximum coupling stress was consistent with that under cold bending, and the coupling stress near the panel center was enhanced. Meanwhile, the location of maximum coupling stress gradually moved towards the panel center as the uniform load rose. The area of tensile stress in the glass panel center was magnified, but the area of compressive stress in the panel edges shrank. When the uniform load was 5 kPa, the maximum coupling stress appeared at testing point S22, and the overall shape of the coupling stress nephogram turned to a spindle; in other words, the stress along the diagonal P1–P4 was smaller at both ends and larger in the middle.
The coupling stress values at testing points S22 and S30 for each specimen during the uniform load test are listed in Table 3 and Table 4, respectively. Both tables exhibit a significant positive correlation between the coupling stress and the uniform load. The relationships between the coupling stress and uniform load at testing points S22 and S30 are depicted in more detail in Figure 8. Both points demonstrated a linear correlation between the coupling stress and the uniform load. The coupling stress at testing point S30 was greater than that at S22 when the uniform load was initially applied and the bearing capacity of the glass panel was controlled by the cold-bending curvature. However, the coupling stress at testing point S22 grew faster than S30 and even exceeded S30 at a certain uniform load. At this time point, the bearing capacity of the glass panel was controlled by the uniform load instead of the cold-bending curvature. With such a change in the control factor of bearing capacity, the corresponding uniform load increased with greater cold-bending curvature.

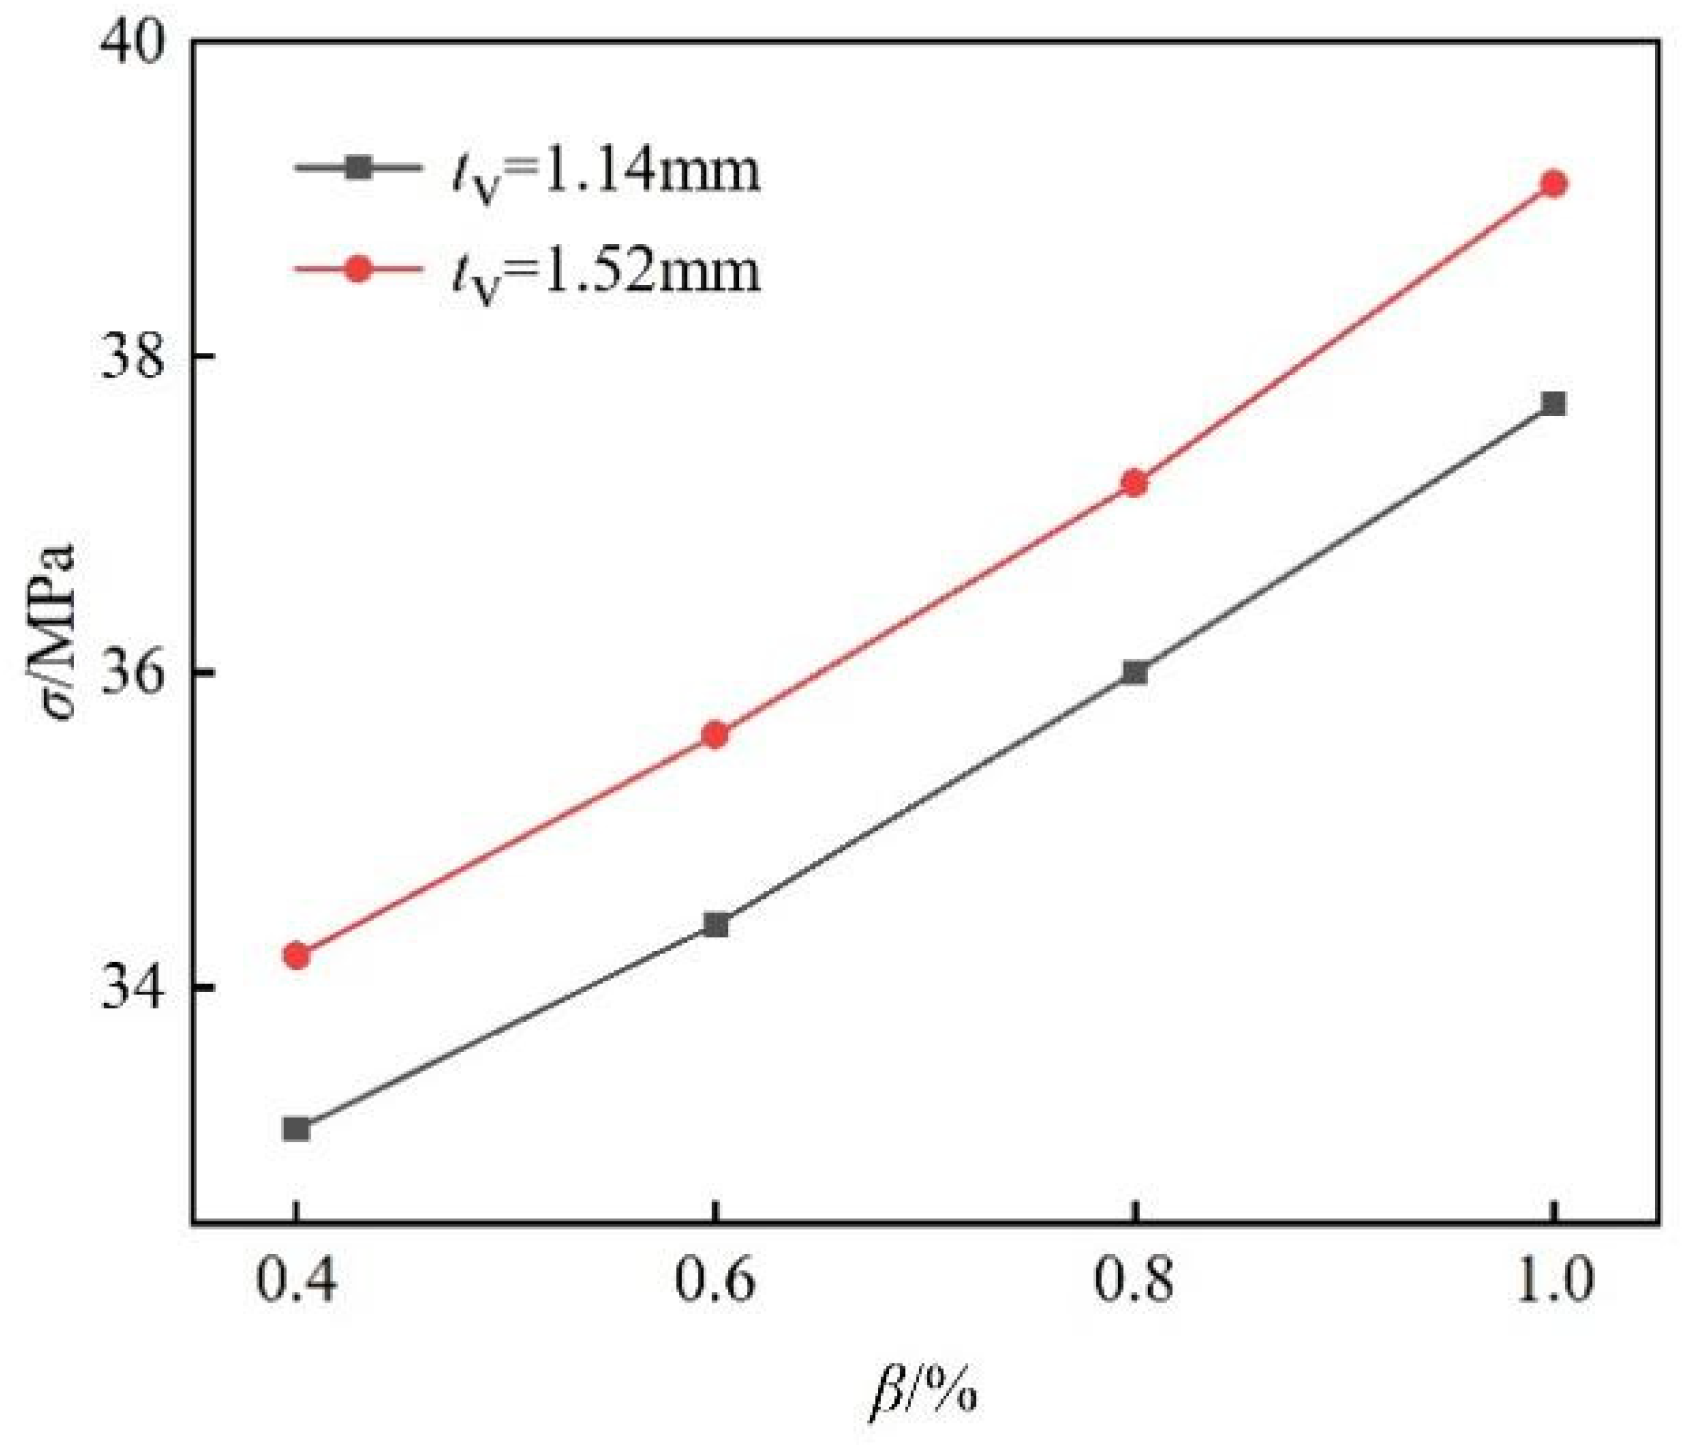
4.2. Influence of Cold-Bending Curvature on Coupling Stress

By comparing the maximum coupling stress of specimens in Table 3 with the same interlayer thickness but different cold-bending curvatures, it was found that the maximum coupling stress was positively correlated with the cold-bending curvature. This is because the cold-bending stress was the initial stress on the glass panel during the uniform load test, and a greater cold-bending curvature would lead to greater cold-bending stress and consequently greater coupling stress. More specifically, when the cold-bending curvature increased by 0.2%, the maximum coupling stress would also grow by 4.5% on average.
Based on the data in Table 3, the relationship between the coupling stress and the uniform load was plotted in Figure 9. In this regard, Figure 9a shows SJ1 to SJ4 with an interlayer thickness of 1.14 mm, and Figure 9b shows SJ5 to SJ8 with an interlayer thickness of 1.52 mm. Judging from the two figures, when the interlayer thickness was identical, the relation curves of each specimen were arranged according to the cold-bending curvature in a descending order, and the curves with larger cold-bending curvatures were located higher. Besides, the cold-bending curvature is shown to be positively correlated with the coupling stress. Thus, the bearing capacity of the glass panel clearly decreased after the reverse coupling of cold bending and uniform load. Meanwhile, the relationships between the coupling stress and uniform load across different cold-bending curvatures were not parallel. More specifically, at the initial stage of uniform load, the distances between the relation curves were small, but they grew bigger at later stages of uniform load, indicating that both the inclination angle of the relation curves and the growth rate of the coupling stress dropped as the uniform load rose, a phenomenon that is due to the geometrical nonlinearity effect of cold bending.
The relationship between the coupling stress and the cold-bending curvature at testing point S22 was drawn in Figure 10, demonstrating a non-linear but positive correlation between the two. The coupling stress increased faster under a greater cold-bending curvature, which again reflected the geometrical nonlinearity effect. The intensity of the geometrical nonlinearity effect is positively correlated to the cold-bending curvature. Hence, when calculating the bearing capacity of cold-bent SGP laminated glass panels, this effect is a crucial factor to consider.

4.3. Influence of Interlayer Thickness on Coupling Stress

When comparing the maximum coupling stress of specimens in Table 3 with the same cold-bending curvatures but different interlayer thicknesses it was found that the maximum coupling stress increased with greater interlayer thicknesses. This phenomenon occurs because greater interlayer thicknesses can enhance the cold-bending stress and the coupling stress. When the interlayer thickness increased from 1.14 mm to 1.52 mm, the maximum coupling stress of the glass panels increased by 3.46% on average. Therefore, interlayer thickness is a less relevant factor affecting the coupling stress as compared to the cold-bending curvature.
Moreover, it can be seen from Figure 10 that the two relation curves were almost parallel, and the curve with larger interlayer thickness was located above the other one with smaller interlayer thickness, suggesting that the glass panel with a large interlayer thickness has greater coupling stress. Besides, the glass is a linear elastic material, and the influence of interlayer material on the coupling stress was linear since the relationship between the coupling stress and uniform load was revealed as linear.

5. Ultimate Capacity Test Results and Discussion

5.1. Specimen Failure and Its Analysis

As can be seen from Figure 9, in the uniform load test, the load-stress curves of the glass panels showed a linear relationship even when the uniform load reached 5 kPa, indicating that the glass panels were still elastic. Consequently, the execution of the ultimate capacity test after the uniform load test became feasible, and the ultimate capacity test showed that with the ultimate load the glass panels broke suddenly without warning. The lower layer of the glass panels exhibited numerous cracks and glass particles, but these particles remained closely bonded to the interlayer, indicating that the SGP laminated glass was safer than traditional glass. Notably, the upper layer of the glass panels was in contact and undamaged.
The primary stress on the upper layer of the glass panel was compressive stress, while the primary stress on the lower layer of the glass panel was tensile stress. In addition, the glass is a brittle material [24], meaning the tensile strength was much smaller than the compressive strength, leading to breakage of the lower layer of the glass panel with the ultimate load. The SGP laminated glass is less dangerous than traditional glass. However, in daily use, the stress on the tension face of cold-bent SGP laminated glass should be controlled with utmost priority to prevent damage. Moreover, concentrated loading on cold-bent SGP laminated glass should be avoided.

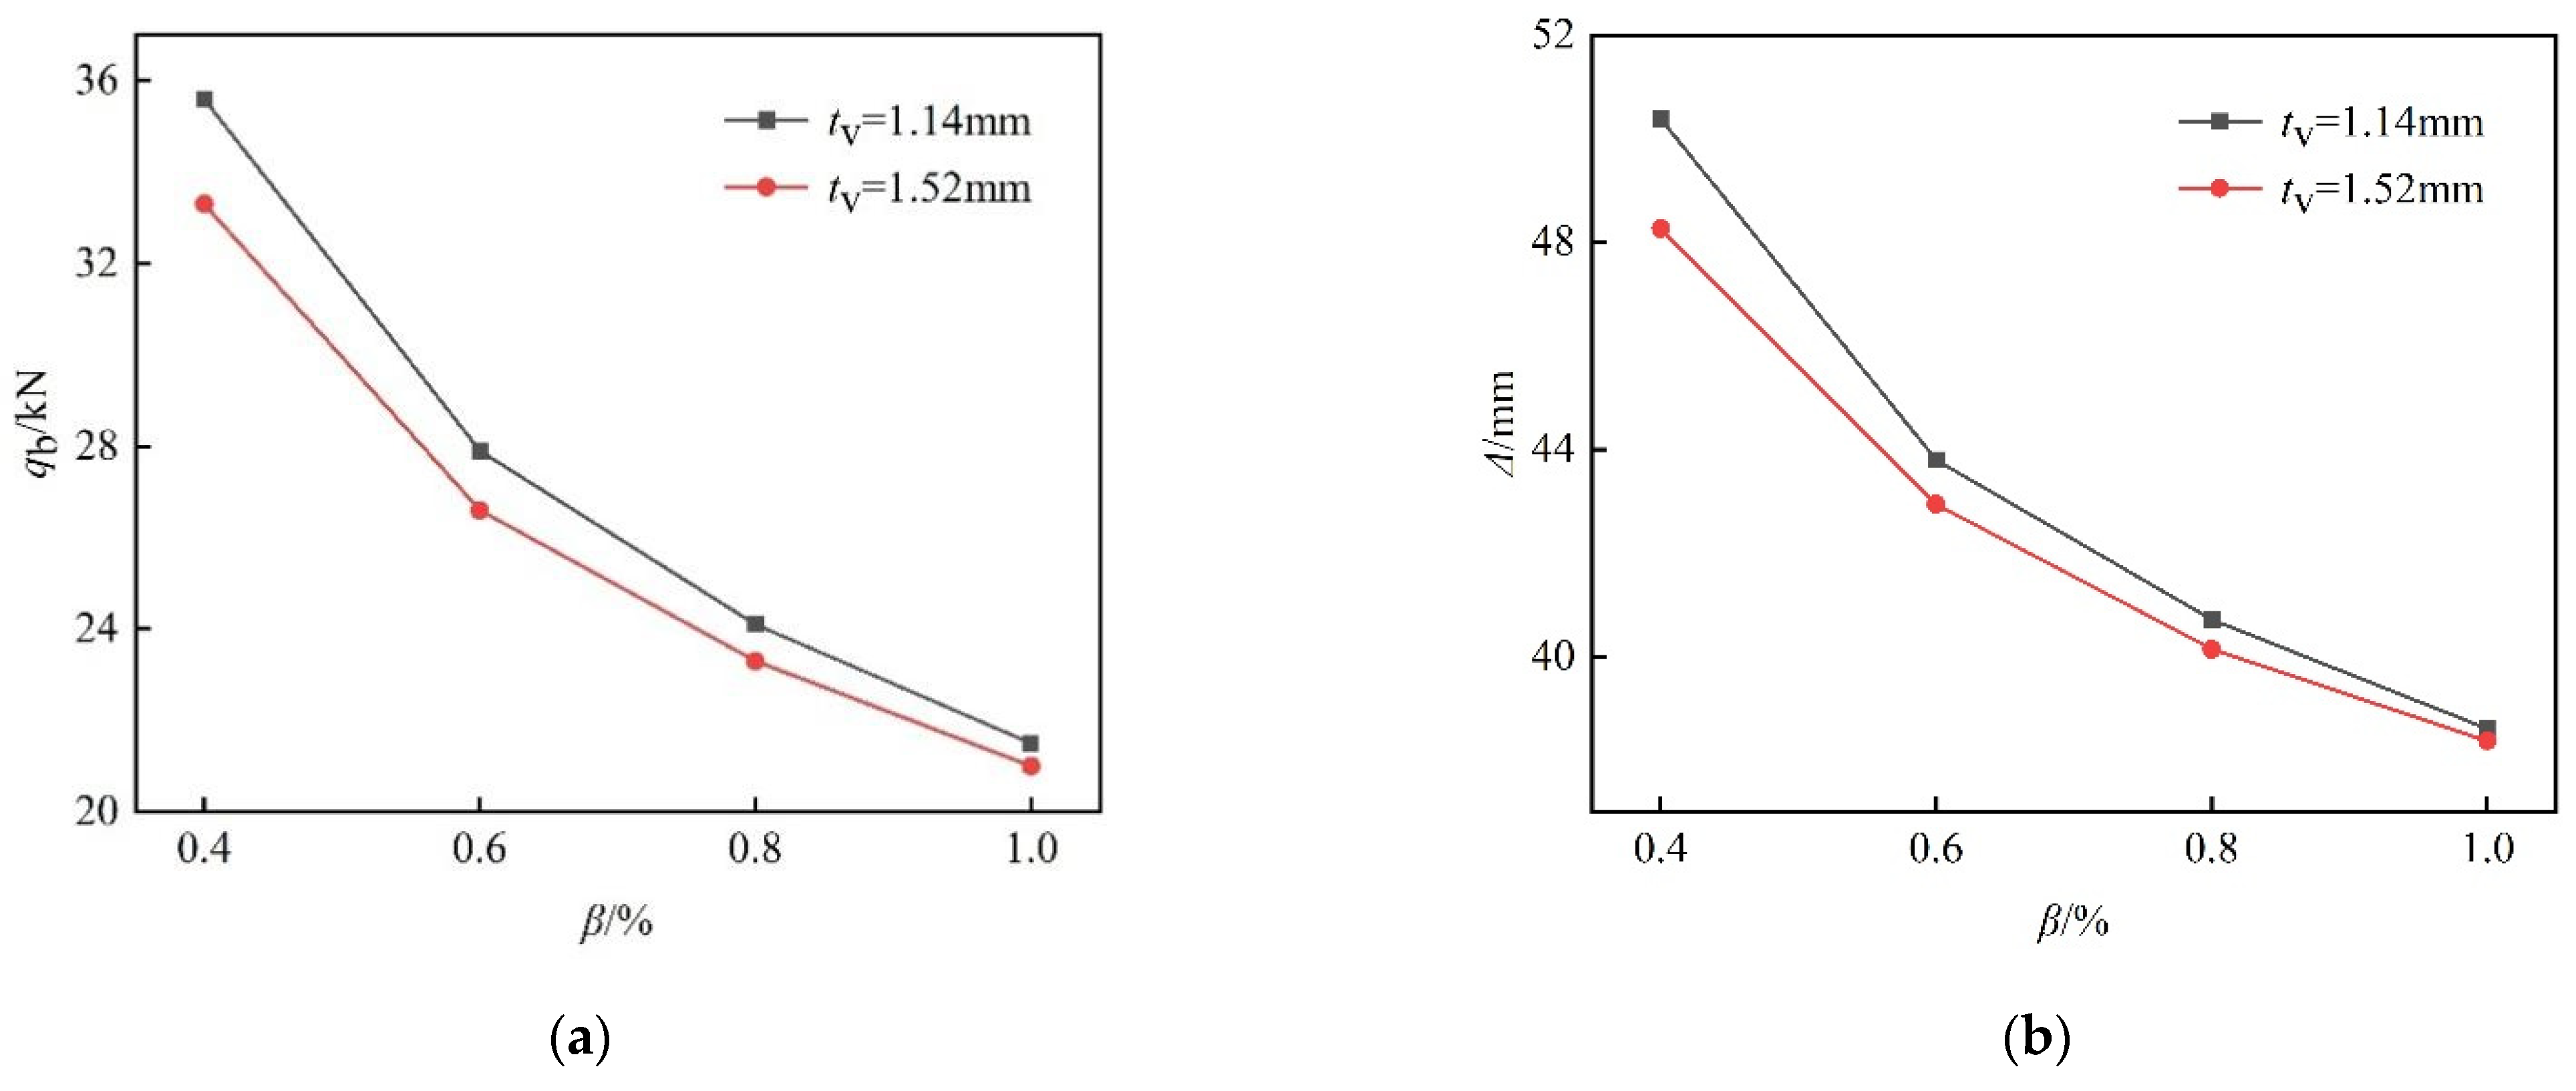
5.2. Influence of Cold-Bending Curvature on Ultimate Capacity and Ultimate Deflection

The ultimate capacity (qb) and ultimate deflection (Δ) of the specimens are demonstrated in Table 5. During the ultimate capacity test, the maximum deflection of the glass panels occurred at the panel center.
By comparing the qb and Δ of the specimens with identical interlayer thicknesses and different cold-bending curvatures, it was found that both parameters of cold-bent SGP laminated glass panels decreased with greater cold-bending curvatures. When the cold-bending curvature increased by 0.2%, qb and Δ decreased by 14.7% and 7.9% on average, respectively. Consequently, it can be concluded that the cold-bending curvature has a great influence on qb and Δ of cold-bent SGP laminated glass panels.
The data in Table 5 were plotted into the relationship curves in Figure 11, with Figure 11a depicting the relationship curves between qb and cold-bending curvature and Figure 11b showing the relationship curves between Δ and cold-bending curvature. Both figures showed a nonlinear negative correlation between the parameters they involve, and the rate of decrease became smaller as the cold-bending curvature rose.

5.3. Influence of Interlayer Thickness on Ultimate Capacity and Ultimate Deflection

By comparing qb and Δ of the specimens with identical cold-bending curvatures and different interlayer thicknesses, it was found that both parameters of cold-bent SGP laminated glass panels decreased with greater interlayer thickness. This situation occurred because the initial stress (cold-bending stress) of the glass panels was greater with the thicker interlayers, and the qb and Δ of the glass panels with thicker interlayers in the ultimate capacity tests decreased. When the interlayer thickness increased from 1.14 mm to 1.52 mm, the qb and Δ values decreased by 4.2% and 2.1% on average, respectively. Consequently, the influence of interlayer thickness on qb and Δ was much less significant than that of the cold-bending curvature.
Besides, it can be seen from Figure 11 that the two curves of different interlayer thicknesses showed very similar shapes and a relatively close mutual distance. Therefore, the interlayer thickness was demonstrated to show a slight influence on qb and Δ. Moreover, the two curves exhibited a tendency to converge as the cold-bending curvature rose. At a cold-bending curvature of 1.0%, the two curves almost overlapped, indicating that if the cold-bending curvature were to exceed 1.0%, the interlayer thickness would have a negligible influence on the qb and Δ values of the cold-bent SGP laminated glass panels.

6. Conclusions

To study the cold-bending stress and its reverse-coupling effect with the uniform load on SGP laminated glass panels, single-corner cold-bending tests, uniform load tests, and ultimate capacity tests were performed on eight SGP laminated glass panels with different cold-bending curvatures and interlayer thicknesses. The conclusions of this study are as follows:
(1)
The cold-bending stress of SGP laminated glass panels under single-corner cold-bending exhibits a saddle-shaped distribution, in which the maximum and second-greatest cold-bending stresses appear near the corner of the short side and in the long side direction adjacent to the cold-bending corner, respectively.
(2)
Since the bearing capacity of the glass panel is controlled by its maximum principal tensile stress and the bearing capacity is smaller on the edges compared to the panel center, the two adjacent corner points of the cold-bending corner should be monitored and restricted with utmost care and priority during cold bending for the cold-bending stress.
(3)
Due to the geometrical nonlinearity effect caused by cold bending, the cold-bending stress and coupling stress increase nonlinearly with the rise in cold-bending curvature. Meanwhile, both the cold-bending stress and coupling stress are positively correlated to the interlayer thickness. Besides, cold-bending curvature has a more significant impact on the cold-bending stress and coupling stress than the interlayer thickness.
(4)
As the uniform load increases gradually, the coupling stress distribution changes from a profile similar to the cold-bending stress distribution to another of four edges, which is simply supported under a uniform load.
(5)
After the reverse coupling of cold bending and uniform load, the bearing capacity of the SGP laminated glass panels clearly dropped under the influence of the geometrical nonlinearity effect caused by the cold bending. When the coupling stress at the corner of the short-side direction adjacent to the cold-bending corner is greater than (or less than) that of the panel center, the bearing capacity of the glass panel will be controlled by the cold-bending curvature (or uniform load).
(6)
The ultimate capacity and ultimate deflection of the cold-bent SGP laminated glass panel decrease with greater cold-bending curvature and interlayer thickness. When the cold-bending curvature exceeds 1.0%, the effect of interlayer thickness on the ultimate capacity and ultimate deflection can be ignored.

Author Contributions

Methodology, X.Z.; software, C.Z. and X.Y.; validation, X.Z., X.Y. and C.Z.; resources, X.Z.; data curation, X.Z.; writing—original draft preparation, C.Z. and X.Z.; writing—review and editing, X.Z.; project administration, X.Z. All authors have read and agreed to the published version of the manuscript.

Funding

This research was funded by the Natural Science Foundation of Guangxi Province (Grant No. 2018GXNSFAA138204).

Institutional Review Board Statement

Not applicable.

Informed Consent Statement

Not applicable.

Data Availability Statement

The data are contained within the article.

Conflicts of Interest

The authors declare no conflict of interest.

References

  1. Zhou, W.B.; Shao, Z.T.; Yu, J.Q.; Lin, J.G. Advances and Trends in Forming Curved Extrusion Profiles. Materials 2021, 14, 1603. [Google Scholar] [CrossRef]
  2. Zhou, W.B.; Shi, Z.S.; Lin, J.G. Upper bound analysis of differential velocity sideways extrusion process for curved profiles using a fan-shaped flow line model. Int. J. Lightweight Mater. Manuf. 2018, 1, 21–32. [Google Scholar] [CrossRef]
  3. Datsiou, K. Design and Performance of Cold Bent Glass. Ph.D. Thesis, University of Cambridge, Cambridge, UK, 2017. [Google Scholar]
  4. Neugebauer, J. Applications for curved glass in buildings. J. Facade Des. Eng. 2014, 2, 67–83. [Google Scholar] [CrossRef] [Green Version]
  5. Fildhuth, T. Design and Monitoring of Cold Bent Lamination-Stabilised Glass: Investigated by Applying Fibre Optic Sensors. Ph.D. Thesis, University of Stuttgart, Stuttgart, Germany, 2015. [Google Scholar]
  6. Galuppi, L.; Massimiani, S.; Royer-Carfagni, G. Large Deformations and Snap-Through Instability of Cold-Bent Glass; Challenging Glass 4: London, UK, 2014. [Google Scholar] [CrossRef]
  7. Feijen, M.; Vrouwe, I.; Thun, P. Cold-Bent Single Curved Glass; Opportunities and Challenges in Freeform Facades; Challenging Glass 3: Amsterdam, The Netherlands, 2012. [Google Scholar] [CrossRef]
  8. Galuppi, L.; Massimiani, S.; Royer-Carfagni, G. Buckling phenomena in double curved cold-bent glass. Int. J. Non-Linear. Mech. 2014, 64, 70–84. [Google Scholar] [CrossRef]
  9. Galuppi, L.; Royer-Carfagni, G. Rheology of cold-lamination-bending for curved glazing. Eng. Struct. 2014, 61, 140–152. [Google Scholar] [CrossRef]
  10. Galuppi, L.; Royer-Carfagni, G. Optimal cold bending of laminated glass. Int. J. Solids Struct. 2015, 67, 231–243. [Google Scholar] [CrossRef]
  11. Galuppi, L.; Royer-Carfagni, G. Cold-lamination-bending of glass: Sinusoidal is better than circular. Compos. B Eng. 2015, 79, 285–300. [Google Scholar] [CrossRef]
  12. Spagnoli, A.; Brighenti, R.; Biancospino, M.; Rossi, M.; Roncella, R. Geometrically non-linear bending of plates: Implications in curved building façades. Constr. Build. Mater. 2019, 214, 698–708. [Google Scholar] [CrossRef]
  13. Belis, J.; Inghelbrecht, B.; Van Impe, R.; Callewaert, D. Cold bending of laminated glass panels. Heron 2007, 52, 123–146. [Google Scholar]
  14. Belis, J.; Inghelbrecht, B.; Van Impe, R.; Callewaert, D. Experimental Assessment of Cold-Bent Glass Panels; Glass Performance Days: Tampere, Finland, 2007. [Google Scholar]
  15. Fildhuth, T.; Knippers, J.; Bindji-Odzili, F.; Baldassini, N.; Pennetier, S. Recovery Behaviour of Laminated Cold Bent Glass -Numerical Analysis and Testing; Challenging Glass 4: London, UK, 2014. [Google Scholar]
  16. Quaglini, V.; Cattaneo, S.; Pettorruso, C.; Biolzi, L. Cold bending of vertical glass plates: Wind loads and geometrical instabilities. Eng. Struct. 2020, 220, 110983. [Google Scholar] [CrossRef]
  17. Nehring, G.; Siebert, G. Design Concept for Cold Bent Shell Structures Made of Thin Glass; Engineered Transparency: Berlin, Germany, 2018. [Google Scholar] [CrossRef]
  18. Schlösser, N. Thin Glass as Cold Bent Laminated Panels in Architectural Applications. Master’s Thesis, Delft University of Technology, Delft, The Netherlands, 2018. [Google Scholar]
  19. Huang, X.M.; Sun, J.; Li, J.F. Effect of Initial Residual Stress and Machining-Induced Residual Stress on the Deformation of Aluminium Alloy Plate. Chin. J. Mech. Eng. (Engl. Ed.) 2015, 61, 131–137. [Google Scholar] [CrossRef]
  20. Zhang, X.D.; Liang, J.Z.; Huang, D. Study on the mechanical response of anticlastic cold bending insulating glass and its coupling effect with uniform load. PLoS ONE 2021, 16, e0250463. [Google Scholar] [CrossRef]
  21. Biolzi, L.; Cagnacci, E.; Orlando, M.; Piscitelli, L.; Rosati, G. Long term response of glass-PVB double-lap joints. Compos. B Eng. 2014, 63, 41–49. [Google Scholar] [CrossRef]
  22. Galuppi, L.; Royer-Carfagni, G. Analytical approach à la Newmark for curved laminated glass. Compos. B Eng. 2015, 76, 65–78. [Google Scholar] [CrossRef]
  23. Belis, J.; Depauw, J.; Callewaert, D.; Van Impe, R. Failure mechanisms and residual capacity of annealed glass/SGP laminated beams at room temperature. Eng. Fail. Anal. 2009, 16, 1866–1875. [Google Scholar] [CrossRef] [Green Version]
  24. Sehgal, J.; Ito, S. Brittleness of glass. J. Non-Cryst. Solids 1999, 253, 126–132. [Google Scholar] [CrossRef]
Figure 1. Schematic diagram of cold bending and uniform load.
Applsci 11 10073 g001
Figure 2. Test device. The symbols in the figure are as follows: (1) Reaction frame, (2) Fixed steel plates, (3) Glass, (4) Support frame, (5) Square steel pipe, (6) Screw, (7) Fixed buckle.
Applsci 11 10073 g002
Figure 3. Real diagram during the tests. (a) Cold-bending tests; (b) Uniform load tests; (c) Ultimate capacity tests.
Applsci 11 10073 g003aApplsci 11 10073 g003b
Figure 4. Arrangement of the testing points. (a) Strain rosettes on the upper surface; (b) Strain rosettes on the lower surface; (c) Displacement testing points.
Applsci 11 10073 g004aApplsci 11 10073 g004b
Figure 5. Cold-bending stress nephograms on the lower surface (MPa). (a) SJ1; (b) SJ2; (c) SJ3; (d) SJ4; (e) SJ5; (f) SJ6; (g) SJ7; (h) SJ8.
Applsci 11 10073 g005aApplsci 11 10073 g005b
Figure 6. The cold-bending stress versus cold-bending curvature curves. (a) Testing point S14; (b) Testing point S22; (c) Testing point S30.
Applsci 11 10073 g006
Figure 7. Coupling stress nephograms of SJ4 in the uniform load tests (MPa). (a) Uniform load is 1 kPa; (b) Uniform load is 3 kPa; (c) Uniform load is 5 kPa.
Applsci 11 10073 g007
Figure 8. Coupling stress versus uniform load curves. (a) SJ1; (b) SJ2; (c) SJ3; (d) SJ4; (e) SJ5; (f) SJ6; (g) SJ7; (h) SJ8.
Applsci 11 10073 g008aApplsci 11 10073 g008b
Figure 9. Relationship between coupling stress and uniform load. (a) SJ1 to SJ4; (b) SJ5 to SJ8.
Applsci 11 10073 g009
Figure 10. Maximum coupling stress versus cold-bending curvature curves.
Applsci 11 10073 g010
Figure 11. The effect of cold-bending curvature. (a) Ultimate capacity curves; (b) Ultimate deflection curves.
Applsci 11 10073 g011
Table 1. Test parameters.
Specimenstv/mmβ/%s/mm
SJ11.140.4%20
SJ21.140.6%30
SJ31.140.8%40
SJ41.141.0%50
SJ51.520.4%20
SJ61.520.6%30
SJ71.520.8%40
SJ81.521.0%50
Table 2. Cold-bending stress results (MPa).
SpecimensTesting Point S14Testing Point S22Testing Point S30
SJ111.063.8615.80
SJ217.515.9524.32
SJ322.427.6531.58
SJ426.049.0537.17
SJ513.764.4319.31
SJ620.917.3329.15
SJ726.659.4537.28
SJ831.2311.2843.63
Table 3. The coupling stress of testing point S22 (MPa).
SpecimensUniform Load
0 kPa1 kPa2 kPa3 kPa4 kPa5 kPa
SJ111.215.920.324.928.733.1
SJ211.916.421.125.529.934.4
SJ312.417.122.126.731.336.0
SJ413.118.023.328.233.037.7
SJ515.619.523.327.030.834.2
SJ615.919.723.827.731.835.6
SJ716.220.124.528.633.037.2
SJ816.620.625.429.834.539.1
Table 4. The coupling stress of testing point S30 (MPa).
SpecimensUniform Load
0 kPa1 kPa2 kPa3 kPa4 kPa5 kPa
SJ120.521.823.124.525.926.8
SJ223.224.125.126.427.528.7
SJ327.328.329.029.830.631.2
SJ430.831.732.733.634.635.7
SJ523.224.125.326.327.228.1
SJ624.325.826.828.029.230.9
SJ726.327.729.530.832.233.6
SJ830.731.833.335.136.537.9
Table 5. The results of ultimate capacity and ultimate deflection.
Specimensqb/kNΔ/mm
SJ135.650.38
SJ227.943.79
SJ324.140.71
SJ421.538.61
SJ533.348.26
SJ626.642.94
SJ723.340.14
SJ821.038.37
Publisher’s Note: MDPI stays neutral with regard to jurisdictional claims in published maps and institutional affiliations.

