Abstract
During mechanical stimulation-induced bone remodeling, interstitial fluid around microcracks may produce a flow field with gradient fluid shear stress (FSS). Osteoclast precursors can sense this gradient FSS and migrate toward the low FSS region. However, the local distribution of wall FSS on bone cells under a flow field with globally gradient FSS remains unknown. In this study, finite element models of a modified plate flow chamber with cells were constructed. The effect of oscillatory flow with different FSS levels and cell spacings or frequencies on the distribution of local wall FSS around cells was simulated by using a fluid–solid coupling method. Results showed that the polarization of wall FSS distribution in a cell decreased with the increase in cell spacing. At a low FSS level, the frequency of oscillatory flow had a minimal effect on the wall FSS distribution. At a high FSS level, the increase in flow frequency enhanced the fluctuation of local wall FSS distribution on cells. These results provide a basis for future research on the flow-induced migration of osteoclast precursors and clarify the mechanism of mechanical stimulation-induced bone resorption.
1. Introduction
Mechanical stimulation such as matrix strain or interstitial fluid flow within a porous bone is an important factor affecting bone adaption. Removal of mechanical stimulation reduces the production of bone matrix protein, mineral content, and bone formation. Compared with matrix strain, interstitial fluid plays a key role in the mechanotransduction of bone cells [1]. Deformations on bone mineral matrix caused by mechanical loading can drive the interstitial fluid to flow within cavities, thereby inducing fluid shear stress (FSS) on the bone surface and adherent bone osteoblasts and osteoclasts [2,3,4]. The FSS can reach up to 5 Pa on osteocyte membranes and processes [3,5,6]. The existence of a flow field with gradient FSS around microdamaged bones has been previously reported [7].
Owing to the difficulty of observing the fluid flow within bone cavities in vivo [8,9], some in vitro loading devices, including the widely used parallel-plate flow chamber, have been constructed to induce fluid flow on cells [10,11,12]. We previously designed a modified plate flow chamber, in which the top cover is not parallel to the bottom plate and can provide a globally gradient FSS field on the bottom plate [7]. With this modified flow chamber, we found that osteoclast precursors RAW264.7 have a unique ability of sensing the gradient FSS field and migrating toward the low FSS region rather than along the flow direction. We assumed that this globally gradient FSS field may lead to the polarized distribution of local wall FSS on cell surface and then activate the mechanosensitive cation channels (MSCC), such as transient receptor potential channels or Piezo channels. The induced polarization distribution of intracellular calcium concentration may regulate the orientation of cell migration by mediating adhesion molecules [7,13,14,15,16].
Owing to the diversity of daily human activities, the fluid flow on bone cells can be a combination of various forms, e.g., unidirectional or oscillating [17]. The frequency of oscillatory flow is usually related to the cyclic movement of the musculoskeletal system, such as walking and running. Calcium oscillation in bone cells occurs due to oscillatory fluid flow [18]. Whether oscillatory flow influences the polarity distribution of local wall FSS on the cell surface remains unclear.
In this study, a finite element (FE) model of modified flow chamber with adherent cells was constructed to investigate the effect of cell spacing and the frequency and magnitude of oscillatory flow on the polarization distribution of local wall FSS on the cell surface.
2. Materials and Methods
2.1. Finite Element Model of Modified Plate Flow Chamber
The FE model of a modified plate flow chamber was built (Figure 1A) to produce the gradient FSS field under unidirectional flow [7]. In this modified plate flow chamber, the top cover was not parallel to the bottom plate (Figure 1B,C). In addition, the hexagonal closely-packed cells were placed on the bottom plate surface. The size of the FE model coincides with that of the flow chamber adopted in the experiments (Table 1). A cuboid with refined meshing and containing the cell group was added to ensure the computation accuracy around cells (Figure 1D–F).
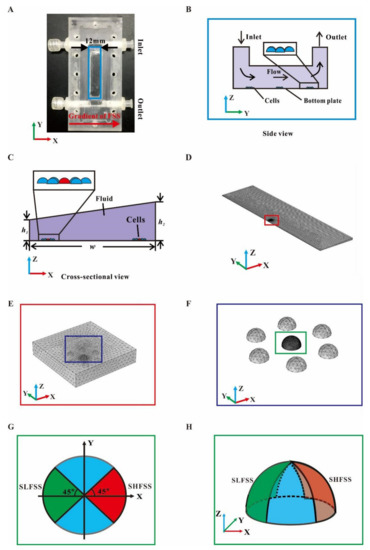
Figure 1.
Establishment of gradient parallel-plate flow chamber and FE model. (A) Photo of custom-made gradient flow chamber; the back arrow represents the direction of the FSS gradient. Schematics of gradient flow chamber in top view (B) and cross-sectional view (C). A cell group arranged as hexagonal closely-packed mode in the enlarged box. (D) FE mesh of the fluid field indicated by the blue box in (A). (E) FE mesh around a cell indicated by the red box in (D). (F) FE mesh of the cell group indicated by the blue box in (E). (G) Dorsal surface of a central cell divided into four sectors, including the sectors with high global FSS (SHFSS) and low global FSS (SLFSS) and the side view in (H).

Table 1.
Dimension of flow chamber and cell.
2.2. Material Property of Cells
The hyper-elastic isotropic Hookean model was adopted for the cells, and the strain energy density was proposed as follows [19]:
Here, the material constants are defined by:
where E denotes the elastic modulus, G is the shear modulus, μ is the Poisson’s ratio, and Λ is the Lamé constant. Table 2 presents the values of parameters used in this study.

Table 2.
Material properties of cells used for finite element (FE) model.
2.3. Numerical Simulation
COMSOL Multiphysics software was used to simulate fluid–structure coupling. Fluid flow was simulated using a laminar flow with low Reynolds number, and a no-slip boundary condition was assumed for all rigid surfaces in this model. Navier–Stokes equations were used to define the flow behavior of viscous fluid. The incompressible flow of a Newtonian fluid was assumed with constant density (ρ) of 1 × 10³ kg/m3 and viscosity of 1 × 10⁻³ Pa∙s. For a steady flow and the hyper-elastic model of cells, the equations were solved using an iterative method. Convergence was identified when the relative tolerance was less than 0.001. Three frequencies, i.e., 0.25, 1, and 4 Hz, were selected to mimic the walking, jogging, and running of humans, respectively. The inlet and outlet pressures of flow chamber were alternately between 0 and 300 Pa and formed a FSS field ranging from 0.1 Pa to 2.0 Pa with a gradient of 0.2 Pa/mm, which is similar to the in vivo FSS level of the lacunar–canalicular system within bone (Figure 2A–C) [2,21].
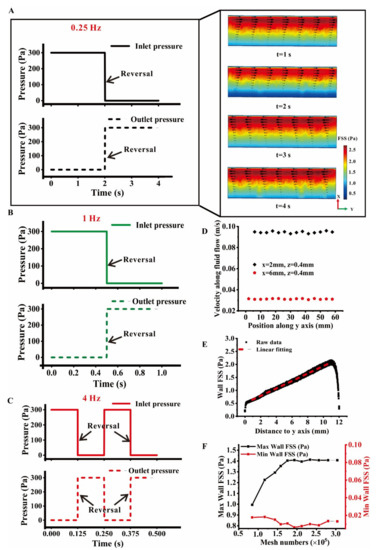
Figure 2.
Global wall FSS on the bottom plate in the modified plate flow chamber under the oscillatory flow with different frequencies. (A) Inlet and outlet pressures in an oscillatory flow cycle with a frequency of 0.25 Hz. The streamline and FSS distribution are shown in the enlarged graph. (B) Inlet and outlet pressures in an oscillatory flow cycle with a frequency of 1 Hz. (C) Inlet and outlet pressure in two oscillatory flow cycles with a frequency of 4 Hz. (D) Fluid velocity at the locations with the same height of 0.4 mm and two different x positions. (E) Wall FSS distribution along the y axis, in which the values of all nodes at different FSS gradients are shown and linearly fitted by the dotted line. (F) Mesh sensitivity test; the maximum or minimum value of wall FSS on the bottom plate for the total mesh number of this FE model is presented. The coordinate origin is at the down-right corner of the plate flow chamber in Figure 2A, and z = 0 is the bottom plate.
2.4. Data Analysis
A group of cells placed on the bottom plate were arranged in a hexagonal closely-packed mode (Figure 1C and Figure 3A). The wall FSS on the dorsal surface of the central cell in each group was divided into four sectors. The sector with the high global FSS (SHFSS) and the opposite one with the low global FSS (SLFSS) in the direction of gradient FSS were selected to reveal the distribution of local wall FSS on the cell surface (Figure 1G,H). The average relative value (ARV) of local wall FSS in SHFSS relative to that in SLFSS at three y locations with the same x location were calculated, i.e., ARV = (average FSS in SHFSS − average FSS in SLFSS)/average FSS in SHFSS. A positive ARV indicates the higher number of activated mechanosensitive ion channels in the SHFSS region than in the SLFSS region. This phenomenon may further lead to the polarized distribution of intracellular calcium ions and the migration toward low FSS region. By contrast, a negative ARV reveals that the cells may move along the gradient direction of global FSS. An ARV close to zero suggests that the cells tend to migrate along the flow direction.
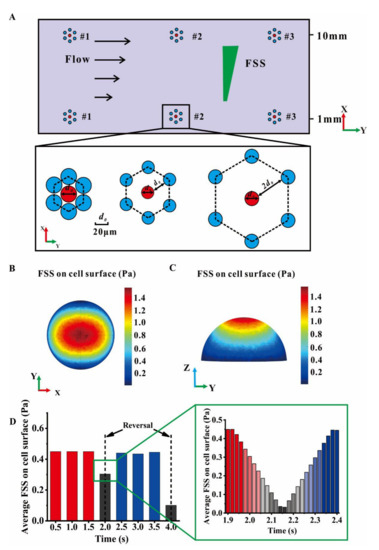
Figure 3.
Arrangement of cells on the bottom plate and the average local wall FSS on the surface of a central cell. (A) A cell group arranged in a hexagonal closely-packed mode was plated on the bottom plate in a modified plate flow chamber at low or high FSS level of x = 1, 10 mm and y = 10, 20, 30 mm. Each group includes three cell spacings, 2, 20, or 40 μm. (B) Top and (C) side views of local wall FSS on the cell surface. (D) Average local wall FSS on cell surface in an oscillatory cycle with the frequency 0.25 Hz; the changes of average local wall FSS during pressure reversal are shown in the enlarged box.
3. Results
3.1. Novel Plate Flow Chamber Provided an Oscillatory Flow Field with Gradient FSS
The inlet and outlet pressures were reversed every 2, 0.5, and 0.125 s to form an oscillatory flow with different frequencies of 0.25, 1, and 4 Hz, respectively (Figure 2A–C). The fluid velocity at the same height (z = 0.4 mm) along flow direction y (x = 2 mm or 6 mm) in the flow chamber was steady (Figure 2D). The linear fitting of wall FSS on the bottom plate revealed a linear distribution with the gradient 0.2 Pa/mm (Figure 2E). When reversing the boundary pressure, the direction of fluid flow in the chamber was also turned over, during which the wall FSS exhibited a gradient distribution along the x direction. A mesh sensitivity test on the wall FSS showed that the minimum mesh number of the central cell was 175,000 (Figure 2F).
3.2. Wall FSS on Cells Was Influenced by Pressure Reversal
The wall FSS on the central cell surface increased along the z direction (Figure 3A–C). The average wall FSS on the central cell surface was approximately 0.45 Pa in the steady stage of oscillatory flow (Figure 3D). However, this value decreased at the stage of pressure reversal, i.e., t = 2 s and t = 4 s. When a timestep of 0.02 s was selected, the average wall FSS on the cell surface first decreased to zero and then increased to 0.45 Pa. This fluctuation of local wall FSS on a cell during pressure reversal can be attributed to the fluid–solid coupling interaction between the cell and the surrounding fluid.
3.3. ARV on Cells Was Mediated by Cell Spacing, FSS Level, and Oscillatory Frequency
One cell group was placed at the positions of y = 30 mm (#1), 20 mm (#2), 10 mm (#3) at a low FSS level of 0.1 Pa (x = 1 mm) (Figure 3A). A fluid–structure coupling interaction based on FEM was performed to obtain the ARV on the central cell. For all the three positions with low FSS level, the average ARV was positive and relatively stable over time under 0.25 Hz oscillatory flow (Figure 4A). However, with the increase in oscillatory flow frequency, the ARV fluctuation became increasingly sharp during pressure reversal (Figure 4B,C). When the cells in a hexagonally packed group approached each other, the ARV on the central cell surface also increased. At a high oscillatory frequency of 1 or 4 Hz, this increase in ARV was not evident when the cell spacing was 20 or 40 μm. However, the fluctuation range became wide. At a high FSS level 2.0 Pa (x = 10 mm), the average ARV of wall FSS at three positions fluctuated with different amplitudes (Figure 4D–F). The fluctuation during pressure reversal intensified with the increase in oscillatory flow frequency from 0.25 Hz to 4 Hz. When the cells approached each other, the ARV increased similarly to that at a low FSS level. For 4 Hz oscillatory flow, one additional cycle of oscillatory flow was added to comprehensively analyze the effect of oscillatory flow on ARV.
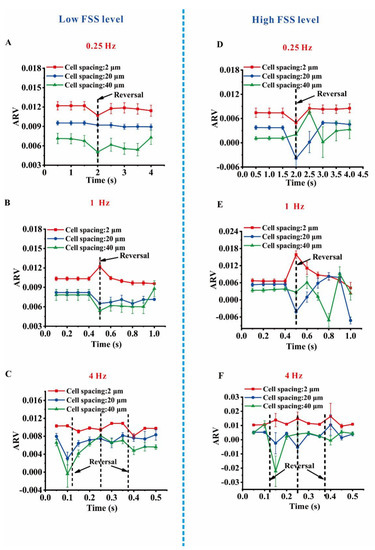
Figure 4.
Effects of cell spacing and oscillatory frequencies on average relative value (ARV) at two FSS levels. (A) and (B) ARV with different cell spacings in one oscillatory cycle with oscillatory frequencies of 0.25 and 1 Hz, respectively, for a low FSS level. (C) ARV with different cell spacings in two oscillatory cycles with oscillatory frequency of 4 Hz for a low FSS level. (D) and (E) ARV with different cell spacings in one oscillatory cycle with oscillatory frequencies of 0.25 and 1 Hz, respectively, for a high FSS level. (F) ARV with different cell spacings in two oscillatory cycles with oscillatory frequency of 4 Hz at a high FSS level.
4. Discussion
In a gradient FSS field under unidirectional flow, RAW264.7 osteoclast precursors do not move along the direction of fluid flow but instead migrate toward the low FSS region [7]. This striking phenomenon may be related to the polarized distribution of local wall FSS on the cell surface that may further activate the calcium ion channels on the cell membrane and finally regulate the cell migration (Figure 5). This study mainly aimed to investigate the effects of oscillatory flow frequency, cell spacing, and global FSS level on the ARV of local wall FSS on the cell surface through fluid–solid coupled FE simulation.
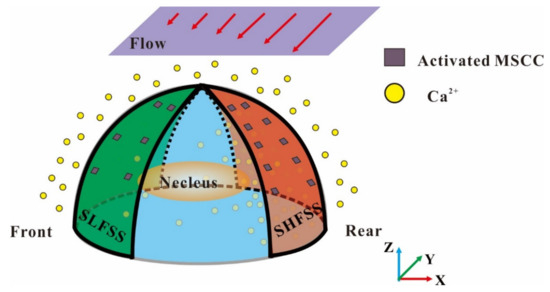
Figure 5.
Schematic of the mechanism of gradient FSS-induced directional migration of osteoclast precursors. The global gradient FSS first induces the polarization distribution of local wall FSS on cell surface, then activates the mechanosensitive ion channels in the cell membrane and produces the polarized distribution of cytosolic calcium concentration, and finally leads to the directional migration of osteoclast precursors toward the low FSS region.
RAW264.7 osteoclast precursors migrate toward the low FSS region at a low FSS level of 0.1 Pa, but move along the flow direction at a high FSS level 2.0 Pa under a gradient FSS of 0.2 Pa/mm in unidirectional flow [7]. Therefore, the gradient of oscillatory flow adopted in this study was 0.2 Pa/mm, and the two FSS levels were 0.1 and 2.0 Pa. Three frequencies of oscillatory flow including 0.25, 1, and 4 Hz were chosen to mimic the different movement modes of the human body. With the increase in oscillatory frequency, the fluctuating amplitude of ARV on the central cell surface also increased, during which, a zero or negative ARV indicates a reduction in the directional migration of RAW264.7 osteoclast precursors toward the low FSS [23,24,25]. At a high FSS level, the fluctuation of ARV intensified. These results indicate that a high level of FSS or a large oscillatory frequency may reduce the directional migration of RAW264.7 osteoclast precursors.
Reynolds number and Womersley number are the two physical parameters necessary to characterize an incompressible oscillating fluid flow [26]. The Reynolds number in the present work was 0.5, indicating that the viscous forces are predominant, i.e., the fluid flow is laminar. The Womersley number (α) is the ratio between the oscillating flow frequency with respect to viscous effects, i.e., (where δ, ω and ν are the channel half height, the angular frequency defined as , and the kinematic viscosity of the fluid) [27]. Therefore, when substituting the parameters of the modified plate flow chamber in this study into the above expression, we obtained α = 1.0, 2.0 and 4.0 for 0.25, 1 and 4 Hz loading frequencies. In these cases, viscous forces tend to dominate the flow [26]. Therefore, laminar fluid flow was adopted in the fluid–solid coupling simulation in this study.
The effect of different cell spacings on the ARV of wall FSS on the central cell surface was also investigated to identify whether the separation distance of osteoclasts is relevant to their migration under fluid flow. The results showed that the ARV on the central cell surface is inversely proportional to the cell spacing; that is, ARV increases when the cell spacing is small. Most of the ARV values are positive, and their fluctuation becomes relatively weak when the cells approach each other. A positive ARV reveals the polarized distribution of local wall FSS that may finally induce the directional migration of RAW264.7 osteoclast precursors to the low FSS region. These results indicate that the crowded osteoclast precursors have a higher tendency to migrate than the separate ones under the fluid flow with gradient FSS.
A positive or negative ARV reveals the polarization distribution of local wall FSS on the cell surface and may be used to explain the orientation of cell migration. Cytosolic calcium concentration is mediated by fluid flow via mechanosensitive ion channels, such as transient receptor potential channels or Piezo channels [28,29]. In addition, the polarization distribution of intracellular calcium ions regulates the orientation of cell migration by mediating adhesion molecules [15,16,30]. However, whether the calcium ion channels in different locations of cell membrane are activated by gradient FSS on the cell surface remains unknown and should be clarified in the future.
In conclusion, the fluid–solid coupling FE simulation showed that a small cell spacing, a low frequency, or a low FSS level of oscillatory flow may promote the directional migration of RAW264.7 osteoclast precursors toward the low FSS region. This study provides a theoretical basis for future research on the flow-induced migration of osteoclast precursors, and finally clarifies the mechanism of mechanical stimulation-induced bone resorption.
Author Contributions
Conceptualization and methodology, X.Z. and B.H.; writing—original draft preparation, X.Z.; validation, X.Z., Y.G. and B.H.; writing—review and editing, Y.G. All authors have read and agreed to the published version of the manuscript.
Funding
This research was funded by the National Natural Science Foundation of China [12072034].
Institutional Review Board Statement
Not applicable.
Informed Consent Statement
Not applicable.
Data Availability Statement
Data underlying the results presented in this paper are not publicly available at this time but may be obtained from the authors upon reasonable request.
Conflicts of Interest
The authors declare no conflict of interest.
References
- You, J.; Yellowley, C.E.; Donahue, H.J.; Zhang, Y.; Chen, Q.; Jacobs, C.R. Substrate deformation levels associated with routine physical activity are less stimulatory to bone cells relative to loading-induced oscillatory fluid flow. J. Biomech. Eng. 2000, 122, 387–393. [Google Scholar] [CrossRef]
- Thompson, W.R.; Rubin, C.T.; Rubin, J. Mechanical regulation of signaling pathways in bone. Gene 2012, 503, 179–193. [Google Scholar] [CrossRef]
- Weinbaum, S.; Cowin, S.C.; Zeng, Y. A model for the excitation of osteocytes by mechanical loading-induced bone fluid shear stresses. J. Biomech. 1994, 27, 339–360. [Google Scholar] [CrossRef]
- McGarry, J.G.; Klein-Nulend, J.; Mullender, M.G.; Prendergast, P.J. A comparison of strain and fluid shear stress in stimulating bone cell responses—A computational and experimental study. FASEB J. 2005, 19, 482–484. [Google Scholar] [CrossRef] [PubMed]
- Price, C.; Li, W.; Novotny, J.E.; Wang, L. An in-situ fluorescence-based optical extensometry system for imaging mechanically loaded bone. J. Orthop. Res. 2010, 28, 805–811. [Google Scholar] [CrossRef]
- Riddle, R.C.; Donahue, H.J. From streaming-potentials to shear stress: 25 years of bone cell mechanotransduction. J. Orthop. Res. 2009, 27, 143–149. [Google Scholar] [CrossRef]
- Gao, Y.; Li, T.Y.; Sun, Q.; Huo, B. Gradient fluid shear stress regulates migration of osteoclast precursors. Cell Adhes. Migr. 2019, 13, 183–191. [Google Scholar] [CrossRef]
- Price, C.; Zhou, X.; Li, W.; Wang, L. Real-time measurement of solute transport within the lacunar-canalicular system of mechanically loaded bone: Direct evidence for load-induced fluid flow. J. Bone Miner. Res. 2011, 26, 277–285. [Google Scholar] [CrossRef]
- Wang, L.Y.; Wang, Y.L.; Han, Y.F.; Henderson, S.C.; Majeska, R.J.; Weinbaum, S. In situ measurement of solute transport in the bone lacunar-canalicular system. Proc. Natl. Acad. Sci. USA 2005, 102, 11911–11916. [Google Scholar] [CrossRef] [PubMed]
- Dardik, A.; Chen, L.; Frattini, J.; Asada, H.; Aziz, F.; Kudo, F.A.; Sumpio, B.E. Differential effects of orbital and laminar shear stress on endothelial cells. J. Vasc. Surg. 2005, 41, 869–880. [Google Scholar] [CrossRef]
- Depaola, N.; Davies, P.F.; William, F.; Pritchard, J.; Lucio, F.; Nadeene, H.; Denise, C.P. Spatial and temporal regulation of gap junction connexin43 in vascular endothelial cells exposed to controlled disturbed flows in vitro. Proc. Natl. Acad. Sci. USA 1999, 96, 3154–3159. [Google Scholar] [CrossRef]
- Lu, Y.; Li, W.-Q.; Oraifige, I.; Wang, W. Converging Parallel Plate Flow Chambers for Studies on the Effect of the Spatial Gradient of Wall Shear Stress on Endothelial Cells. J. Biosci. Med. 2014, 2, 50–56. [Google Scholar] [CrossRef]
- Gao, Y.; Li, T.Y.; Sun, Q.; Ye, C.Y.; Guo, M.M.; Chen, Z.B.; Chen, J.; Huo, B. Migration and differentiation of osteoclast precursors under gradient fluid shear stress. Biomech. Model. Mechanobiol. 2019, 18, 1731–1744. [Google Scholar] [CrossRef] [PubMed]
- Li, P.; Bian, X.; Liu, C.; Wang, S.; Guo, M.; Tao, Y.; Huo, B. STIM1 and TRPV4 regulate fluid flow-induced calcium oscillation at early and late stages of osteoclast differentiation. Cell Calcium. 2018, 71, 45–52. [Google Scholar] [CrossRef]
- Li, P.; Man, H.; Sun, S.J.; Zhang, Y.; Gao, Y.X.; Long, M.; Huo, B.; Zhang, D. Fluid flow-induced calcium response in early or late differentiated osteoclasts. Ann. Biomed. Eng. 2012, 40, 1874–1883. [Google Scholar] [CrossRef] [PubMed]
- Liu, C.L.; Li, S.N.; Ji, B.H.; Huo, B. Flow-Induced Migration of Osteoclasts and Regulations of Calcium Signaling Pathways. Cell. Mol. Bioeng. 2014, 8, 213–223. [Google Scholar] [CrossRef]
- Lu, X.L.; Huo, B.; Park, M.; Guo, X.E. Calcium response in osteocytic networks under steady and oscillatory fluid flow. Bone 2012, 51, 466–473. [Google Scholar] [CrossRef]
- Wang, S.; Li, S.; Hu, M.; Huo, B. Calcium response in bone cells at different osteogenic stages under unidirectional or oscillatory flow. Biomicrofluidics 2019, 13, 064117. [Google Scholar] [CrossRef] [PubMed]
- Attard, M.M. Finite strain––Isotropic hyperelasticity. Int. J. Solids Struct. 2003, 40, 4353–4378. [Google Scholar] [CrossRef]
- Grover, W.H.; Bryan, A.K.; Diez-Silva, M.; Suresh, S.; Higgins, J.M.; Manalis, S.R. Measuring single-cell density. Proc. Natl. Acad. Sci. USA 2011, 108, 10992–10996. [Google Scholar] [CrossRef]
- McGarry, J.G.; Prendergast, P.J. A three-dimensional finite element model of an adherent eukaryotic cell. Eur. Cells Mater. 2004, 7, 27–34. [Google Scholar] [CrossRef]
- Xue, F.; Lennon, A.B.; McKayed, K.K.; Campbell, V.A.; Prendergast, P.J. Effect of membrane stiffness and cytoskeletal element density on mechanical stimuli within cells: An analysis of the consequences of ageing in cells. Comput. Methods Biomech. Biomed. Eng. 2015, 18, 468–476. [Google Scholar] [CrossRef]
- Boudot, C.; Saidak, Z.; Boulanouar, A.K.; Petit, L.; Gouilleux, F.; Massy, Z.; Brazier, M.; Mentaverri, R.; Kamel, S. Implication of the calcium sensing receptor and the Phosphoinositide 3-kinase/Akt pathway in the extracellular calcium-mediated migration of RAW 264.7 osteoclast precursor cells. Bone 2010, 46, 1416–1423. [Google Scholar] [CrossRef] [PubMed]
- Ishii, M.; Kikuta, J.; Shimazu, Y.; Meier-Schellersheim, M.; Germain, R.N. Chemorepulsion by blood S1P regulates osteoclast precursor mobilization and bone remodeling in vivo. J. Exp. Med. 2010, 207, 2793–2798. [Google Scholar] [CrossRef]
- Li, P.; Liu, C.L.; Huo, B. Fluid flow-induced calcium response in osteoclasts: Signaling pathways. Ann. Biomed. Eng. 2014, 42, 1250–1260. [Google Scholar] [CrossRef] [PubMed][Green Version]
- Tasdidaa, S. Development of Physical Model of the Coronary Artery Circulation. APCBEE Procedia 2012, 4, 188–195. [Google Scholar]
- Avari, H.; Rogers, K.A.; Savory, E. Wall Shear Stress Determination in a Small-Scale Parallel Plate Flow Chamber Using Laser Doppler Velocimetry Under Laminar, Pulsatile and Low-Reynolds Number Turbulent Flows. J. Fluids Eng. 2018, 140, 061404. [Google Scholar] [CrossRef]
- Norman, T.L.; Wang, Z. Microdamage of humancortical bone: Incidence and morphology in long bones. Bone 1997, 20, 375–379. [Google Scholar] [CrossRef]
- Schaffler, M.B.; Choi, K.; Milgrom, C. Aging and matrix microdamage accumulation in human compact bone. Bone 1995, 17, 521–525. [Google Scholar] [CrossRef]
- Martin, R.B. Targeted bone remodeling involves BMU steering as well as activation. Bone 2007, 40, 1574–1580. [Google Scholar] [CrossRef] [PubMed]
Publisher’s Note: MDPI stays neutral with regard to jurisdictional claims in published maps and institutional affiliations. |
© 2021 by the authors. Licensee MDPI, Basel, Switzerland. This article is an open access article distributed under the terms and conditions of the Creative Commons Attribution (CC BY) license (https://creativecommons.org/licenses/by/4.0/).