Article

Earthquake Damage Assessment in Three Spatial Scale Using Naive Bayes, SVM, and Deep Learning Algorithms

by
Sajjad Ahadzadeh
* and
Mohammad Reza Malek
GIS Decpartment, Faculty of Geodesy & Geomatics Engineering, K.N. Toosi University of Technology, Tehran 19967-15433, Iran
*
Author to whom correspondence should be addressed.
Appl. Sci. 2021, 11(20), 9737; https://doi.org/10.3390/app11209737
Submission received: 8 August 2021 / Revised: 18 September 2021 / Accepted: 30 September 2021 / Published: 19 October 2021

Abstract

:
Earthquakes lead to enormous harm to life and assets. The ability to quickly assess damage across a vast area is crucial for effective disaster response. In recent years, social networks have demonstrated a lot of capability for improving situational awareness and identifying impacted areas. In this regard, this study proposed an approach that applied social media data for the earthquake damage assessment at the county, city, and 10 × 10 km grids scale using Naive Bayes, support vector machine (SVM), and deep learning classification algorithms. In this study, classification was evaluated using accuracy, precision, recall, and F-score metrics. Then, for understanding the message propagation behavior in the study area, temporal analysis based on classified messages was performed. In addition, variability of spatial topic concentration in three classification algorithms after the earthquake was examined using location quotation (LQ). A damage map based on the results of the classification of the three algorithms into three scales was created. For validation, confusion matrix metrics, Spearman’s rho, Pearson correlation, and Kendall’s tau were used. In this study, binary classification and multi-class classification have been done. Binary classification was used to classify messages into two classes of damage and non-damage so that their results could finally be used to estimate the earthquake damage. Multi-class classification was used to categorize messages to increase post-crisis situational awareness. In the binary classification, the SVM algorithm performed better in all the indices, gaining 71.22% accuracy, 81.22 F-measure, 79.08% accuracy, 85.62% precision, and 0.634 Kappa. In the multi-class classification, the SVM algorithm performed better in all the indices, gaining 90.25% accuracy, 88.58% F-measure, 84.34% accuracy, 93.26% precision, and 0.825 Kappa. Based on the results of the temporal analysis, most of the damage-related messages were reported on the day of the earthquake and decreased in the following days. Most of the messages related to infrastructure damages and injured, dead, and missing people were reported on the day of the earthquake. In addition, results of LQ indicated Napa as a center of the earthquake as the concentration of damage-related messages in all algorithms were based there. This indicates that our approach has been able to identify the damage well and has considered the earthquake center one of the most affected counties. The findings of the damage estimation showed that going away from the epicenter lowered the amount of damage. Based on the result of the validation of the estimated damage map with official data, the SVM performed better for damage estimation, followed by deep learning. In addition, at the county scale, algorithms showed better performance with Spearman’s rho of 0.8205, Pearson correlation of 0.5217, and Kendall’s tau of 0.6666.

1. Introduction

Earthquakes occasionally happen unexpectedly with little alert; therefore, crisis management could be a challenging job [1]. Disasters or significant events, such as earthquakes, lead to enormous harm to life and assets [2]. The capability to quickly assess the spatial distribution of damage across a vast region subsequent to a considerable earthquake is crucial for effective disaster response. It also could be effective for the assessment of losses and public communication [3]. Residents in the impacted areas are defenseless and demand sufficient assistance and help from rescue workers (e.g., authorities’ organizations, and non-governmental organizations). The number of the disaster-affected people, thus, has an important effect on the proper timing to implement of rescue and assistance activities [4]. Authorities demand precise data regarding the spatial distribution of damages as soon as possible so that they will be able to dispatch assistance rapidly to suitable regions [3].
Nonetheless, collecting these data rapidly is difficult, and significant amounts of labor and assets are required to gather data in near real-time via conventional information capturing activities, including observing inquiries, telephone reports, or remote sensing images [1]. Traditional strategies for handling crises to deal with social and financial casualties and mitigate the consequences of a catastrophe undergo a variety of deficiencies, such as extreme temporal delays or restricted temporal and spatial resolution [5]. Regardless of the existence of advanced satellite detectors, able to observe proper spatial and spectral resolution, remote sensing image gathering and interpretation demand costly resources, including costly instruments and sophisticated data preparation devices, also in addition to fine weather circumstances. The remote sensing images need to be obtained and interpreted quite quickly to help the rescue groups, which is not often feasible with conventional acquisition and processing approaches [6].
Social media has grown to a main channel of communication over the last few years. In crises, individuals not only use social media to collect and exchange information but also to generate new data [7]. Social media offers several benefits and concerns to all domains of application and research that are associated with applying social media content for enhanced emergency management [8]. As a result of progress in technology and the pervasive use of smartphones, social networks are continuing to develop and are often used to disseminate, exchange, and gather information throughout crises [9]. A specific benefit comes from local people in the surrounding of the incident using social networks to express a specific view of reality. In the aftermath of crises such as earthquakes, social media users publish messages about the potential damage, which can be used to estimate the damage. Mostly, they are able to give unique information from their region, which is not yet given by any other authority [7]. Social network data, in contrast to conventional data, facilitate low-cost data gathering on a unique temporary resolution during emergency situations; therefore, these kinds of data cannot be neglected in crisis-related deciding efforts [1].
In damage assessment, different analyses perform differently in distinct scales (spatial units). Therefore, it should be determined on which scale the analysis for each kind of data source should be performed in order to have better performance. It will then be possible for decision makers to choose what kind of data to analyze at each scale. This makes the results closer to reality. Classification algorithms are needed to estimate the earthquake damage based on social network data [10,11,12,13,14,15,16,17,18,19,20,21,22,23,24]. Another issue that affects the damage estimation is the selection of the appropriate classification algorithm.
This study proposes an approach that applies social media data for earthquake damage assessment in different spatial units using different classification algorithms. This cause is enhancing situational awareness in disaster response and relief activities. For this purpose, damage assessment in three spatial units, including county, city, and 10 × 10 km grids, was performed. In this research, an attempt has been made to use both official spatial units based on which government information is usually provided (county and city) and spatial units that are homogeneous in terms of spatial coverage (10 × 10 km grids). The reason for choosing 10 km for its grid size is that it is not so small that it is difficult to determine the damage based on social network data, and it is not so large that it causes the aggregation of information in the wrong spatial units. In addition, the performance of Naive Bayes, SVM, and deep learning algorithms were compared.

2. Literature Review

With the growth of smartphones and the popularity of social networks, social media gives a new critical source of data for crisis management. Much of the current literature on the use of social network data in natural disasters has concentrated on different facets, including earthquake detection, situational awareness, and damage estimation [4].
The detection of earthquakes using social networks is an especially popular field of research. Sasaki et al. [25] offered a system that applied social network users as earthquake detectors. They concluded that their system notification was sent much quicker compared to the warnings system by the Japan Meteorological Agency. Earle et al. [26] demonstrated how instrument-based event detection and estimation of earthquake location and magnitude could be supplemented by Twitter data. Huang et al. [27] showed that by using clustering algorithms, the system facilitates instant identification of probable events.
Social networks would allow catastrophe managers to understand what is going on in cases of catastrophe. Crisis managers need actionable disaster-related data to make sense of the catastrophe and promote decision making, strategy formation, and execution of responses. Previous researches have used different methods, such as supervised and unsupervised classification kernel density estimation (KDE), to produce spatially appropriate data for situational awareness and improved response to disasters [28]. Among supervised algorithms, Naive Bayes and SVM are more widely used [29], and among unsupervised algorithms, latent Dirichlet allocation (LDA) algorithms are more widely considered [30].
Different studies have used different methods to classify text messages. In Khare et al. [31], the desirability of the SVM linear kernel for the classification of crisis-related messages was verified across the RBF (Radial Basis Function) kernel, the polynomial kernel, and the logistic regression. They assessed the models being trained by determining the precision (P), recall (R), and F1 metrics. Neppalli et al. [32] applied deep neural networks and Naive Bayes to classify Twitter messages throughout crises. Ragini et al. [33] introduced a mixed approach for determining individuals at risk both during and after a crisis using real-time classification. To evaluate the model’s efficiency, they applied three methods, including Naive Bayes, decision tree, and SVM. Burel and Alani [34] developed an automated tool that detected social network tweets associated with disasters. They applied Naive Bayes, classification and regression trees (CART), SVM, and CNNs.
Qu et al. [35] investigated information trends in social networks during and after the crisis, including how various kinds of information evolved over time and how information was disseminated in the social networks. Yin et al. [29] evaluated the SVM and the Naive Bayes algorithms for classifying crisis-related messages and concluded that the SVM had better performance. Imran et al. [36], regarding the informational significance of social networks, noted that tweets relevant to crises differ significantly in their utility for handling crises. They used machine learning methods to differentiate between related and non-related messages. Peters et al. [7] examined messages from social networks to handle crises. They demonstrated that there is a strong relationship between messages relevant to a crisis, which include photos and their distance to the incident. Therefore, the photo in a social network message may represent an indicator of the high likelihood of related content. These results could be applied to improve information exploitation from social networks in order to increase situational awareness.
Wang and Ye [28] examined the variability of spatial topic concentration before, during, and after the crisis. They used the Markov transition probability matrix and LQ (location quotation) to measure the spatial concentration of crisis-related topics on social networks and their variability. Gründer-Fahrer et al. [8] investigated the topical and temporal form of the German social network using unsupervised algorithms. They used the topic model to examine what type of information was distributed during the incident on social networks. Temporal clustering methods were applied to automatically identify the various characteristics of disaster management phases. They offered methods for analyzing social network data to obtain information relevant to the management of crises.
For an in-depth analysis of multimodal social network data gathered during crises, Alam et al. [10] proposed a methodological model based on machine learning techniques ranging from unsupervised to supervised learning. They performed sentiments analysis to understand how the thoughts and feelings of individuals change with time as disasters progress. The mentioned study used topic modeling techniques to understand each day’s various topics discussed. They applied supervised classification techniques to classify textual and image content into humanitarian subgroups to help aid agencies in meeting their specific information requirements. Eivazy and Malek [11] used geospatial crowdsourcing services for managing rescue operations. Wu et al. [12] examined the correlation between social network activities and natural disasters. They applied the Naive Bayes to calculate a population-adjusted disaster score.
For earthquake damage estimation, Corbane et al. [13] found that the geolocated SMS can be used as early indices of the spatial distribution of building damage. They used remote sensing data for building damage assessment. They used information from remote sensing to assess the damage. Liang et al. [14] recognized three distinct tweet-based characteristics for estimating the epicenter of earthquakes, including tweet density, re-tweet density, and user tweeting, and compared them across text and media tweets. Burks et al. [3] applied a method that incorporate the features of the earthquake, evaluated by applying seismographs (including instant severity, distance from the center, and wave speed) with Twitter information.
Cresci et al. [15] used Twitter features to estimate the intensity of the earthquake on the Mercalli scale. They applied linear regression models over a set of features that were extracted from user profiles, tweet content, and time-based features. Nguyen et al. [16] identified damage-related photos and determined the amount of damage (i.e., serious, moderate, or low) from Twitter images using deep convolutional neural networks (CNN). Avvenuti et al. [17] designed Earthquake Alerts and Report System. The system produces interactive disaster maps that show regions that may have suffered significant harm. They concluded that such a system has great importance for disaster management. Avvenuti et al. [18] proposed a system based on customizable web-based dashboards and maps for damage estimation. Their system then visualizes the collected data. Their evaluations have determined that there is a considerable consensus between ratings relying on tweets and those relying on official information on earthquake damage.
Zou et al. [19] proposed a method for identifying affected areas by the earthquake. Their results indicated that Twitter could help identify affected areas faster than traditional monitoring methods. Resch et al. [5] estimated Napa earthquake damage via a spatial grid unit. They used the topic-modeling LDA for clustering damage-related messages. They did not use multiple spatial scales to assess damage estimation and used only one algorithm for classification. Mouzannar et al. [20] suggested a multimodal deep learning method that integrates text and images for detecting damage in social network data.
Kropivnitskaya et al. [21] used social media information to complement physical sensor information to produce more precise real-time intensity maps. They developed four empirical predictive relationships (linear, two-segment linear, three-segment linear, and exponential) that connected the tweet rates in the first 10 min after the earthquake with the Mercalli intensity (MMI) scale in Napa earthquake. Their approach combines data from both social and physical sensors for earthquake intensity prediction. Wang et al. [1] measured the relationship between citizen–sensor data’s temporal development pattern and the region of the effect of the earthquake. In addition, they integrated social media data with other auxiliary data.
E2mC was designed by Fernandez-Marquez et al. [22] to explain how the region was impacted by the earthquake and to determine the intensity of the damages. The main idea with E2mC is the integration of automated evaluation of social network information with crowdsourcing. Their main objective was to enhance the quality and reliability of the information given to professional users in the Copernicus system. Mendoza et al. [23] estimated damages in the Mercalli intensity scale based on social network posts. Li et al. [6] suggested a method to find construction damage in a disaster image and estimate damage based on convolution neural networks. They investigated the utility of the suggested method for other infrastructure damage classifications, specifically bridge and highway damage. Shan et al. [9] assessed both physical and emotional earthquake damages. Physical damage is associated with damage to infrastructure, people, assets, house, agriculture, and industry. Emotional damage is associated with emotions reported by individuals after the crisis, especially negative emotions. In our previous work ([24]), we used the SVM method for creating earthquake damage map. The present article is a continuation of the mentioned article and has completed it in terms of the number of spatial units and the evaluation of different algorithms.
While damage assessment based on social network data has gained considerable academic interest, little attention has been given to the effect of scale on the results. After identifying the impact of the scale on social network performance in damage assessment, decision makers can determine which scale can use social networks and which spatial unit can use other data sources or integrate social networks with other data sources to achieve the best results as quickly as possible. Another issue that has a great impact on the results of the damage assessment is the algorithm for extracting the damage information. Due to the fact that the damage assessment will be based on the damage-related extracted data, the issue is the impact of the classification algorithm on the end result of damage assessment. Therefore, the performance of different classification algorithms must be examined in the damage assessment.

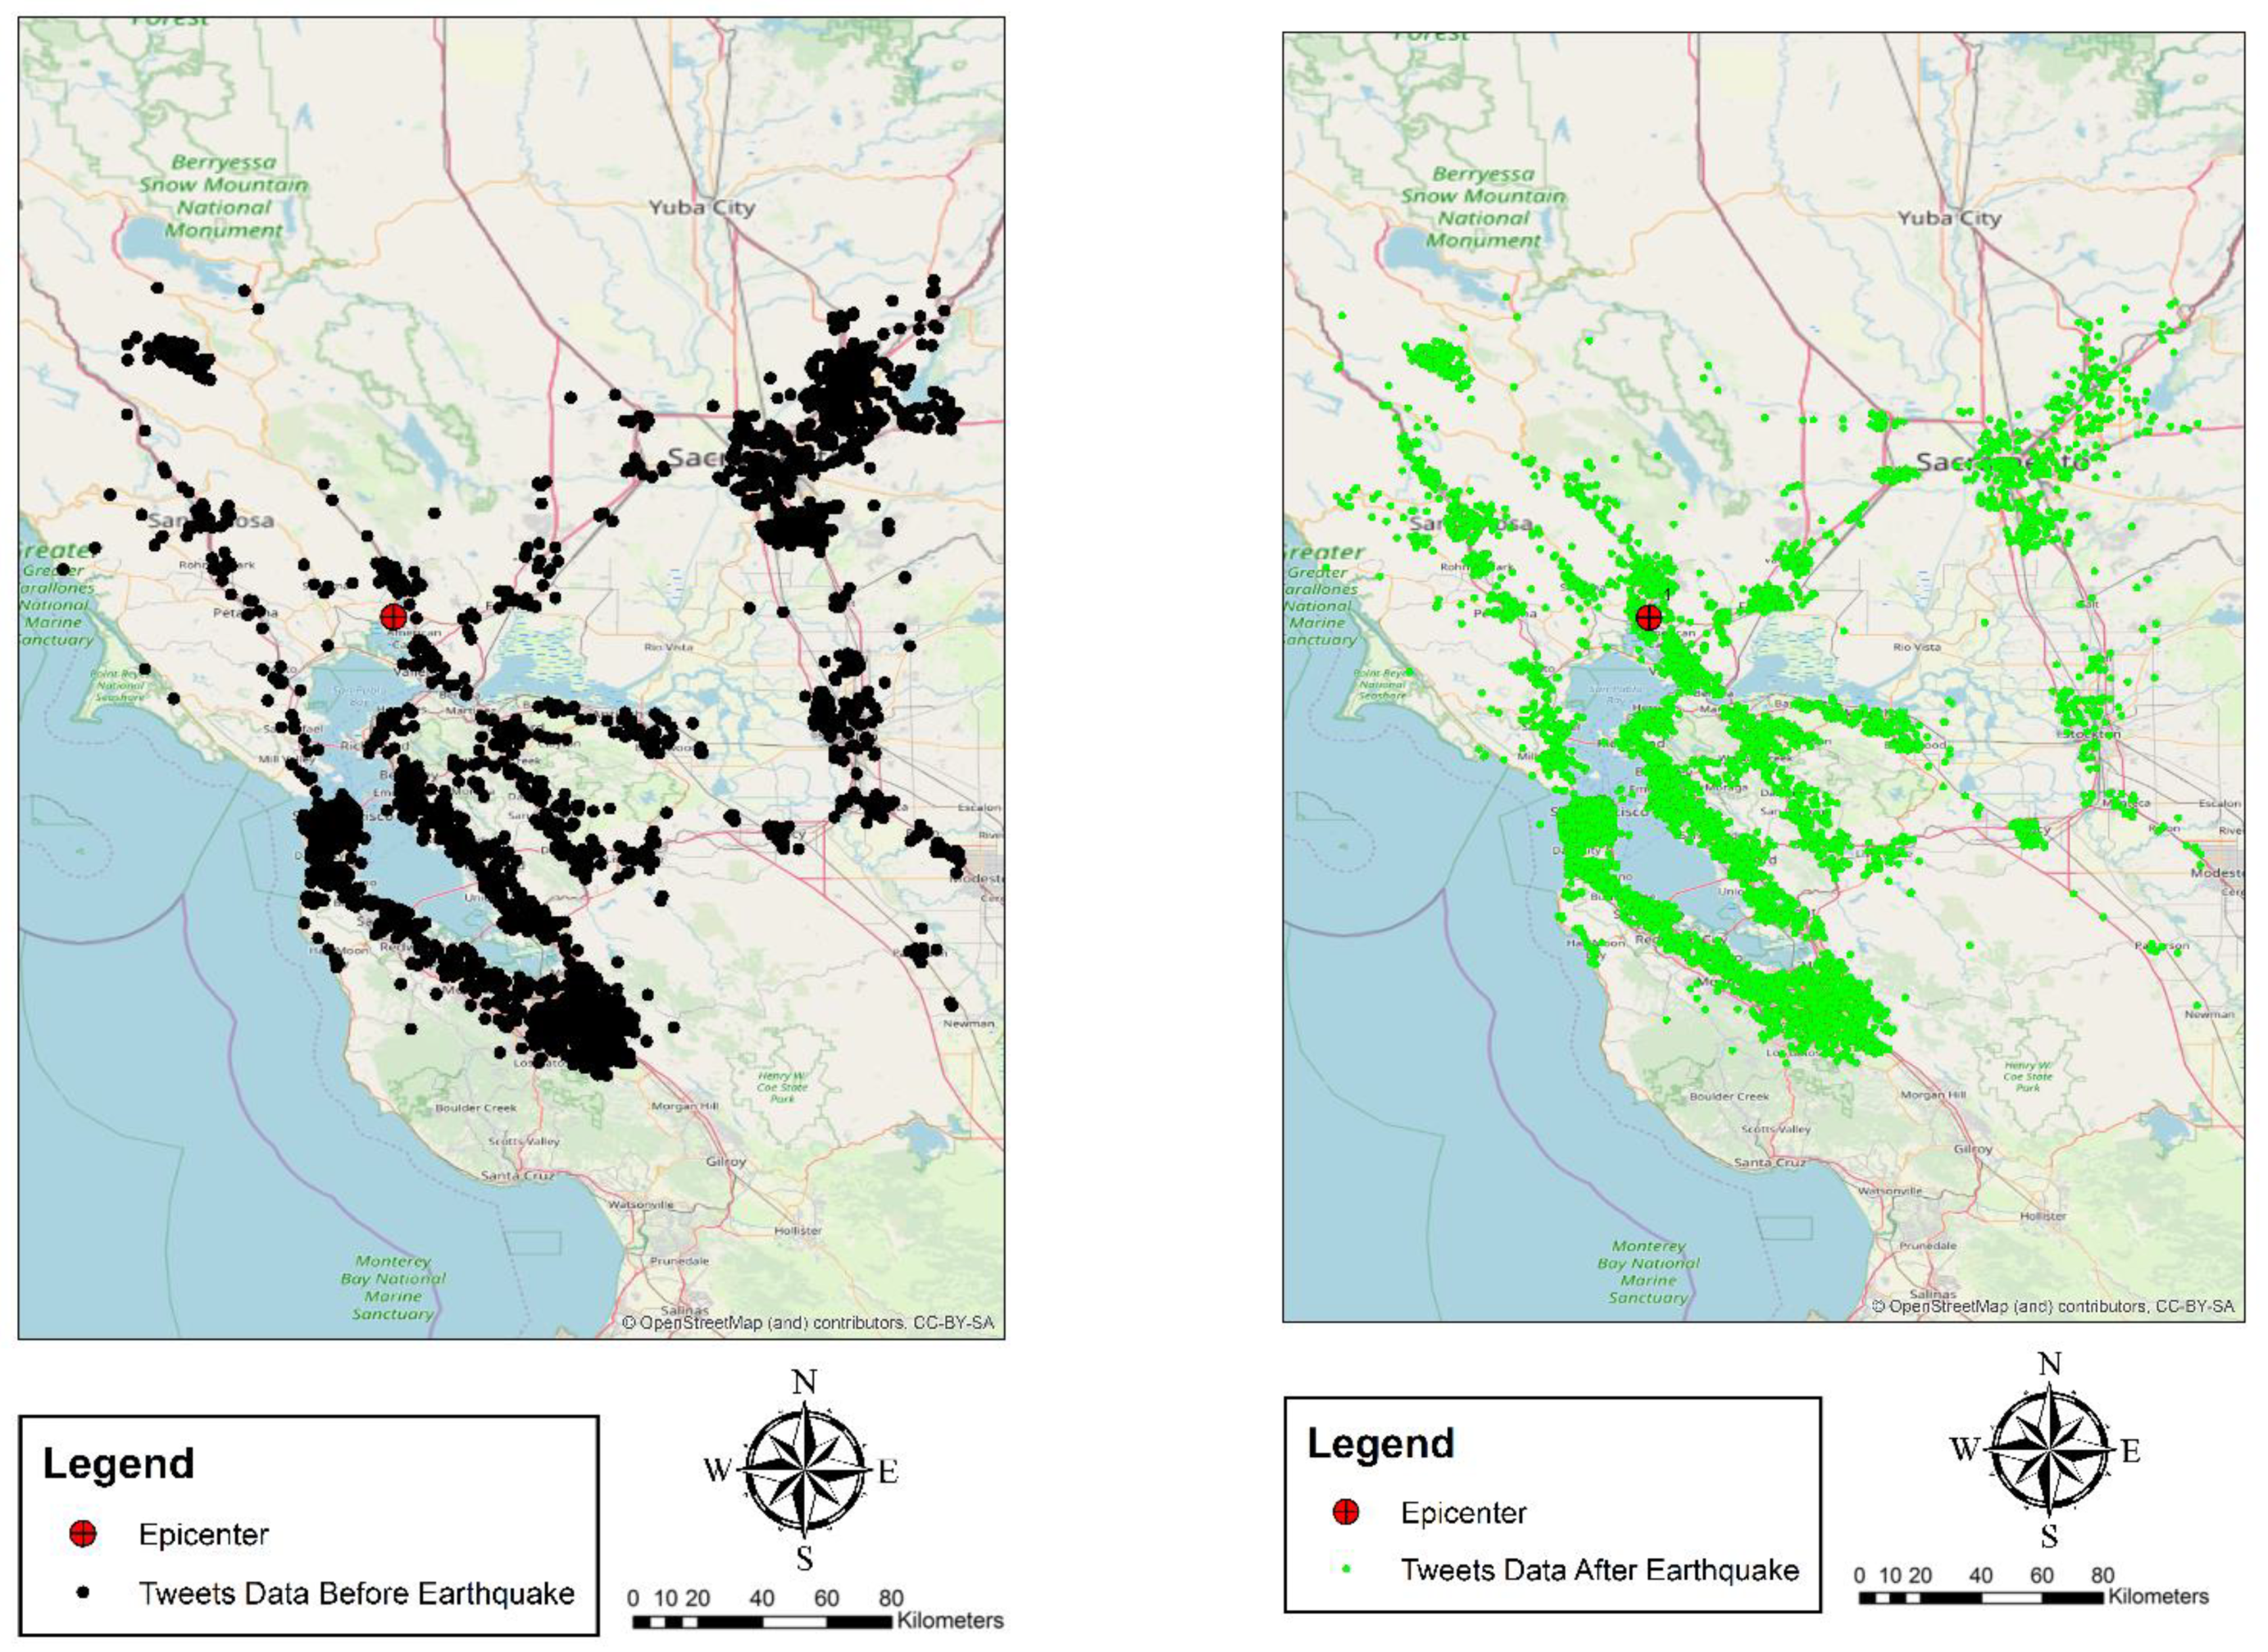
3. Data and Case Study
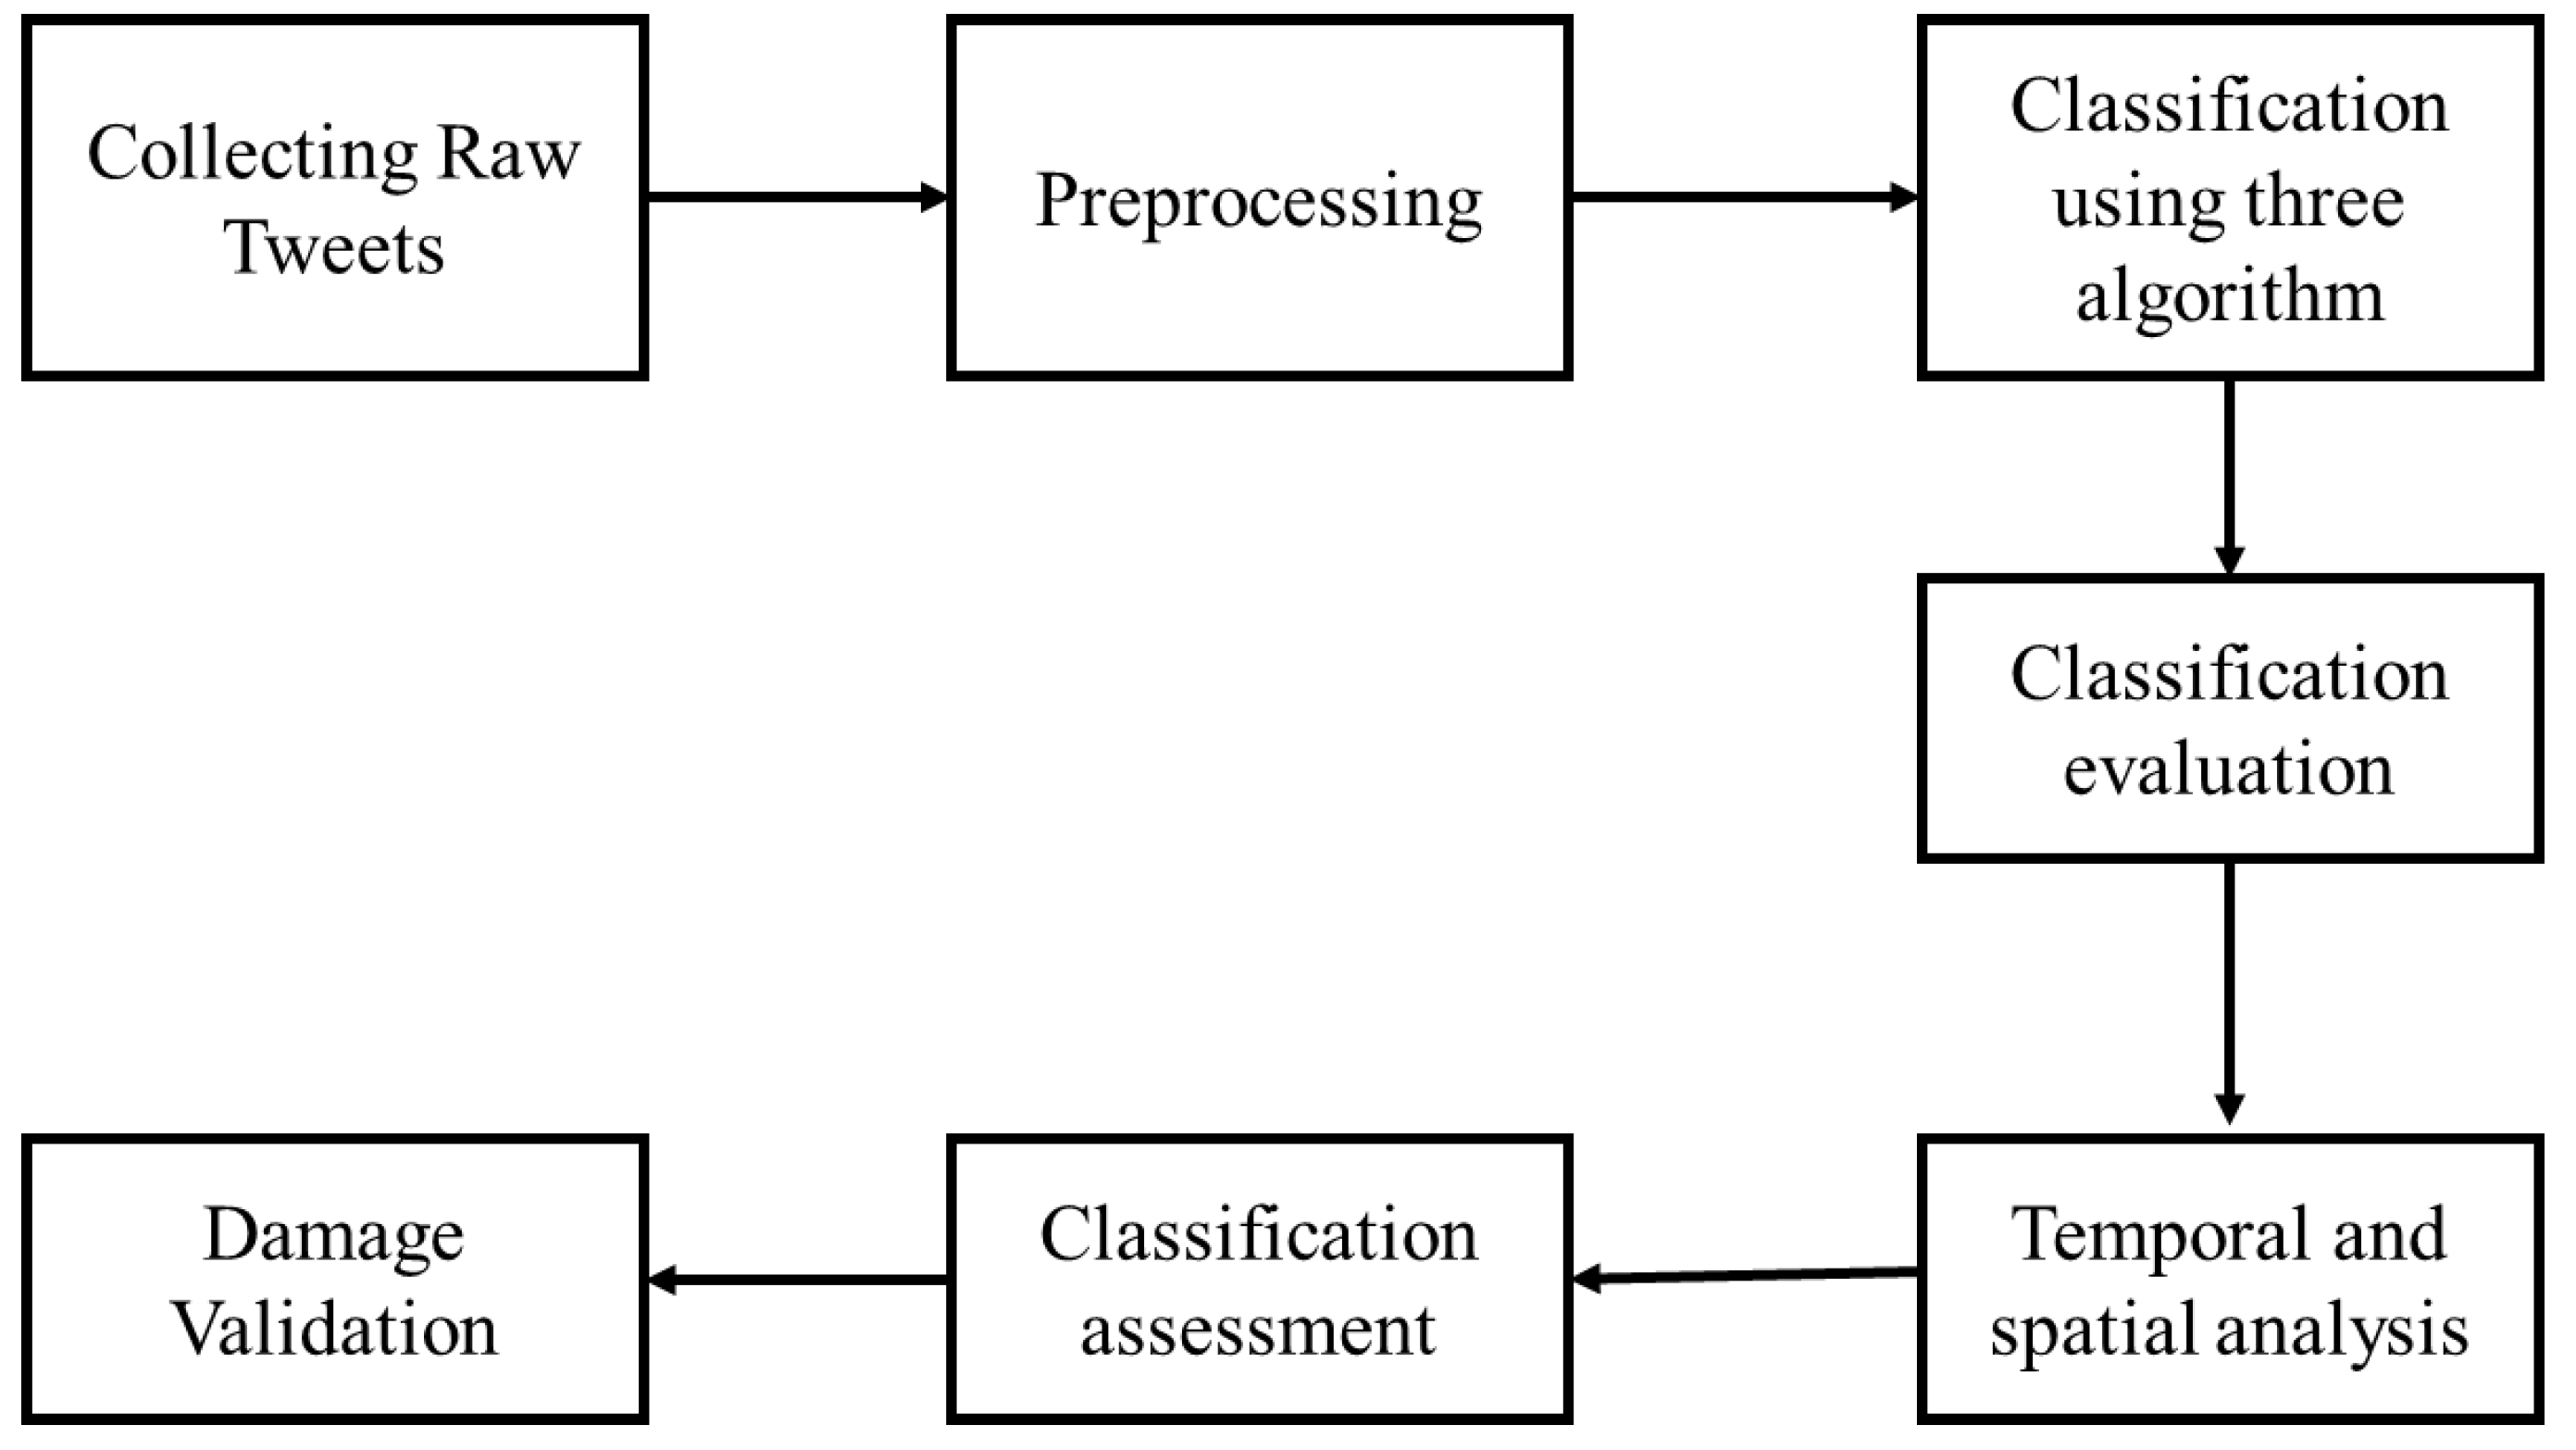
The study used Twitter data from the Napa earthquake on 24 August 2014, at 10:20:44 UTC (3:20 A.M local time). It was the biggest earthquake in the San Francisco Bay Area after the 1989 Loma Prieta earthquake, with the maximum intensity of the Mercalli VIII (extreme). The magnitude was 6.0, with 11.3 km depth [37]. The event’s epicenter was south of Napa and northwest of the American Canyon (Figure 1). One individual died, about 200 individuals were wounded, and this incident resulted in more than $400 million in damage [21]. In the period 17–31 August 2014, a number of 998,791 tweets were obtained [5]. Tweets, including keywords relevant to the earthquake, were kept and 26,942 tweets have remained after the keyword filtering. For keyword filtering, words such as earthquake, quake, etc. were considered. Population information, including population density per kilometer according to the NASA website (https://beta.sedac.ciesin.columbia.edu/data/set/gpw-v4-population-density-adjusted-to-2015-unwpp-country-totals/data-download, accessed on 18 October 2019), was also used in order to remove the population effect while preparing the damage map. In other words, the resolution of this layer was 1 km, which was calculated by dividing the population by area. Figure 1 provides an overview of the area of study on the Napa earthquake with tweet locations.

4. Methodology

Figure 2 shows the proposed approach for damage assessment based on social network data. Initially, pre-processing was done to remove irrelevant data as well as convert the tweets’ text into a comprehensible structure for the computer. Then, the three algorithms of Naive Bayes, SVM, and deep learning were used to classify the messages. Then, classification was evaluated using accuracy, precision, recall, and F-score metrics. To understand the message propagation behavior in the study area, temporal analysis based on classified messages was performed. In addition, the variability of spatial topic concentrations in three classification algorithms after the earthquake were examined using LQ. Then, the damage map based on the results of the classification of the three algorithms into three spatial units of city, county, and 10 × 10 km grids, wascreated. For validation, a FEMA HAZUS loss model was used. HAZUS is a standardized model for evaluating losses from earthquake and other crises [38]. In this regard, confusion matrix metrics, Spearman’s rho, Pearson correlation, and Kendall’s tau were used to assess our approach damage map with the FEMA HAZUS loss model (https://www.conservation.ca.gov/cgs/earthquake-loss-estimation, accessed on 16 October 2019).

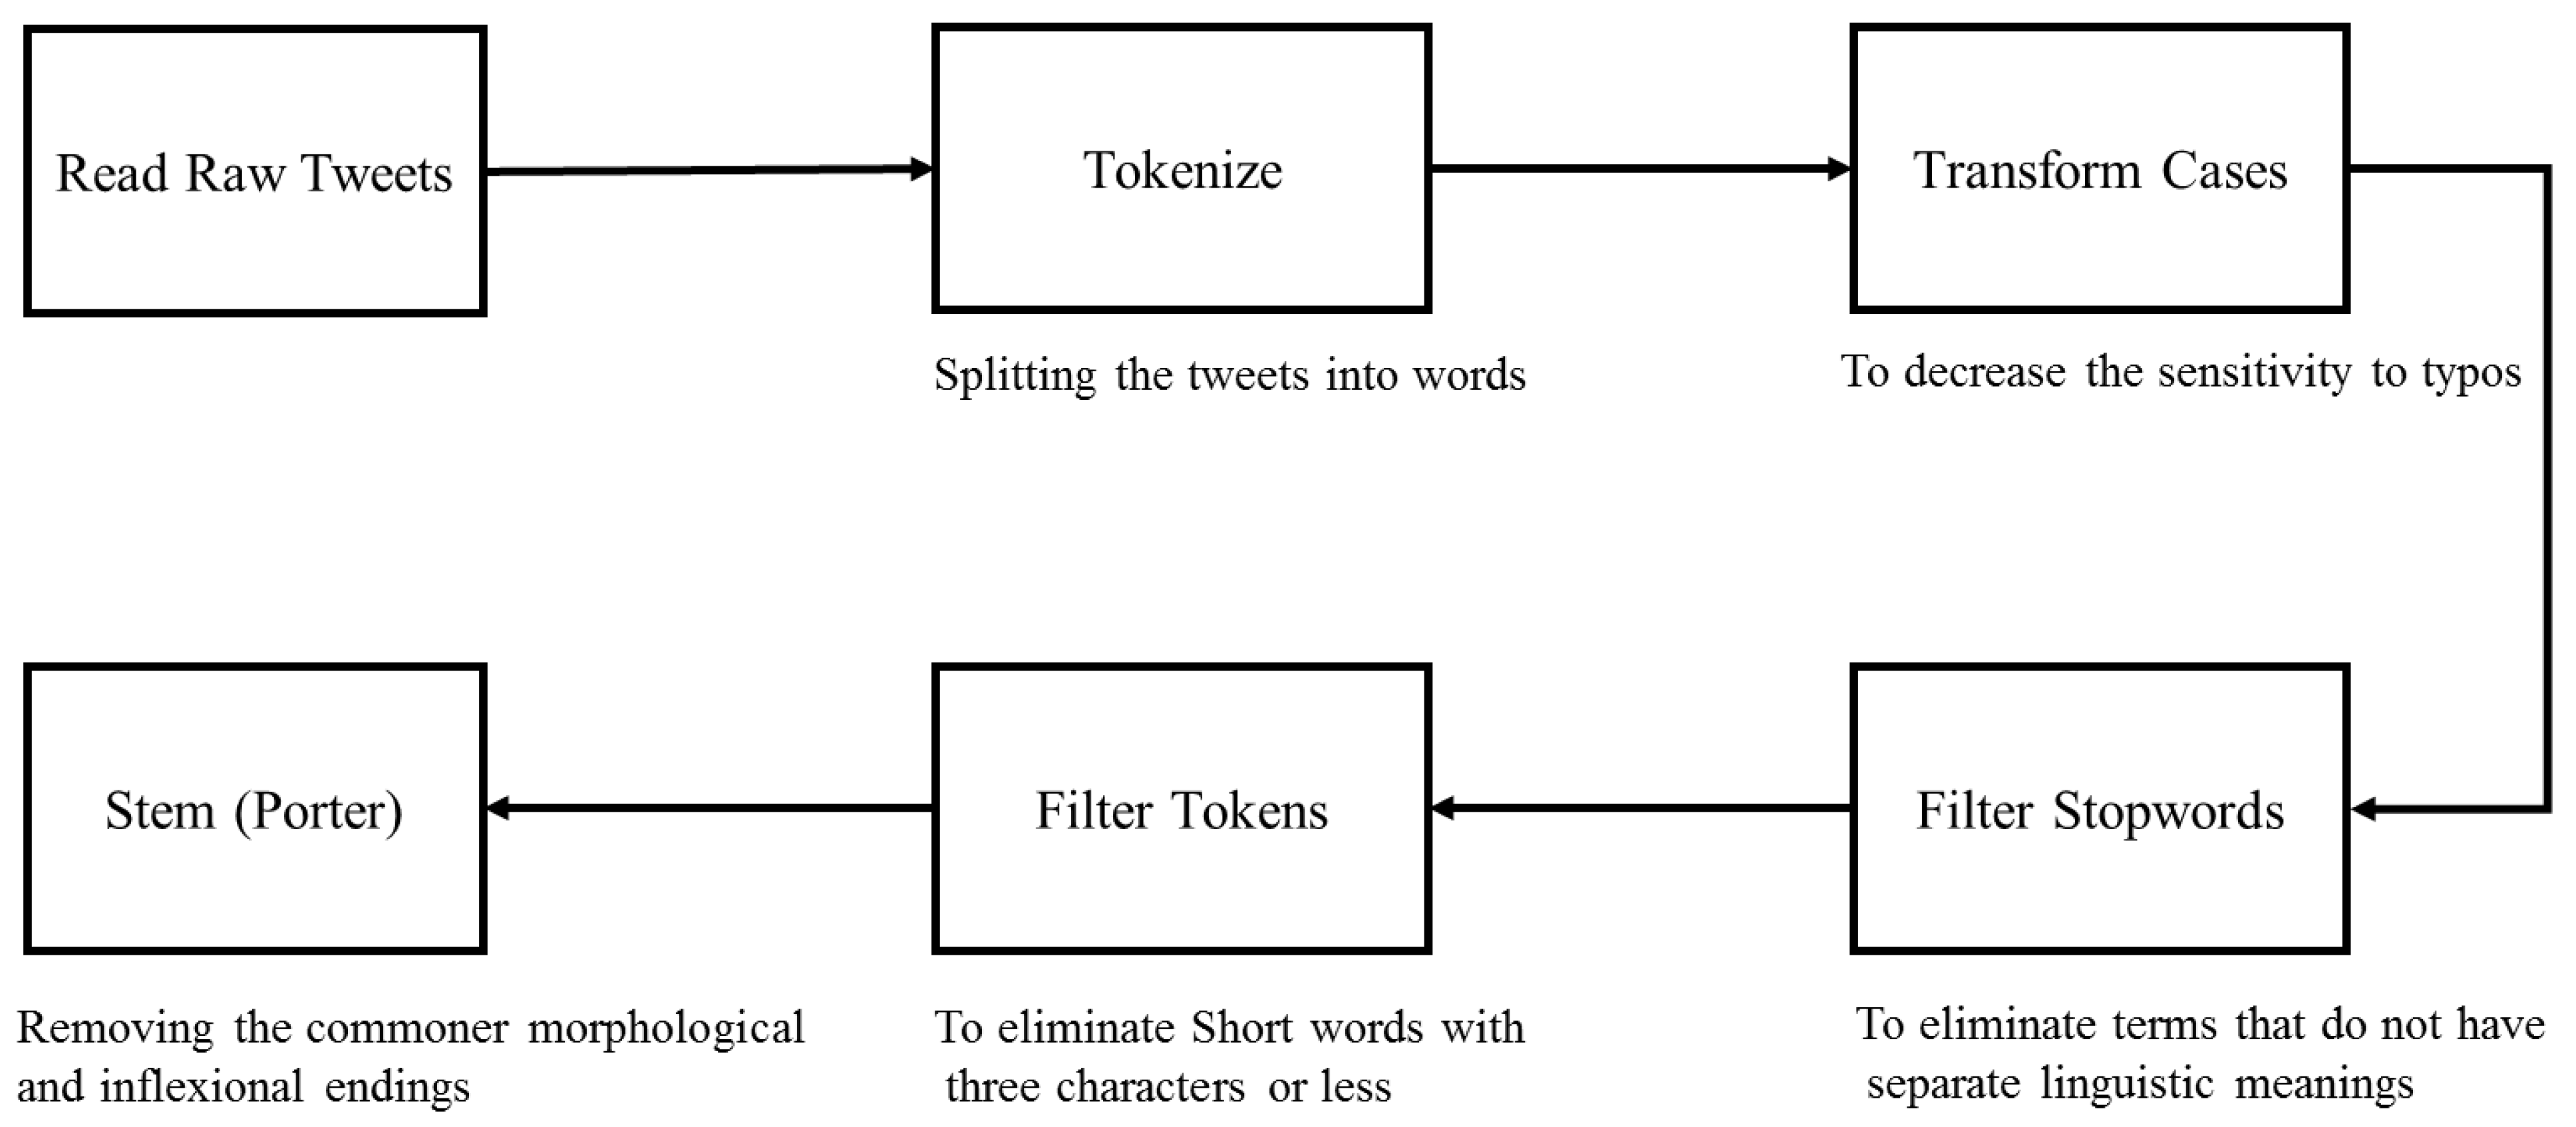
4.1. Data Preprocessing

Policymakers and emergency services recently envisaged creative strategies to elicit the information posted on social networks in crises such as an earthquake. These data, however, are sometimes unstructured, diverse, and distributed over a great number of tweets in such a manner that they could not be utilized explicitly. Thus, transforming that chaotic information into a set of explicit and precise texts for a crisis manager is necessary. In this study, data in a text format related to post-earthquake tweets were used for damage assessment. Textual data are regarded as unstructured data that are incomprehensible to computers. Therefore, in order to prepare these data for computer analysis, they must be structured and computer-usable data. In this section, following the process shown in Figure 3, the normalization of unstructured data was performed manually after removing the missing values. At first, during the tokenization process, the textual data were subdivided into smaller linguistic units called tokens. Words, numbers, and punctuation are linguistic units known as tokens. Then, in order to integrate the text in either uppercase or lowercase letters, all the letters in the textual data were converted to lowercase letters. Next, numbers, punctuations and inappropriate letters were removed from tweets. Then, ineffective words (stop words) that do not convey significant semantic content (words like “The”, “On”, “Is”, “All”, and “an” in English) were deleted from the textual data. Short words with three characters or less were removed. After that, stemming was used to return words to their root form, for this purpose, the Porter algorithm, one of the most popular algorithms for performing stemming operations, was used. Finally, using n-Gram algorithms, the expressions and collocation words were removed from the text data [5].

4.2. Classification

Social networks have a crucial function in the dissemination of information throughout crises. Regrettably, the enormous amount and diversity of data produced on social networks make it difficult to manually search through this content and specify its relevance for damage estimation. Though, with many social network opportunities, real challenges arise, such as handling such large quantities of messages, which make manual processing extremely insufficient. The information overburden throughout crises could be equal to the lack of information for the emergency management. Therefore, classification algorithms can be used to solve these problems and extract useful information. In this study, binary classification and multi-class classification have been done. Binary classification is used to classify messages into two classes of damage and non-damage so that their results can finally be used to estimate the earthquake damage. Multi-class classification is used to categorize messages to increase post-crisis situational awareness and to monitor the process of changing conditions over time and determine the concentration of various topics in different locations.
Previous research has used SVM, Naive Bayes, and deep learning algorithms to classify crisis-related messages and performed better [31,32,33,34]. In this regard, in this research, SVM, Naive Bayes, and deep learning algorithms have been used. These three algorithms are described below.
  • Naive Bayes
The Naive Bayes algorithm is regarded as a Bayesian algorithm. The Naive Bayes is a big-bias, small-variance classification algorithm, and even with a small set of data, it can build a good model. It is so simple to use and affordable to compute. A Naive Bayes classification algorithm is a simplistic probabilistic classifier based on the theory of Bayes (from Bayesian statistics) with powerful (Naive) hypotheses of independence. A Naive Bayes classification algorithm assumes that the existence (or absence) of a specific element of a class is irrelevant to the existence (or absence) of any other element [39]. The presumption of independence greatly makes simpler the computations required to create the probability model for the maive Bayes. The Naive Bayes has the benefit of not demanding hyper-parameter tuning as a comparison with other methods. In addition, Li et al. [40] showed that the results of tweet classification for disasters extracted with The Naive Bayes are analogous and often better than those acquired with other more complex algorithms used with predefined variables.
  • SVM
The SVM is a supervised method that is applied for classification and regression analysis. The SVM removes the requirement to reduce the space of the higher feature dimension and has an automated variable-adjusting property that is appropriate for text classifying. This is a functional-based classification algorithm that is created on the basis of decision planes specifying class boundaries [41]. The fundamental concept is to discover a hyperplane that segregates the d-dimensional information efficiently into its two classes. Since all of the data are not always linearly distinguishable, the SVM comprises the concept of a kernel-induced feature space that projects the information into a higher-dimensional space in which the data are easier to separate [39]. After optimizing the SVM parameters, a linear the SVM kernel has been used.
  • Deep learning
An emerging availability of various labeled datasets recently enabled the successful application of deep learning for crisis-related messages classification. The deep learning algorithm used in this study is, in fact, a multi-layer feed-forward artificial neural network algorithm that uses a stochastic gradient descent approach via back-propagation to predict labels of classes. This network can contain a large number of hidden layers, including layers with rectifier neurons and maxout activation functions. The most important features of this algorithm are adaptive learning rate, rate annealing, momentum training coefficient, dropout, and adjustment of L1 or L2 parameters. Proper adjustment of these parameters can improve the performance of the predictive algorithm. Each computational node trains a copy of the general model parameters on its local data with a multi-threading (asynchronous) approach and periodically helps to predict the model. The two most important parameters in this algorithm are the number of epochs, as well as the number of hidden layers. Experimentally, and considering the results obtained, the number of epochs, as well as the number of hidden layers, were set to 10 and 3 hidden layers, respectively [20].

4.3. Assessment Performance of Classification

Comparing different classification algorithms is no unimportant issue. The efficiency of classification algorithms can be assessed in a variety of ways and relies on several parameters, such as training data, learning strategy, target categories, and, in several situations, the language in which a classification algorithm is constructed. A central idea for identifying classification algorithms’ effectiveness is its confusion matrix, which is a table portraying right and wrong categorizations. The quantitative measurements, including precision, accuracy, recall, kappa, and F-measure, are computed from the confusion matrix. Accuracy is the total of the values in the confusion matrix diagonal, divided by the total of all cells’ values. In general, it is a global value that relates to the information percentage exactly classified. Precision is the percentage of appropriately classified items that amount to the total amount of classified items. It refers to the possibility that an object practically belongs to the class that we have classified it as being a member of Recall is the percentage of the amount of correctly classified tweets out of the total amount of tweets in the test sets belonging to a specific class. F-score is the precision and recall geometric mean [42]. Kappa is a measure that compares computed (observed) accuracy with expected accuracy (random chance). Kappa is almost equal to or below 1. The closer to 1 indicates a better performance. Values of 0 or less demonstrate the uselessness of the classification algorithm [43].

4.4. Temporal and Spatial Analysis
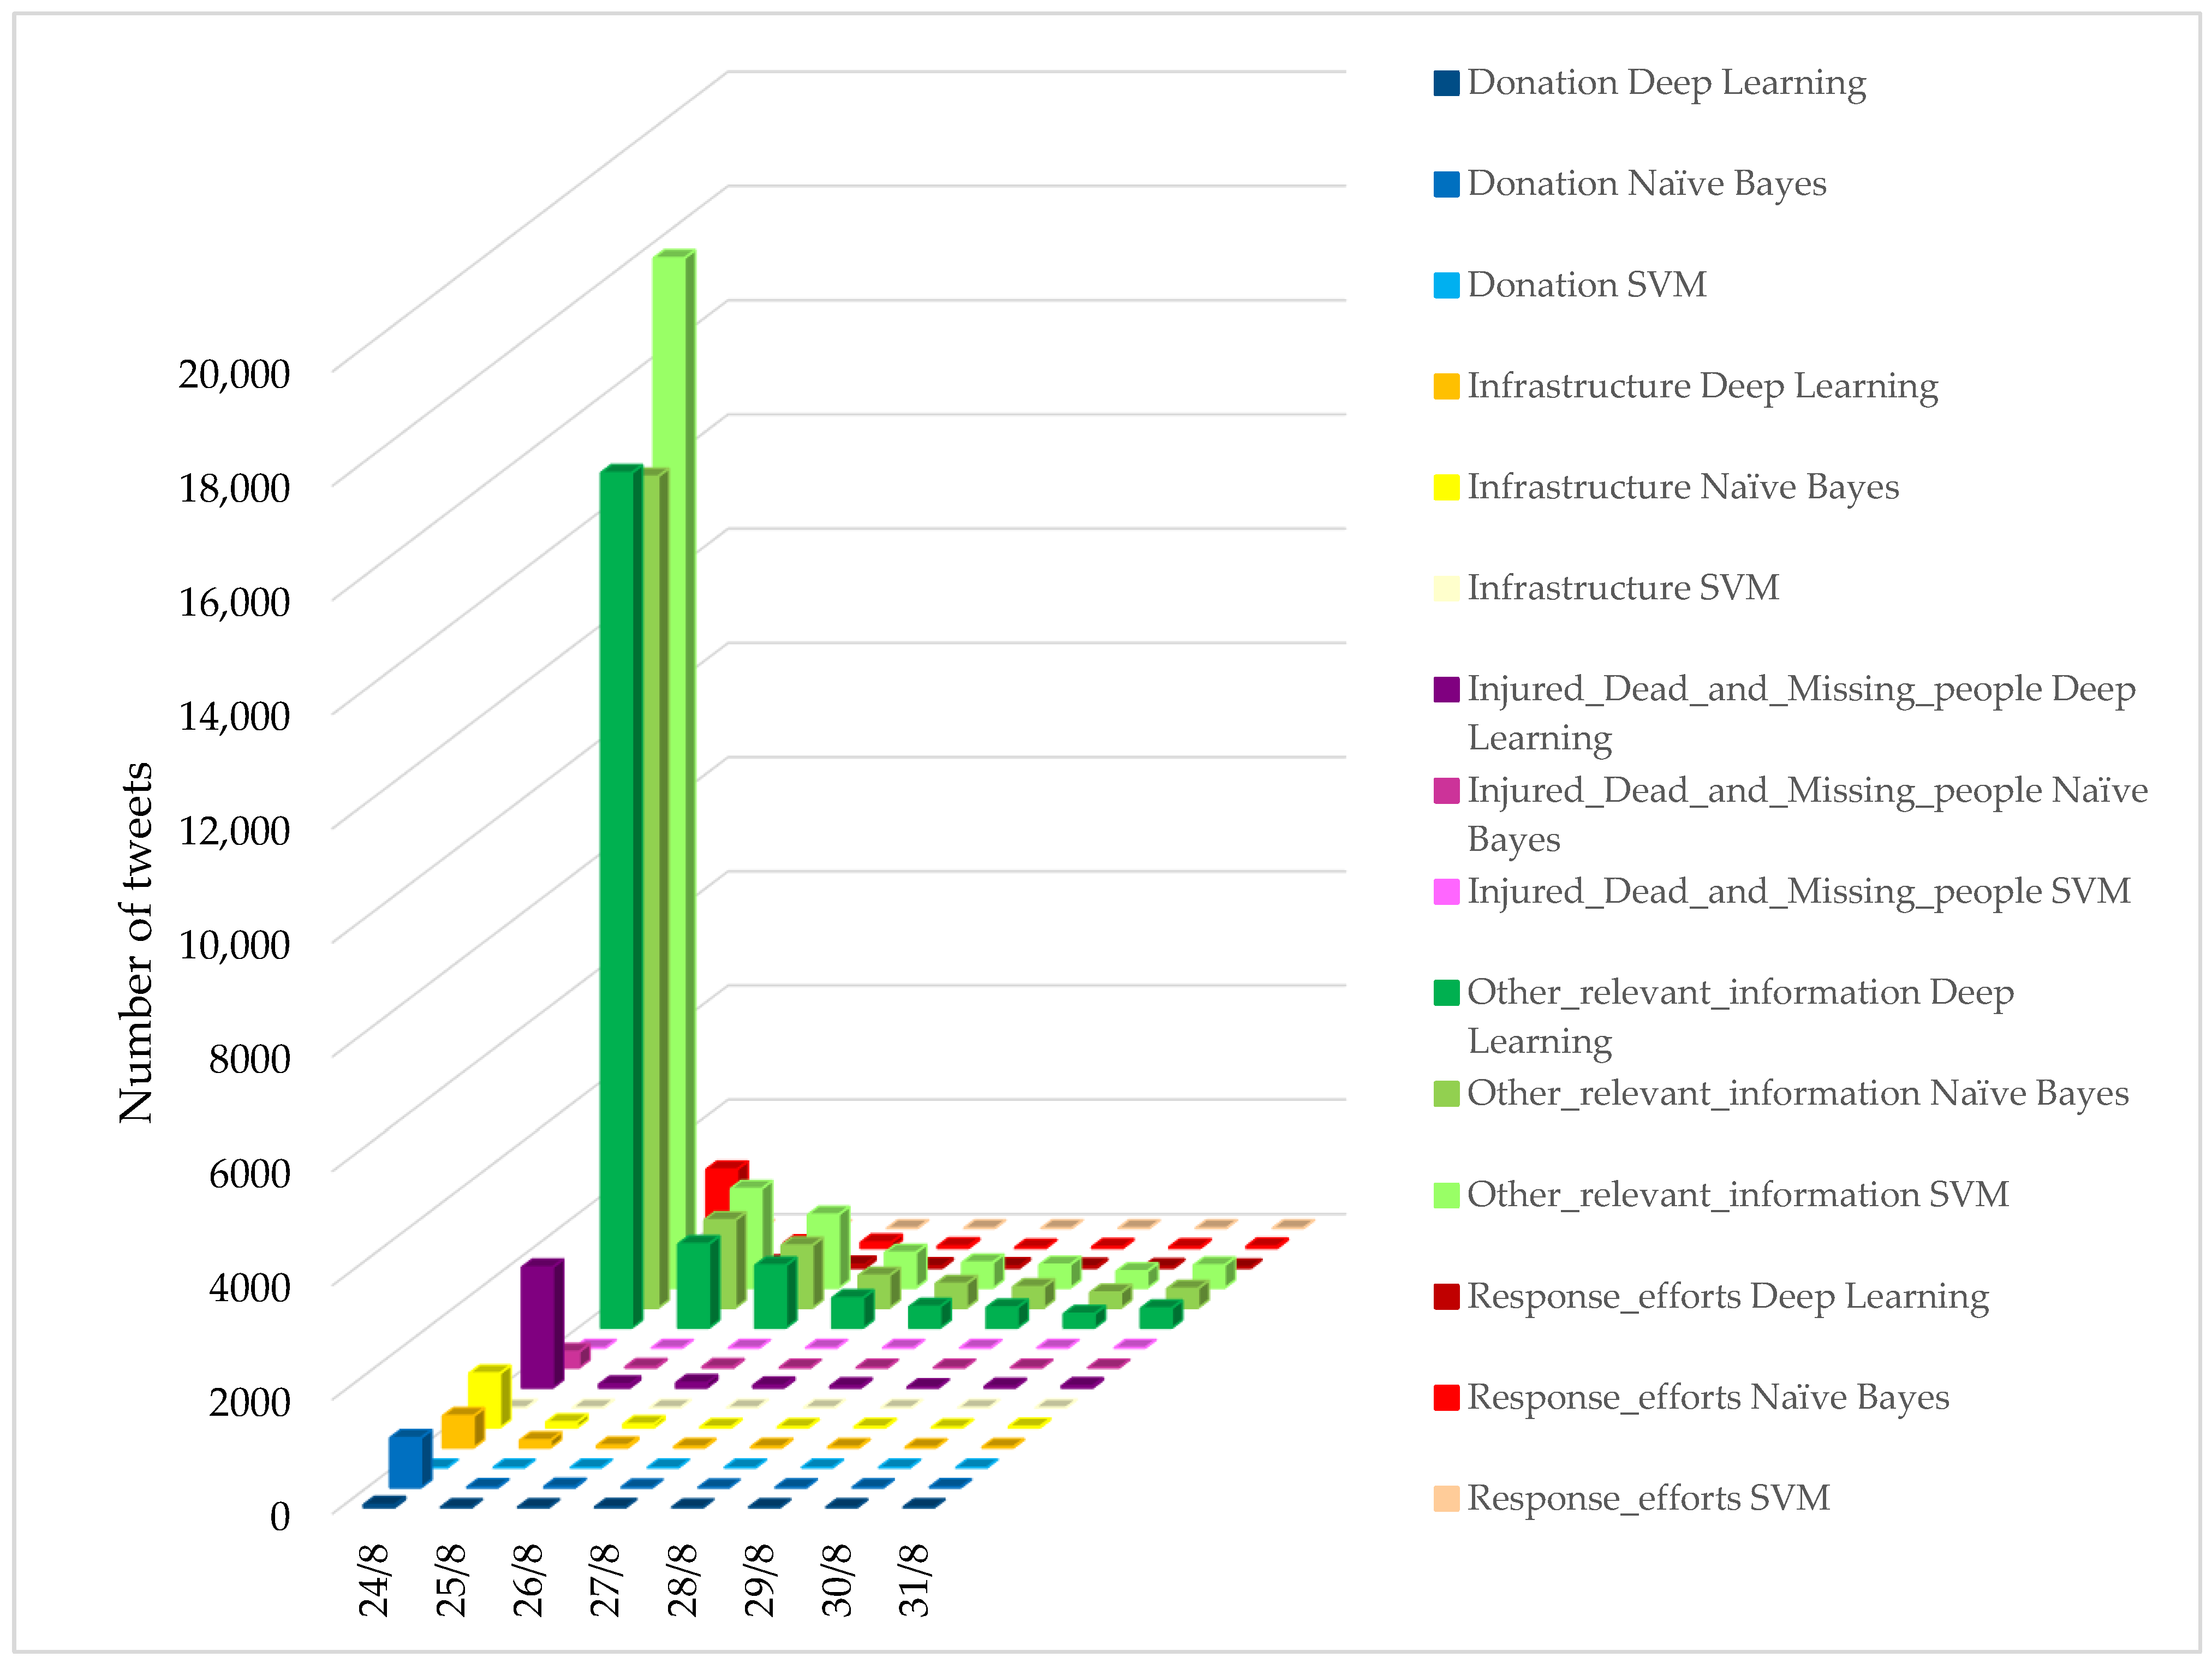
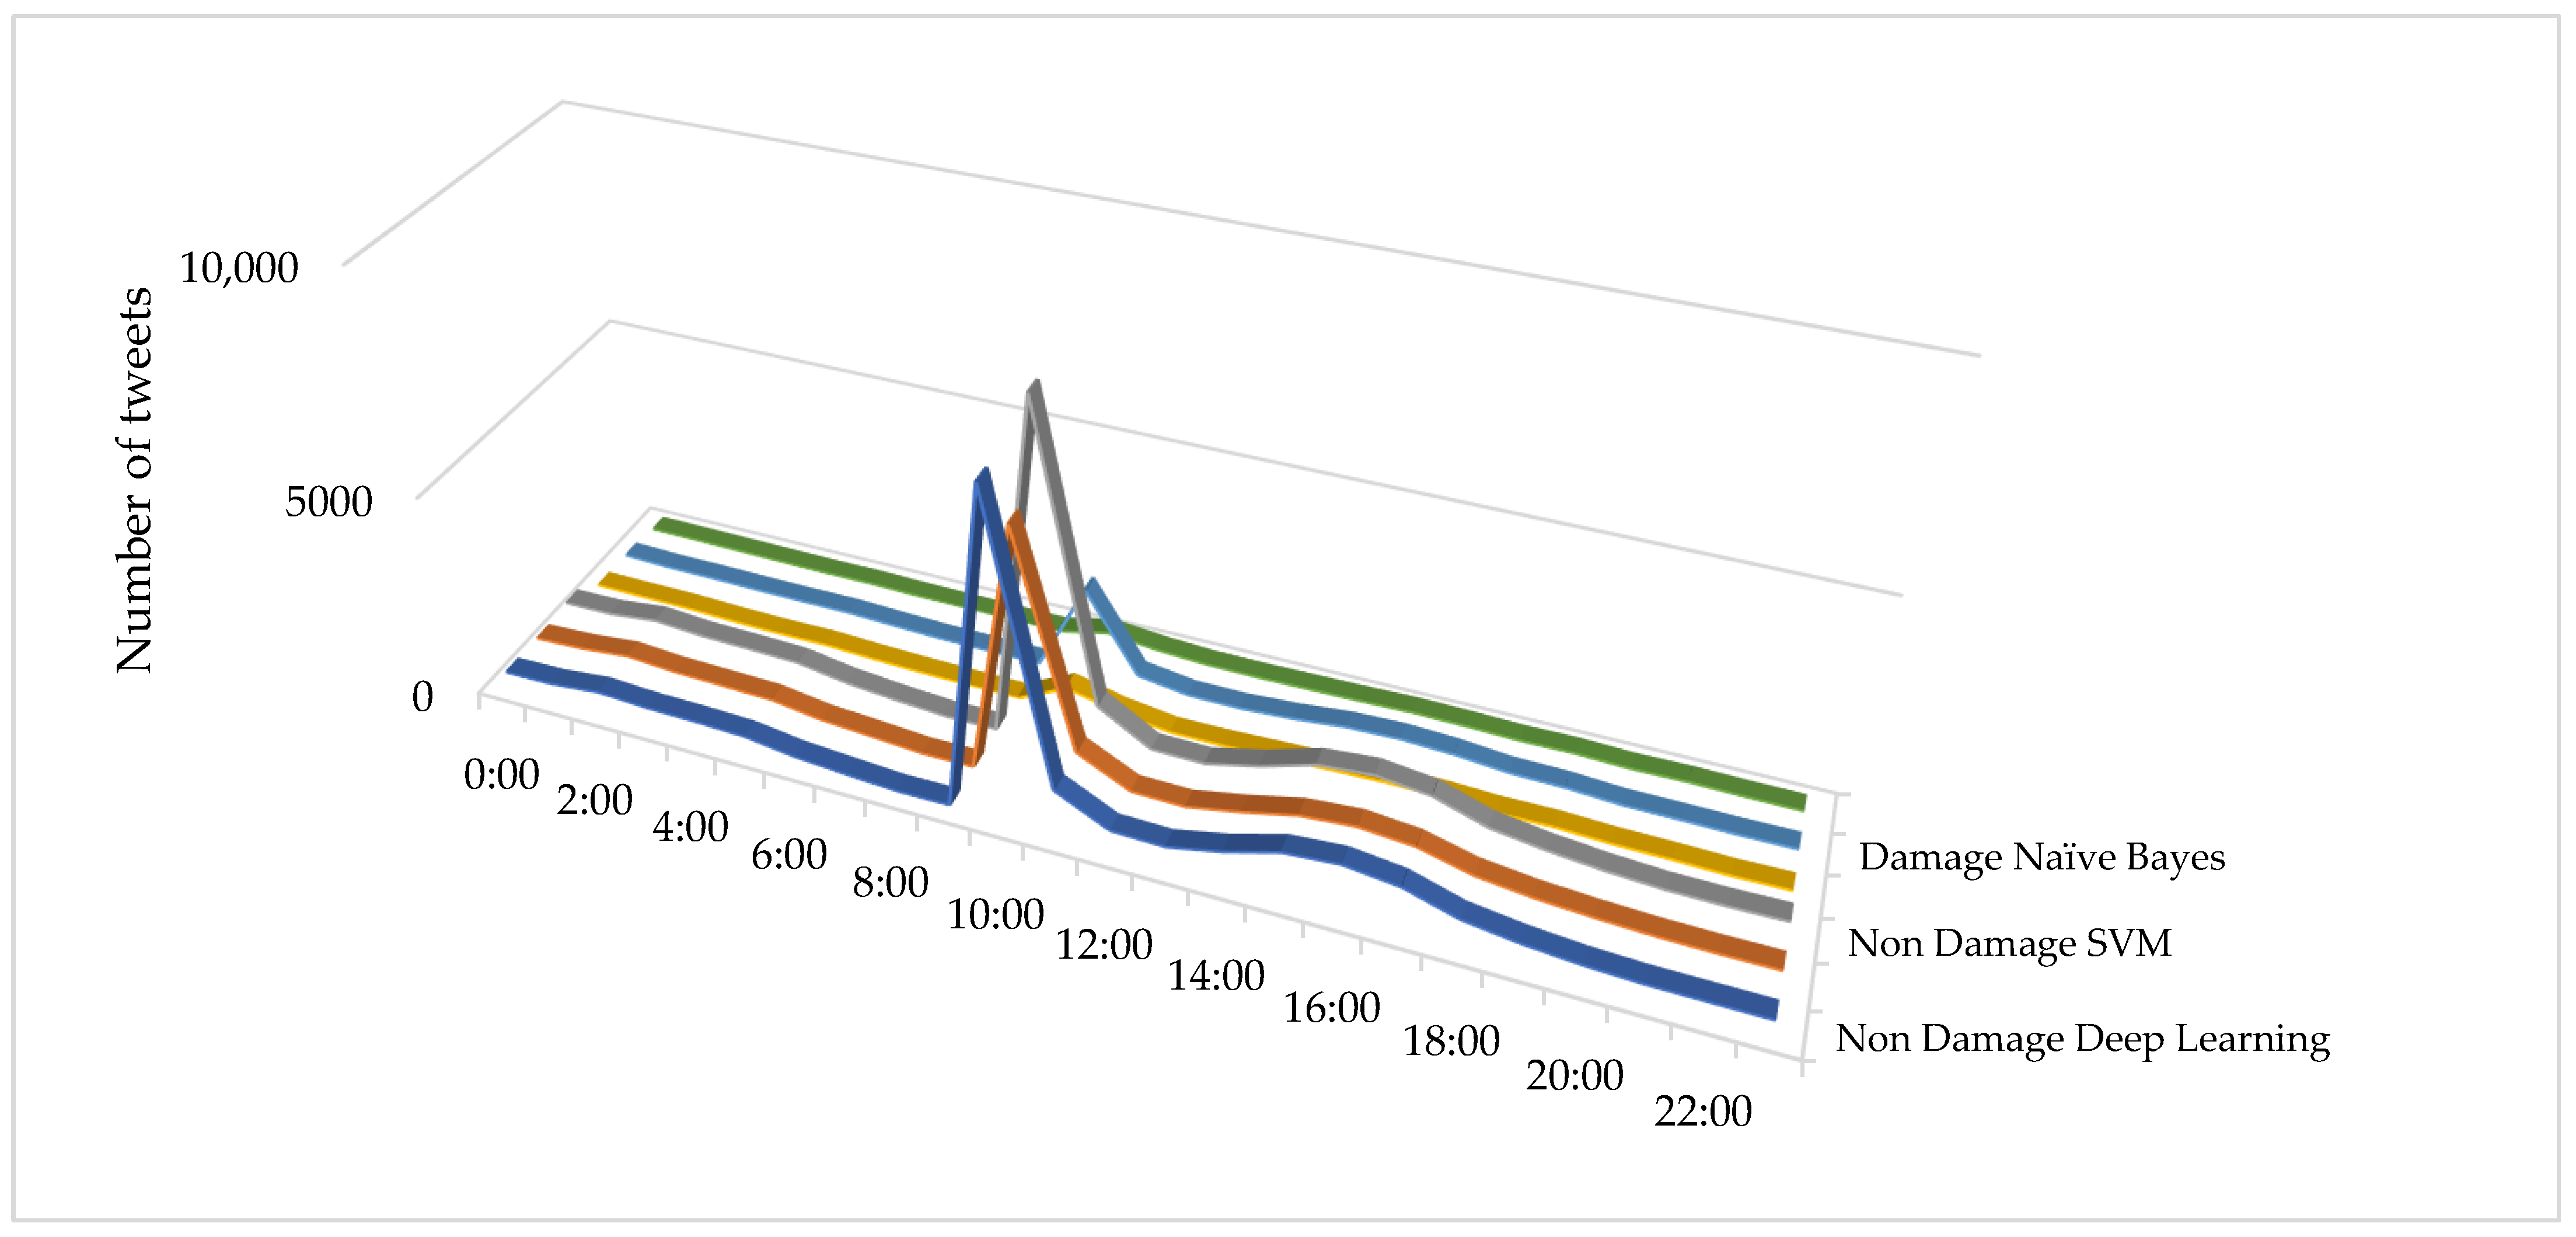
Exchanging crucial information on social networks creates proper options for raising awareness of the disaster circumstance among individuals, and allows for more effective targeting of their attempts by officials and relief organizations. So, in this section, based on the results of multi-class classification, the temporal and spatial analysis will be introduced.
  • Temporal analysis
Topics of the conversation differ on social networks throughout various crises. One variable that could lead the conversation topic to vary is the different support demands of the impacted individuals. To comprehend the temporal variability among various classes of information, the distribution of categorized tweets was examined over time. The classes incorporated in this research classification, which depict multiple requirements for situational awareness, were injured, dead, and missing people; infrastructure; donation; response effort; and other relevant information (this included information are about shelter and supplies, caution and advice, and so on) [10].
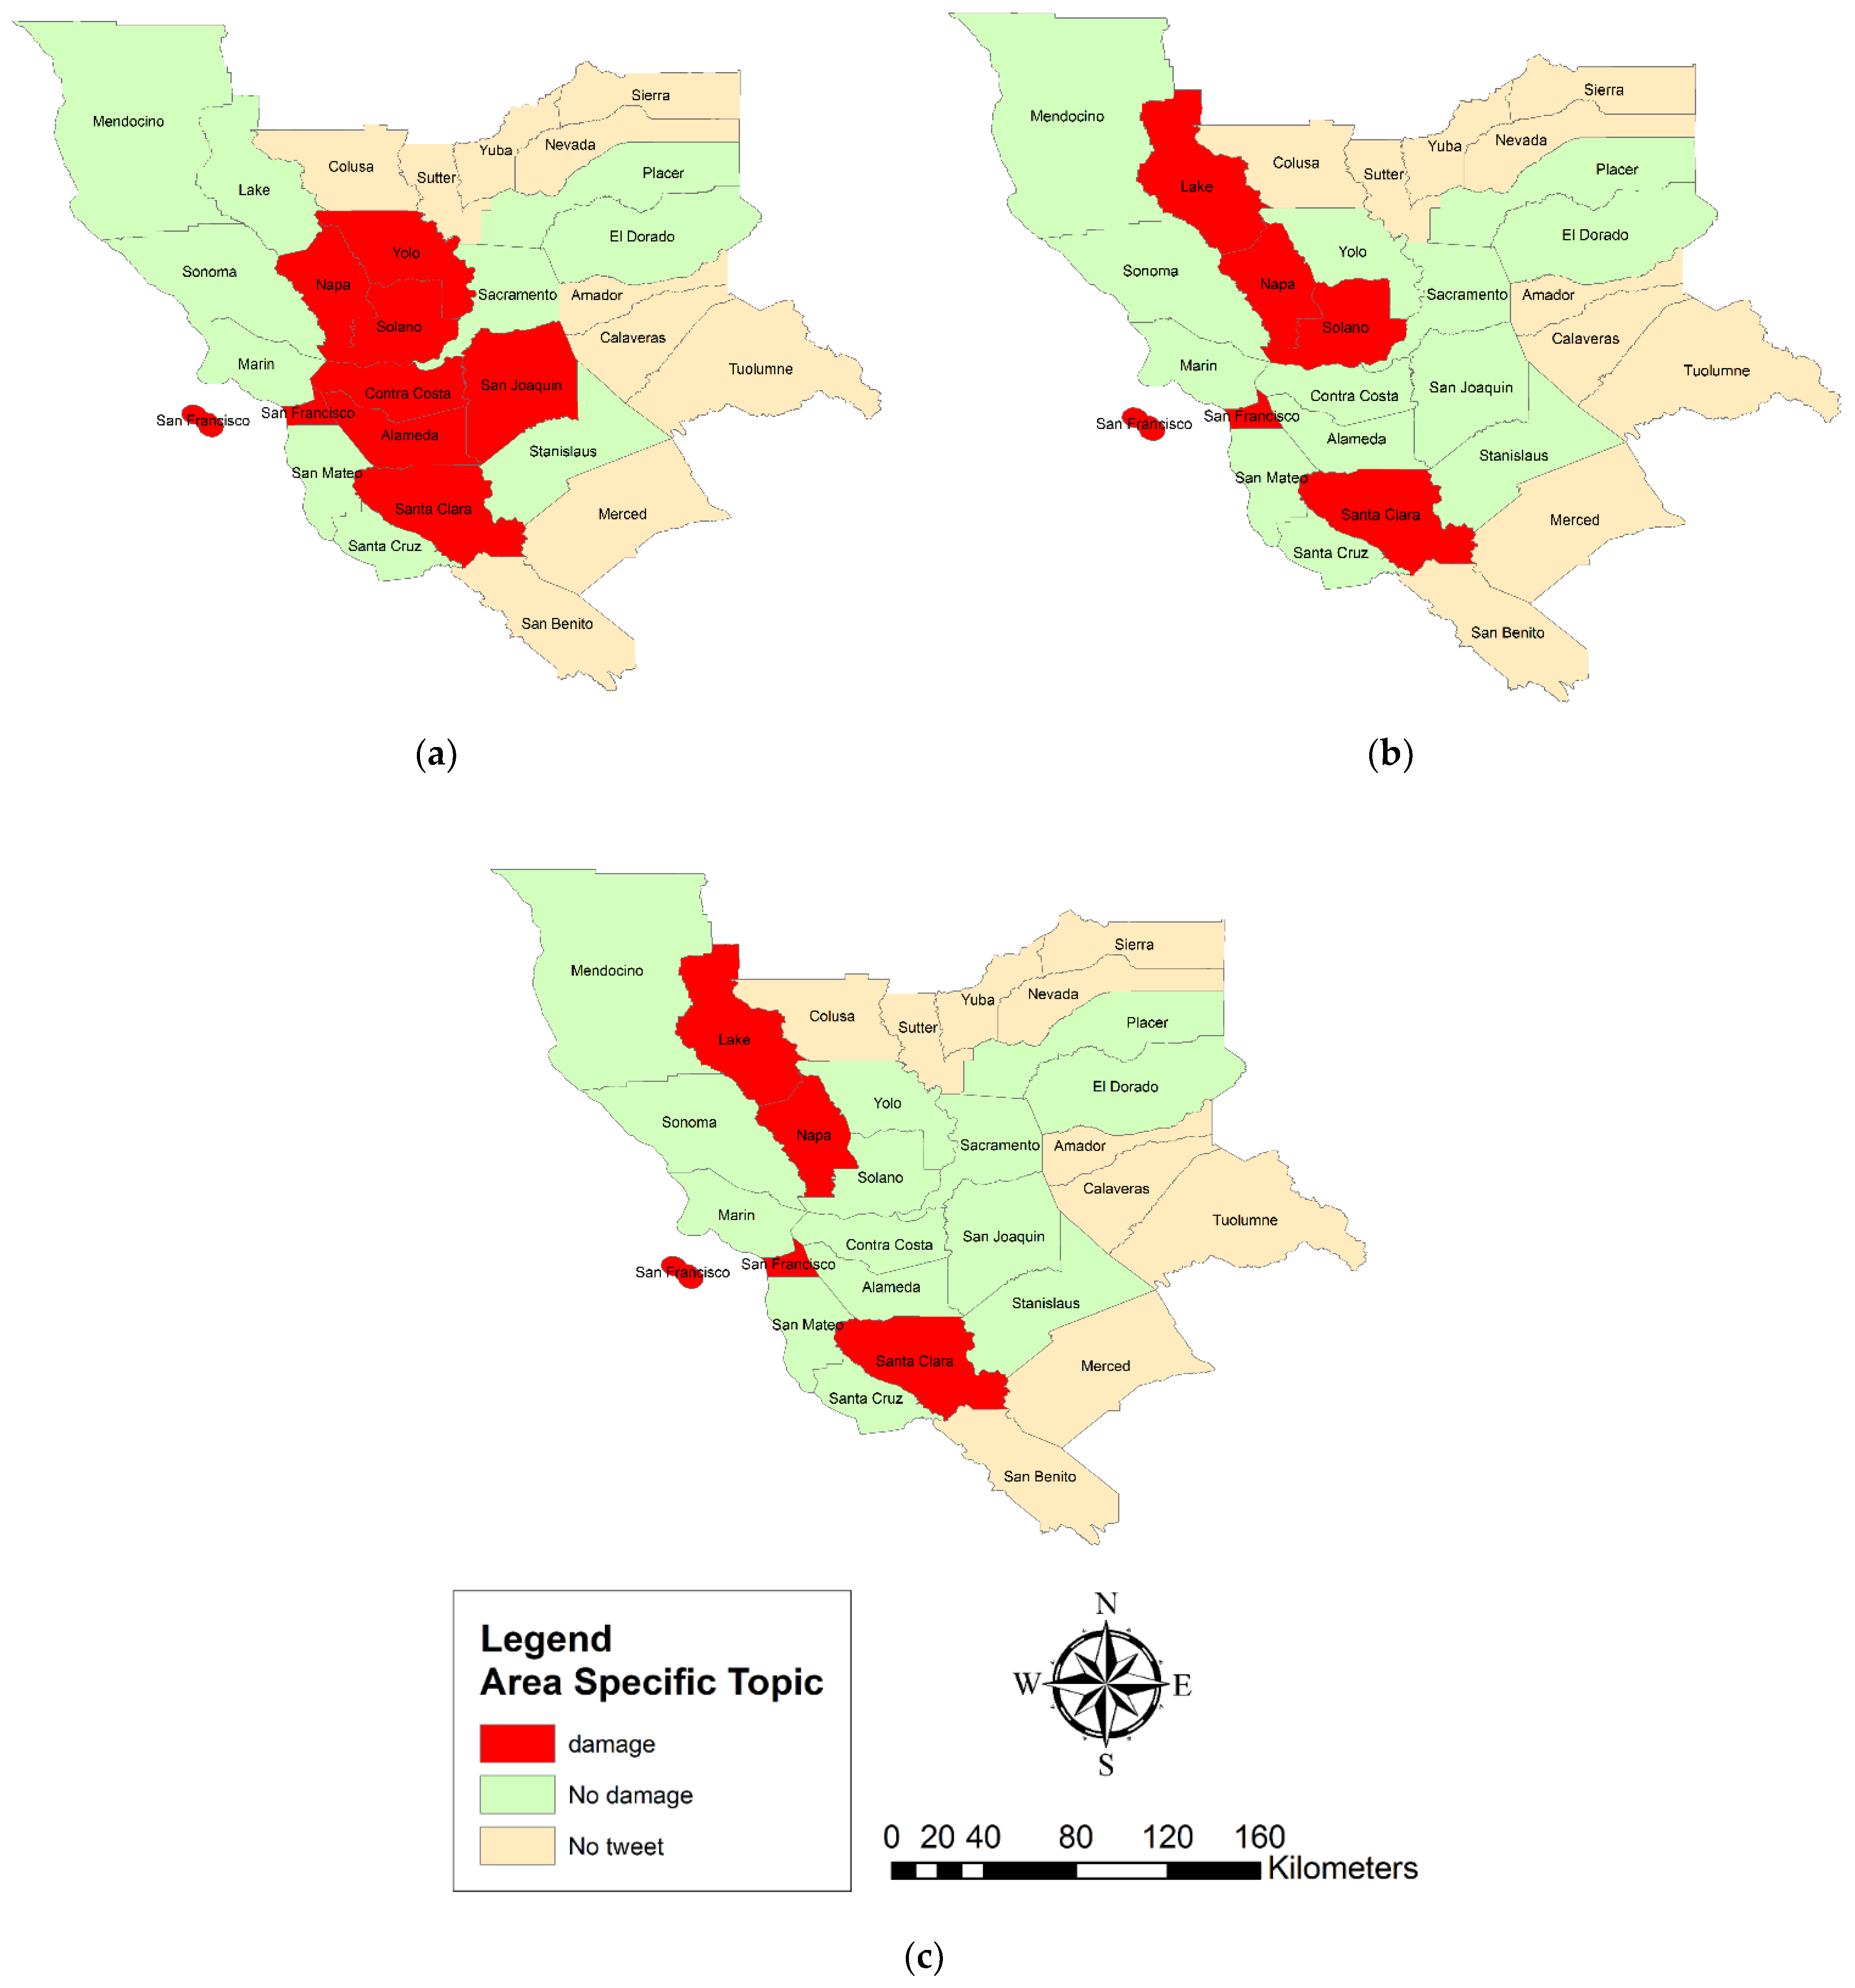
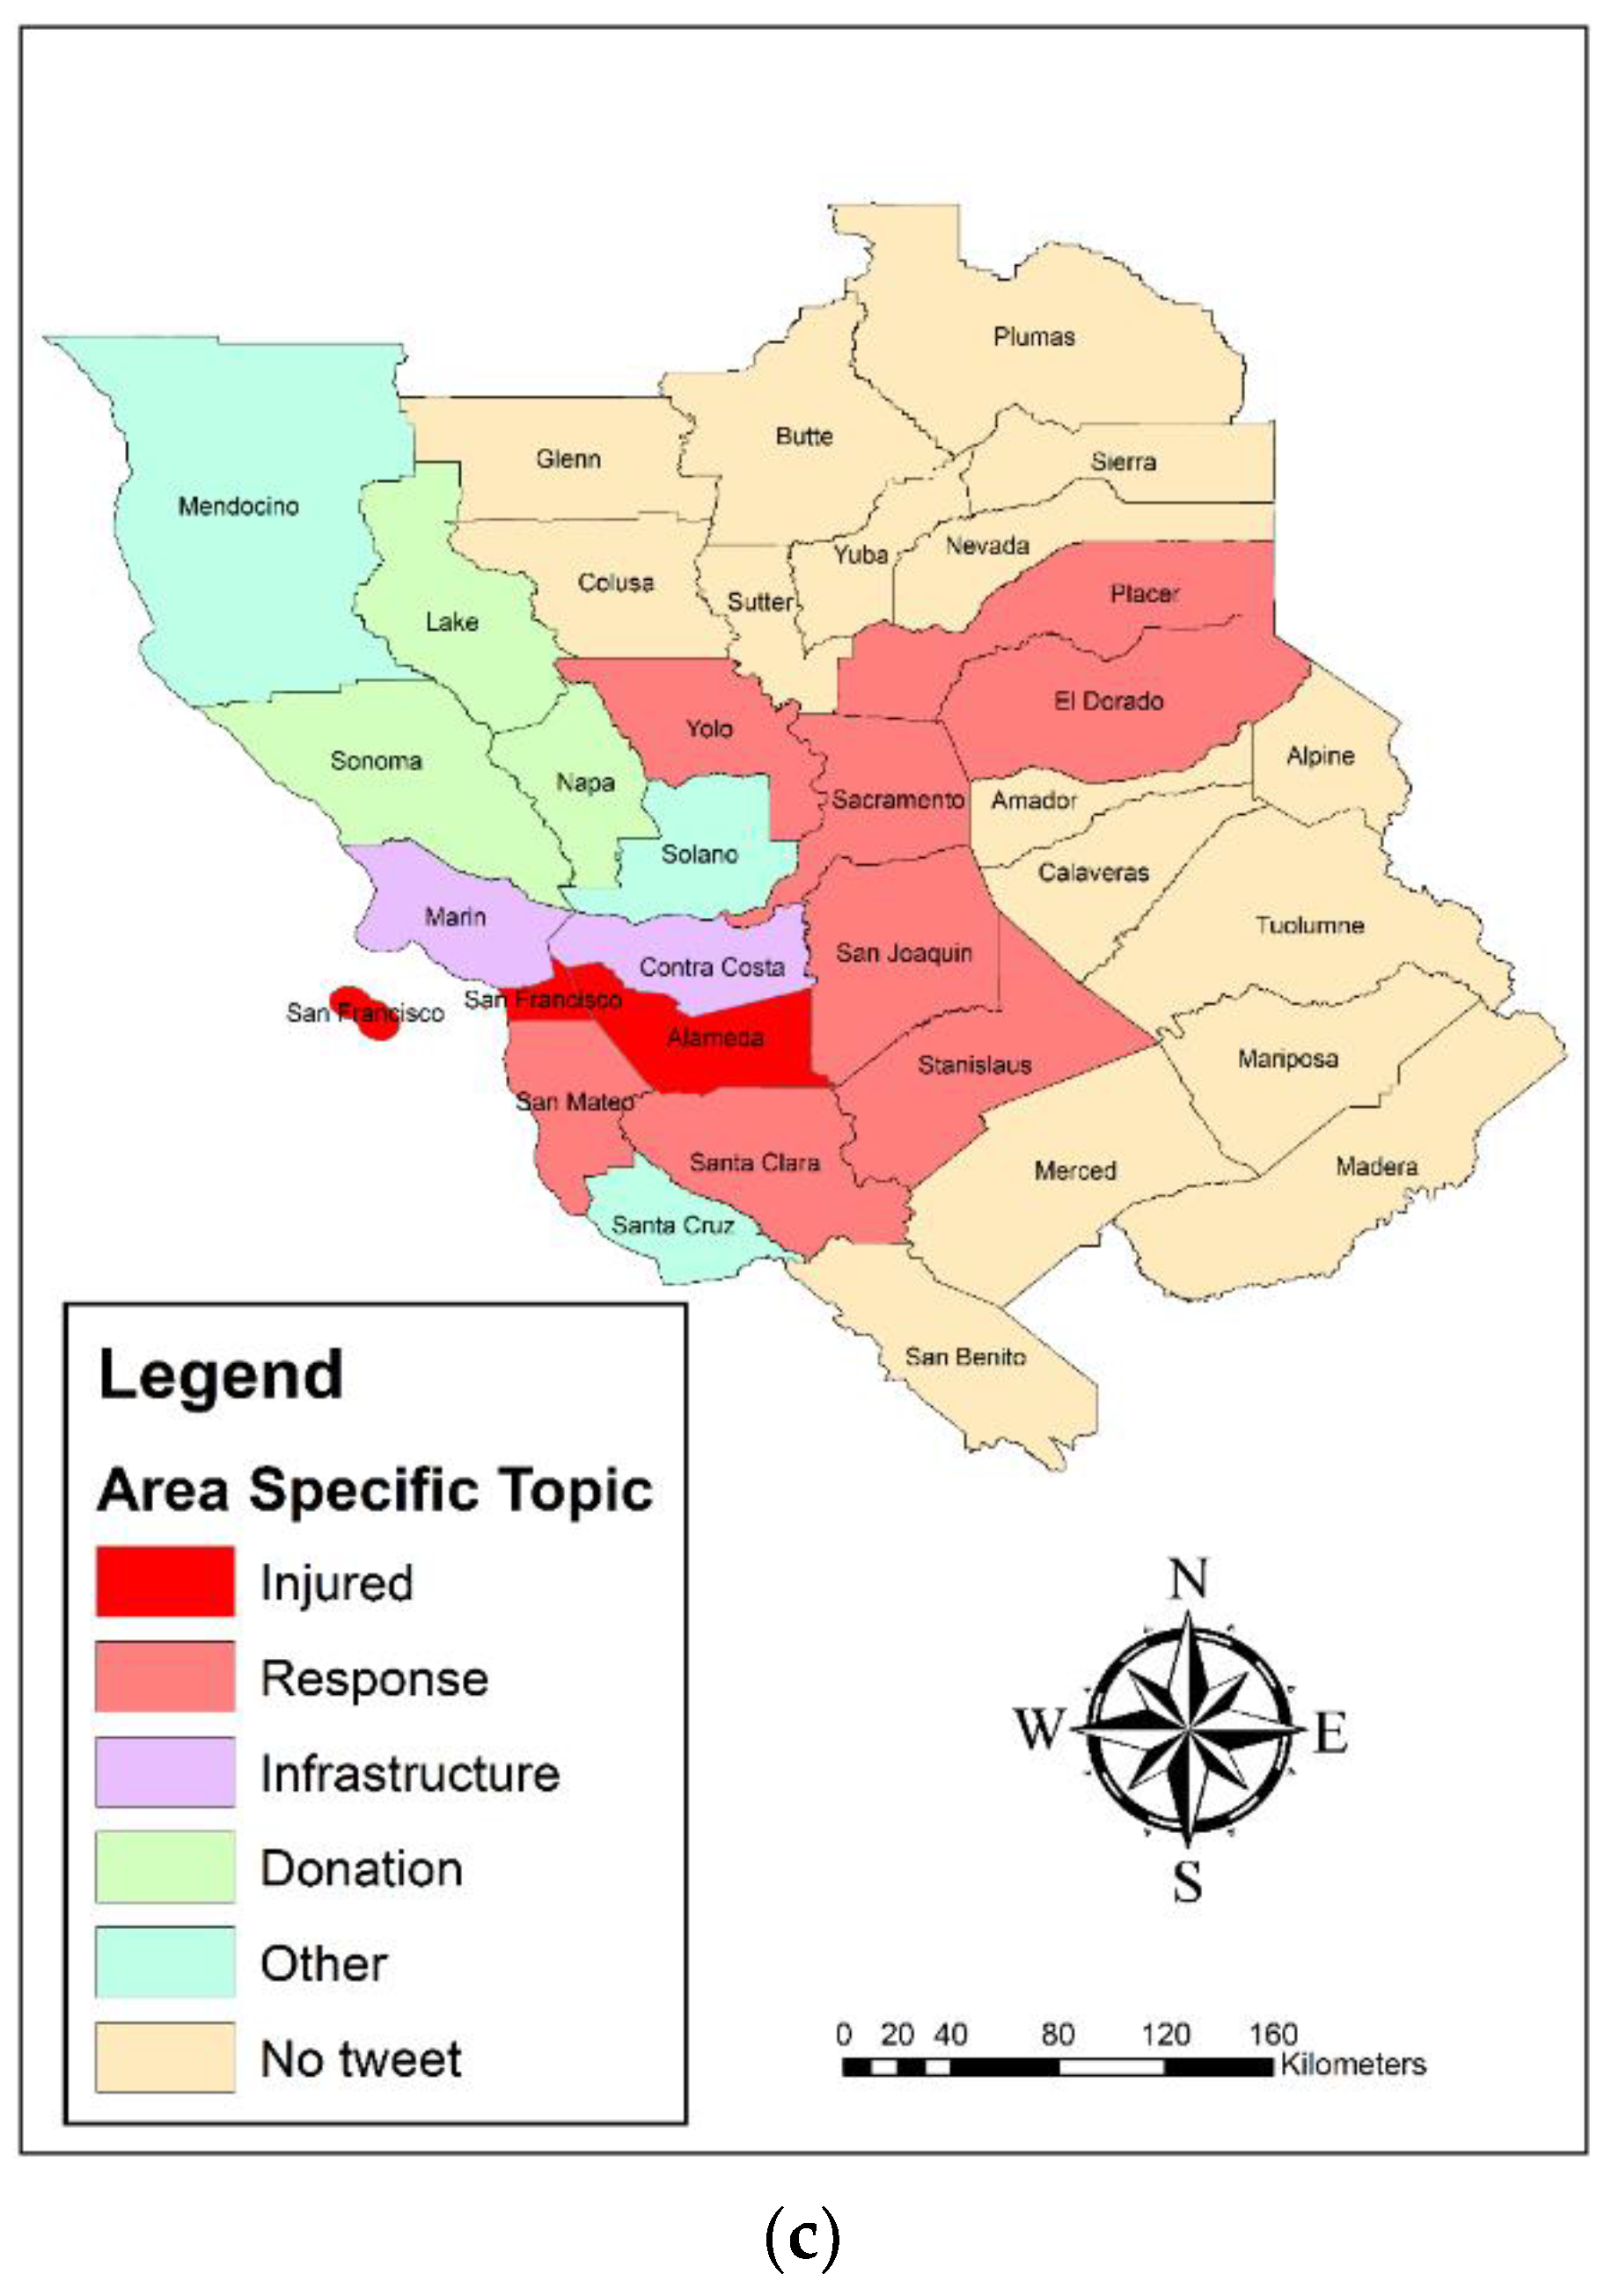
  • Spatial analysis (identifying region-particular topic)
LQ historically has been applied to measure manufacturing or job requirements in the local and national economies. LQ could be used to identify the concentration of phenomena of interest in relation to other events in the special region. In this study, LQ was used to analyze the spatial concentration of discussion topics relating to earthquake crises on the social network. LQ is depicted as a percentage proportion of a specific topic at spatial county unit as compared to the proportion of that exact topic in the state of California in total. LQ is calculated according to Equation (1):
L Q i k = X i k i n X i k / Y i k i n Y i k
where X i k represents the number of messages with particular topic k in county i, Y i k represents the total number messages in county i, and n is the total number of counties in California state. In other words, LQ analyzes the comparative concentration of particular topics in a county in the state of California divided to other counties. A value of L Q i k higher than 1 represents the concentration of particular topic k in county i was lower than other counties in the state of California; and, a L Q i k lower than 1 shows a lesser concentration of particular topic k in county i than the state. Hence, the particular subject with the greatest LQ value greater than 1 is the most concentrated one for a specified county. In this regard, in this study, the topic with the greatest LQ value was chosen as the topic particular to the county.

4.5. Damage Assessment

Damage assessment based on social networks can be obtained by the activity-based approach [4]. A standard activity measure is the ratio of messages posted for each scale (spatial unit), which is substantially associated with per capital official damage [21]. In this research, the number of damage-related tweets per population of each spatial unit was applied for the estimation of earthquake damage in three spatial units, which included county, city, and 10 × 10 km grids.

4.6. Validation

For validation, the damage identified by our approach was compared with the official map by the US Geological Survey (USGS), which it was obtained from their portal. The FEMA (Federal Emergency Management Agency) HAZUS loss model was used for earthquake damage validation. We used fundamental Equation (2) to create a simulated earthquake official damage map.
Loss = Hazard × Vulnerability × Exposure
In Equation (2), Hazard represents earthquake intensity by USGS. The intensity of the earthquake takes into account the magnitude of ground shaking at a distance from the epicenter and offers a specific estimate of the probable damage. The HAZUS building grid was applied for exposure and vulnerability variables, which included data on the compiled building category and building costs [5]. The HAZUS map consists of two fields, AEL and APEL. AEL has estimated annualized earthquake losses for a specific spatial unit. APEL is annualized earthquake loss ratio (AELR), which is computed as the AEL proportion of a particular spatial unit compared to that unit’s complete building value. AELR is multiplied by 100 to enable analysis and conversation and is called an annualized earthquake loss (APEL) percent. Therefore, the APEL field information, along with the PGA data layer, was used to evaluate the results of the damage map with the HAZUS map [38].
To validate the produced damage map by each algorithm at a 10 × 10 km grid spatial unit, confusion matrix, Spearman’s Rho, Kendall’s tau, and Pearson correlation were applied. To validate the produced damage map at the city and county spatial units, Spearman’s Rho, Kendall’s tau, and Pearson correlation were applied. The 10 × 10 km grid spatial unit produced a damage map based on our approach, and the official map was classified into 4 classes (weak, strong, very strong, and severe). Then, the statistical indices, including accuracy, precision, recall, and F-measure, were computed based on the confusion matrix according to Equations (3)–(6):
Overall Accuracy = TP+TN/(TP + FP+ TN+ FN)
Precision = TP/(TP + FP)
Recall = TP/(TP + FN)
F-score = 2 × ((Precision × Recall)/(Precision + Recall))
where:
  • True Positives (TP): These are items in which predicted damage was also damage in reality.
  • True Negatives (TN): Predicted non-damage was, in reality, non-damage.
  • False Positives (FP): Predicted damage was, in reality, non-damage.
  • False Negatives (FN): Predicted non-damage was, in reality, damage.
The Pearson correlation is a commonly utilized index of correlation. It is a metric of the linear correlation of two, i and j, parameters. Where i is the anount of damage estimated by our approach at three spatial units and j is the value of official loss model at three scales (spatial units). The range of values are among +1 to −1, in which 1 is a complete positive linear correlation, 0 is no linear correlation, and −1 is a complete negative linear correlation [44].
The Spearman’s Rho among two parameters is identical to the Pearson among these two parameters’ rank values. Though Pearson’s evaluates linear relations, Spearman’s evaluates monotonous (linear or non-linear) relations. Spearman’s Rho is computed as Equation (7):
ρ = 1 6 i F i 2 N ( N 2 1 )
where N is the number of spatial units (city, county, and grids) and Fi = risi is the difference between the factual ranking (damage ranking based on our approach at each of the three spatial units) and the expected ranking (damage ranking based on official loss model data at each of the three spatial units). It could be any value between −1 to 1, and the nearer the measure’s absolute value to 1, the greater the relationship and −1 indicates a strong negative correlation. In addition, the value of 0 indicates a lack of correlation. In contrast to the Pearson coefficient, the Spearman coefficient is not sensitive to outliers since it works computations on the ranks, so the distinction among actual values is meaningless [17].
Kendall’s tau is a non-parametric metric of the connection among the ranked data columns. It is applied to assess the ordinal relation among two observed quantities. The index gets back a value of 0 to 1, where 0 is no relationship, 1 is a complete relationship. This coefficient considers two concepts of concordant and discordant. Concordant pairs are how many larger ranks are below a certain rank, and discordant pairs are how many lower ranks are below a certain rank. Kendall’s tau is computed according to Equation (8) [44]:
Kendall’s tau = (C − D/C + D)
where, C and D, respectively, depict the sum of concordant and discordant columns.
Using these coefficients, we evaluated the validity of our approach at three scales (spatial units) in identifying the most damaged regions compared to the official loss model map.

5. Results

In this section, results of classification; temporal and spatial analysis; damage estimation at the county-, city-, and grid-level via three algorithms; and damage map validation are presented.

5.1. Classification

In this study, binary classification and multi-class classification have been done. Binary classification is used to classify messages into two classes of damage and non-damage so that their results can finally be used to estimate the earthquake damage. Multi-class classification is used to categorize messages to increase post-crisis situational awareness and to monitor the process of changing conditions over time and to determine the concentration of various topics in different locations.
For classification, the pre-processed data were divided into training and test data. Then, based on the training data of each trained classification model and then using the test data, the accuracy of the prediction models were evaluated.
  • Binary classification
For binary classification, the final dataset comprised 26,942 tweets that were manually labeled to produce the training dataset of 5038 (including 4031 non-damage and 1007 damage) tweets. This dataset was divided into two sections. 70% of them were used for training and 30% of them are used for testing. Precision, accuracy, recall, Kappa, and F-measure were used for evaluating the performance of binary classification algorithms. Table 1 demonstrates the performance of Naive Bayes, SVM, and deep learning binary classification.
In Table 1, precision and recall were obtained from the average of two damage and non-damage classes by equal weight. The results of Table 1 show that the SVM algorithm performed better in all the indices and Naive Bayes algorithm performed poorly in all the indices. The deep learning algorithm also performed moderately in all of the indicators. However, its results were closer to SVM than to Naive Bayes.
  • Multi-class classification
For multi-class classification, Neguyan et al. [16] datasets, including 14,006 earthquake-labeled tweets (Napa and Nepal earthquake labeled datasets (https://crisisnlp.qcri.org/), accessed on 16 October 2019) were used to create the training dataset. This dataset was split into two categories—60% of them were applied for training and 40% of them were applied for testing. The results show SVM classifier accurately identified damage-related messages. Precision, accuracy, recall, Kappa, and F-measure were used for evaluating the performance of multi-class classification algorithms. Table 2 demonstrates the performance of Naive Bayes, SVM, and deep learning multi-class classification.
In Table 2, precision and recall were obtained from the average of all five classes by equal weight. The results of Table 1 show that the SVM algorithm performed better in all the indices and maïve Bayes algorithm performed relatively poorly in all the indices. The deep learning algorithm also performed moderately in all of the indicators.

5.2. Temporal and Spatial Analysis

In this section temporal and spatial analysis are presented.
  • Temporal analysis
Individuals’ concerns about a disaster will vary as the disaster evolves. For example, at the beginning of an earthquake, most of the messages may be related to damage and infrastructure, followed by discussions about donations and endowments. The topics shared on social networks are almost an example of the public’s thoughts. In this study, temporal patterns of binary classification topics (damage and non-damage) and multi-class classification topics (injured, dead, and missing people; infrastructure; donation; response effort; and other relevant information) via three classification algorithms were investigated.
Figure 4 shows the number of tweets classified using three classification algorithms, Naive Bayes, SVM, and deep learning, on two classes of damage and non-damage on each day one week after the earthquake (August 24). Naive Bayes classification algorithm (Figure 4) showed that among the tweets collected on the day of the earthquake, 26.05% of the tweets (4698 tweets) reported earthquake damage and the rest (13,336 tweets) did not report damage. In addition, most of the damage-related messages related to the earthquake day and decreased in the following days. In addition, the results of the SVM classification algorithm (Figure 4) showed that among the tweets collected on the day of the earthquake, 6.61% of tweets (1193 tweets) reported earthquake damage and the rest of the tweets (16,841 tweets) did not report damage. After the day of the earthquake, 5185 tweets were collected, out of the tweets collected after the day of the earthquake, 12.44% of the tweets (645 tweets) showed damage caused by the earthquake and the rest (4540 tweets) reported no damage. The results of the deep learning algorithm (Figure 4) also showed that 13.36% of tweets (2410 tweets) reported damage from earthquakes on the day of the earthquake and the rest of tweets (15,624 tweets) did not show damage. Among the tweets collected after the day of the earthquake, 25.86% of tweets (equivalent to 1341 tweets) reported damage caused by the earthquake and the rest of tweets (3844 tweets) did not show damage.
In general, in all three classification algorithms, most of the damage-related messages corresponded to the earthquake day and decreased in the following days. In addition, Naive Bayes extracted the most damage-related messages and SVM has extracted the least damage-related messages.
Figure 5 shows the distribution of tweets classified in five classes on each day a week before and after the earthquake (24 August) for the Naive Bayes, SVM, and deep learning classification algorithms. According to the results of Naive Bayes (Figure 5), it can be seen that the tweets collected on the day of the earthquake had the lowest number of tweets for the “Injured_Dead_and_Missing_people”, “Donation”, and “Infrastructure” classes, respectively with 1.54 percent (279 tweets), 4.82 percent (869 tweets), and 5.27 percent (951 tweets). The highest number of tweets also belonged to the “Other_relevant_information” and “Response_efforts” classes, with 80.71% (14,556 tweets) and 7.64% (1379 tweets), respectively. In addition, among the tweets collected in the days following the earthquake, 0.62% (32 tweets), 0.73% (39 tweets), and 4.32% (224 tweets) belonged to the “Donation”, “Injured_Dead_and_Missing_people”, and “Infrastructure” classes, and 5.57% (289 tweets) and 88.74% (4601 tweets) tweets belonged to the “Injured_Dead_and_Missing_people” and “Other_relevant_information” classes, respectively. According to SVM algorithm results (Figure 5), no tweets collected on the day of the earthquake were classified in the “Injured_Dead_and_Missing_people”, “Donation”, and “Infrastructure” classes. The number of tweets in the “Other_relevant_information” and “Response_efforts” classes was 99.97% (18,030 tweets) and 7.64% (1379 tweets), respectively, among the tweets collected on the day of the earthquake. The results of the deep learning model (Figure 5) also showed that the number of tweets collected on the day of the earthquake had the lowest number of tweets for the “Donation”, “Infrastructure”, and “Response_efforts” classes, respectively, with 0.38% (104 tweets), 2.96% (797 tweets), and 6.62% (1779 tweets). The highest number of tweets also belonged to the “Other_relevant_information” and “Injured_Dead_and_Missing_people” classes, with 80.79% (21,711 tweets) and 9.23% (2482 tweets), respectively. In addition, the tweets collected in the days after the earthquake, amounting to of 0.6% (31 tweets), 4.38% (227 tweets), and 5.01% (260 tweets), related to classes “Donation”, “Infrastructure”, and “Response_efforts”, respectively. In addition, 5.09% (264 tweets) and 84.92% (4403 tweets) belonged to the classes “Injured_Dead_and_Missing_people” and “Other_relevant_information”, respectively.
Overall, most of the messages classified in the three algorithms were in the class “Other_relevant_information”. Additionally, most of the messages related to infrastructure damages and injured, dead, and missing people were reported on the day of the earthquake.
Figure 6 shows the total distribution of classified tweets into the two classes of damage and non-damage at each hour of the earthquake day, by the three Naive Bayes, SVM, and deep learning classification algorithms. In total, 42% (11,293 tweets) of tweets were collected between 9 am and 12 pm. The results of Naive Bayes classification algorithm (Figure 6) showed that 25.61% of the collected tweets from 9 am to 12 noon (2893 tweets) reported damage, and the rest of the tweets (8403 tweets) reported no damage. In addition, 28.39 percent of the tweets (7630 tweets) were collected between the hours of 14 and 19, of which 24.66 percent (1882 tweets) reported earthquake damage and 5748 tweets reported no damage. The SVM algorithm’s results (Figure 6) showed that of the 1293 tweets collected between 9 am and 12 noon, 4.77 percent of tweets (539 tweets) reported damage and the rest of the tweets (including 10,757 tweets) reported no damage. In addition, 28.39 percent of tweets (7630 tweets) were collected between the hours of 14 and 19, of which 9.22 percent (704 tweets) reported earthquake damage and 6926 reported no damage. The results of the deep learning algorithm also showed that of the 11,293 tweets collected between 9 am and 12 pm, 10% of tweets (1119 tweets) reported damage, and the rest of the tweets (10,174 tweets) reported no damage. A total of 28.39% of the tweets (7630 tweets) were collected between the hours of 14 and 19, of which 18.6% (1422 tweets) reported earthquake damage and 6208 reported no damage.
In general, all algorithms had a sudden increase in the number of tweets at the time of the earthquake (10 am). There was also another increase in the number of messages at 4 pm, which may be related to the end of office hours and increased activity on social media.
Figure 7 shows the distribution of tweets, classified into five classes, by hour on the day of the earthquake (24 August) for the three—Naive Bayes, SVM, and deep learning—classification algorithms. Examination of the results of Naive Bayes classification algorithm (Figure 7) showed that most tweets classified between 9 am and 12 pm belonged to the classes “Other_relevant_information” and “Response_efforts” with 79.04% (8929 tweets) and 7.26% (821 tweets), respectively. In addition, tweets for the “Donation”, “Infrastructure”, and “Injured_Dead_and_Missing_people” classes amounted to 6.94% (785 tweets), 5.01% (566 tweets), and 1.72% (195 tweets), respectively. According to SVM algorithm results (Figure 7), it can be seen that all tweets classified between 9 am and 12 pm belonged to the “Other_relevant_information” class and only one tweet belongs to the “Infrastructure” class. In addition, the deep learning algorithm results (Figure 7) showed that most tweets classified between 9 am and 12 pm belonged to the classes “Other_relevant_information” and “Injured_Dead_and_Missing_people”, with 33.64% (9041 tweets) and 6.58 percent (1770 tweets), respectively. Additionally the tweets for the “Infrastructure”, “Response_efforts”, and “Donation” classes were 0.98% (265 tweets), 0.67% (182 tweets), and 0.13% (35 tweets) respectively
Figure 7 shows a sudden increase in the number of tweets, at the time of the earthquake (10 am). In addition, the highest increase was for high-urgency classes.
  • Spatial topic concentration
The spatial analysis of social networks could assist us in comprehending the spatial distribution and concentration of emergency topics. For policymakers, this would be helpful for responding to the disaster in a timely manner and with a full understanding of the public concern.
Figure 8 shows the LQ analysis of the tweets’ spatial topic concentration at the county scale, classified by Naive Bayes (a), SVM (b), and deep learning (c) in the two classes of damage and non-damage. According to Figure 8a, most tweets collected from the counties of Napa, Yolo, Solano, Contra Costa, San Joaquin, San Francisco, Almeda, and Santa Clara showed damage. However, according to Figure 8b, the results of the SVM algorithm showed that most tweets collected from Napa, Lake, Solano, San Francisco, and Santa Clara counties and other counties reported no damage. In addition, according to the LQ map derived from the deep learning algorithm results (Figure 8c), most damage tweets were reported in Napa, Lake, San Francisco, and Santa Clara counties.
In all algorithms, Napa, as a center of the earthquake, was considered as having the primary concentration of damage-related messages in all algorithms. This indicates that our approach has been able to identify the damage well and has considered the earthquake center one of the most affected counties. In addition, San Francisco and Santa Clara counties were considered to be damage concentration counties. This may be due to the high urbanization in these two cities, which has led to increased use of social networks and, consequently, more damage-related messages. It is, therefore, suggested that future research consider the effects of urbanization and eliminate its impact on damage estimation.
Figure 9 shows the LQ analysis of the tweets’ spatial topic concentration at the county scale, classified by Naive Bayes (a), SVM (b), and deep learning (c) in the two classes of damage and non-damage. According to the results of the Naive Bayes algorithm (Figure 9a), most of the tweets collected from the Lake, Sonoma, and Santa Clara counties belonged to the “Injured_Dead_and_Missing_people” class, and most of the tweets reported by Marin, Solano, Contra Costa, and Stanislaus were in the “Response_efforts” class. Most of the tweets reported in Napa were of the “Infrastructure” class, and the tweets in Yolo, Almeda, San Francisco, and San Mateo were in the “Donation” class. This indicates that in the center of the earthquake and nearby counties, most of the messages focused on infrastructure damage, injured people, and response, but moving away from the earthquake center, other issues, such as donations, arose.
While according to the LQ map of the SVM algorithm (Figure 9b), most of the tweets collected in San Francisco and San Mateo belonged to the “Response_efforts label” class, and most of the tweets reported in Napa belonged to the “Infrastructure” class. In other counties, most of the reported tweets belonged to the “Other_relevant_information” class. The LQ map of the deep learning algorithm showed that most of the tweets collected from the Almeda and San Francisco counties belonged to the “Injured_Dead_and_Missing_people” class and most of the tweets reported in Yolo, Placer, El Dorado, Sacramento, San Joaquin, Stanislaus, Santa Clara, and San Mateo belonged to the “Response_efforts” class. In addition, most of the tweets in the Marin and Contra Costa counties were from the “Infrastructure” class, and the Lake, Napa, and Sonoma tweets were from the “Donation” class.
Based on Figure 9, it can be generally acknowledged that most of the infrastructure damage-related messages focused on Napa County. This indicates that most damages to infrastructure, buildings, and roads occurred in the center of the earthquake.

5.3. Damage Estimation

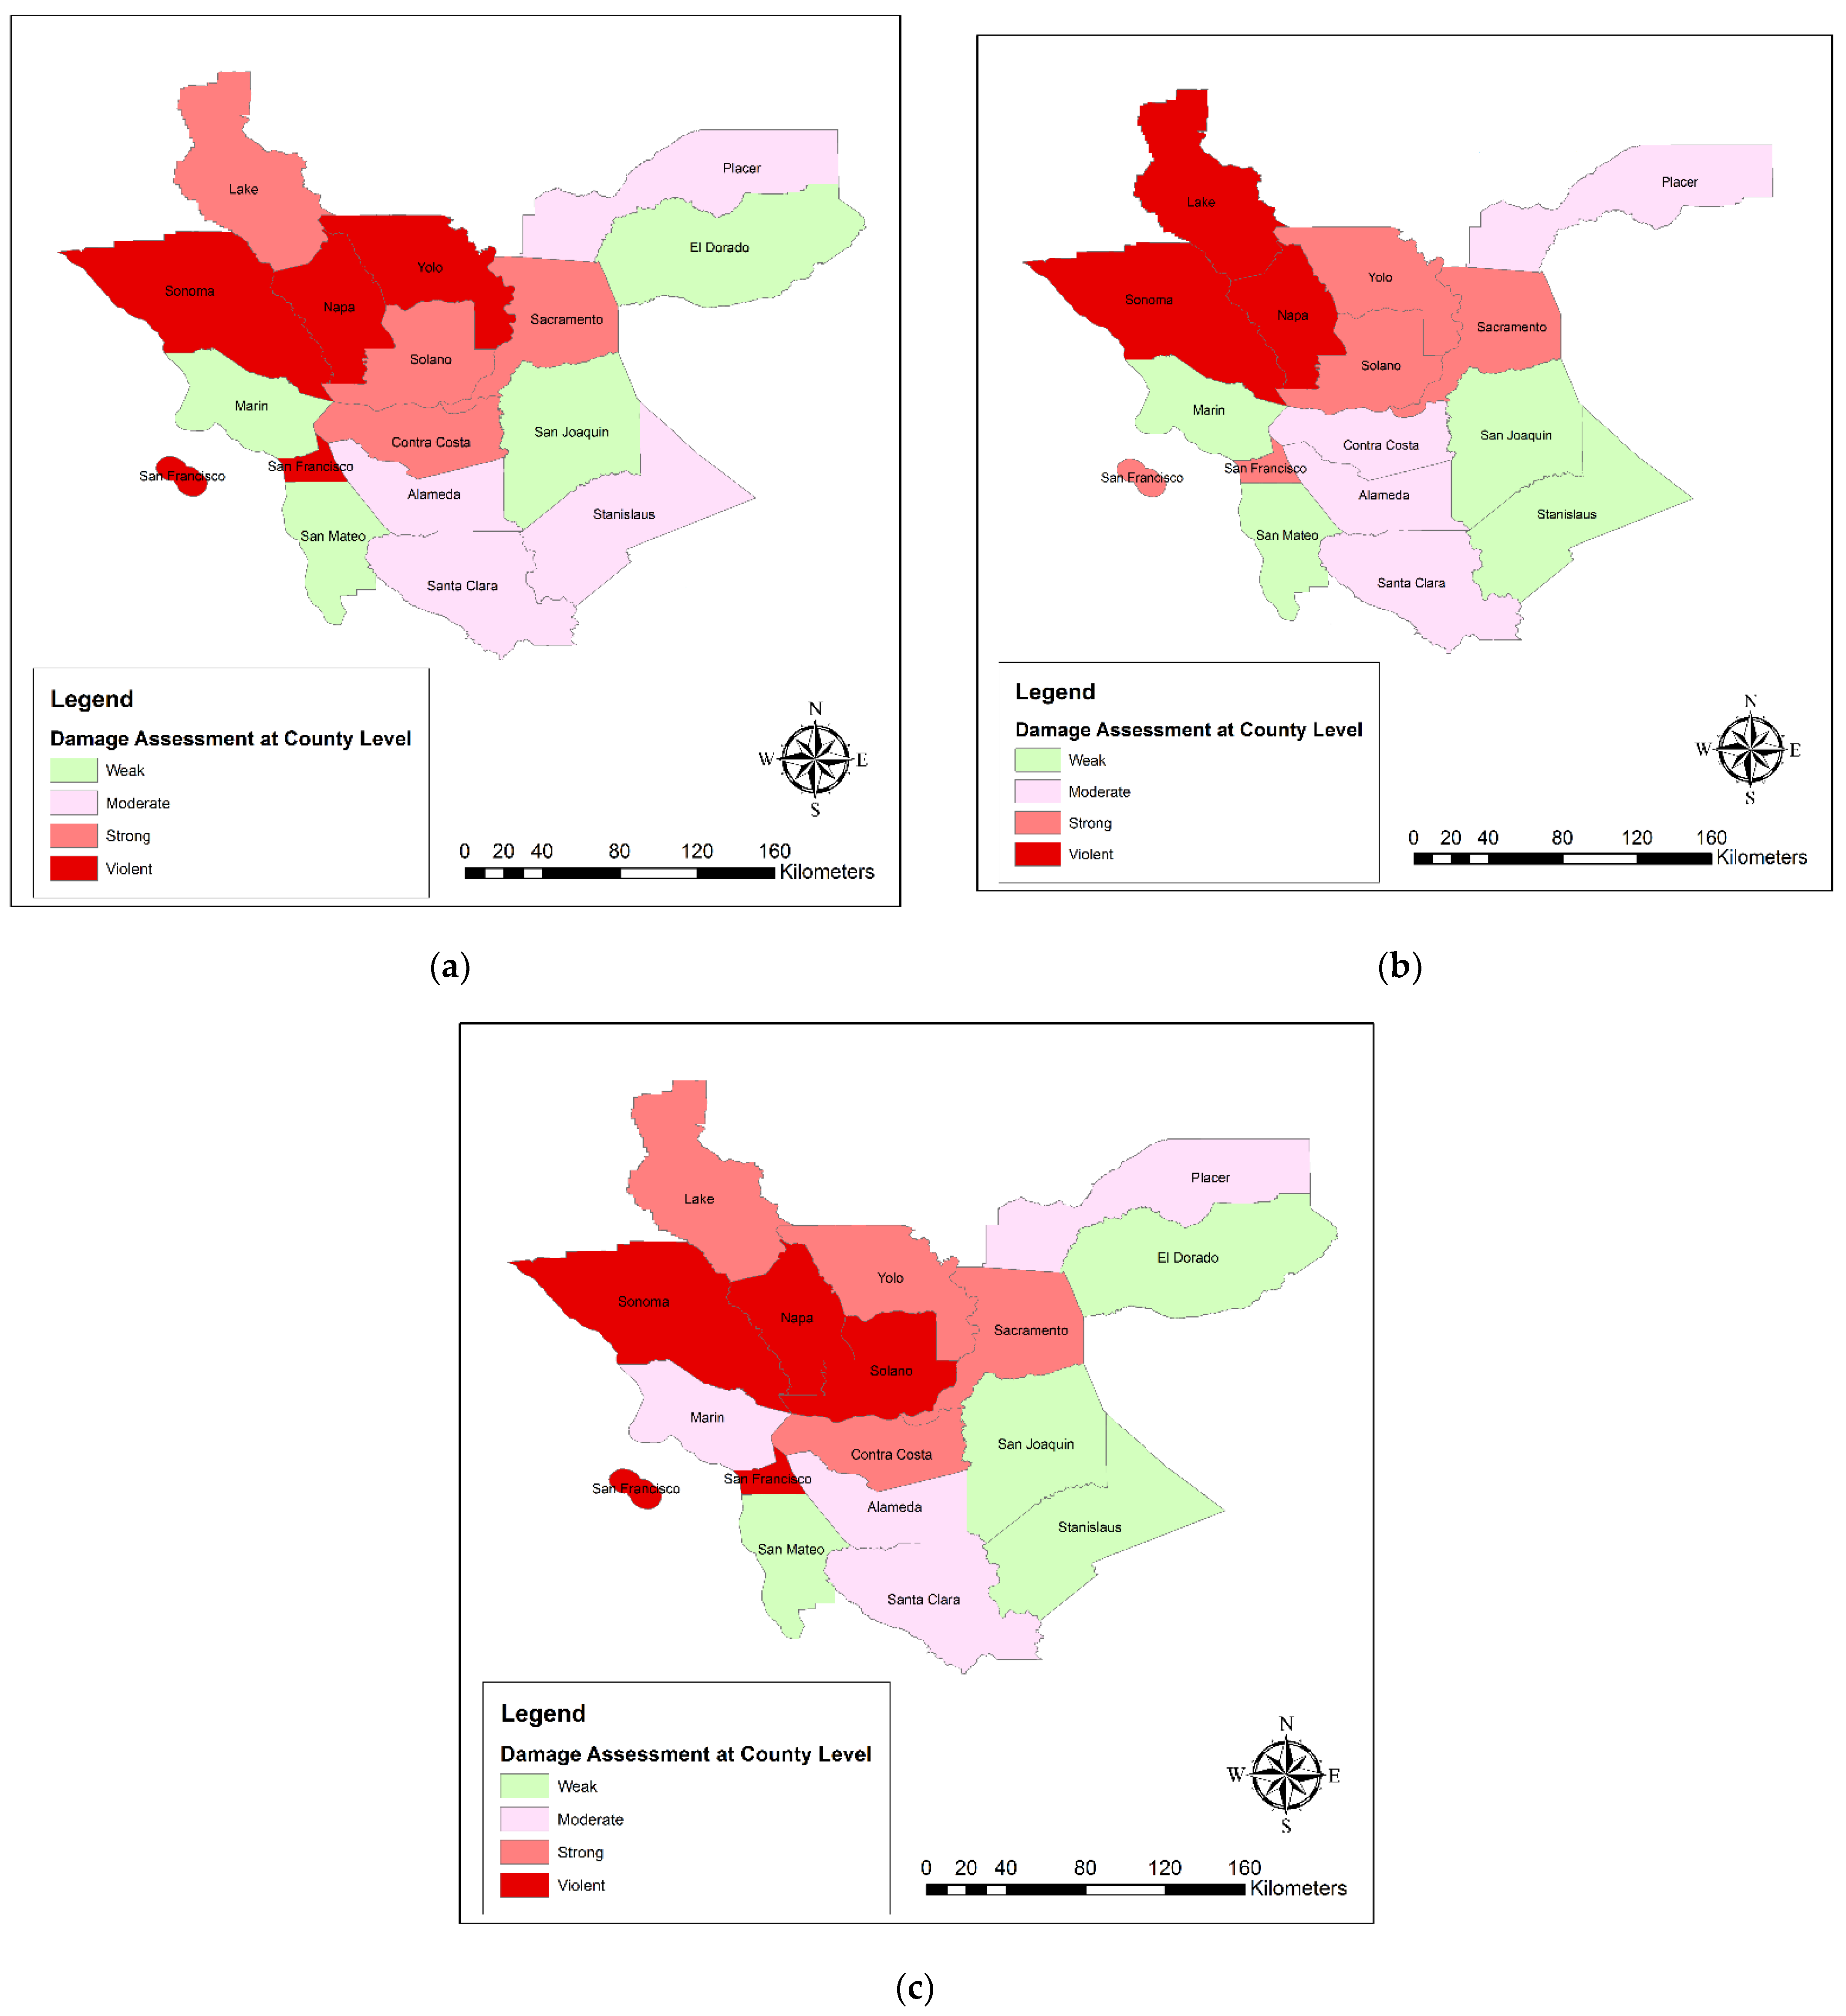
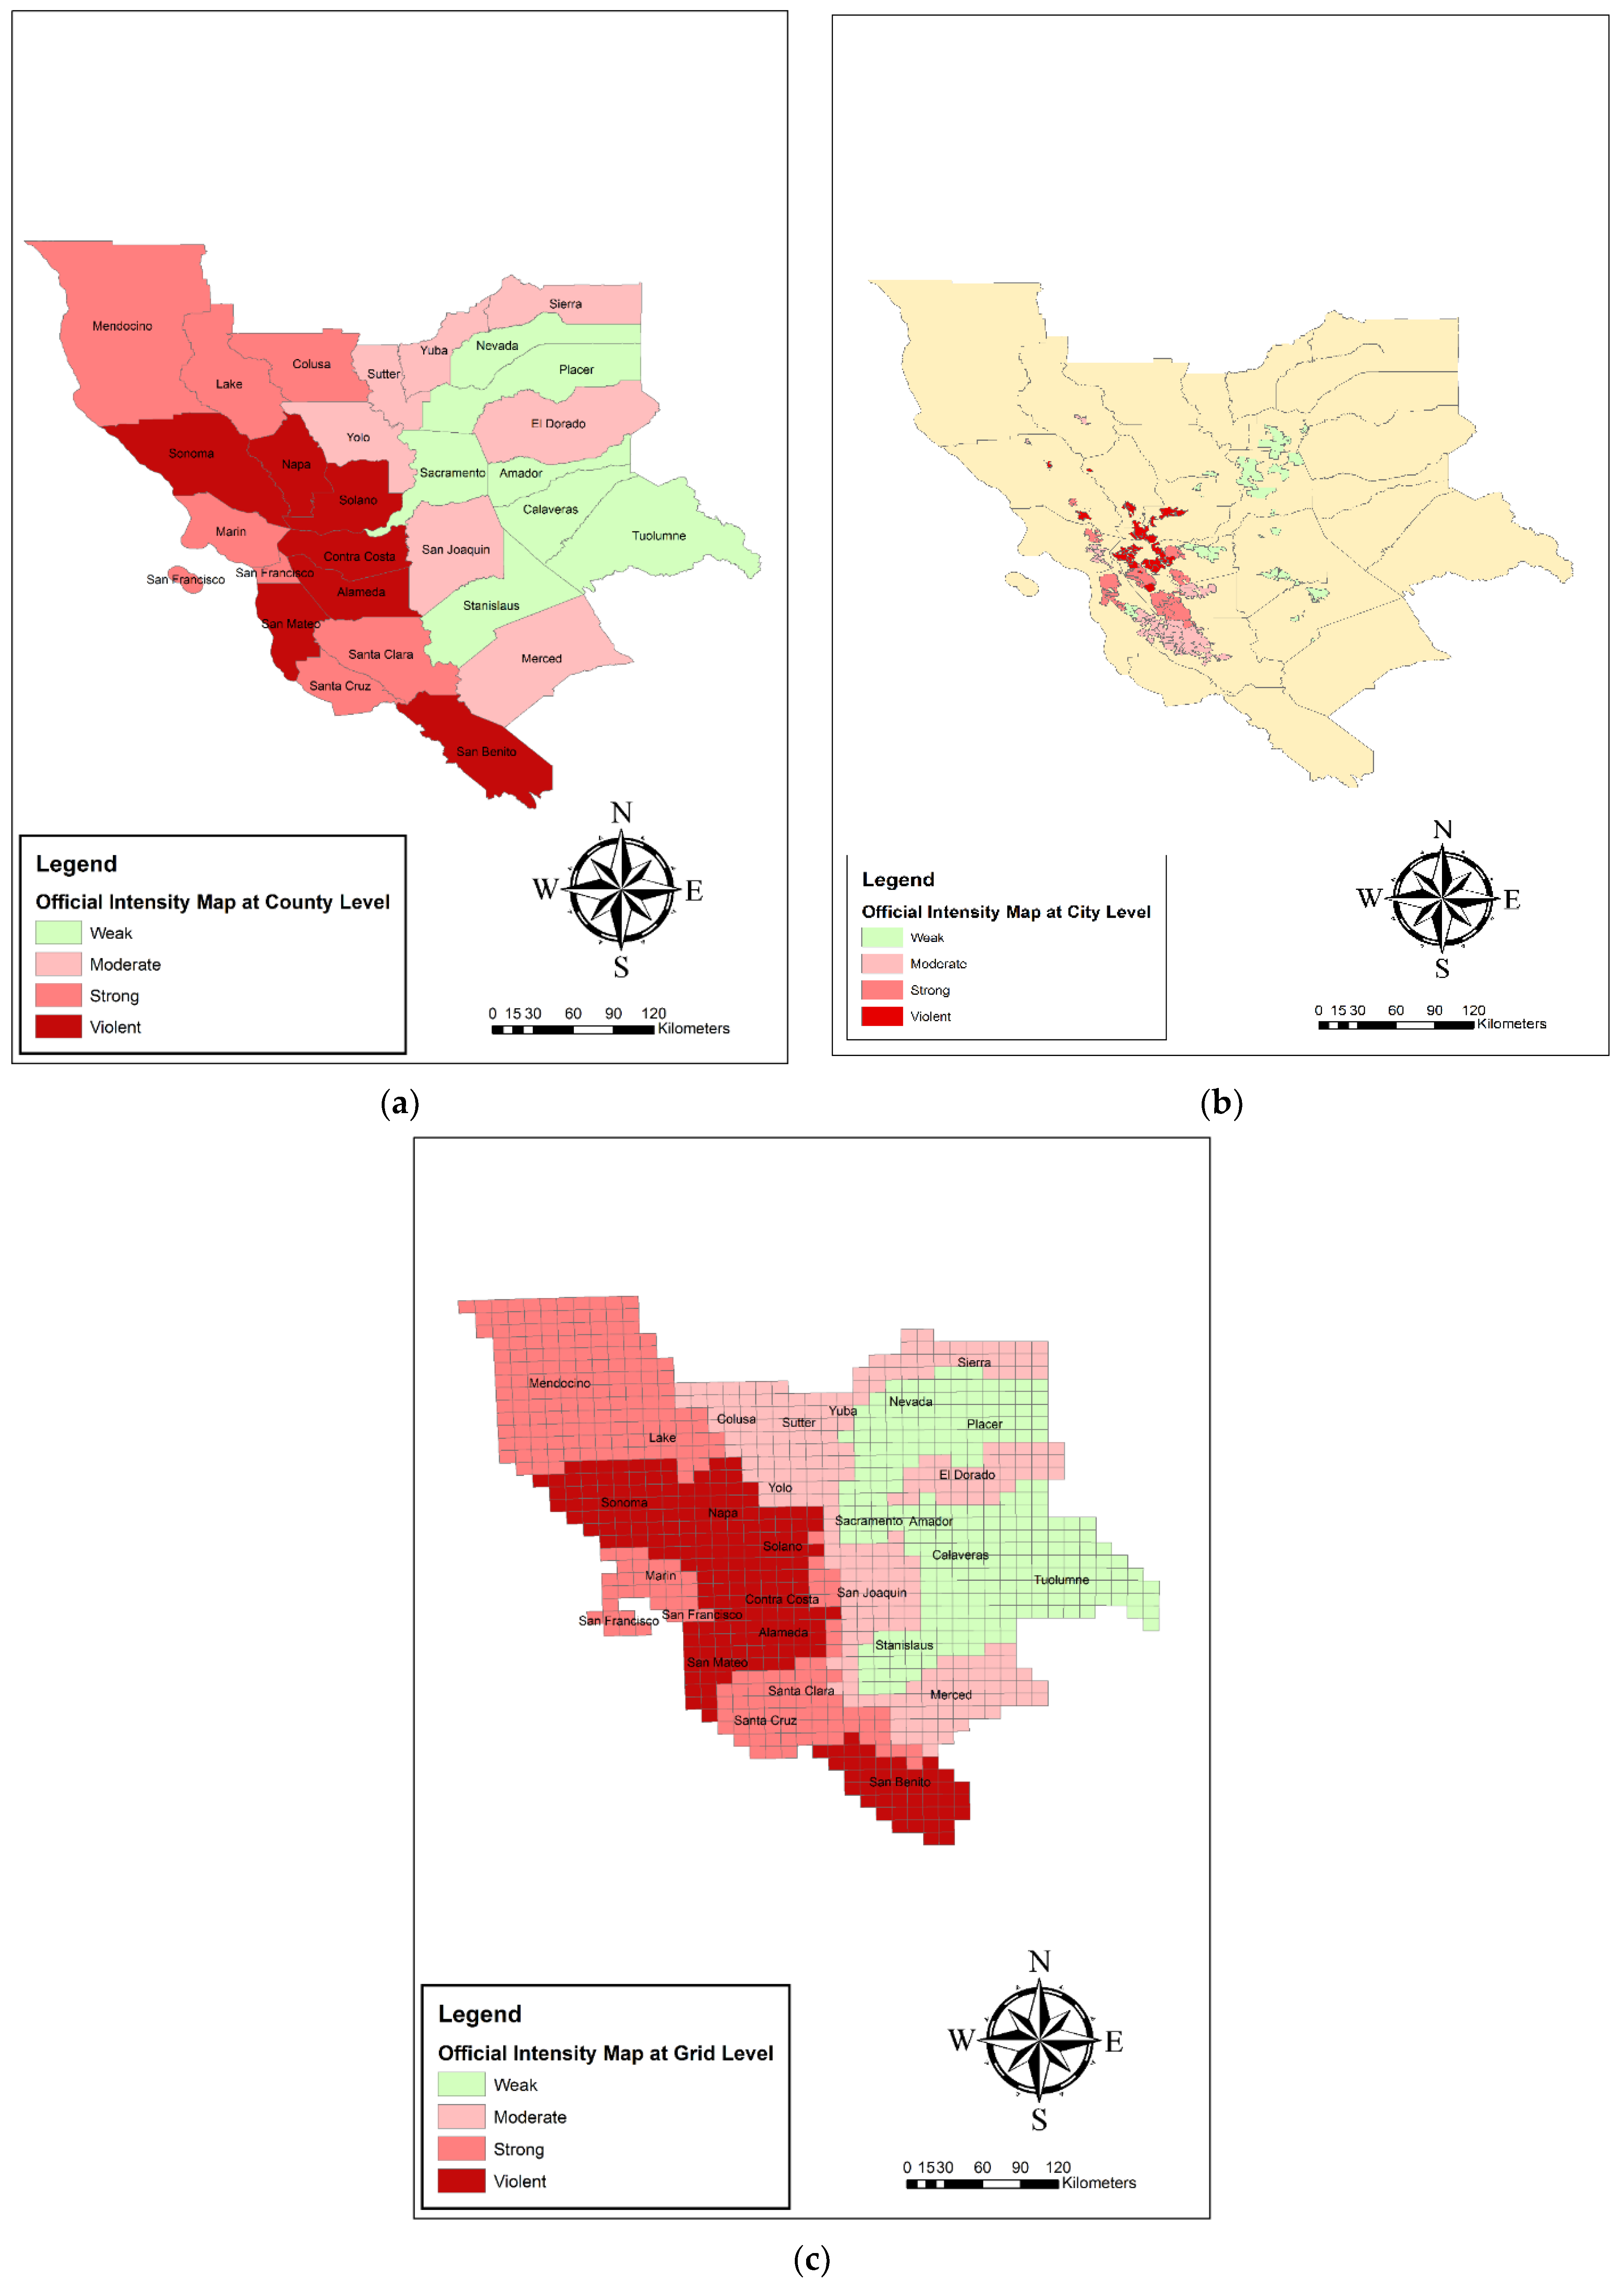
  • Damage Estimation at the county scale
Figure 10 shows the estimated damage map from Naive Bayes, SVM, and deep learning algorithms at the county scale. Based on the results of the three predictive algorithms, Napa and Sonoma counties had the most damage, and San Joaquin and San Mateo had the least damage. The results from both Naive Bayes and deep learning algorithms showed the “violent” damage class for San Francisco and “strong” damage class for Lake; while the results of the SVM algorithm predicted the “strong” earthquake damage class for San Francisco and “violent” and “strong” earthquake damage classes for Lake. Generally, according to Figure 10, with the distance from the earthquake center, the amount of damage was reduced, so because of the distance from the epicenter, people were less affected by the earthquake and published fewer earthquake-related messages.
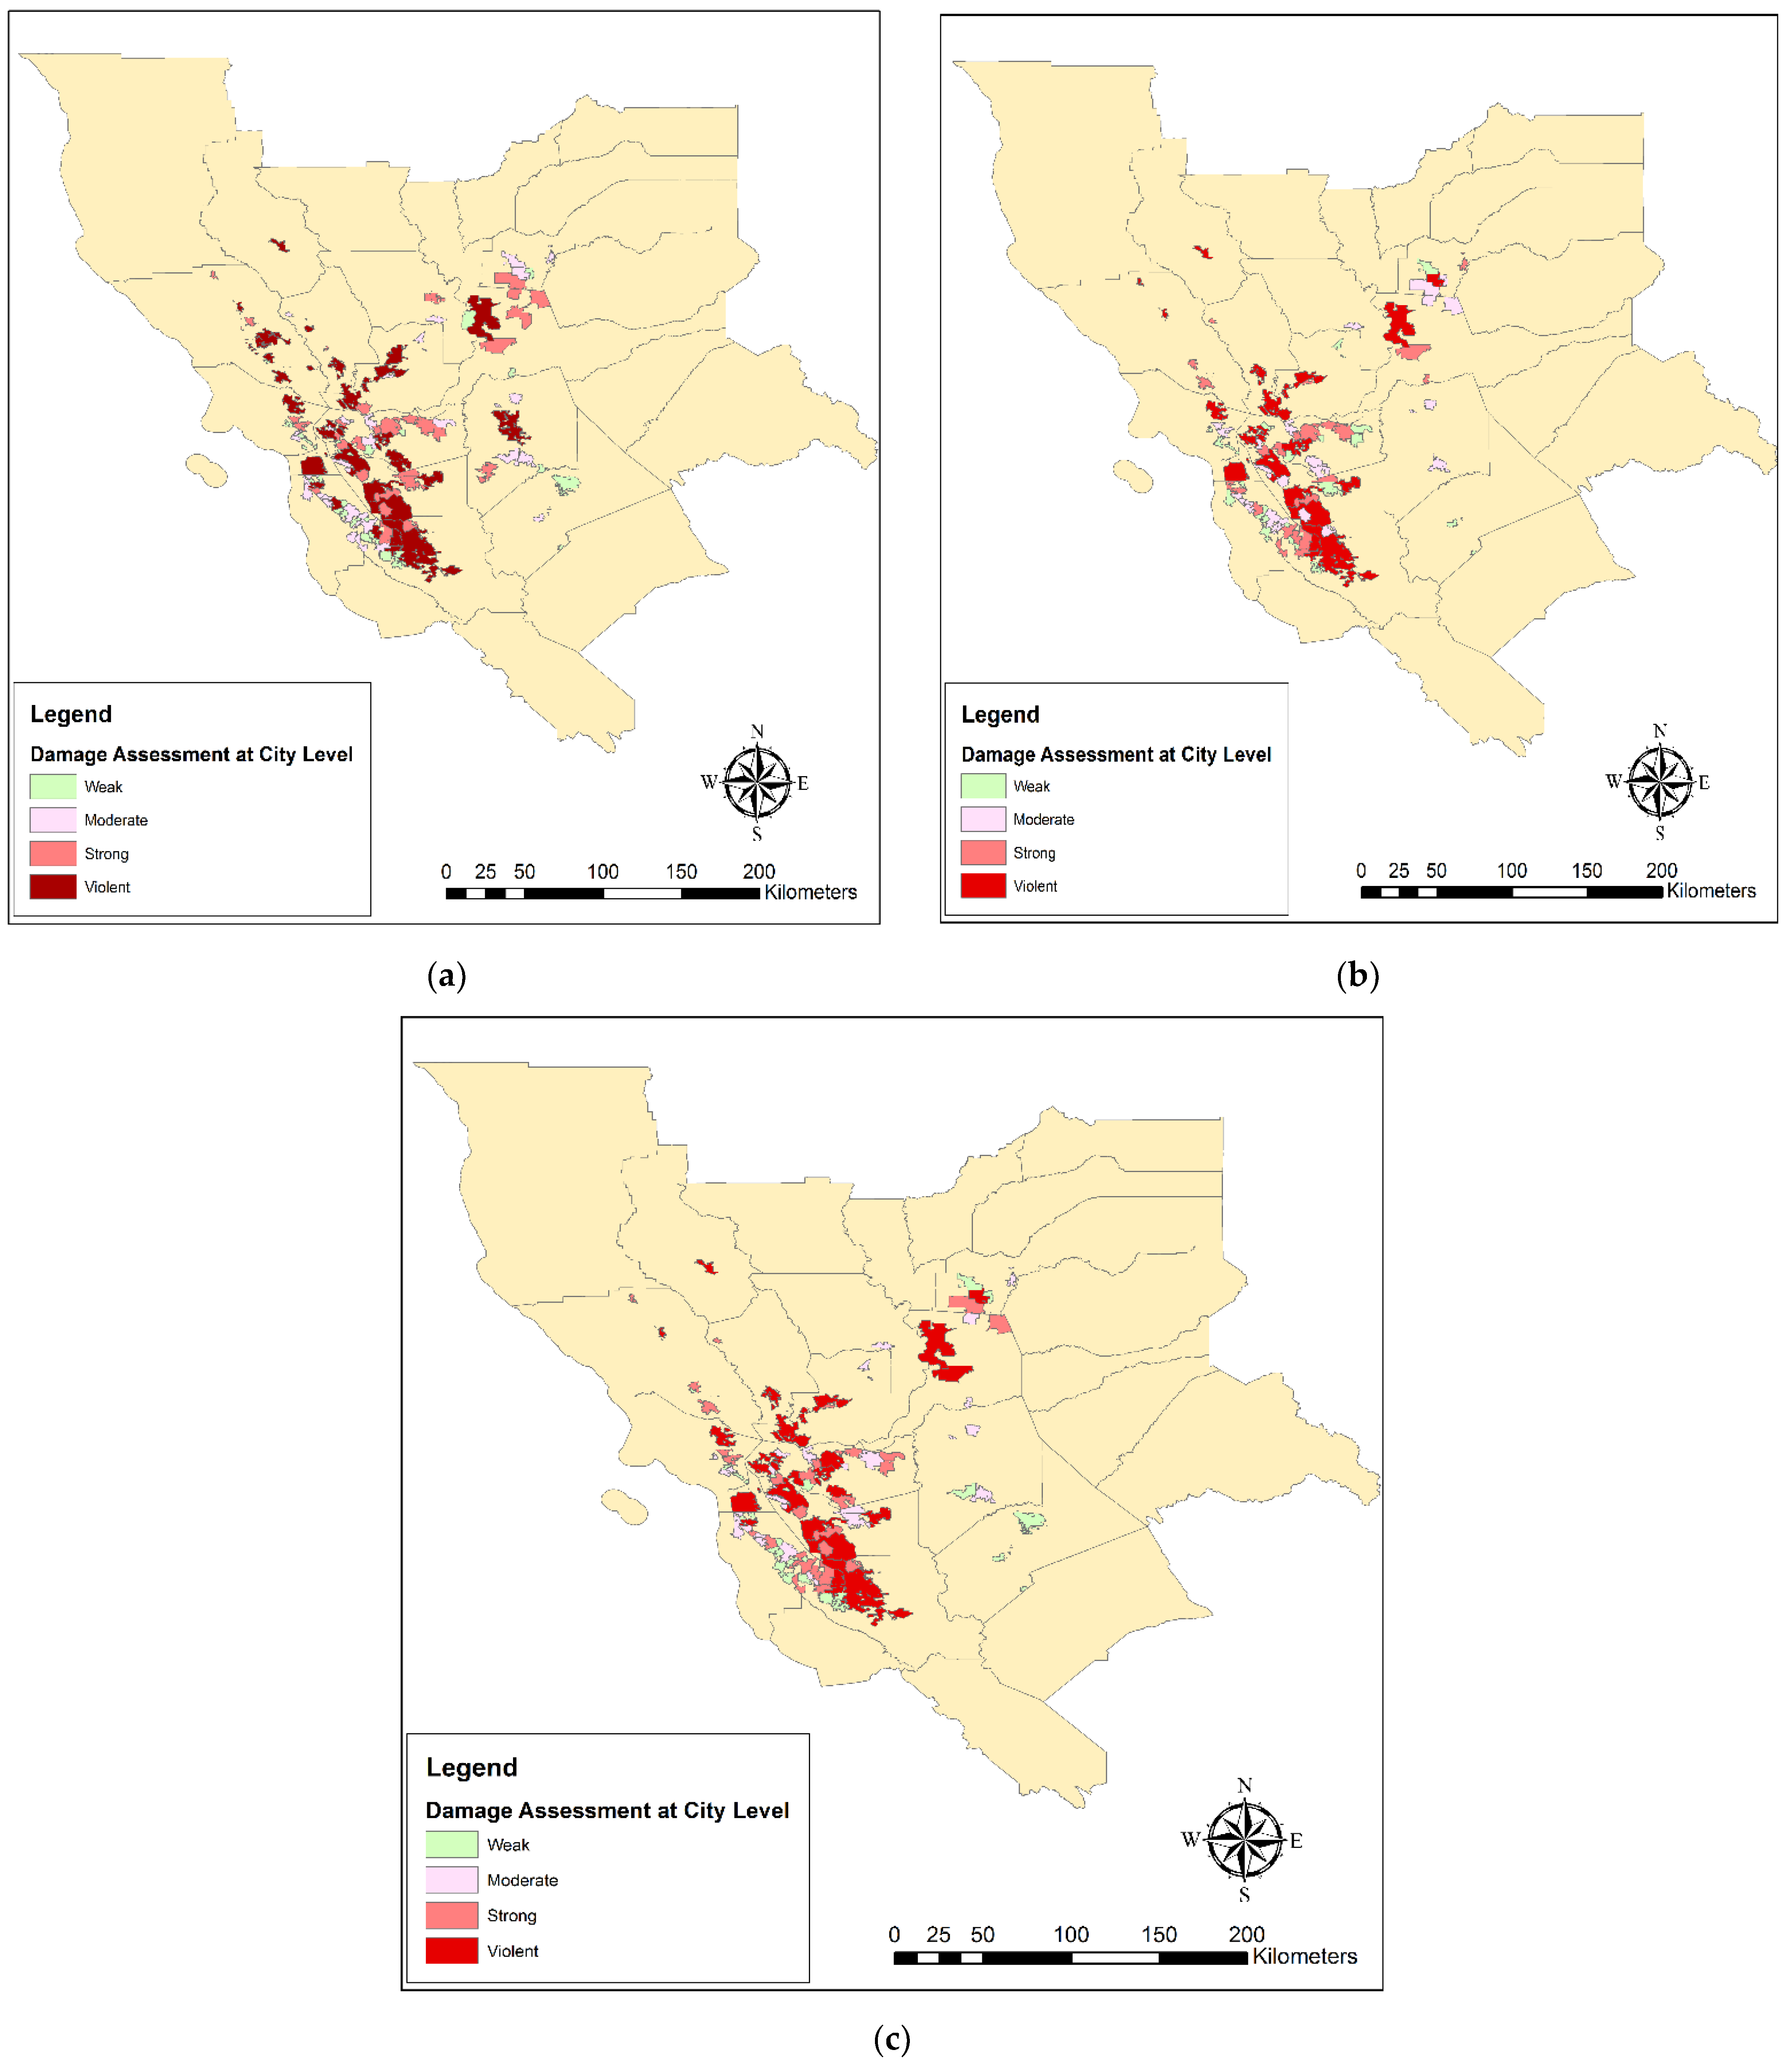
  • Damage Estimation at the city scale
Figure 11 shows the estimated damage map from Naive Bayes, SVM, and deep learning at the city scale. Based on Figure 11, the estimated damage map for all three predictive algorithms showed most of the earthquake losses were in cities located in the counties of Napa, San Francisco, Contra Costa, Almeda, Santa Clara, and Solano. In addition, the results of the SVM classification model showed that little damage was estimated for the cities located in San Joaquin, whereas the results from the Naive and deep learning models have predicted a great deal of damage for these cities.
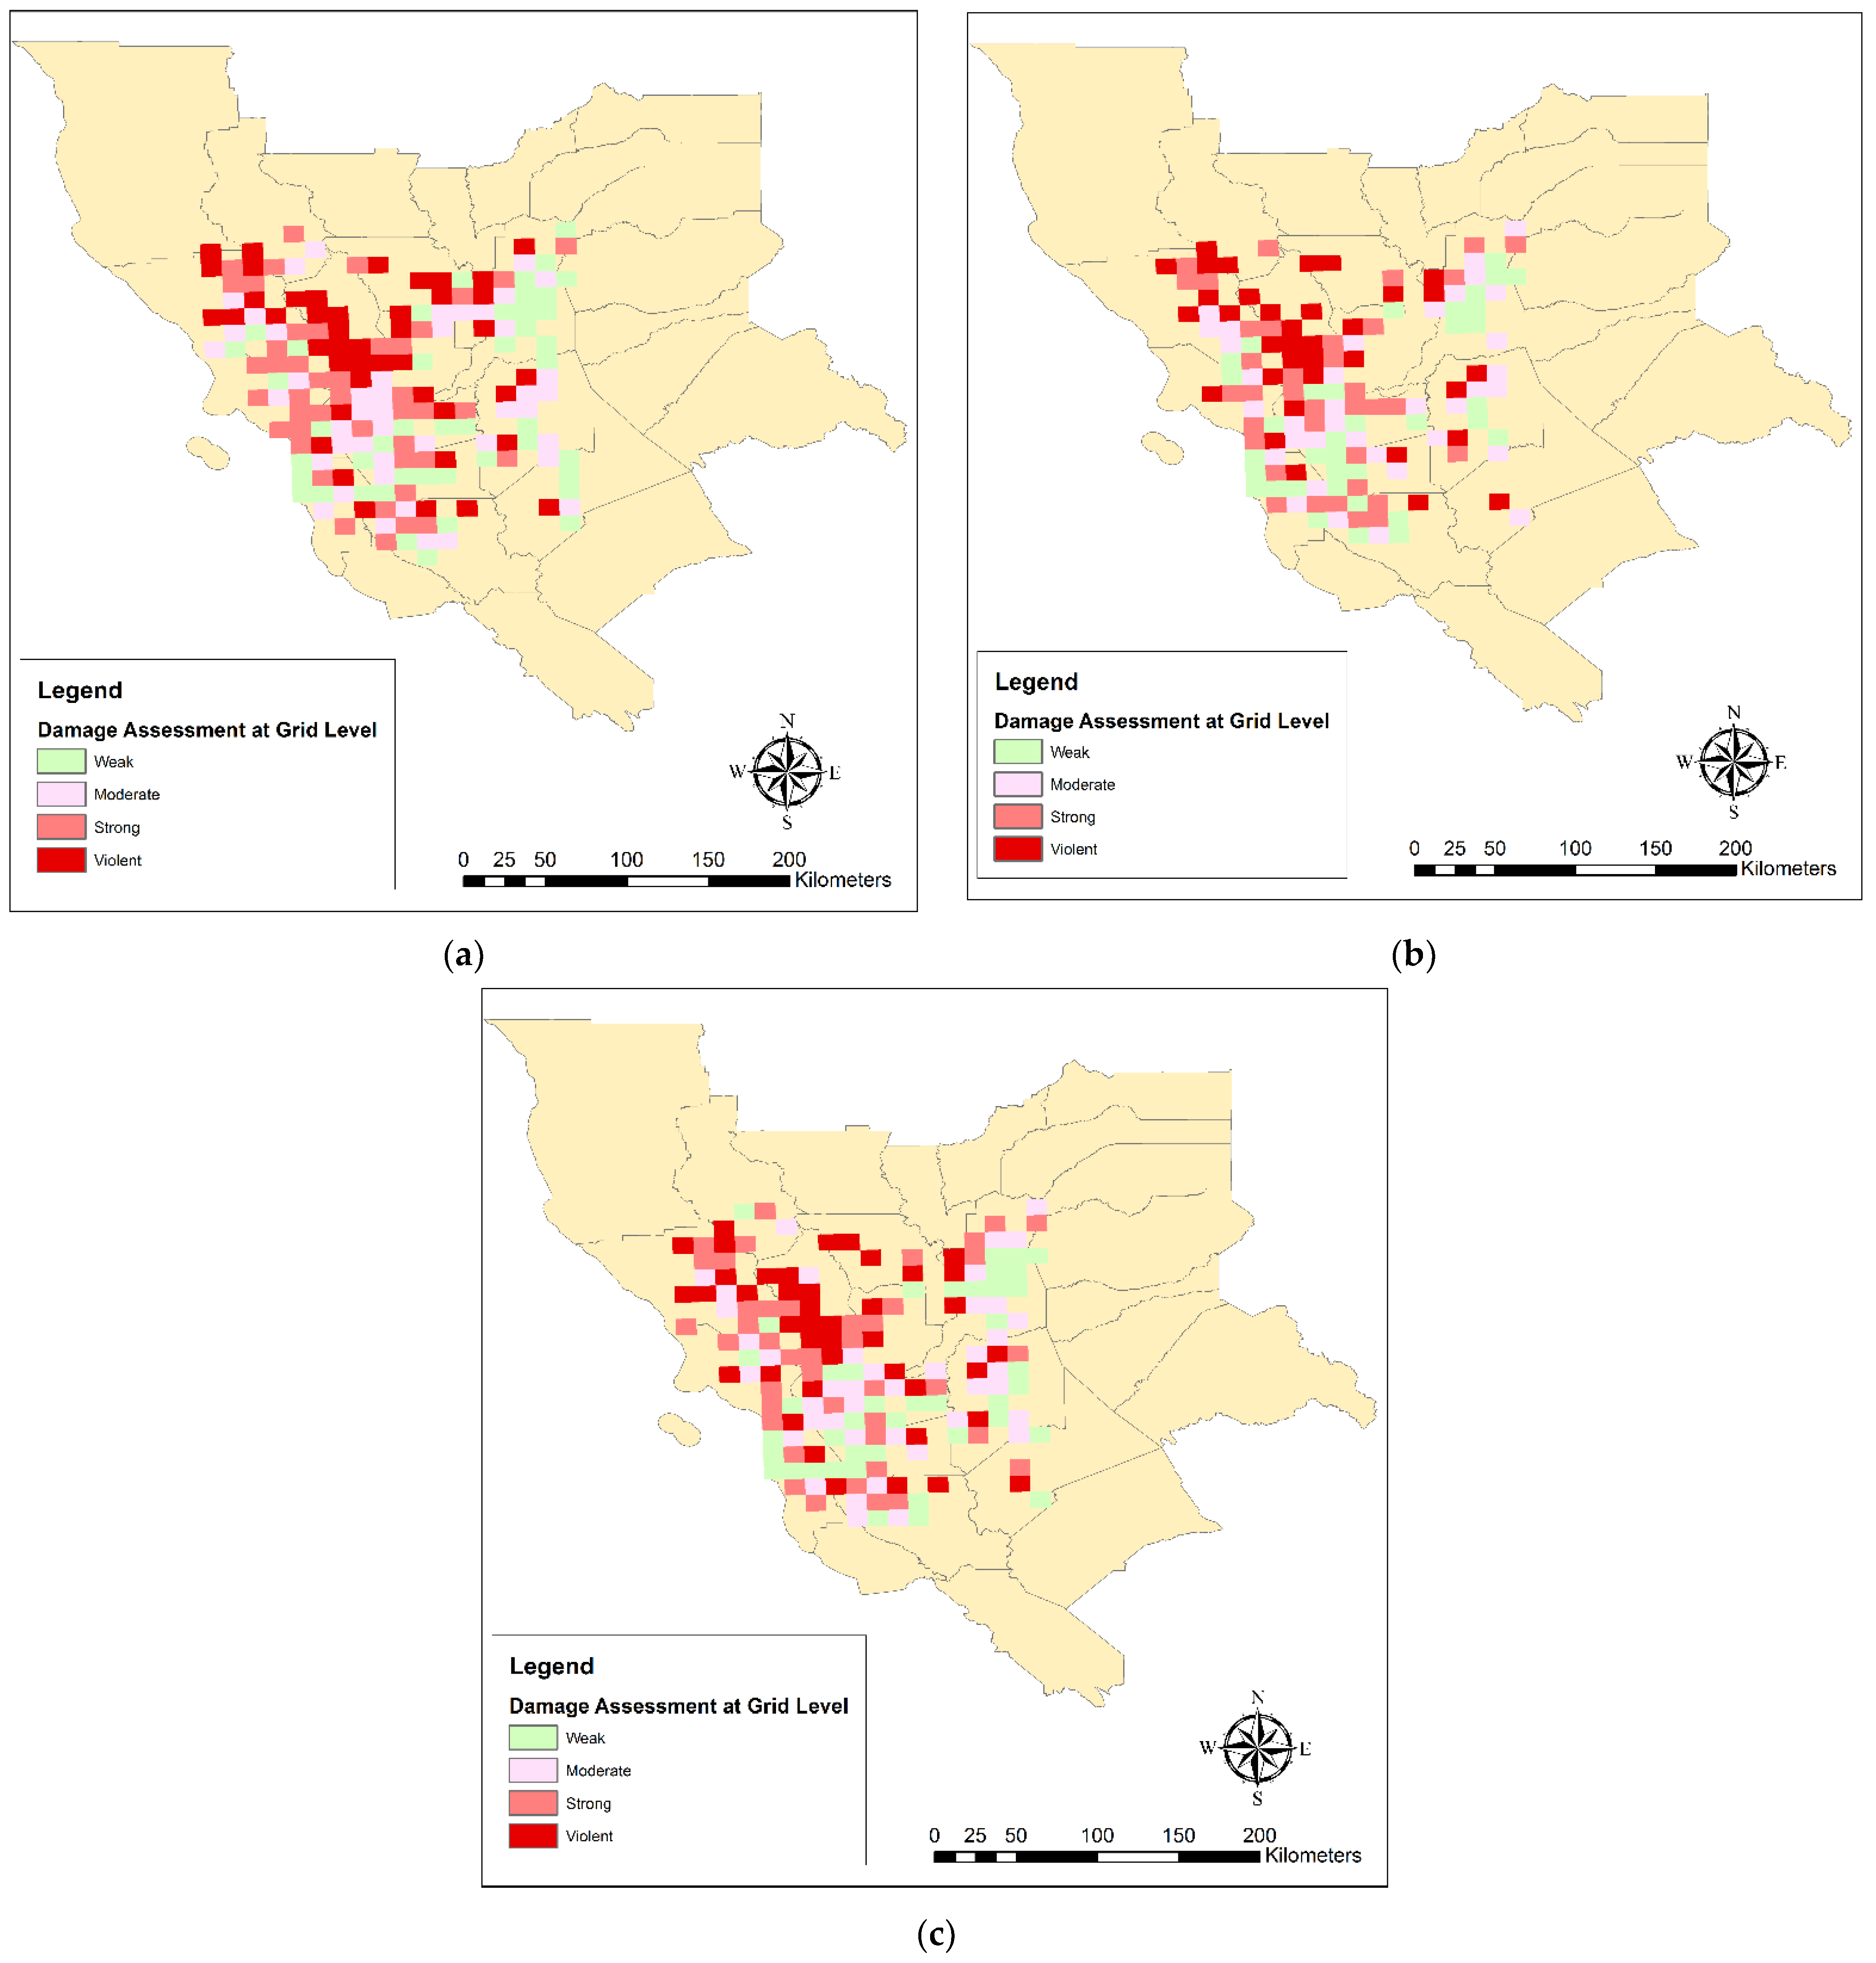
  • Damage Estimation at the 10 × 10 km grids scale
Figure 12 shows the estimated damage map from Naive Bayes, SVM, and deep learning algorithms at the 10 × 10 km grids scale. The results of earthquake damage estimation by three predictive algorithms showed that with increasing distance from the center of the earthquake, the intensity of earthquake damage was reduced.

5.4. Damage Validation

In this section, the estimated damage maps from each of the Naive, SVM, and deep learning algorithms were validated using the official damage map at three county, city, and 10 by 10 km grids scales. The official damage map, which was computed based on the FEMA HAZUS loss model, is shown at the three, county, city, and 10 by 10 km grid, scales in Figure 13.
  • Damage validation at the county scale
Table 3 presents the results of the validation of the estimated damage map from Naive Bayes, SVM, and deep learning at the county scale with official data. Based on the validation results by the three indices of Kendall’s tau, Pearson correlation, and Spearman’s rho, the deep learning classifier was selected as the best model at the county scale. In additino, Kendall’s tau and Spearman’s rho indexes, which were used to rank values, performed better than Pearson indices, which worked with the values themselves.
  • Damage validation at city scale
Table 4 presents the results of the validation of the estimated damage map from Naive Bayes, SVM, and deep learning at the city scale with official data. Based on the validation results by the three indices of Kendall’s tau, Pearson correlation, and Spearman’s rho, the SVM classifier was selected as the best model at the city scale.
  • Damage Validation at the 10 × 10 km grids scale
Table 5 presents the results of the validation of the estimated damage map from Naive Bayes, SVM, and deep learning at the 10 × 10 km grids scale with official data. Based on the validation results by the three indices of Kendall’s tau, Pearson correlation, and Spearman’s rho, the SVM classifier was selected as the best model at the city scale.
Table 6 presents the results of validation of the estimated damage map from Naive Bayes, SVM, and deep learning at the 10 × 10 km raster grids scale with accuracy, precision, recall, and F-score indices. These indices were obtained from the confusion matrix. Based on the validation results by the four indices of accuracy, precision, recall, and F-score, the Naive Bayes classifier was selected as the best model at the 10 × 10 km raster grids.
Figure 14 shows the area values (km2) included by each class in our estimated damage map and FEMA HAZUS loss model map for the Naive Bayes, SVM, and deep learning algorithms. Obviously, the area covered by the four classes in the FEMA HAZUS loss model map for all three algorithms must be equal. In addition, the areas covered by the four classes in the estimated damage map for the two Naive Bayes and SVM algorithms were approximately equal. However, the obtained area corresponded to the results of the four classes in the damage map for the deep learning algorithm, on average 2.8 times more than the same value in the two Naive Bayes and SVM algorithms. In general, the results of the deep learning algorithm in the area covered by four classes were closer to the FEMA HAZUS loss model map (official damage map).
Figure 15 shows the population (in units of a thousand) covered by each class in our estimated damage map and FEMA HAZUS loss model map for the Naive Bayes, SVM, and deep learning algorithms. Obviously, the areas covered by the four classes in the FEMA HAZUS loss model map for all three algorithms must be equal. The populations encompassed by the three classes of weak, strong, and violent were approximately equal in the estimated damage map for the Naive Bayes and SVM algorithms. However, the population size of the moderate class in the Naive Bayes algorithm was almost 800,000 units higher than the similar value in the SVM algorithm.
Additionally, the covered populations corresponded to the results of the four classes in the estimated damage map for the deep learning algorithm, on average 0.18 times lower than the same value in the Naive Bayes and SVM algorithms. In general, the results of the SVM algorithm in the populations covered by three classes of weak, moderate, and strong were closer to the FEMA HAZUS loss model map (official damage map).

6. Conclusions and Suggestions

The earthquake severity is among the significant elements of the crisis response and crisis services decision-making procedures. Precise and quick estimates of the severity will assist in lessening the total damage and the number of fatalities following an earthquake. Current severity evaluation techniques manage several different sources of data, which could be split into two major groups. The first group of information is that collected from physical instruments, including seismographs and accelerometers, whereas the second group including information achieved from social monitors, such as eyewitness reports of the earthquake’s effects. Therefore, social networks have evolved as a vital information source that could be utilized to boost emergency management. In this regard, this study proposed an approach that applied social media data for an earthquake damage assessment at the county, city, and 10 × 10 km grids scale using Naive Bayes, SVM, and deep learning classification algorithms.
In this study, binary classification and multi-class classification have been done. Binary classification was used to classify messages into two classes of damage and non-damage so that their results could be used to estimate the earthquake damage. Multi-class classification was used to categorize messages to increase post-crisis situational awareness and to monitor the process of changing conditions over time and to determine the concentration of various topics in different locations. For binary classification and multi-class classification, the SVM algorithm performed better in all the indices, and Naive Bayes algorithm performed poorly in all the indices. The deep learning algorithm also performed moderately in all of the indicators. This may be due to the small size of the training dataset. Therefore, for better evaluation of deep learning performance, the larger dataset is recommended for future research. In social network studies, classification accuracies mentioned throughout disasters vary from 0.6 to 0.9. Therefore, all three classification algorithms performed well.
Investigating the temporal dissemination of the topics of the messages being debated will assist in comprehending the disaster evolvement and how the individual perceives the disaster and responds to it. Based on the results of three binary classification algorithms, it can be concluded that most of the damage-related messages were sent on the day of the earthquake and gradually decreased in the days following the earthquake. Therefore, in the early days of the earthquake, people are more concerned about damage and as time passes, other issues are more important to them. Based on the results of multi-class classification algorithms, most of the messages classified in the three algorithms were in the class “Other_relevant_information”. In addition, most of the messages related to infrastructure damages and injured, dead and missing people were reported on the day of the earthquake. This indicates that after the crises that have not been highly destructive, more people follow incident reports and share most of the post-accident alert tips. Based on the results of the hourly temporal pattern analysis, all algorithms had a sudden increase in the number of tweets, at the time of the earthquake (10 am).
More attention is being paid to integrating the spatial and content data of social networks. LQ could offer extra perspectives by integrating spatial and content data that go beyond the common point pattern analysis and simple mapping. In this study, LQ was used for identifying area-specific topics. Based on the results of LQ at the county scale in all algorithms, Napa, as the center of the earthquake, was considered as having the greatest concentration of damage-related messages in all algorithms.
In this study, disaster-related messages during and after the earthquake were used for damage estimation at three scales. According to county, city, and 10 × 10 km grid scale damage assessment results, Napa (as the earthquake center) suffered the most damage, and with the distance from the earthquake center, the amount of damage was reduced.
Based on the results of the validation of the estimated damage map with official data, SVM performed better for damage estimation, followed by deep learning. In addition, at the county scale, algorithms showed better performances. This indicates that when analyzing the amount of damage based on social networks, it is better to use the county scale because the results will be more reliable. In addition, Kendall’s tau and Spearman’s rho indexes, which were used to rank values, performed better than Pearson correlation, which worked with the values themselves. This suggests that rather than using social networks to assess the amount of the damage, use it to prioritize areas and rank them against each other. This issue is very important in the early stages of earthquake relief.
The present research has several limitations. In this study, the five-tier classification was applied for classifying earthquake-related messages, Whereas a fine-grained classifying scheme with more classes leads to a lot of comprehensive social reactions to the catastrophe. In addition, an external dataset was used as a training dataset to train the classifying algorithms for multi-class classification, and we did not manually check the resulting dataset to find any incorrectly labeled texts. This is recommended for future researches.
This method is essentially based on the topics with the highest LQ value and other topics with lower LQ values in that spatial scale were dismissed. Such topics, however, could also have a crucial effect in exposing situational awareness.
In addition, social network detectors are distinct from real detectors, and among many other variables, their propagation will be influenced by demographic financial and societal differences. Additional research is, therefore, needed to examine the feasibility of integrating more variables into our approach to make it more logical and to provide even more tangible information to assist disaster response efforts more effectively.
Additionally, our approach would take into consideration more sources of data regarding the various facet of disaster situations. Social networks are only one of the various sources of information for damage assessment, and data from other sources could also be very useful for emergency management, including remote sensing images, seismic networks, and so on.

Author Contributions

Conceptualization, S.A. and M.R.M.; methodology, S.A.; software, S.A.; validation, S.A., and M.R.M.; formal analysis, S.A.; investigation, S.A. and M.R.M.; resources, M.R.M.; data curation, M.R.M.; writing—original draft preparation, S.A.; writing—review and editing, S.A. and M.R.M.; visualization, S.A.; supervision, M.R.M.; project administration, M.R.M. All authors have read and agreed to the published version of the manuscript.

Funding

This research received no external funding.

Institutional Review Board Statement

Not applicable.

Informed Consent Statement

Not applicable.

Data Availability Statement

Not applicable.

Acknowledgments

This project was partially supported by Iran National Science Foundation.

Conflicts of Interest

The authors declare no conflict of interest.

References

  1. Wang, Y.; Ruan, S.; Wang, T.; Qiao, M. Rapid estimation of an earthquake impact area using a spatial logistic growth model based on social media data. Int. J. Digit. Earth 2018, 12, 1–20. [Google Scholar] [CrossRef]
  2. Musaev, A.; Pu, C. Landslide information service based on composition of physical and social sensors. In Proceedings of the 2017 IEEE 33rd International Conference on Data Engineering (ICDE), San Diego, CA, USA, 19–22 April 2017; IEEE: Piscataway, NJ, USA; pp. 1415–1416. [Google Scholar]
  3. Burks, L.; Miller, M.; Zadeh, R. Rapid estimate of ground shaking intensity by combining simple earthquake characteristics with Tweets. In Proceedings of the Tenth US National Conference on Earthquake Engineering Frontiers of Earthquake Engineering, Anchorage, USA, 21–25 July 2014. [Google Scholar]
  4. Cheng, C.; Zhang, T.; Su, K.; Gao, P.; Shen, S. Assessing the Intensity of the Population Affected by a Complex Natural Disaster Using Social Media Data. ISPRS Int. J. Geo-Inf. 2019, 8, 358. [Google Scholar] [CrossRef] [Green Version]
  5. Resch, B.; Usländer, F.; Havas, C. Combining machine-learning topic models and spatiotemporal analysis of social media data for disaster footprint and damage assessment. Cartogr. Geogr. Inf. Sci. 2018, 45, 362–376. [Google Scholar] [CrossRef] [Green Version]
  6. Li, X.; Caragea, D.; Zhang, H.; Imran, M. Localizing and quantifying infrastructure damage using class activation mapping approaches. Soc. Netw. Anal. Min. 2019, 9, 44. [Google Scholar] [CrossRef]
  7. Peters, R.; de Albuquerque, J.P. Investigating images as indicators for relevant social media messages in disaster management. In Proceedings of the ISCRAM 2015 Conference, Kristiansand, Norway, 24–27 May 2015. [Google Scholar]
  8. Gründer-Fahrer, S.; Schlaf, A.; Wiedemann, G.; Heyer, G. Topics and topical phases in German social media communication during a disaster. Nat. Lang. Eng. 2018, 24, 221–264. [Google Scholar] [CrossRef]
  9. Shan, S.; Zhao, F.; Wei, Y.; Liu, M. Disaster management 2.0: A real-time disaster damage assessment model based on mobile social media data—A case study of Weibo (Chinese Twitter). Safety Sci. 2019, 115, 393–413. [Google Scholar] [CrossRef]
  10. Alam, F.; Ofli, F.; Imran, M. Descriptive and visual summaries of disaster events using artificial intelligence techniques: Case studies of Hurricanes Harvey, Irma, and Maria. Behav. Inf. Technol. 2019, 39, 1–31. [Google Scholar] [CrossRef]
  11. Eivazy, H.; Malek, M.R. Simulation of natural disasters and managing rescue operations via geospatial crowdsourcing services in tensor space. Arab. J. Geosci. 2020, 13, 1–15. [Google Scholar] [CrossRef]
  12. Wu, K.; Wu, J.; Ding, W.; Tang, R. Extracting disaster information based on Sina Weibo in China: A case study of the 2019 Typhoon Lekima. Int. J. Dis. Risk Reduct. 2021, 60, 102304. [Google Scholar] [CrossRef]
  13. Corbane, C.; Lemoine, G.; Kauffmann, M. Relationship between the spatial distribution of SMS messages reporting needs and building damage in 2010 Haiti disaster. Nat. Hazards Earth Syst. Sci. 2012, 12, 255–265. [Google Scholar] [CrossRef] [Green Version]
  14. Liang, Y.; Caverlee, J.; Mander, J. Text vs. images: On the viability of social media to assess earthquake damage. In Proceedings of the 22nd international conference on world wide web, Rio de Janeiro, Brazil, 13–17 May 2013; ACM: New York, NY, USA; pp. 1003–1006. [Google Scholar]
  15. Cresci, S.; Avvenuti, M.; La Polla, M.; Meletti, C.; Tesconi, M. Nowcasting of earthquake consequences using big social data. IEEE Int. Comput. 2017, 21, 37–45. [Google Scholar] [CrossRef]
  16. Nguyen, D.T.; Ofli, F.; Imran, M.; Mitra, P. Damage assessment from social media imagery data during disasters. In Proceedings of the 2017 IEEE/ACM International Conference on Advances in Social Networks Analysis and Mining 2017, Sydney, Australia, 31 July 2017; ACM: New York, NY, USA; pp. 569–576. [Google Scholar]
  17. Avvenuti, M.; Cresci, S.; Del Vigna, F.; Tesconi, M. On the need of opening up crowdsourced emergency management systems. AI Soc. 2017, 33, 55–60. [Google Scholar] [CrossRef]
  18. Avvenuti, M.; Cresci, S.; Del Vigna, F.; Fagni, T.; Tesconi, M. CrisMap: A big data crisis mapping system based on damage detection and geoparsing. Inf. Syst. Front. 2018, 20, 993–1011. [Google Scholar] [CrossRef]
  19. Zou, L.; Lam, N.S.; Cai, H.; Qiang, Y. Mining Twitter data for improved understanding of disaster resilience. Ann. Am. Assoc. Geogr. 2018, 108, 1422–1441. [Google Scholar] [CrossRef]
  20. Mouzannar, H.; Rizk, Y.; Awad, M. Damage Identification in Social Media Posts using Multimodal Deep Learning. In Proceedings of the 15th ISCRAM Conference, Rochester, NY, USA, 20–23 May 2018. [Google Scholar]
  21. Kropivnitskaya, Y.; Tiampo, K.F.; Qin, J.; Bauer, M.A. Real-time earthquake intensity estimation using streaming data analysis of social and physical sensors. In Earthquakes and Multi-Hazards Around the Pacific Rim; Birkhäuser: Cham, Switzerland, 2018; pp. 137–155. [Google Scholar]
  22. Fernandez-Marquez, J.L.; Francalanci, C.; Mohanty, S.; Mondardini, R.; Pernici, B.; Scalia, G. E 2 mC: Improving Rapid Mapping with Social Network Information. In Organizing for the Digital World; Springer: Cham, Switzrtland, 2019; pp. 63–74. [Google Scholar]
  23. Mendoza, M.; Poblete, B.; Valderrama, I. Nowcasting earthquake damages with Twitter. EPJ Data Sci. 2019, 8, 3. [Google Scholar] [CrossRef] [Green Version]
  24. Ahadzadeh, S.; Malek, M.R. Earthquake Damage Assessment Based on User Generated Data in Social Networks. Sustainability 2021, 13, 4814. [Google Scholar] [CrossRef]
  25. Sakaki, T.; Okazaki, M.; Matsuo, Y. Earthquake shakes Twitter users: Real-time event detection by social sensors. In Proceedings of the 19th international conference on World wide web, Raleigh North Carolina USA, 26–30 April 2010; ACM: New York, NY, USA; pp. 851–860. [Google Scholar]
  26. Earle, P.S.; Bowden, D.C.; Guy, M. Twitter earthquake detection: Earthquake monitoring in a social world. Ann. Geophys. 2012, 54, 708–715. [Google Scholar]
  27. Huang, Q.; Cervone, G.; Jing, D.; Chang, C. DisasterMapper: A CyberGIS framework for disaster management using social media data. In Proceedings of the 4th International ACM SIGSPATIAL Workshop on Analytics for Big Geospatial Data, Seattle, WA, USA, 3 November 2015; ACM: New York, NY, USA; pp. 1–6. [Google Scholar]
  28. Wang, Z.; Ye, X. Space, time, and situational awareness in natural hazards: A case study of Hurricane Sandy with social media data. Cartogr. Geogr. Inf. Sci. 2019, 46, 334–346. [Google Scholar] [CrossRef]
  29. Yin, J.; Lampert, A.; Cameron, M.; Robinson, B.; Power, R. Using social media to enhance emergency situation awareness. IEEE Int. Syst. 2012, 27, 52–59. [Google Scholar] [CrossRef]
  30. Kireyev, K.; Palen, L.; Anderson, K. Applications of topics models to analysis of disaster-related Twitter data. In NIPS Workshop on Applications for Topic Models: Text and Beyond; NIPS: Whistler, BC, Canada, 2009; Volume 1. [Google Scholar]
  31. Khare, P.; Burel, G.; Maynard, D.; Alani, H. Cross-Lingual Classification of Crisis Data. In International Semantic Web Conference; Springer: Cham, Switzerland, 2018; pp. 617–633. [Google Scholar]
  32. Neppalli, V.K.; Caragea, C.; Caragea, D. Deep Neural Networks versus Naive Bayes Classifiers for Identifying Informative Tweets during Disasters. In Proceedings of the 15th ISCRAM Conference, Rochester, NY, USA, 20–23 May 2018. [Google Scholar]
  33. Ragini, J.R.; Anand, P.R.; Bhaskar, V. Mining crisis information: A strategic approach for detection of people at risk through social media analysis. Int. J. Disaster Risk Reduct. 2018, 27, 556–566. [Google Scholar] [CrossRef]
  34. Burel, G.; Alani, H. Crisis Event Extraction Service (CREES)-Automatic Detection and Classification of Crisis-related Content on Social Media. In Proceedings of the 15th ISCRAM Conference, Rochester, NY, USA, 20–23 May 2018. [Google Scholar]
  35. Qu, Y.; Huang, C.; Zhang, P.; Zhang, J. Microblogging after a major disaster in China: A case study of the 2010 Yushu earthquake. In Proceedings of the ACM 2011 Conference on Computer Supported Cooperative Work, Hangzhou, China, 19–23 March 2011; ACM: New York, NY, USA; pp. 25–34. [Google Scholar]
  36. Imran, M.; Elbassuoni, S.; Castillo, C.; Diaz, F.; Meier, P. Extracting information nuggets from disaster-related messages in social media. In Proceedings of the 10th International ISCRAM Conference, Baden-Baden, Germany, 20–23 May 2013. [Google Scholar]
  37. USGS (US Geological Survey). M6.0 South Napa, California Earthquake–August 24, 2014. Available online: https://www.usgs.gov/natural-hazards/earthquake-hazards/science/m60-south-napa-california-earthquake-august-24-2014?qt-science_center_objects=0#qt-science_center_objects (accessed on 20 November 2019).
  38. Chen, R.; Jaiswal, K.S.; Bausch, D.; Seligson, H.; Wills, C.J. Annualized earthquake loss estimates for California and their sensitivity to site amplification. Seismol. Res. Lett. 2016, 87, 1363–1372. [Google Scholar] [CrossRef]
  39. Parilla-Ferrer, B.E.; Fernandez, P.L.; Ballena, J.T. Automatic classification of disaster-related Tweets. In Proceedings of the International Conference on Innovative Engineering Technologies (ICIET), Barcelona, Spain, 16–17 December 2014. [Google Scholar]
  40. Li, H.; Caragea, D.; Caragea, C.; Herndon, N. Disaster response aided by tweet classification with a domain adaptation approach. J. Conting. Crisis Manag. 2018, 26, 16–27. [Google Scholar] [CrossRef] [Green Version]
  41. Joachims, T.A. support vector method for multivariate performance measures. In Proceedings of the 22nd International Conference on Machine Learning, Lausanne, Switzerland, 11–14 September 2005; pp. 377–384. [Google Scholar]
  42. Cresci, S.; Cimino, A.; Dell’Orletta, F.; Tesconi, M. Crisis mapping during natural disasters via text analysis of social media messages. In Proceedings of the International Conference on Web Information Systems Engineering, Miami, FL, USA, 1–3 November 2015; Springer: Cham, Switzerland, 2015; pp. 250–258. [Google Scholar]
  43. Ben-David, A. Comparison of classification accuracy using Cohen’s Weighted Kappa. Exp. Syst. Appl. 2008, 34, 825–832. [Google Scholar] [CrossRef]
  44. Bica, M.; Palen, L.; Bopp, C. Visual representations of disaster. In Proceedings of the 2017 ACM Conference on Computer Supported Cooperative Work and Social Computing, Jersey City, NJ, USA, 3–7 November 2017; pp. 1262–1276. [Google Scholar]
Figure 1. Description of Napa earthquake study area with tweet locations 7 days before the earthquake (left) and 7 days after the earthquake (right).
Applsci 11 09737 g001
Figure 2. Flowchart of the study.
Applsci 11 09737 g002
Figure 3. The process of pre-processing textual data [5].
Applsci 11 09737 g003
Figure 4. Number of tweets classified using the three, classification algorithms, Naive Bayes, SVM and deep learning, in damage and non-damage classes on each day one week after the earthquake.
Applsci 11 09737 g004
Figure 5. Distribution of classified tweets in 5 classes on different days, a week after the earthquake (August 24) in the three—Naive Bayes, SVM, and deep learning—classification algorithms.
Applsci 11 09737 g005
Figure 6. Number of tweets classified using the three Naive Bayes, SVM, and deep learning classification algorithms in two damage and non-damage classes in each hour on the day of earthquake.
Applsci 11 09737 g006
Figure 7. Distribution of classified tweets, in 5 classes, per hour on the day of the earthquake (August 24) according to the Naive Bayes, SVM, and deep learning classification algorithms.
Applsci 11 09737 g007
Figure 8. LQ analysis of the tweets’ spatial topic concentration at the county scale, classified by Naive Bayes (a), SVM (b), and deep learning (c) in the two classes of damage and non-damage.
Applsci 11 09737 g008
Figure 9. LQ analysis of the tweets spatial topic concentration at the county scale, classified by Naive Bayes (a), SVM (b), and deep learning (c) in five classes.
Applsci 11 09737 g009aApplsci 11 09737 g009b
Figure 10. The estimated damage map from (a) Naive Bayes, (b) SVM, and (c) deep learning algorithms at the county scale.
Applsci 11 09737 g010
Figure 11. The estimated damage map from (a) Naive Bayes, (b) SVM, and (c) deep learning algorithms at the city scale.
Applsci 11 09737 g011
Figure 12. The estimated damage map from (a) Naive Bayes, (b) SVM, and (c) deep learning algorithms at the 10 × 10 km grids scale.
Applsci 11 09737 g012
Figure 13. Official damage map at the county (a), city (b), and 10 by 10 km grids (c) scales.
Applsci 11 09737 g013
Figure 14. The area values (km2) included by each class in our estimated damage map and FEMA HAZUS loss model map for the Naive Bayes (a), SVM (b), and deep learning (c) algorithms.
Applsci 11 09737 g014
Figure 15. The populations (in units of a thousand) covered by each class in our estimated damage map and FEMA HAZUS loss model map for the (a) Naive Bayes, (b) SVM, and (c) deep learning algorithms.
Applsci 11 09737 g015
Table 1. Performance of Naive Bayes, SVM, and deep learning binary classification.
Binary Classification AlgorithmAccuracyF-measureRecallPrecisionKappa
Naive Bayes71.22%63.03%64.91%61.25%0.249
Deep Learning84.74%76.17%75.64%76.71%0.520
SVM89.30%81.22%79.08%85.61%0.634
Table 2. Performance of Naive Bayes, SVM, and deep learning multi-class classification.
Multi-Class Classification AlgorithmAccuracyF-MeasureRecallPrecisionKappa
Naive Bayes79.81%78.46%81.33%75.79%0.662
Deep Learning86.76%83.43%80.26%86.86%0.762
SVM90.25%81.22%88.58%93.26%0.825
Table 3. The results of validation of the estimated damage map from Naive Bayes, SVM, and deep learning at the county scale.
AlgorithmSpearman’s RhoPearson CorrelationKendall’s Tau
Naive Bayes0.6470.5390.550
Deep Learning0.82050.52170.6666
SVM0.66550.51910.5714
Table 4. The results of validation of the estimated damage map from Naive Bayes, SVM, and deep learning at the city scale.
AlgorithmSpearman’s RhoPearson CorrelationKendall’S Tau
Naive Bayes−0.21320.4485−0.1424
Deep Learning0.32160.47050.1975
SVM0.41310.530.3607
Table 5. The results of validation of the estimated damage map from Naive Bayes, SVM, and deep learning at the 10 × 10 km grids scale.
AlgorithmSpearman’s RhoPearson CorrelationKendall’s Tau
Naive Bayes0.900.180.79
Deep Learning0.90650.18210.7983
SVM0.9220.1570.824
Table 6. The results of validation of the estimated damage map from Naive Bayes, SVM, and deep learning at the 10 × 10 km raster grids scale with accuracy, precision, recall, and F-score indices.
AlgorithmAccuracyPrecisionRecallF-Score
Naive Bayes35.20%35%42.7%38.66%
Deep Learning30.20%30.2%32.85%31.47%
SVM29.40%29.69%32%30.80%
Publisher’s Note: MDPI stays neutral with regard to jurisdictional claims in published maps and institutional affiliations.

