Abstract
Background: Functional Fitness Training (FFT) is a new exercise modality prioritizing functional multi-joint movements executed at high intensity as a circuit. Objective: To examine the impacts of introducing rest intervals in a FFT workout compared to “rounds for time” (RFT) FFT. Materials and Methods: Participants were 25 resistance-trained adults who completed two FFT workouts 1 week apart. The study design was crossover such that in a given session half the participants completed the standard and the other half the adapted FFT (FFTadapted). The workouts consisted of the same exercises (circuit of four rounds of exercises), but one (FFTadapted) included preset rest intervals (three sets of 1 min after each completed round). Before and after the workouts, countermovement jump ability and blood lactate were measured. Heart rate (HR) and ratings of perceived exertion (RPE) were measured post-exercise. Results: For both the standard and adapted protocols, mean HR was 90% age-predicted maximum. Final RPE was also similar for both workouts (~15–15.5) and indicated a “hard” work intensity. Both FFTs took the same time to complete (~13 min). Furthermore, no significant differences were observed in jump ability between FFTs. In contrast, lactate (15.11 ± 3.64 vs. 13.48 ± 3.64 mmol·L−1, p < 0.05), measured 3 min post-exercise, was significantly lower in FFTadapted. Conclusions: In FFTadapted, there was a significant reduction in RPE and blood lactate concentrations after exercise, while there were no significant differences in either HR or jumping ability, compared to a FFT workout in RFT methodology.
1. Introduction
High-intensity functional training or Functional Fitness Training (FFT) is a new exercise modality prioritizing functional multi-joint movements, executed in multiple planes of movement, at high intensity and with different durations, that can be adapted to any level of fitness. FFT is also characterized by eliciting more muscle recruitment than more traditional exercise, as it consists of whole-body exercises (squats, deadlifts, cleans, snatches, pull ups, vertical jumps, etc.) executed at high intensity as a circuit [1]. FFT was first mentioned in the scientific literature in 2014 [2]. In this early work, Heinrich et al. (2014) [2] sought to find high-intensity training options that would save time over traditional moderate-intensity aerobic plus resistance training programs yet provoke a similar level of enjoyment and adherence to the exercise program. These findings could be the consequence of a self-selected intensity of exercise and also of the high variety of FFT exercises and training protocols [2]. FFT has often been compared to high-intensity interval training (HIIT). This last training modality is characterized by bouts of high-intensity work interspersed with very short rest periods, leading to fitness and health improvements in less time than weekly exercise recommendations [3,4]. However, as HIIT frequently involves aerobic training intervals, its health benefits may not be as great as those offered by a combined aerobic and resistance training program [5]. HIIT focuses on unimodal exercises such as running, pedaling, rowing, etc., completed as short high-intensity bouts to improve aerobic capacity and cardiorespiratory fitness without promoting significant muscle mass gains [6,7]. In contrast, FFT exercises are multimodal, whole-body functional exercises with universal motor recruitment patterns in multiple movement planes [2,8,9] conducted at high intensity as a circuit. These exercises pursue improvements in both muscle strength and cardiovascular fitness [10]. Another difference between HIIT and FFT is that the latter lacks prescribed rest intervals [1]. Many FFT workouts consist of completing a set number of repetitions in the shortest time possible (“rounds for time”) or completing within a set time frame as many repetitions as possible (“AMRAP”) of a set of exercises [1,11]. Hence, rest or recovery intervals are introduced by athletes “as needed” depending on their physical fitness level or the nature of the FFT workout. This means that a FFT workout may be completed with no rest periods at all. This contrasts with most HIIT protocols, in which both work and rest intervals are preset [1,6,7].
A few studies have compared the effects of HIIT and FFT on performance. For instance, Buckley et al. (2015) [12] compared a program consisting of a multimodal circuit, similar to FFT, featuring strength and metabolic-component exercises with a unimodal HIIT training program of rowing. Both groups completed 6 weeks of training 3 days per week, and each session consisted of 6 rounds of 60 s all-out intervals followed by 3 min of passive recovery. While both the multimodal circuit training program (MM-FFT) and rowing HIIT groups showed similar gains in aerobic threshold (13% vs. 12%), VO2max (7–5%), and power and anaerobic capacity (15% vs. 12% and 18% vs. 14%, respectively), only the MM-FFT group showed significant improvement in the kg lifted in a one repetition maximum (1RM) of squat, deadlift, and overhead press, as well as significant increases in broad jump muscular power and muscular endurance, documenting improved muscle performance in MM-FFT compared to rowing HIIT [12].
Hence, one of the characteristics of many FFT is the lack of preset rest intervals. In their study, Buckley et al. (2015) [12] prescribed rest intervals in the MM-FFT program to match work–rest times of both programs such that they differed only in the type of exercises conducted (multimodal vs. unimodal rowing). Another interesting focus of study would be to examine what happens when maintaining the same multimodal exercises in two FFT programs while modifying rest intervals, in which participants carry out the same number of repetitions with the same workload (same absolute training volume and absolute load but different density of training due to the different rest intervals). This could give rise to two situations: (1) Relative work intensities could differ as an absolute workload in one individual could represent different relative intensities depending on the velocity reached [13,14,15,16]. That is, with the introduction rest periods, repetitions could be performed at a higher velocity, representing a lower relative intensity for that absolute load. (2) Consequently, this could lead to different extents of effort and fatigue between the two FFTs, as rest intervals could translate to the recovery of predominant energy pathways in this type of exercise. In high-intensity intermittent exercise, high-energy phosphagen metabolism is a predominant system [17]. Among the mechanisms that give rise to fatigue is the inhibition of muscle contraction due to the build-up of final metabolic products [18] such as hydrogen ions, which reduce the pH, generating metabolic acidosis and inhibition of the enzyme phosphofructokinase (PFK). This reduction in PFK is accompanied by a decrease in the resynthesis of phosphocreatine [19] and the inhibition of glycolysis [20], with negative effects on muscle contraction. Thus, the introduction of rest intervals could increase the time of phosphocreatine reserve depletion and decrease metabolic acidosis. Phosphocreatine resynthesis involves a rapid first stage in which 70% of reserves are recovered in the first 30 s, and a second longer stage that lasts for around 3–5 min [21].
On the other hand, technically demanding exercises such as the squat, snatch, and clean and jerk create tension and overloading of joints in the shoulder and lumbar region [22]. Since there is evidence relating fatigue levels with modified movement biomechanics [23], introducing rest periods in FFT workouts could help reduce muscular fatigue and avoid biomechanical alterations that could result in injury. Therefore, the objective of the present study was to determine whether introducing rest intervals in a FFT workout could reduce the variables rate of perceived exertion (RPE), blood lactate concentration, heart rate (HR), and muscular fatigue compared to a standard “rounds for time (RFT)” FFT with no preset rest intervals. Our hypothesis is that there will be a reduction in the variables of RPE, HR, blood lactate concentration, and muscular fatigue in the FFT where mandatory recovery times are introduced.
2. Materials and Methods
2.1. Study Design
Participants were assigned to execute two similar FFT workouts in a random order separated by 1 week and conducted under the same ambient conditions, designated FFTstandard and FFTadapted. Both workouts used the “round for time” (RFT) methodology and consisted of the same sequence of exercises, which were completed in an all-out manner in the shortest time possible without any time restriction, whilst one of them (FFTadapted) had preset rest intervals (three sets of 1 min each). The study design was crossover such that in a given session half the participants completed the standard and the other half the adapted FFT protocol. No participants in the FFTstandard group coincided at the gym with those completing the FFTadapted protocol and vice-versa (Figure 1). In each FFT session, execution and data collection were done on an individual basis. Before and after the FFT workouts, jump ability (via a Countermovement Jump (CMJ) test) and blood lactate concentrations were determined. Post-FFT, both heart rate (HR) and RPE were measured.

Figure 1.
Study design.
2.2. Subjects
Participants were 25 healthy strength-trained subjects (22 men, 3 women) with age, height, weight, and body mass index (BMI) of 27.42 ± 5.09 years, 75.51 ± 9.35 kg, 175.05 ± 7.62 cm, and 24.54 ± 1.55 kg·m2−1, respectively. Both FFT workouts were completed by each participant in a gym equipped for this training modality. Inclusion criteria: (1) more than 18 months of strength training experience, (2) ability to correctly execute a power clean (men, 50 kg; women, 35 kg), and (3) ability to complete at least 15 successive pull-ups. Exclusion criteria: (1) use of medications or performance-enhancing drugs, (2) presence of cardiovascular, metabolic, neurologic, lung, or orthopedic disease, and (3) being an elite athlete.
Before the study outset, participants were informed about the study design and tests and exercises involved before obtaining their written informed consent. The study protocol was approved by the University’s ethics committee according to the tenets of the Helsinki declaration [24]. Once the informed consent form had been signed, subjects were instructed to arrive at the gym for each FFT session without having consumed any food or drinks containing alcohol, caffeine, or other stimulants in the previous 2 h. They were also requested to refrain from any physical exercise in the 24 h before the workout session. Sample size calculation was based on the results of a pilot study with the same study protocol involving 10 sport science students. The calculation of sample size was performed with α = 0.05 (5% chance of type I error) and 1−β = 0.80 (power 80%), and also applying the results provided by previous studies which used the same or a smaller sample size. A total of 25 strength-trained subjects was required for this study to detect differences between both experimental conditions.
Participants completed the two FFT sessions (standard and adapted) in the same time window (±2 h) and under the same ambient conditions (temperature between 18–20 °C). The second FFT session was completed 1 week after the first. The week before both FFT sessions, the participants did the same training, except the day before each FFT session that they rested.
2.3. Functional Fitness Training (FFT) Workout
Each session started with a general warm-up consisting of 5 min of rowing at a light–moderate intensity selected by each participant and 5 min of joint and stretching movements. This was followed by a specific FFT warm-up consisting of 6 reps each of burpees, box jumps, and bear crawls, 8 reps of slam ball (5–10 kg), 10 reps of in-and-out agility ladder, and 10 reps of sit-ups with a medicine ball on the chest (5–10 kg).
Once the general and specific warm ups were completed, subjects executed the FFTstandard and FFTadapted protocols in a random order (Figure 2). Both FFT workouts consisted of a circuit of four rounds of exercises. The first two rounds were: 6 power cleans (men, 50 kg; women, 35 kg), 10 slam balls (men, 20 kg; women, 15 kg), 14 wall ball shots (men, 9 kg; women, 7 kg), 18 dumbbell push-presses (men, 20 kg; women, 10 kg), and a 200 m run. The next two rounds were: 6 pull ups, 10 bodyweight squats, 14 dumbbell power snatches (men, 20 kg; women, 10 kg), 18 box jumps (men, 60 cm; women, 50 cm), and a 100 m run. In FFTadapted, after each completed round, subjects rested for 1 min, i.e., 3 × 1 min breaks in total. Rest intervals were 1 min and were timed by an observer using a stopwatch between sets 1 and 2, sets 2 and 3, and sets 3 and 4 (Figure 2). The objective was to ensure the recovery of the levels of phosphocreatine resynthesis to at least 70% of reserves in the first 30 s (Tomlin & Wenger, 2001), as well as reducing cardiovascular stress (heart rate (HR) decrease]. In addition, both FFT protocols were to be completed as quickly as possible, according to the RFT methodology.
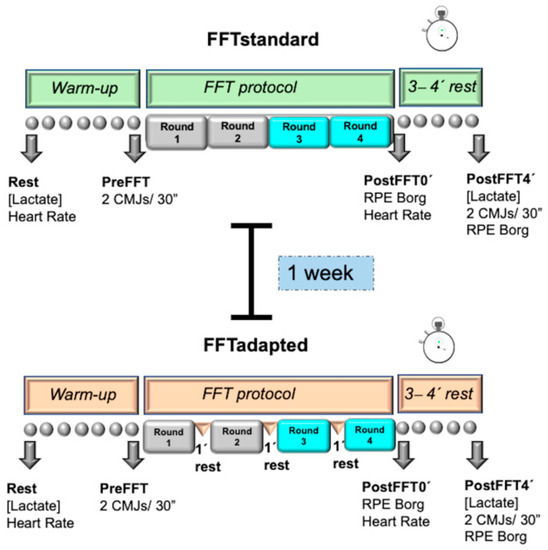
Figure 2.
FFTstandard and FFTadapted.
The exercises for the FFT workouts were based on the movement standards set by the International Functional Fitness Federation (iF3) (https://functionalfitness.sport/sport/movement-standards/ (accessed on 20 September 2021). This document describes the exercises included in iF3-authorized events in 2020–2021 in an effort to standardize athletic tasks. All exercises were performed as described in these movement standards. Two of the investigators with FFT experience supervised each participant to ensure the exercises were properly executed. Participants were energetically verbally encouraged during both FFTs.
2.4. Heart Rate
HR was monitored by telemetry (RS-800CX, Polar Electro OY; Kempele, Finland) to record HR mean, before starting the warm up in a state of rest and just after completing the exercise.
2.5. Blood Lactate
Blood samples (5 µL) were extracted through finger pricks before and 3 min after the end of each FFT workout. Lactate concentrations were determined in a portable analyzer Lactate Pro LT-1710 (Arkray Factory Inc., KDK Corporation, Siga, Japan) previously calibrated and validated [25,26].
2.6. Ratings of Perceived Exertion
RPE was recorded immediately after completing the workouts and at 3 min after FFT. To assess RPE, subjects were asked to describe how hard their workout felt overall [27] by grading their level of exertion on a Borg scale [28] from 6 to 20—from “very very light” to “maximum exertion”. To do this, each participant was requested to indicate with their finger, on a scale of size DIN-A3, how hard they found the workout. Participants were instructed to avoid verbal descriptions and to just point directly to the appropriate place on the scale with their finger.
2.7. Jump Ability
Jump ability was assessed via two CMJs executed with 30 s of rest between jumps [29] and mean values recorded for the following: jump height, maximum takeoff velocity (representing the maximum takeoff velocity of the feet from the floor), maximum force (representing the greatest force recorded during the jump), average power relative (representing the mean power recorded in each CMJ per kilogram of body weight), average power total (representing the mean power recorded in each CMJ for the whole weight of the subject), peak power relative (representing the highest power recorded in each CMJ per kilogram of body weight), and peak power total (representing the greatest power recorded in each CMJ for the whole weight of the subject). These variables were measured during the CMJ on a portable 92 × 92 × 12.5 cm force platform (Quattro Jump model 9290AD; Kistler Instruments, Winterthur, Switzerland). Jump height and power losses during an exercise session have been defined as indicators of mechanical and neuromuscular fatigue of the leg muscles [15]. Another variable recorded in this test was total CMJ duration. This was done by measuring the different vertical reaction forces during the CMJ (range 0–10 kN, sampling velocity 0.5 kHz) according to the method described by Maté-Muñoz et al. (2017) [30]. Jump tests were performed by each participant before and 4 min after the FFTstandard and FFTadapted workouts.
2.8. Statistical Analysis
The normal distribution of the data was first checked using the Shapiro–Wilk test. A two-way ANOVA with repeated measures—protocols × measures (FFTstandard and FFTadapted × Pre/Min 0 post-exercise and Post/Min 3 post-exercise)—was conducted to compare the effects of the two experimental conditions (FFTstandard and FFTadapted). When appropriate, Greenhouse–Geisser probability levels were used to adjust for sphericity, and Bonferroni adjustments were used to control for multiple post-hoc comparisons.
To detect differences between FFTs, the t test for related measures was used. All data are expressed as means, standard deviations (SD), and their 95% confidence intervals (CI). In addition, we determined the effect size, known as partial eta-squared (ηp2), which was classified into trivial (ηp2 ≤ 0.01), small (0.01 ≤ ηp2 < 0.06), moderate (0.06 ≤ ηp2 < 0.14), or large (ηp2 ≥ 0.14) [31], along with the statistical power (SP). Percentage improvements were calculated using the following equation: post − pre/pre × 100. The level of significance was set to p < 0.05. All statistical tests were performed using the package SPSS version 25.0 (SPSS, Chicago, IL, USA).
3. Results
All participants completed the protocols fully. Our results indicated no significant differences in the time employed to complete the standard and adapted FFT workouts (FFTstandard = 12.45 ± 2.97 min, FFTadapted = 12.89 ± 2.45 min, p > 0.05), including three sets of 1 min rest time and exercise time in FFTadapted. Neither were significant differences detected between groups in HR (p > 0.05). Both mean HR values indicated high-intensity exercise (FFTstandard = 172 ± 10 bpm, FFTadapted = 171 ± 8 bpm), as both were 90% of age-predicted HR during the workouts and above 95% at the end (FFTstandard = 182 ± 8 bpm, FFTadapted = 181 ± 6 bpm) [32].
In the two-way repeated measures ANOVA (Table 1), significant differences in blood lactate were detected for the factor Time, i.e., between time points (F(1,24) = 363.75, p = 0.000, ηp2 = 0.938, SP = 1.000); the factor Group, i.e., between the two FFT groups (F(1,24) = 5.314, p = 0.030, ηp2 = 0.181, SP = 0.600); and for the interaction Time × Group (F(1,24) = 7.769, p = 0.010, ηp2 = 0.245, SP = 0.762). Using the Bonferroni adjustment to control for multiple post-hoc comparisons for the blood lactate data indicated a significantly lower lactate level (by more than 10%) post-exercise in FFTadapted (p = 0.015).

Table 1.
Cardiometabolic variables and perceived exertion recorded in the standard and adapted FFT workouts.
Heart rate showed differences only for Time (F(1,24) = 4270.025, p = 0.000, ηp2 = 0.994, SP = 1.000), and not for Group (F(1,24) = 0.032, p = 0.860, ηp2 = 0.001, SP = 0.032) or Time × Group (F(1,24) = 4.014, p = 0.057, ηp2 = 0.143, SP = 0.485). RPE scores did differ significantly for Time (F(1,24) = 87.377, p = 0.000, ηp2 = 0.785, SP = 1.000), Group (F(1,24) = 8.254, p = 0.008, ηp2 = 0.256, SP = 0.787), and Time × Group (F(1,24) = 4.240, p = 0.051, ηp2 = 0.150, SP = 0.507). Multiple post-hoc comparisons detected significant differences between protocols 3 min after exercise (p = 0.003) (Table 1).
When we compared jump ability between the FFT workouts (Table 2), a significant difference was observed in jump height for Time (F(1,24) = 22.010, p = 0.000, ηp2 = 0.478, SP = 0.994), but not Group (F(1,24) = 0.858, p = 0.363, ηp2 = 0.035, SP = 0.144) or Time × Group (F(1,24) = 0.634, p = 0.434, ηp2 = 0.026, SP = 0.119). Significant differences in maximum takeoff velocity were also noted for Time (F(1,24) = 15.010, p = 0.001, ηp2 = 0.385, SP = 0.960), but not Group (F(1,24) = 0.951, p = 0.339, ηp2 = 0.038, SP = 0.155) or Time × Group (F(1,24) = 1.593, p = 0.219, ηp2 = 0.062, SP = 0.228).
Table 2.
Jump ability-related variables recorded pre- and post-exercise in the standard and adapted FFT groups.
Significant differences in average power relative were observed for Time (F(1,24) = 27.299, p = 0.000, ηp2 = 0.532, SP = 0.999) and Group (F(1,24) = 4.373, p = 0.047, ηp2 = 0.154, SP = 0.519), but not Time × Group (F(1,24) = 0.088, p = 0.769, ηp2 = 0.004, SP = 0.059).
The same was observed for average power total and peak power relative, with differences observed for Time (F(1,24) = 24.718, p = 0.000, ηp2 = 0.507, SP = 0.997 and F(1,24) = 4.809, p = 0.038, ηp2 = 0.167, SP = 0.558, respectively), but not Group (F(1,24) = 1.051, p = 0.316, ηp2 = 0.042, SP = 0.166 and F(1,24) = 4.056, p = 0.055, ηp2 = 0.145, SP = 0.489, respectively) or Time × Group (F(1,24) = 0.068, p = 0.796, ηp2 = 0.003, SP = 0.057 and F(1,24) = 0.045, p = 0.835, ηp2 = 0.002, SP = 0.055, respectively).
In contrast, no significant differences were observed in maximal strength, peak power total, or total jump duration for Time (F(1,24) = 0.036, p = 0.850, ηp2 = 0.002, SP = 0.054; F(1,24) = 3.928, p = 0.059, ηp2 = 0.0141, SP = 0.477; and F(1,24) = 1.038, p = 0.318, ηp2 = 0.041, SP = 0.165, respectively), Group (F(1,24) = 0.468, p = 0.501, ηp2 = 0.019, SP = 0.101; F(1,24) = 0.896, p = 0.353, ηp2 = 0.036, SP = 0.149; and F(1,24) = 3.102, p = 0.091, ηp2 = 0.114, SP = 0.394, respectively), or Time × Group (F(1,24) = 0.447, p = 0.510, ηp2 = 0.018, SP = 0.098; F(1,24) = 0.117, p = 0.736, ηp2 = 0.005, SP = 0.062; and F(1,24) = 2.256, p = 0.146, ηp2 = 0.086, SP = 0.303, respectively).
4. Discussion
In this study, we compared a standard FFT workout with RFT methodology and one including the same exercises in which subjects rested for 1 min after each round (three breaks in total). In both protocols, exercise repetitions had no time limit; rather, each individual conducted all exercises as quickly as possible but at a pace set by themselves.
Having analyzed all the data obtained, our study’s most significant findings were as follows: (1) cardiorespiratory intensities of both FFT protocols measured just after their completion were both above 95% age-predicted HR and no significant differences were observed in RPE post-exercise (~15–15.5), which was considered “hard”; (2) similar mean HR, equivalent to 90% age-predicted HR, and similar workout durations (~13 min) were observed in the standard and adapted FFT groups; (3) jump ability post-exercise was significantly reduced in both FFT groups; (4) at 3 min post-exercise, blood lactate levels were high in both FFTs (>13 mmol·L−1), although these levels were significantly lower in FFTadapted; and (5) RPE 3 min after the end of each FFT workout was “moderate”, although significantly reduced in FFTadapted.
In addition, no differences were observed in any of the CMJ jump variables between the two groups. Considering the CMJ test quantifies neuromuscular fatigue through several mechanical variables [33,34], we could argue that both protocols lead to a lowered capacity of the muscles to generate strength regardless of rest intervals. It is likely that the intensity of effort and duration of each workout will give rise to structural damage in tendons, compromising jump capacity [30,35,36,37] and leading to a feeling of fatigue and impaired muscle response in the individual. These jump test data are in agreement with those reported in the literature. In our FFTstandard group, a significant reduction of 6.8% in jump height was observed, which is similar to the findings of a FFT study after two workouts of the day (WODs)—“Cindy” (−6.5%) and “Power clean” (−7.4%) [30]. In contrast, in the metabolic conditioning WOD (8 sets × 20 skip rope double-unders/10 s rest), jump height loss was only −3.6% [30]. Given the rest intervals established between exercise sets, these data could resemble those observed in our FFTadapted protocol (−4.5%), and effectively, height losses were lower than those of the other FFT WODs. Maximum takeoff velocity losses were −2.4% in FFTstandard and −1.6% in FFTadapted. These losses in the standard FFT are similar to those of the Cindy and power clean (−2.7% and −3.1%, respectively) WODs of the study by Maté-Muñoz et al. (2017) [30], and our adapted FFT losses are similar to that of the skip rope double-unders WOD (−1.2%). For average power, we recorded a value of −4% for FFTstandard, which is similar to that of the Cindy WOD (~−4%), although there was a greater jump height loss in the power clean WOD (−7.35%). In the FFTadapted group, average power loss was −3.3%, which is slightly higher than that reported for the skip rope double-unders WOD with rest intervals (~−2%). In another study in which jump ability was examined in the FFT WODs Cindy, power clean, and skip rope double-unders [38], similar results were obtained to those observed here and those of [30], with the exception of mean velocity in the Cindy WOD (−13.8%) and average power in the power clean WOD (~−8%). Accordingly, given the differences between the FFT exercise protocols and FFT WODs along with their durations, jump capacity losses were similar.
If we examine mean HRs recorded across all FFT WODs—178 bpm (92.5% HRmax) for Cindy and double-unders and 172 bpm (89% HRmax) for power clean, these were all around or above 90% age-predicted HR [38], and reported blood lactate levels were 10–12 mmol·L−1 [30,38]. In another study, Fernández-Fernández et al. (2015) [39] reported an HRs of 182 bpm (97% HRmax) and blood lactate concentrations of 14.5 mmol·L−1. Another recent study by Toledo et al. (2021) [40] documented mean HR values in two different types of WODs (RFT and AMRAP) of 91.7% and 91.4% HRmax, respectively, and blood lactate concentrations greater than 14 mmol·L−1. This means that our FFT results were similar in terms of the mean HR of participants (~90% age-predicted HR), and blood lactate levels were slightly higher (13.5–15 mmol·L−1). These blood lactate values are considered very high for this type of population, indicating a high anaerobic output and representing an important physiological indicator to determine the best FFT training schedule [40]. Hence, beyond an intensity of 90% age-predicted heart rate sustained over time in this type of FFT protocol characterized by being multimodal and eliciting blood lactate levels above 10 mmol·L−1, it seems that jump loss values coincide. Furthermore, it seems that having set rest intervals in FFT and FFT workouts, regardless of their length (1 min or 10 s, respectively), reduces jump capacity loss in a similar way, as reflected in different studies, although with no statistical significance. Perhaps another way of looking at this is that in both studies, the work–rest ratio for planned exercise is similar and gives rise to similar effects in terms of jump height loss. In addition, both the standard and adapted FFT workouts gave rise to a similar jump capacity reduction, which coincided with significant reduced perceived exertion 3 min after completing the workouts (~−19% FFTstandard, ~−24% FFTadapted).
The lower RPE observed in FFTadapted compared to FFTstandard (11.4 ± 2.1 vs. 12.6 ± 2.4, respectively) could mean the individual perceives a lower effort, as while neither the final HR nor mean HR were significantly affected, the latter was significantly lower in the rest periods. Several studies that have analyzed HR recovery during HIIT have shown HR decreases of ~30 bpm [41] and between 39 and 57 bpm [42].
Three minutes after the workouts, blood lactate levels were lower by 1.6 mmol·L−1 (~11%) in FFTadapted. The 11% lower blood lactate recorded in FFTadapted could evoke a reduced feeling of exertion at the general body level. In both our FFTs, blood lactate concentrations were elevated (>13 mmol·L−1). This is likely the outcome of impaired muscle performance after the two FFT protocols, as the buildup of lactate in the blood or muscle is a suitable indirect marker of intramuscular acidosis [43], which hinders muscle contraction and metabolic processes [44] (Cairns, 2006). However, we detected significantly higher lactate values in FFTstandard (~11%), possibly because of a greater degree of effort and muscular fatigue. This greater effort could be explained by a lack of recovery of energy systems owing to the lack of preset rest periods.
As both FFTs were similar in their duration and number of repetitions of each exercise, and had the same absolute load (kg), this means any differences observed could likely be explained by the different rest intervals and velocity at which repetitions were executed. When participants completed FFTstandard, their objective was to do this in the shortest time possible (rounds for time approach). This approach, used in many FFT protocols, allows subjects to self-regulate their energy expenditure to complete the exercise as quickly as possible. This means that the individual will set the work pace and decide whether or not to take breaks and thus dosify their efforts. Accordingly, the number of breaks taken and time rested varied widely in our FFTstandard group. With the objective to maintain the ecological validity of the study, we opted for the RFT approach to FFTstandard, as commonly used in many fitness centers around the world. Thus, we were able to observe that many participants did not take breaks, or took minimal breaks (a few seconds) between repetitions. Several studies have shown that for a given absolute load (kg), subjects can show different velocities, meaning that this load can represent a different relative intensity (%) depending on the velocity reached by each subject in each exercise [13,14,15,16]. Thus, it could be that when the participants executed FFTstandard, because of the scarce rest intervals taken, execution velocities were reduced. This gives rise to a greater extent of fatigue, making the subject apply less force (N) on that load and thereby reducing the net force value. However, subjects taking three 1 min breaks could attain greater execution velocities with the same load, reducing fatigue and allowing the recovery of neuromuscular capacity to apply more force, and were thus able to complete the same number of repetitions in less time. This would be due to the recovery of over 70% of phosphocreatine levels in each minute of rest [21]), thereby reducing metabolic acidosis due to a lower glycolytic rate. This reasoning is what probably led to significantly reduced blood lactate levels when completing FFTadapted (FFTadapted = 13.5, FFTstandard = 15 mmol·L−1). In this way, the duration of FFTadapted could be similar to that of FFTstandard.
According to these findings, we would have to ask ourselves whether executing a FFT without controlling rest interval duration really has any benefits, or whether the greater effort and fatigue could modify the biomechanics of movement leading to injury [23]. Many of the FFT exercises are technically demanding, generating tension and overloading of the shoulder and lumbar region [22]. In the present study, the durations of both FFTs were almost identical, meaning that the velocity of exercise execution was faster in FFTadapted. This indicates that exercises such as the power clean or snatch, which require high power levels [45], are probably executed with greater technical efficacy. Hence, the introduction of pre-established, controlled rest intervals could be recommended to guarantee an adequate intensity level, less fatigue during exercise performance, and reduced risk of injury. High blood lactate levels (>16 mmol·L−1) [28,46] have been described after completing FFT workouts, which has been linked to situations of extreme fatigue. Many studies have identified situations of rhabdomyolysis related to this type of high-intensity effort [47,48,49]. Hence, it is likely that all-out training through FFT tactics such as AMRAP, RFT, or EMON (every minute on the minute) could have adverse health impacts [11]. In a recent study, Alsamir Tibana et al. (2019) [46] tried to determine whether self-regulation of training intensity based on RPE is a reliable method to control work intensity during metabolic conditioning sessions of FFT. To this end, a session was completed based on AMRAP under two different conditions: (1) all-out or (2) self-regulation of intensity based on an RPE of 6 (hard) on the Borg CR-scale. Their findings indicated significantly reduced RPE and blood lactate levels at all time points when exercise intensity was self-regulated [46]. More work is needed to address the impacts of incorporating pre-established recovery times in these types of methods (RFT, AMRAP, EMON) to ensure an adequate balance between intensity and fatigue that will reduce the risk of injury. Furthermore, to address a limitation of this work, it would be interesting to be able to measure systolic and diastolic blood pressure before and after the FFT session in this type of study. In addition, due to the high intensity of exercise in this type of FFT session, an exercise tolerance test to rule out cardiovascular abnormalities and a previous blood profile of each participant would be interesting to perform to properly categorize the sample.
5. Conclusions
With both FFT protocols, high cardiorespiratory intensity (above 95% age-predicted HR) and RPE (~15–15.5) levels were reached just after exercise, with a significant reduction in RPE 3 min after exercise, while there were no significant differences in HR. The durations of both FFTs were practically the same, even though FFTadapted had three preset 1-min breaks. Accordingly, it could be that the effort needed for FFTstandard was greater, which is consistent with the significantly higher blood lactate concentration observed compared with FFTadapted. However, while no significant differences in muscle fatigue were observed between the two FFTs, likely because this variable was measured using mechanical variables, a lower % jump capacity loss was observed for FFTadapted.
Author Contributions
J.H.-L., E.C.-P., P.G.-F. and J.L.M.-M. conceived and designed the experiments; T.F.-R., J.G.-P., Á.O.-C., M.d.C.L.-E., A.M.C.-M., F.d.J.-F., M.V.G.-C., J.H.-L., E.C.-P., J.L.M.-M. and P.G.-F. performed the experiments; J.H.-L., M.d.C.L.-E., J.L.M.-M. and P.G.-F. analyzed the data; T.F.-R., J.G.-P., Á.O.-C., M.d.C.L.-E., A.M.C.-M., F.d.J.-F. and M.V.G.-C. contributed reagents/materials/analysis tools; J.H.-L., E.C.-P., P.G.-F. and J.L.M.-M. wrote the paper. All authors have read and agreed to the published version of the manuscript.
Funding
This research received no external funding.
Institutional Review Board Statement
The study protocol was approved by the University’s ethics committee according to the tenets of the Helsinki declaration.
Informed Consent Statement
Informed consent was obtained from all subjects involved in the study.
Conflicts of Interest
The authors declare no conflict of interest.
References
- Feito, Y.; Heinrich, K.M.; Butcher, S.J.; Poston, W.S.C. High-intensity functional training (HIFT): Definition and research implications for improved fitness. Sports 2018, 6, 76. [Google Scholar] [CrossRef] [PubMed] [Green Version]
- Heinrich, K.M.; Patel, P.M.; O’Neal, J.L.; Heinrich, B.S. High-intensity compared to moderate-intensity training for exercise initiation, enjoyment, adherence, and intentions: An intervention study. BMC Public Health 2014, 14, 1–6. [Google Scholar] [CrossRef] [Green Version]
- Babraj, J.A.; Vollaard, N.B.; Keast, C.; Guppy, F.M.; Cottrell, G.; Timmons, J.A. Extremely short duration high intensity interval training substantially improves insulin action in young healthy males. BMC Endocr. Disord. 2009, 9, 1–8. [Google Scholar] [CrossRef] [PubMed] [Green Version]
- Burgomaster, K.A.; Howarth, K.R.; Phillips, S.M.; Rakobowchuk, M.; MacDonald, M.J.; McGee, S.L.; Gibala, M.J. Similar metabolic adaptations during exercise after low volume sprint interval and traditional endurance training in humans. J. Physiol. 2008, 586, 151–160. [Google Scholar] [CrossRef]
- Ho, S.S.; Dhaliwal, S.S.; Hills, A.P.; Pal, S. The effect of 12 weeks of aerobic, resistance or combination exercise training on cardiovascular risk factors in the overweight and obese in a randomized trial. BMC Public Health 2012, 12, 1–10. [Google Scholar] [CrossRef] [PubMed] [Green Version]
- Nybo, L.; Sundstrup, E.; Jakobsen, M.D.; Mohr, M.; Hornstrup, T.; Simonsen, L.; Aagaard, P. High-intensity training versus traditional exercise interventions for promoting health. Med. Sci. Sports Exerc. 2010, 42, 1951–1958. [Google Scholar] [CrossRef] [PubMed] [Green Version]
- Gibala, M.J.; Little, J.P.; MacDonald, M.J.; Hawley, J.A. Physiological adaptations to low-volume, high-intensity interval training in health and disease. J. Physiol. 2012, 590, 1077–1084. [Google Scholar] [CrossRef]
- Heinrich, K.M.; Spencer, V.; Fehl, N.; Carlos Poston, W.S. Mission essential fitness: Comparison of functional circuit training to traditional Army physical training for active duty military. Mil. Med. 2012, 177, 1125–1130. [Google Scholar] [CrossRef] [Green Version]
- Poston, W.S.; Haddock, C.K.; Heinrich, K.M.; Jahnke, S.A.; Jitnarin, N.; Batchelor, D.B. Is high-intensity functional training (HIFT)/CrossFit safe for military fitness training? Mil. Med. 2016, 181, 627–637. [Google Scholar] [CrossRef] [PubMed] [Green Version]
- Brisebois, M.F.; Rigby, B.R.; Nichols, D.L. Department. Physiological and Fitness Adaptations after Eight Weeks of High-Intensity Functional Training in Physically Inactive Adults. Sports 2018, 6, 146. [Google Scholar] [CrossRef] [PubMed] [Green Version]
- Silva-Grigoletto, M.E.D.; Heredia-Elvar, J.R.; Oliveira, L.A.d. “Cross” modalities: Are the AMRAP, RFT and EMOM models applicable to health? Rev. Bras. Cineantropom. Desempenho. Hum. 2020, 22, e75400. [Google Scholar] [CrossRef]
- Buckley, S.; Knapp, K.; Lackie, A.; Lewry, C.; Horvey, K.; Benko, C.; Butcher, S. Multimodal high-intensity interval training increases muscle function and metabolic performance in females. Appl. Physiol. Nutr. Metab. 2015, 40, 1157–1162. [Google Scholar] [CrossRef] [Green Version]
- González-Badillo, J.G.; Sánchez-Medina, L. Movement velocity as a measure of loading intensity in resistance training. Int. J. Sports Med. 2010, 31, 347–352. [Google Scholar] [CrossRef]
- Sánchez-Medina, L.; González-Badillo, J.; Perez, C.; Pallarés, J. Velocity-and power-load relationships of the bench pull vs. bench press exercises. Int. J. Sports Med. 2014, 35, 209–216. [Google Scholar] [CrossRef] [PubMed]
- Sánchez-Medina, L.; Pallarés, J.G.; Pérez, C.E.; Morán-Navarro, R.; González-Badillo, J.J. Estimation of relative load from bar velocity in the full back squat exercise. Sports Med. Int. Open 2017, 1, E80. [Google Scholar] [CrossRef] [PubMed]
- Sánchez-Moreno, M.; Rodríguez-Rosell, D.; Pareja-Blanco, F.; Mora-Custodio, R.; González-Badillo, J.J. Movement velocity as indicator of relative intensity and level of effort attained during the set in pull-up exercise. Int. J. Sports Physiol. Perform. 2017, 12, 1378–1384. [Google Scholar] [CrossRef] [PubMed]
- Cooper, R.; Naclerio, F.; Allgrove, J.; Jimenez, A. Creatine supplementation with specific view to exercise/sports performance: An update. J. Int. Soc. Sports Nutr. 2012, 9, 1–11. [Google Scholar] [CrossRef] [PubMed] [Green Version]
- McCully, K.K.; Authier, B.; Olive, J.; Clark, B.J. Muscle fatigue: The role of metabolism. Can. J. Appl. Physiol. 2002, 27, 70–82. [Google Scholar] [CrossRef]
- Sahlin, K.; Harris, R.C. The creatine kinase reaction: A simple reaction with functional complexity. Amino Acids 2011, 40, 1363–1367. [Google Scholar] [CrossRef] [PubMed]
- Trivedi, B.; Danforth, W.H. Effect of pH on the kinetics of frog muscle phosphofructokinase. J. Biol. Chem. 1966, 241, 4110–4114. [Google Scholar] [CrossRef]
- Tomlin, D.L.; Wenger, H.A. The relationship between aerobic fitness and recovery from high intensity intermittent exercise. Sports Med. 2001, 31, 1–11. [Google Scholar] [CrossRef] [PubMed]
- Hak, P.T.; Hodzovic, E.; Hickey, B. The nature and prevalence of injury during CrossFit training. J. Strength. Cond. Res. 2013. online ahead of print. [Google Scholar] [CrossRef] [PubMed]
- Weisenthal, B.M.; Beck, C.A.; Maloney, M.D.; DeHaven, K.E.; Giordano, B.D. Injury rate and patterns among CrossFit athletes. Orthop. J. Sports Med. 2014, 2. [Google Scholar] [CrossRef] [PubMed]
- World Medical Association. World Medical Association Declaration of Helsinki: Ethical principles for medical research involving human subjects. JAMA 2013, 310, 2191–2194. [Google Scholar] [CrossRef] [PubMed] [Green Version]
- McNaughton, L.; Thompson, D.; Philips, G.; Backx, K.; Crickmore, L. A comparison of the lactate Pro, Accusport, Analox GM7 and Kodak Ektachem lactate analysers in normal, hot and humid conditions. Int. J. Sports Med. 2002, 23, 130–135. [Google Scholar] [CrossRef]
- McLean, S.; Norris, S.; Smith, D. Comparison of the Lactate Pro and the YSI 1500 Sport Blood Lactate Analyzers. Int. J. Appl. Sports Sci. 2004, 16, 22–30. [Google Scholar]
- Tibana, R.A.; De Sousa, N.M.F.; Cunha, G.V.; Prestes, J.; Fett, C.; Gabbett, T.J.; Voltarelli, F.A. Validity of session rating perceived exertion method for quantifying internal training load during high-intensity functional training. Sports 2018, 6, 68. [Google Scholar] [CrossRef] [Green Version]
- Borg, G. Perceived exertion as an indicator of somatic stress. Scand. J. Rehabil. Med. 1970, 2, 92–98. [Google Scholar]
- Gorostiaga, E.M.; Asiáin, X.; Izquierdo, M.; Postigo, A.; Aguado, R.; Alonso, J.M.; Ibáñez, J. Vertical jump performance and blood ammonia and lactate levels during typical training sessions in elite 400-m runners. J. Strength. Cond. Res 2010, 24, 1138–1149. [Google Scholar] [CrossRef] [Green Version]
- Maté-Muñoz, J.L.; Lougedo, J.H.; Barba, M.; García-Fernández, P.; Garnacho-Castaño, M.V.; Domínguez, R. Muscular fatigue in response to different modalities of CrossFit sessions. PLoS ONE 2017, 12, e0181855. [Google Scholar] [CrossRef] [Green Version]
- Field, A. Discovering Statistics using IBM SPSS Statistics, 4th ed.; Sage: London, UK, 2013; pp. 473–474. [Google Scholar]
- Tanaka, H.; Monahan, K.D.; Seals, D.R. Age-predicted maximal heart rate revisited. J. Am. Coll. Cardiol. 2001, 37, 153–156. [Google Scholar] [CrossRef] [Green Version]
- Garnacho-Castaño, M.V.; Domínguez, R.; Ruiz-Solano, P.; Maté-Muñoz, J.L. Acute physiological and mechanical responses during resistance exercise at the lactate threshold intensity. J. Strength. Cond. Res. 2015, 29, 2867–2873. [Google Scholar] [CrossRef]
- Sanchez-Medina, L.; González-Badillo, J.J. Velocity loss as an indicator of neuromuscular fatigue during resistance training. Med. Sci. Sports Exerc. 2011, 43, 1725–1734. [Google Scholar] [CrossRef]
- Horita, T.; Komi, P.; Hämäläinen, I.; Avela, J. Exhausting stretch-shortening cycle (SSC) exercise causes greater impairment in SSC performance than in pure concentric performance. Eur. J. Appl. Physiol. 2003, 88, 527–534. [Google Scholar] [CrossRef]
- Ishikawa, M.; Dousset, E.; Avela, J.; Kyröläinen, H.; Kallio, J.; Linnamo, V.; Komi, P. Changes in the soleus muscle architecture after exhausting stretch-shortening cycle exercise in humans. Eur. J. Appl. Physiol. 2006, 97, 298–306. [Google Scholar] [CrossRef]
- Ishikawa, M.; Komi, P.V.; Finni, T.; Kuitunen, S. Contribution of the tendinous tissue to force enhancement during stretch–shortening cycle exercise depends on the prestretch and concentric phase intensities. J. Electromyogr. Kinesiol. 2006, 16, 423–431. [Google Scholar] [CrossRef]
- Maté-Muñoz, J.L.; Lougedo, J.H.; Barba, M.; Cañuelo-Márquez, A.M.; Guodemar-Pérez, J.; García-Fernández, P.; Lozano-Estevan, M.C.; Alonso-Melero, R.; Sánchez-Calabuig, M.A.; Ruíz-López, M.; et al. Cardiometabolic and muscular fatigue responses to different crossfit® workouts. J. Sports Sci. Med. 2018, 17, 668. [Google Scholar]
- Fernández, J.F.; Solana, R.S.; Moya, D.; Marin, J.M.S.; Ramón, M.M. Acute physiological responses during crossfit® workouts. Eur. J. Hum. Mov. 2015, 35, 114–124. [Google Scholar]
- Toledo, R.; Dias, M.R.; Toledo, R.; Erotides, R.; Pinto, D.S.; Reis, V.M.; Novaes, J.S.; Vianna, J.M.; Heinrich, K.M. Comparison of Physiological Responses and Training Load between Different CrossFit® Workouts with Equalized Volume in Men and Women. Life 2021, 11, 586. [Google Scholar] [CrossRef] [PubMed]
- Andrade-Mayorga, O.; Mancilla, R.; Díaz, E.; Alvarez, C. Heart Rate During an Exercise Test and Acute High-intensity Interval Training in Type 2 Diabetes. Int. J. Sports Med. 2020, 41, 365–372. [Google Scholar] [CrossRef] [PubMed]
- Stöggl, T.L.; Björklund, G. High intensity interval training leads to greater improvements in acute heart rate recovery and anaerobic power as high volume low intensity training. Front. Physiol. 2017, 8, 562. [Google Scholar] [CrossRef] [Green Version]
- Robergs, R.A.; Ghiasvand, F.; Parker, D. Biochemistry of exercise-induced metabolic acidosis. Am. J. Physiol. Regul. Integr. Comp. Physiol. 2004, 287, R502–R516. [Google Scholar] [CrossRef] [PubMed]
- Cairns, S.P. Lactic acid and exercise performance. Sports Med. 2006, 36, 279–291. [Google Scholar] [CrossRef] [PubMed]
- González-Badillo, J.J.; Ribas, J. Bases de la Programación del Entrenamiento de Fuerza; INDE: Barcelona, Spain, 2002. [Google Scholar]
- Alsamir Tibana, R.; Manuel Frade de Sousa, N.; Prestes, J.; da Cunha Nascimento, D.; Ernesto, C.; Falk Neto, J.H.; Azevedo Voltarelli, F. Is perceived exertion a useful indicator of the metabolic and cardiovascular responses to a metabolic conditioning session of functional fitness? Sports 2019, 7, 161. [Google Scholar] [CrossRef] [PubMed] [Green Version]
- Tibana, R.A.; Sousa, N.M.F.d.; Cunha, G.V.; Prestes, J.; Navalta, J.W.; Voltarelli, F.A. Exertional Rhabdomyolysis after an extreme conditioning competition: A case report. Sports 2018, 6, 40. [Google Scholar] [CrossRef] [Green Version]
- Adhikari, P.; Hari, A.; Morel, L.; Bueno, Y. Exertional Rhabdomyolysis After CrossFit Exercise. Cureus 2021, 13, e12630. [Google Scholar]
- Hopkins, B.S.; Li, D.; Svet, M.; Kesavabhotla, K.; Dahdaleh, N.S. CrossFit and rhabdomyolysis: A case series of 11 patients presenting at a single academic institution. J. Sci. Med. Sport 2019, 22, 758–762. [Google Scholar] [CrossRef]
Publisher’s Note: MDPI stays neutral with regard to jurisdictional claims in published maps and institutional affiliations. |
© 2021 by the authors. Licensee MDPI, Basel, Switzerland. This article is an open access article distributed under the terms and conditions of the Creative Commons Attribution (CC BY) license (https://creativecommons.org/licenses/by/4.0/).